Supplementary Information
|
|
|
- Gyles Woods
- 5 years ago
- Views:
Transcription
1 Supplementary Information Notch deficiency decreases hepatic lipid accumulation by induction of fatty acid oxidation No-Joon Song,#, Ui Jeong Yun,#, Sunghee Yang, Chunyan Wu, Cho-Rong Seo, A-Ryeong Gwon,, Sang-Ha Baik, Yuri Choi, Bo Youn Choi, Bahn Gahee, Suji Kim, So-Mi Kwon, Jin Su Park, Seung Hyun Baek, Tae Joo Park, Keejung Yoon 6, Byung-Joon Kim, Mark P. Mattson 7, Sung-Joon Lee, Dong-Gyu Jo,, Kye Won Park, Department of Food Science and Biotechnology, Sungkyunkwan University, Korea. School of Pharmacy, Sungkyunkwan University, Korea. Department of Biotechnology, Graduate School of Life Sciences & Biotechnology, BK-PLUS program, Korea University, 6-7 Seoul Korea. Department of Internal Medicine, Graduate School of Medicine, Gachon University of Medicine and Science, School of Nano-Bioscience and Chemical Engineering, Ulsan National Institute of Science and Technology, 6 Department of Genetic Engineering, Sungkyunkwan University, Korea. 7 Laboratory of Neurosciences, National Institute on Aging Intramural Research Program, Baltimore, Maryland, USA # These authors contributed equally. Corresponding authors: Dong-Gyu Jo, PhD. School of Pharmacy, Sungkyunkwan University, Suwon -76, Korea. Phone: (+8) , jodg@skku.edu; Kye Won Park, PhD. Department of Food Science and Biotechnology Sungkyunkwan University, Suwon -76, Korea. Phone: (+8)--9-78, kwpark@skku.edu Supplementary Information: Figure S Figure S Figure S Figure S Figure S Figure S6 Figure S7 Figure S8 Original blots
2 A C Body weight (g) Insulin (pmol/l) B C7 C7 D C7 (g/day) C7 HFD ND (Weeks) Glucagon (pmol/l)..8. C7 Figure S. Body weight, food intake, insulin, and glucan levels in Notch insufficient mice. (A-C) Body weight (A), food intake (B), insulin (C), levels were not different in high fat diet fed (HFD) C7BL/6 mice (C7) and Notch antisense transgenic () mice. (D) Plasma glucagon level was decreased in mice (n= of each group). Statistically significant differences in the control normal chow fed C7BL/6 (C7-ND) and Notch antisense transgenic () mice or high fat diet fed C7BL/6 mice (C7-HFD) and high fat diet fed Notch antisense transgenic mice (-HFD) were determined using Student s t-test ( P <.).
3 Free fatty acid(ueq/l) ND HFD ND HFD C7 Figure S. Serum free fatty acid levels from normal diet (ND) or high fat diet fed (HFD) C7BL/6 mice (C7) and Notch antisense transgenic () mice were determined. Statistically significant differences in the control normal chow fed C7BL/6 (C7-ND) and Notch antisense transgenic () mice or high fat diet fed C7BL/6 mice (C7-HFD) and high fat diet fed Notch antisense transgenic mice (-HFD) were determined using Student s t-test ( P <.).
 and of HES was measured by western blot analysis.")
4 A DAPT DBZ HES B 8 6 EN GVP reporter DMSO DAPT DBZ Figure S. Notch inhibitors decrease Notch activation. (A) Western blot analysis of HES from DAPT and DBZ treated HepG cells. HepG cells were treated with Notch signaling inhibitors DAPT or DBZ ( µm) and of HES was measured by western blot analysis. (B) HepG cells transfected with the CSL luciferase reporter (notchspecific reporter) and an vector coding for ΔEN (γ-secretase cleavage sites fused to GAL-VP6) were treated with DAPT or DBZ ( µm) and luciferase activity was measured. Data are expressed as the means ± SEM. Statistically significant differences in gene was determined relative to the control by the Student s t-test ( P <.).
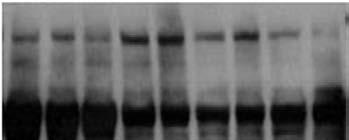
5 Kda C7 Acc Figure S. Western blot analysis of Acc protein in livers from control (C7) and Notch antisense transgenic () mice. Hepatic Acc protein levels were not different in high fat diet fed control and mice.
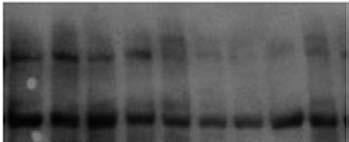
6 A Kda C7 Notch Normalized mrna Normalized mrna B... Pparα Acsl C7 mice Cpta Ucp P=.8 Figure S. Notch deficient mice induce of oxidative genes in epididymal white adipose tissues. (A) Reduced Notch in epididymal white adipose tissues from high fat diet fed C7BL/6 mice (C7) and Notch antisense transgenic () mice. Notch protein was measured by immunoblotting. (B) Oxidative genes including Pparα, Acsl, Cpta, and Ucp in epididymal fats of HFD control (C7BL/6) and mice were measured by real time PCR (n= of each group). Data shown represent the mean ± SEM. Statistically significant differences in gene was determined relative to the control (C7BL/6) mice by the Student s t- test ( P <.).
7 Normalized mrna Acot Nicd Acot Acsl Acsl Ucp Nicd Acox Acox Pparα Ucp Pparα pbp NICD pbp NICD pbp NICD pbp NICD pbp NICD pbp NICD T-L CHT/ T-L CHT/ T-L CHT/ Figure S6. Notch gain of function suppressed the of oxidative genes in preadipocytes. T-L and CHT/ preadipocytes were infected with retrovirus expressing NICD (pbp-nicd ) or virus harboring pbabe-puro (pbp) empty vector and stable cells were selected with puromycin ( µg/ml) for weeks. Gene in stable preadipocytes was measured by real time PCR. Data were expressed as mean ± SEM. Statistically significant differences in gene was determined relative to the control by the Student s t-test (p <.; p <.; p <.).
 CHT/ pbp- NICD (CHT/) Normalized mrna 8 6 Pparγ Cd6 6 (day) Normalized mrna B D Lipid accumulation pbp Fabp.")
8 Normalized mrna C A Lipid accumulation pbp Fabp... pbp pbp-nicd 6 (day) CHT/ pbp- NICD (CHT/) Normalized mrna 8 6 Pparγ Cd6 6 (day) Normalized mrna B D Lipid accumulation pbp Fabp.. T-L pbp pbp-nicd 6 (day) Normalized mrna 6 pbp- NICD (T-L) Pparγ Cd6 6 (day) pbp pbp-nicd pbp pbp-nicd Song et al., Fig S7
9 Figure S7. Notch gain of function increases lipid accumulation and induces of adipocyte markers during adipocyte differentiation of CHT/ and T-L cells. (A) CHT/ cells were infected pbabe-puro (pbp) or pbabe-nicd harboring retrovirus (pbp-nicd) and stable cells were selected with puromycin ( µg/ml) for week. Stable cells were induced into adipocytes and lipid accumulation on day 6 was assessed by Oil red O staining. (B) T- L cells were infected with pbabe-puro (pbp) or pbabe-nicd harboring retrovirus (pbp-nicd) and stable cells were selected with puromycin ( µg/ml) for week followed by adipocyte differentiation for 6 days. Stable cells were induced into adipocytes and lipid accumulation on day 6 was assessed by Oil red O staining. Gene was measured by real time PCR. (C,D) Stable cells were induced into adipocytes and lipid accumulation on day 6 was assessed by Oil red O staining followed quantification. Lipid accumulation was quantified by measuring the extracted Oil red O dye at nm. Data are expressed as the means ± SEM. Statistically significant differences in gene was determined relative to the control by the Student s t-test ( P <.; P <.; P <.).
10 Normalized mrna 6 Nicd ctrl NICD 8 Pparα Acsl Acot Acox 6 ctrl NICD ctrl NICD ctrl NICD ctrl NICD Figure S8. Notch gain of function suppressed the of oxidative genes in mature adipocytes. CHT/ preadipocytes were differentiated into mature adipocytes for 8 days and infected with lentivirus expressing NICD (NICD) or control plasmid. Gene in NICD and control cells was measured by real time PCR. Data were expressed as mean ± SEM. Statistically significant differences in gene was determined relative to the control by the Student s t-test (p <.).


11 Original blots Notch Fig. B p-irs- Fig. F Notch Fig. 6C p-akt Notch Fig A Akt
Effect of BI-1 on insulin resistance through regulation of CYP2E1
 Effect of BI-1 on insulin resistance through regulation of CYP2E1 Geum-Hwa Lee 1, Kyoung-Jin Oh 2, 3, Hyung-Ryong Kim 4, Hye-Sook Han 2, Hwa-Young Lee 1, Keun-Gyu Park 5, Ki-Hoan Nam 6, Seung-Hoi Koo 2
Supplementary Table 2. Plasma lipid profiles in wild type and mutant female mice submitted to a HFD for 12 weeks wt ERα -/- AF-1 0 AF-2 0
 Supplementary Table 1. List of specific primers used for gene expression analysis. Genes Primer forward Primer reverse Hprt GCAGTACAGCCCCAAAATGG AACAAAGTCTGGCCTGTATCCA Srebp-1c GGAAGCTGTCGGGGTAGCGTC CATGTCTTCAAATGTGCAATCCAT
GPR120 *** * * Liver BAT iwat ewat mwat Ileum Colon. UCP1 mrna ***
 a GPR120 GPR120 mrna/ppia mrna Arbitrary Units 150 100 50 Liver BAT iwat ewat mwat Ileum Colon b UCP1 mrna Fold induction 20 15 10 5 - camp camp SB202190 - - - H89 - - - - - GW7647 Supplementary Figure
18s AAACGGCTACCACATCCAAG CCTCCAATGGATCCTCGTTA. 36b4 GTTCTTGCCCATCAGCACC AGATGCAGCAGATCCGCAT. Acc1 AGCAGATCCGCAGCTTG ACCTCTGCTCGCTGAGTGC
 Supplementary Table 1. Quantitative PCR primer sequences Gene symbol Sequences (5 to 3 ) Forward Reverse 18s AAACGGCTACCACATCCAAG CCTCCAATGGATCCTCGTTA 36b4 GTTCTTGCCCATCAGCACC AGATGCAGCAGATCCGCAT Acc1
Supplemental Information. Increased 4E-BP1 Expression Protects. against Diet-Induced Obesity and Insulin. Resistance in Male Mice
 Cell Reports, Volume 16 Supplemental Information Increased 4E-BP1 Expression Protects against Diet-Induced Obesity and Insulin Resistance in Male Mice Shih-Yin Tsai, Ariana A. Rodriguez, Somasish G. Dastidar,
SUPPLEMENTARY INFORMATION
 DOI: 10.1038/ncb2211 a! mir-143! b! mir-103/107! let-7a! mir-144! mir-122a! mir-126-3p! mir-194! mir-27a! mir-30c! Figure S1 Northern blot analysis of mir-143 expression dependent on feeding conditions.
SUPPLEMENTARY INFORMATION
 DOI: 10.1038/ncb3461 In the format provided by the authors and unedited. Supplementary Figure 1 (associated to Figure 1). Cpeb4 gene-targeted mice develop liver steatosis. a, Immunoblot displaying CPEB4
Supplementary Information
 Supplementary Information GADD34-deficient mice develop obesity, nonalcoholic fatty liver disease, hepatic carcinoma and insulin resistance Naomi Nishio and Ken-ichi Isobe Department of Immunology, Nagoya
SUPPLEMENTARY INFORMATION
 doi: 1.138/nature7221 Brown fat selective genes 12 1 Control Q-RT-PCR (% of Control) 8 6 4 2 Ntrk3 Cox7a1 Cox8b Cox5b ATPase b2 ATPase f1a1 Sirt3 ERRα Elovl3/Cig3 PPARα Zic1 Supplementary Figure S1. stimulates
SUPPLEMENTARY DATA. Supplementary Table 1. Primer sequences for qrt-pcr
 Supplementary Table 1. Primer sequences for qrt-pcr Gene PRDM16 UCP1 PGC1α Dio2 Elovl3 Cidea Cox8b PPARγ AP2 mttfam CyCs Nampt NRF1 16s-rRNA Hexokinase 2, intron 9 β-actin Primer Sequences 5'-CCA CCA GCG
ACC ELOVL MCAD. CPT1α 1.5 *** 0.5. Reverbα *** *** 0.5. Fasted. Refed
 Supplementary Figure A 8 SREBPc 6 5 FASN ELOVL6.5.5.5 ACC.5.5 CLOCK.5.5 CRY.5.5 PPARα.5.5 ACSL CPTα.5.5.5.5 MCAD.5.5 PEPCK.5.5 G6Pase 5.5.5.5 BMAL.5.5 Reverbα.5.5 Reverbβ.5.5 PER.5.5 PER B Fasted Refed
Supplementary Figure 1. DJ-1 modulates ROS concentration in mouse skeletal muscle.
 Supplementary Figure 1. DJ-1 modulates ROS concentration in mouse skeletal muscle. (a) mrna levels of Dj1 measured by quantitative RT-PCR in soleus, gastrocnemius (Gastroc.) and extensor digitorum longus
Supplementary Materials for
 www.sciencesignaling.org/cgi/content/full/8/407/ra127/dc1 Supplementary Materials for Loss of FTO in adipose tissue decreases Angptl4 translation and alters triglyceride metabolism Chao-Yung Wang,* Shian-Sen
Supplementary Figure 1. DNA methylation of the adiponectin promoter R1, Pparg2, and Tnfa promoter in adipocytes is not affected by obesity.
 Supplementary Figure 1. DNA methylation of the adiponectin promoter R1, Pparg2, and Tnfa promoter in adipocytes is not affected by obesity. (a) Relative amounts of adiponectin, Ppar 2, C/ebp, and Tnf mrna
Supplementary Fig. 1 eif6 +/- mice show a reduction in white adipose tissue, blood lipids and normal glycogen synthesis. The cohort of the original
 Supplementary Fig. 1 eif6 +/- mice show a reduction in white adipose tissue, blood lipids and normal glycogen synthesis. The cohort of the original phenotypic screening was n=40. For specific tests, the
New Drug Development for Hepatic Insulin Resistance
 New Drug Development for Hepatic Insulin Resistance Innovative Drug Research Center for Metabolic and Inflammatory Disease College of Pharmacy Sang Geon Kim AMPK as an energy sensor, (A novel drug target
Supplementary Table 1. Metabolic parameters in GFP and OGT-treated mice
 Supplementary Table 1. Metabolic parameters in GFP and OGT-treated mice Fasted Refed GFP OGT GFP OGT Liver G6P (mmol/g) 0.03±0.01 0.04±0.02 0.60±0.04 0.42±0.10 A TGs (mg/g of liver) 20.08±5.17 16.29±0.8
A synergistic anti-obesity effect by a combination of capsinoids and cold temperature through the promotion of beige adipocyte biogenesis
 A synergistic anti-obesity effect by a combination of capsinoids and cold temperature through the promotion of beige adipocyte biogenesis Kana Ohyama, 1,2 Yoshihito Nogusa, 1 Kosaku Shinoda, 2 Katsuya
General Laboratory methods Plasma analysis: Gene Expression Analysis: Immunoblot analysis: Immunohistochemistry:
 General Laboratory methods Plasma analysis: Plasma insulin (Mercodia, Sweden), leptin (duoset, R&D Systems Europe, Abingdon, United Kingdom), IL-6, TNFα and adiponectin levels (Quantikine kits, R&D Systems
Curriculum Vitae. Dissertation Title M.S. Thesis: Regulation of Notch1 signaling by Runx2 during osteoblast differentiation.
 Curriculum Vitae Name: Eun-Jung Ann Education Mar.2009 : Ph.D. in Graduate School of Biological Sciences and Technology, Chonnam National University Mar.2007 Feb. 2009: M.S. in Graduate School of Biological
Doctoral Degree Program in Marine Biotechnology, College of Marine Sciences, Doctoral Degree Program in Marine Biotechnology, Academia Sinica, Taipei,
 Cyclooxygenase 2 facilitates dengue virus replication and serves as a potential target for developing antiviral agents Chun-Kuang Lin 1,2, Chin-Kai Tseng 3,4, Yu-Hsuan Wu 3,4, Chih-Chuang Liaw 1,5, Chun-
Figure S1. Reduction in glomerular mir-146a levels correlate with progression to higher albuminuria in diabetic patients.
 Supplementary Materials Supplementary Figures Figure S1. Reduction in glomerular mir-146a levels correlate with progression to higher albuminuria in diabetic patients. Figure S2. Expression level of podocyte
Supporting Information Table of content
 Supporting Information Table of content Supporting Information Fig. S1 Supporting Information Fig. S2 Supporting Information Fig. S3 Supporting Information Fig. S4 Supporting Information Fig. S5 Supporting
Serum Amyloid A3 Gene Expression in Adipocytes is an Indicator. of the Interaction with Macrophages
 Serum Amyloid A3 Gene Expression in Adipocytes is an Indicator of the Interaction with Macrophages Yohei Sanada, Takafumi Yamamoto, Rika Satake, Akiko Yamashita, Sumire Kanai, Norihisa Kato, Fons AJ van
control kda ATGL ATGLi HSL 82 GAPDH * ** *** WT/cTg WT/cTg ATGLi AKO/cTg AKO/cTg ATGLi WT/cTg WT/cTg ATGLi AKO/cTg AKO/cTg ATGLi iwat gwat ibat
 body weight (g) tissue weights (mg) ATGL protein expression (relative to GAPDH) HSL protein expression (relative to GAPDH) ### # # kda ATGL 55 HSL 82 GAPDH 37 2.5 2. 1.5 1..5 2. 1.5 1..5.. Supplementary
SUPPLEMENTARY INFORMATION
 doi:10.1038/nature12652 Supplementary Figure 1. PRDM16 interacts with endogenous EHMT1 in brown adipocytes. Immunoprecipitation of PRDM16 complex by flag antibody (M2) followed by Western blot analysis
Supplemental Information. Human Carboxylesterase 2 Reverses. Obesity-Induced Diacylglycerol Accumulation. and Glucose Intolerance
 Cell Reports, Volume 18 Supplemental Information Human Carboxylesterase 2 Reverses Obesity-Induced Diacylglycerol Accumulation and Glucose Intolerance Maxwell A. Ruby, Julie Massart, Devon M. Hunerdosse,
2.5. AMPK activity
 Supplement Fig. A 3 B phos-ampk 2.5 * Control AICAR AMPK AMPK activity (Absorbance at 45 nm) 2.5.5 Control AICAR Supplement Fig. Effects of AICAR on AMPK activation in macrophages. J774. macrophages were
File Name: Supplementary Information Description: Supplementary Figures and Supplementary Table. File Name: Peer Review File Description:
 File Name: Supplementary Information Description: Supplementary Figures and Supplementary Table File Name: Peer Review File Description: Supplementary Table 1 Primers and taqman probes used were the following:
HIV VPR alters fat metabolism. Dorothy E Lewis PhD/Ashok Balasubramanyam MD
 HIV VPR alters fat metabolism Dorothy E Lewis PhD/Ashok Balasubramanyam MD Old Dogma for HIV associated lipodystrophy Differentiation Block (PI) Lipoatrophy Apoptosis (NRTI) Stem cell Preadipocyte Adipocyte
Supplemental Material:
 Supplemental Material: MATERIALS AND METHODS RNA interference Mouse CHOP sirna (ON-TARGETplus SMARTpool Cat# L-062068-00) and control sirna (ON-TARGETplus Control) were purchased from Dharmacon. Transfection
1.5 ASK1KO fed. fasted 16 hrs w/o water. Fed. 4th. 4th WT ASK1KO N=29, 11(WT), ,5(ASK1KO) ASK1KO ASK1KO **** Time [h]
![1.5 ASK1KO fed. fasted 16 hrs w/o water. Fed. 4th. 4th WT ASK1KO N=29, 11(WT), ,5(ASK1KO) ASK1KO ASK1KO **** Time [h]](/thumbs/87/97258189.jpg "1.5 ASK1KO fed. fasted 16 hrs w/o water. Fed. 4th. 4th WT ASK1KO N=29, 11(WT), ,5(ASK1KO) ASK1KO ASK1KO **** Time [h]") 7: 13: 19: 1: 7: 151117 a 151117 4th 4th b c RQ.95 KO.9.85.8.75.7 light dark light dark.65 7: 19: 7: 19: 7: Means ± SEM, N=6 RQ 1..9.8.7.6.6 KO CL (-) CL (+) ibat weight ratio (/body weight) [%].5.4.3.2.1
7: 13: 19: 1: 7: 151117 a 151117 4th 4th b c RQ.95 KO.9.85.8.75.7 light dark light dark.65 7: 19: 7: 19: 7: Means ± SEM, N=6 RQ 1..9.8.7.6.6 KO CL (-) CL (+) ibat weight ratio (/body weight) [%].5.4.3.2.1
2017 Obesity Fact Sheet
 2017 Fact Sheet Welcome message 2017 Fact Sheet Dear Colleagues, It is my great honor and pleasure to publish the 2017 Fact Sheet of the Korean Society for the Study of (KSSO). The 2017 Fact Sheet is the
Supplementary Fig. 1. GPRC5A post-transcriptionally down-regulates EGFR expression. (a) Plot of the changes in steady state mrna levels versus
 Plot of the changes in steady state mrna levels versus") Supplementary Fig. 1. GPRC5A post-transcriptionally down-regulates EGFR expression. (a) Plot of the changes in steady state mrna levels versus changes in corresponding proteins between wild type and Gprc5a-/-
Supplementary Fig. 1. GPRC5A post-transcriptionally down-regulates EGFR expression. (a) Plot of the changes in steady state mrna levels versus changes in corresponding proteins between wild type and Gprc5a-/-
SUPPLEMENTARY INFORMATION
 -. -. SUPPLEMENTARY INFORMATION DOI: 1.1/ncb86 a WAT-1 WAT- BAT-1 BAT- sk-muscle-1 sk-muscle- mir-133b mir-133a mir-6 mir-378 mir-1 mir-85 mir-378 mir-6a mir-18 mir-133a mir- mir- mir-341 mir-196a mir-17
EGIS BILIARY STENT. 1. Features & Benefits 2. Ordering information 3. References
 EGIS BILIARY STENT 1. Features & Benefits 2. Ordering information 3. References 1. Features & Benefits (1) Features Superior flexibility & conformability 4 Types Single bare, Single cover, Double bare,
Supplemental Fig. 1. Relative mrna Expression. Relative mrna Expression WT KO WT KO RT 4 0 C
 Supplemental Fig. 1 A 1.5 1..5 Hdac11 (ibat) n=4 n=4 n=4 n=4 n=4 n=4 n=4 n=4 WT KO WT KO WT KO WT KO RT 4 C RT 4 C Supplemental Figure 1. Hdac11 mrna is undetectable in KO adipose tissue. Quantitative
Supplementary Figure S I: Effects of D4F on body weight and serum lipids in apoe -/- mice.
 Supplementary Figures: Supplementary Figure S I: Effects of D4F on body weight and serum lipids in apoe -/- mice. Male apoe -/- mice were fed a high-fat diet for 8 weeks, and given PBS (model group) or
A microrna-34a/fgf21 Regulatory Axis and Browning of White Fat
 A microrna-34a/fgf21 Regulatory Axis and Browning of White Fat Jongsook Kim Kemper, Ph.D Department of Molecular and Integrative Physiology, University of Illinois at Urbana-Champaign, USA 213 International
Supplementary Figure 1
 Supplementary Figure 1 Supplementary Figure 1 Schematic depiction of the tandem Fc GDF15. Supplementary Figure 2 Supplementary Figure 2 Gfral mrna levels in the brains of both wild-type and knockout Gfral
Supplementary Figure S1. Effect of Glucose on Energy Balance in WT and KHK A/C KO
 Supplementary Figure S1. Effect of Glucose on Energy Balance in WT and KHK A/C KO Mice. WT mice and KHK-A/C KO mice were provided drinking water containing 10% glucose or tap water with normal chow ad
Hepatitis C Virus and Cytokine Responses
 Hepatitis C Virus and Cytokine Responses Eui-Cheol Shin, M.D., Ph.D. Laboratory of Immunology & Infectious Diseases (LIID), Graduate School of Medical Science & Engineering (GSMSE), KAIST Daejeon, Korea
Metabolic ER stress and inflammation in white adipose tissue (WAT) of mice with dietary obesity.
 of mice with dietary obesity.") Supplementary Figure 1 Metabolic ER stress and inflammation in white adipose tissue (WAT) of mice with dietary obesity. Male C57BL/6J mice were fed a normal chow (NC, 10% fat) or a high-fat diet (HFD,
Supplementary Figure 1 Metabolic ER stress and inflammation in white adipose tissue (WAT) of mice with dietary obesity. Male C57BL/6J mice were fed a normal chow (NC, 10% fat) or a high-fat diet (HFD,
Supplementary Figure 1 a
 Supplementary Figure a Normalized expression/tbp (A.U.).6... Trip-br transcripts Trans Trans Trans b..5. Trip-br Ctrl LPS Normalized expression/tbp (A.U.) c Trip-br transcripts. adipocytes.... Trans Trans
Central injection of fibroblast growth factor 1 induces sustained remission of diabetic hyperglycemia in rodents
 Central injection of fibroblast growth factor 1 induces sustained remission of diabetic hyperglycemia in rodents Jarrad M Scarlett 1,,1, Jennifer M Rojas 1,1, Miles E Matsen 1, Karl J Kaiyala 3, Darko
Supporting Information
 Supporting Information M1 macrophage-derived nanovesicles potentiate the anticancer efficacy of immune checkpoint inhibitors Yeon Woong Choo, 1, Mikyung Kang, 2, Han Young Kim, 1 Jin Han, 1 Seokyung Kang,
Changes in the seroprevalence of IgG anti-hepatitis A virus between 2001 and 2013: experience at a single center in Korea
 pissn 2287-2728 eissn 2287-285X Original Article Clinical and Molecular Hepatology 214;2:162-167 Changes in the seroprevalence of IgG anti-hepatitis A virus between 21 and 213: experience at a single center
Mica Nanoparticle, STB-HO Eliminates the Human Breast Carcinoma Cells. by Regulating the Interaction of Tumor with its Immune Microenvironment
 Supplementary Data for Kang et al. (Title) Mica Nanoparticle, STB-HO Eliminates the Human Breast Carcinoma Cells by Regulating the Interaction of Tumor with its Immune Microenvironment Tae-Wook Kang 1,3,,
Trial of Everolimus-Eluting Stents or Bypass Surgery for Coronary Disease (BEST Trial)
") Trial of Everolimus-Eluting Stents or Bypass Surgery for Coronary Disease (BEST Trial) Seung-Jung Park, MD, PhD On behalf of the BEST investigators Professor of Medicine, University of Ulsan College of
Trial of Everolimus-Eluting Stents or Bypass Surgery for Coronary Disease (BEST Trial) Seung-Jung Park, MD, PhD On behalf of the BEST investigators Professor of Medicine, University of Ulsan College of
Research Article Inhibitory Effects of 4-(4-Methylbenzamino)benzoate on Adipocyte Differentiation
benzoate on Adipocyte Differentiation") Chemistry Volume 2015, Article ID 171570, 4 pages http://dx.doi.org/10.1155/2015/171570 Research Article Inhibitory Effects of 4-(4-Methylbenzamino)benzoate on Adipocyte Differentiation Jin Taek Hwang,
Chemistry Volume 2015, Article ID 171570, 4 pages http://dx.doi.org/10.1155/2015/171570 Research Article Inhibitory Effects of 4-(4-Methylbenzamino)benzoate on Adipocyte Differentiation Jin Taek Hwang,
SUPPLEMENTARY INFORMATION. Supplemental Figure 1. Body weight and blood glucose parameters of chow-diet (CD)
") SUPPLEMENTARY INFORMATION LEGENDS Supplemental Figure. Body weight and blood glucose parameters of chow-diet (CD) fed and high-fat diet (HFD) fed mice. (A) Body weight was measured at the beginning of
SUPPLEMENTARY INFORMATION LEGENDS Supplemental Figure. Body weight and blood glucose parameters of chow-diet (CD) fed and high-fat diet (HFD) fed mice. (A) Body weight was measured at the beginning of
SUPPLEMENTARY INFORMATION
 SUPPLEMENTARY INFORMATION doi:10.1038/nature11464 Supplemental Figure S1. The expression of Vegfb is increased in obese and diabetic mice as compared to lean mice. a-b, Body weight and postprandial blood
Supplementary Figure 1
 Supplementary Figure 1 A B mir-141, human cell lines mir-2c, human cell lines mir-141, hepatocytes mir-2c, hepatocytes Relative RNA.1.8.6.4.2 Relative RNA.3.2.1 Relative RNA 1.5 1..5 Relative RNA 2. 1.5
University of Ulsan College of Medicine, Seoul 05505, Republic of Korea.
 Nanoparticle-Assisted Transcutaneous Delivery of a Signal Transducer and Activator of Transcription 3-Inhibiting Peptide Ameliorates Psoriasis-like Skin Inflammation Jin Yong Kim 1,5, Jinhyo Ahn 3,4, Jinjoo
SUPPLEMENTARY DATA. Nature Medicine: doi: /nm.4171
 SUPPLEMENTARY DATA Supplementary Figure 1 a b c PF %Change - -4-6 Body weight Lean mass Body fat Tissue weight (g).4.3.2.1. PF GC iwat awat BAT PF d e f g week 2 week 3 NEFA (mmol/l) 1..5. PF phsl (Ser565)
Supplemental Information. Brown Adipogenic Reprogramming. Induced by a Small Molecule
 Cell Reports, Volume 18 Supplemental Information rown dipogenic Reprogramming Induced by a Small Molecule aoming Nie, Tao Nie, Xiaoyan Hui, Ping Gu, Liufeng Mao, Kuai Li, Ran Yuan, Jiashun Zheng, Haixia
ALT (U/L) (Relative expression) HDL (mm) (Relative expression) ALT (U/L) (Relative expression)
 (Relative expression) HDL (mm) (Relative expression) ALT (U/L) (Relative expression)") a DMT mrna () 8 6 r =.96 P =. DMT mrna () 8 6 r =. P =.6 DMT mrna () 8 6 r =.99 P =.6 DMT mrna () 8 6 r =. P =.9 DMT mrna () BMI (kg/m ) 8 6 r =.7 P =.966 DMT mrna () 8 ALT (U/L) 8 6 r = -.66 P =.76 DMT
a DMT mrna () 8 6 r =.96 P =. DMT mrna () 8 6 r =. P =.6 DMT mrna () 8 6 r =.99 P =.6 DMT mrna () 8 6 r =. P =.9 DMT mrna () BMI (kg/m ) 8 6 r =.7 P =.966 DMT mrna () 8 ALT (U/L) 8 6 r = -.66 P =.76 DMT
Nature Medicine: doi: /nm.3922
 Title: Glucocorticoid-induced tumor necrosis factor receptor-related protein co-stimulation facilitates tumor regression by inducing IL-9-producing helper T cells Authors: Il-Kyu Kim, Byung-Seok Kim, Choong-Hyun
Supplemental Information Supplementary Table 1. Tph1+/+ Tph1 / Analyte Supplementary Table 2. Tissue Vehicle LP value
 Supplemental Information Supplementary Table. Urinary and adipose tissue catecholamines in Tph +/+ and Tph / mice fed a high fat diet for weeks. Tph +/+ Tph / Analyte ewat ibat ewat ibat Urine (ng/ml)
Fig. S1. Validation of ChIP-seq binding sites by single gene ChIP-PCR Fig. S2. Transactivation potential of PPAR
 Fig. S1. Validation of ChIP-seq binding sites by single gene ChIP-PCR ChIP-PCR was performed on PPARγ and RXR-enriched chromatin harvested during adipocyte differentiation at day and day 6 as described
KAHBPS-O-PL-01 KAHBPS-O-PL-02
 KAHBPS-O-PL-01 Proposal of future remnant liver-indocyanine green clearance rate for risk assessment of major hepatectomy - What is its cutoff? Department of Surgery, Asan Medical Center, University of
AAV-TBGp-Cre treatment resulted in hepatocyte-specific GH receptor gene recombination
 AAV-TBGp-Cre treatment resulted in hepatocyte-specific GH receptor gene recombination Supplementary Figure 1. Generation of the adult-onset, liver-specific GH receptor knock-down (alivghrkd, Kd) mouse
Quality of life (QoL) in metastatic breast cancer patients with. maintenance paclitaxel plus gemcitabine (PG) chemotherapy:
 in metastatic breast cancer patients with. maintenance paclitaxel plus gemcitabine (PG) chemotherapy:") Quality of life (QoL) in metastatic breast cancer patients with maintenance paclitaxel plus gemcitabine (PG) chemotherapy: results from phase III, multicenter, randomized trial of maintenance chemotherapy
Quality of life (QoL) in metastatic breast cancer patients with maintenance paclitaxel plus gemcitabine (PG) chemotherapy: results from phase III, multicenter, randomized trial of maintenance chemotherapy
Dipeptidyl Peptidase-4 Inhibitor Increases Vascular Leakage in Retina through VE-cadherin. Phosphorylation
 Dipeptidyl Peptidase-4 Inhibitor Increases Vascular Leakage in Retina through VE-cadherin Phosphorylation Choon-Soo Lee, PhD, 1,2,4 * Yun Gi Kim, MD, 3 * Hyun-Jai Cho, MD, 1,2,3 Jonghanne Park, MD, 1,2,3
Supporting Information. Supporting Tables. S-Table 1 Primer pairs for RT-PCR. Product size. Gene Primer pairs
 Supporting Information Supporting Tables S-Table 1 Primer pairs for RT-PCR. Gene Primer pairs Product size (bp) FAS F: 5 TCTTGGAAGCGATGGGTA 3 429 R: 5 GGGATGTATCATTCTTGGAC 3 SREBP-1c F: 5 CGCTACCGTTCCTCTATCA
Supplementary Figures
 Supplementary Figures Supplementary Figure 1 Increased ABHD5 expression in human colon cancer associated macrophages. (a) Murine peritoneal macrophages were treated with regular culture medium (Ctrl) or
Targeted mass spectrometry (LC/MS/MS) for Olaparib pharmacokinetics. For LC/MS/MS of Olaparib pharmacokinetics metabolites were extracted from
 for Olaparib pharmacokinetics. For LC/MS/MS of Olaparib pharmacokinetics metabolites were extracted from") Supplementary Methods: Targeted mass spectrometry (LC/MS/MS) for Olaparib pharmacokinetics For LC/MS/MS of Olaparib pharmacokinetics metabolites were extracted from mouse tumor samples and analyzed as
Supplementary Methods: Targeted mass spectrometry (LC/MS/MS) for Olaparib pharmacokinetics For LC/MS/MS of Olaparib pharmacokinetics metabolites were extracted from mouse tumor samples and analyzed as
Supplemental Table 1: Demographics and characteristics of study participants. Male, n (%) 3 (20%) 6 (50%) Age, years [mean ± SD] 33.3 ± ± 9.
![Supplemental Table 1: Demographics and characteristics of study participants. Male, n (%) 3 (20%) 6 (50%) Age, years [mean ± SD] 33.3 ± ± 9.](/thumbs/90/103696086.jpg "Supplemental Table 1: Demographics and characteristics of study participants. Male, n (%) 3 (20%) 6 (50%) Age, years [mean ± SD] 33.3 ± ± 9.") SUPPLEMENTAL DATA Supplemental Table 1: Demographics and characteristics of study participants Lean (n=15) Obese (n=12) Male, n (%) 3 (20%) 6 (50%) Age, years [mean ± SD] 33.3 ± 9.5 44.8 ± 9.1 White, n
SUPPLEMENTAL DATA Supplemental Table 1: Demographics and characteristics of study participants Lean (n=15) Obese (n=12) Male, n (%) 3 (20%) 6 (50%) Age, years [mean ± SD] 33.3 ± 9.5 44.8 ± 9.1 White, n
Supplementary Information. Glycogen shortage during fasting triggers liver-brain-adipose. neurocircuitry to facilitate fat utilization
 Supplementary Information Glycogen shortage during fasting triggers liver-brain-adipose neurocircuitry to facilitate fat utilization Supplementary Figure S1. Liver-Brain-Adipose neurocircuitry Starvation
Supplementary Figure 1. Characterization of ALDH-positive cell population in MCF-7 cells. (a) Expression level of stem cell markers in MCF-7 cells or
 Expression level of stem cell markers in MCF-7 cells or") Supplementary Figure 1. Characterization of ALDH-positive cell population in MCF-7 cells. (a) Expression level of stem cell markers in MCF-7 cells or ALDH-positive cell population by qpcr. Data represent
Supplementary Figure 1. Characterization of ALDH-positive cell population in MCF-7 cells. (a) Expression level of stem cell markers in MCF-7 cells or ALDH-positive cell population by qpcr. Data represent
Type of file: PDF Title of file for HTML: Supplementary Information Description: Supplementary Figures and Supplementary Table.
 Type of file: PDF Title of file for HTML: Supplementary Information Description: Supplementary Figures and Supplementary Tale. Type of file: VI Title of file for HTML: Supplementary Movie 1 Description:
TBP (H) CACAGTGAATCTTGGTTGTAAACTTGA AAACCGCTTGGGATTATATTCG ANGPTL8 (H) CTGGGCCCTGCCTACCGAGA CCGATGCTGCTGTGCCACCA [1]
![TBP (H) CACAGTGAATCTTGGTTGTAAACTTGA AAACCGCTTGGGATTATATTCG ANGPTL8 (H) CTGGGCCCTGCCTACCGAGA CCGATGCTGCTGTGCCACCA [1]](/thumbs/89/99233308.jpg "TBP (H) CACAGTGAATCTTGGTTGTAAACTTGA AAACCGCTTGGGATTATATTCG ANGPTL8 (H) CTGGGCCCTGCCTACCGAGA CCGATGCTGCTGTGCCACCA [1]") ESM Table 1. Immunoblot antibodies. Primary Supplier Dilution Antibody Akt Cell Signaling 1:1000 Technology Phosphorylated Cell Signaling 1:1000 Akt (Ser 473) Technology PKCε Cell Signaling 1:1000 Technology
ESM Table 1. Immunoblot antibodies. Primary Supplier Dilution Antibody Akt Cell Signaling 1:1000 Technology Phosphorylated Cell Signaling 1:1000 Akt (Ser 473) Technology PKCε Cell Signaling 1:1000 Technology
3-Thia Fatty Acids A New Generation of Functional Lipids?
 Conference on Food Structure and Food Quality 3-Thia Fatty Acids A New Generation of Functional Lipids? Rolf K. Berge rolf.berge@med.uib.no Fatty acids- Essential cellular metabolites Concentrations must
Pro-apoptotic signalling through Toll-like receptor 3 involves TRIF-dependent
 Pro-apoptotic signalling through Toll-like receptor 3 involves TRIF-dependent activation of caspase-8 and is under the control of inhibitor of apoptosis proteins in melanoma cells Arnim Weber, Zofia Kirejczyk,
Supplementary material. Supplementary Figure legends
 Supplementary material Supplementary Figure legends Supplementary Figure 1: Senescence-associated proliferation stop in response to oncogenic N-RAS expression Proliferation of NHEM cells without (ctrl.)
Supplementary Figure 1. Confocal immunofluorescence showing mitochondrial translocation of Drp1. Cardiomyocytes treated with H 2 O 2 were prestained
 Supplementary Figure 1. Confocal immunofluorescence showing mitochondrial translocation of Drp1. Cardiomyocytes treated with H 2 O 2 were prestained with MitoTracker (red), then were immunostained with
Supplementary Figure S1 Targeted disruption and overexpression of Gpr43 in mice. (a) A targeting vector was constructed by ligation of 3 fragments:
 A targeting vector was constructed by ligation of 3 fragments:") Supplementary Figure S1 Targeted disruption and overexpression of Gpr43 in mice. (a) A targeting vector was constructed by ligation of 3 fragments: the 5' and 3' homology recombination arms and a fragment
Supplementary Figure S1 Targeted disruption and overexpression of Gpr43 in mice. (a) A targeting vector was constructed by ligation of 3 fragments: the 5' and 3' homology recombination arms and a fragment
HVEM-deficient mice fed a high-fat diet are protected from adipose tissue inflammation and glucose intolerance
 FEBS Letters 585 (2011) 2285 2290 journal homepage: www.febsletters.org HVEM-deficient mice fed a high-fat diet are protected from adipose tissue inflammation and glucose intolerance Ha-Jung Kim a, Hong-Min
T H E J O U R N A L O F C E L L B I O L O G Y
 Supplemental material Díaz et al., http://www.jcb.org/cgi/content/full/jcb.201209151/dc1 T H E J O U R N A L O F C E L L B I O L O G Y Figure S1. Hypoxia induces invadopodia formation in different epithelial
SUPPLEMENTARY DATA. Supplementary Table 1. Primers used in qpcr
 Supplementary Table 1. Primers used in qpcr Gene forward primer (5'-3') reverse primer (5'-3') β-actin AGAGGGAAATCGTGCGTGAC CAATAGTGATGACCTGGCCGT Hif-p4h-2 CTGGGCAACTACAGGATAAAC GCGTCCCAGTCTTTATTTAGATA
SERUM CYSTATIN C CONCENTRATION IS A POWERFUL PROGNOSTIC INDICATOR IN PATIENTS WITH CIRRHOTIC ASCITES
 SERUM CYSTATIN C CONCENTRATION IS A POWERFUL PROGNOSTIC INDICATOR IN PATIENTS WITH CIRRHOTIC ASCITES YEON SEOK SEO, 1 SOO YOUNG PARK, 2 MOON YOUNG KIM, 3 SANG GYUNE KIM, 4 JUN YONG PARK, 5 HYUNG JOON YIM,
Stewart et al. CD36 ligands promote sterile inflammation through assembly of a TLR 4 and 6 heterodimer
 NFκB (fold induction) Stewart et al. ligands promote sterile inflammation through assembly of a TLR 4 and 6 heterodimer a. mrna (fold induction) 5 4 3 2 1 LDL oxldl Gro1a MIP-2 RANTES mrna (fold induction)
MicroRNA sponges: competitive inhibitors of small RNAs in mammalian cells
 MicroRNA sponges: competitive inhibitors of small RNAs in mammalian cells Margaret S Ebert, Joel R Neilson & Phillip A Sharp Supplementary figures and text: Supplementary Figure 1. Effect of sponges on
Supplementary Figure S1
 Lipidomic-based investigation into the regulatory effect of Schisandrin B on palmitic acid level in non-alcoholic steatotic livers Hiu Yee Kwan 1,2, Xuyan Niu 3, Wenlin Dai 4, Tiejun Tong 4, Xiaojuan Chao
Supporting Information
 Supporting Information Charalambous et al. 10.1073/pnas.1406119111 SI Experimental Procedures Serum and Tissue Biochemistry. Enzymatic assay kits were used for determination of plasma FFAs (Roche), TAGs
SUPPLEMENTAL MATERIALS AND METHODS. Puromycin-synchronized metabolic labelling - Transfected HepG2 cells were depleted of
 SUPPLEMENTAL MATERIALS AND METHODS Puromycin-synchronized metabolic labelling - Transfected HepG2 cells were depleted of cysteine and methionine and then treated with 10 μm puromycin in depletion medium
Endothelial PGC 1 - α 1 mediates vascular dysfunction in diabetes
 Endothelial PGC-1α mediates vascular dysfunction in diabetes Reporter: Yaqi Zhou Date: 04/14/2014 Outline I. Introduction II. Research route & Results III. Summary Diabetes the Epidemic of the 21st Century
T H E J O U R N A L O F C E L L B I O L O G Y
 Supplemental material Chairoungdua et al., http://www.jcb.org/cgi/content/full/jcb.201002049/dc1 T H E J O U R N A L O F C E L L B I O L O G Y Figure S1. Expression of CD9 and CD82 inhibits Wnt/ -catenin
Supplemental Table 1 Primer sequences (mouse) used for real-time qrt-pcr studies
 used for real-time qrt-pcr studies") Supplemental Table 1 Primer sequences (mouse) used for real-time qrt-pcr studies Gene symbol Forward primer Reverse primer ACC1 5'-TGAGGAGGACCGCATTTATC 5'-GCATGGAATGGCAGTAAGGT ACLY 5'-GACACCATCTGTGATCTTG
Supplemental Table 1 Primer sequences (mouse) used for real-time qrt-pcr studies Gene symbol Forward primer Reverse primer ACC1 5'-TGAGGAGGACCGCATTTATC 5'-GCATGGAATGGCAGTAAGGT ACLY 5'-GACACCATCTGTGATCTTG
Impact of Aortic Stiffness on Further Cardiovascular Events in Patients with Chest Pain : A Invasive Study
 Impact of Aortic Stiffness on Further Cardiovascular Events in Patients with Chest Pain : A Invasive Study Cheol Ung Choi, Chang Gyu Park, Eun Bum Park, Soon Yong Suh, Jin Won Kim, Eung Ju Kim, Seung-
Supplementary Figure 1
 Supplementary Figure 1 a Percent of body weight! (%) 4! 3! 1! Epididymal fat Subcutaneous fat Liver SD Percent of body weight! (%) ** 3! 1! SD Percent of body weight! (%) 6! 4! SD ** b Blood glucose (mg/dl)!
Supplementary Table 1. The primers used for quantitative RT-PCR. Gene name Forward (5 > 3 ) Reverse (5 > 3 )
 Reverse (5 > 3 )") 770 771 Supplementary Table 1. The primers used for quantitative RT-PCR. Gene name Forward (5 > 3 ) Reverse (5 > 3 ) Human CXCL1 GCGCCCAAACCGAAGTCATA ATGGGGGATGCAGGATTGAG PF4 CCCCACTGCCCAACTGATAG TTCTTGTACAGCGGGGCTTG
770 771 Supplementary Table 1. The primers used for quantitative RT-PCR. Gene name Forward (5 > 3 ) Reverse (5 > 3 ) Human CXCL1 GCGCCCAAACCGAAGTCATA ATGGGGGATGCAGGATTGAG PF4 CCCCACTGCCCAACTGATAG TTCTTGTACAGCGGGGCTTG
SUPPLEMENTARY FIGURES AND TABLE
 SUPPLEMENTARY FIGURES AND TABLE Supplementary Figure S1: Characterization of IRE1α mutants. A. U87-LUC cells were transduced with the lentiviral vector containing the GFP sequence (U87-LUC Tet-ON GFP).
Supplementary Figure 1: Additional metabolic parameters of obesity mouse models and controls. (a) Body weight, (b) blood glucose and (c) insulin
 Body weight, (b) blood glucose and (c) insulin") Supplementary Figure 1: Additional metabolic parameters of obesity mouse models and controls. (a) Body weight, (b) blood glucose and (c) insulin resistance index of homeostatic model assessment (HOMA IR)
Supplementary Figure 1: Additional metabolic parameters of obesity mouse models and controls. (a) Body weight, (b) blood glucose and (c) insulin resistance index of homeostatic model assessment (HOMA IR)
SUPPLEMENTARY DATA Supplementary Figure 1. Body weight and fat mass of AdicerKO mice.
 SUPPLEMENTARY DATA Supplementary Figure 1. Body weight and fat mass of AdicerKO mice. Twelve week old mice were subjected to ad libitum (AL) or dietary restriction (DR) regimens for three months. (A) Body
Supplemental Data. TGF-β-mediated mir-181a expression promotes breast cancer metastasis by targeting Bim.
 Supplemental Data TGF-β-mediated mir-181a expression promotes breast cancer metastasis by targeting Bim. Molly A. Taylor 1, Khalid Sossey-Alaoui 2, Cheryl L. Thompson 3, David Danielpour 4, and William
AOSpine Principles Symposium Daegu
 KOREA Course program AOSpine Principles Symposium Daegu March 5, 2016 Daegu, South Korea AOSpine the leading global academic community for innovative education and research in spine care, inspiring lifelong
Supplemental Table 1. Plasma NEFA and liver triglyceride levels in ap2-hif1ako and ap2-hif2ako mice under control and high fat diets.
 Supplemental Table 1. Plasma NEFA and liver triglyceride levels in Hif1aKO and Hif2aKO mice under control and high fat diets. Hif1a (n=6) Hif1aK O (n=6) Hif2a Hif2aK O Hif1a (n=5) Hif1aKO (n=5) Hif2a Hif2aK
Hyun Kee Kim, M.S. Curriculum Vitae
 Hyun Kee Kim, M.S. Curriculum Vitae August, 2012 Ⅰ. Personal Information Address - Office. Researcher Molecular Genetic Laboratory, Research Institute of Medical Science, College of Medicine, The Catholic
1,8 1,6 1,4 1,2 1. EE/g lean mass 0,8 0,6 0,4 0,2. Ambulatory locomotor activity. (beam brakes/48h) V MCH MCHpf 0,86 0,85 0,84 0,83 0,82 0,81 0,8
 V MCH MCHpf 0,86 0,85 0,84 0,83 0,82 0,81 0,8") Supplementary figure 1 vehicle A -pf Energy expenditure (kcal/kg/48h) 25 2 15 1 5 V pf EE/g lean mass 1,8 1,6 1,4 1,2 1,8,6,4,2 Total locomotor activity (beam brakes/48h) C D E 7 6 5 4 3 2 1 V pf Ambulatory
Supplementary figure 1 vehicle A -pf Energy expenditure (kcal/kg/48h) 25 2 15 1 5 V pf EE/g lean mass 1,8 1,6 1,4 1,2 1,8,6,4,2 Total locomotor activity (beam brakes/48h) C D E 7 6 5 4 3 2 1 V pf Ambulatory