Supplemental Data. Wang et al. (2013). Plant Cell /tpc
|
|
|
- Cecilia Gaines
- 5 years ago
- Views:
Transcription

1 Supplemental Data. Wang et al. (2013). Plant Cell /tpc Supplemental Figure 1. 3-MA Treatment Reduces the Growth of Seedlings. Two-week-old Nicotiana benthamiana seedlings germinated on MS plates containing or not containing 5 mm 3-MA.

2 Supplemental Figure 2. Reduced Expression Levels of ATG Genes in the Silenced Plants. We used the tobacco rattle virus (TRV)-based vectors to silence ATG genes in Nicotiana benthamiana. RT-PCR analyses of ATG transcripts in the leaves of the silenced plants were performed using the gene-specific primers listed in Supplemental Table 2. EF1A was used as an internal control.

3 Supplemental Figure 3. Autophagosomes Are Rarely Observed in ATG6-Silenced Plants Imaged by Laser-Scanning Confocal Microscopy.
4 (A) Visualization of autophagosomes during the night by MDC staining. Leaves were harvested from ATG6-silenced plants exposed to darkness for 0 h, 4 h, or 8 h. Structures that incorporated MDC are green, whereas chloroplasts are red. Scale bars = 10 μm. (B) Visualization of autophagosomes during the night using the autophagy marker, CFP-ATG8f. Leaves were harvested from ATG6-silenced plants exposed to darkness for 0 h, 4 h, or 8 h. The CFP-ATG8f fusion protein appears cyan and chloroplasts appear red. Scale bars = 10 μm.
5 Supplemental Figure 4. Characterization of Starch Granules and SSGLs. (A) Average number of the visible starch granules per chloroplast. Leaves exposed to darkness for 0 h, 2 h, 4 h or 8 h were harvested for the TEM (Transmission Electron Microscope) analysis. More than a hundred chloroplasts in about ten mesophyll cells were used for the quantification of visible starch granule numbers and calculation of average number of visible starch granules per chloroplast. Values represent means±se. (B) Distribution of starch granule diameter at the end of the day. The diameter of
6 starch granules accumulated in chloroplasts was measured by using the TEM images. Sixty-five data points (triangles) were collected and presented. The black solid line represents the mean of the data. (C) Distribution of SSGL diameter observed outside of the chloroplast. The diameter of SSGLs was measured using TEM images of leaves exposed to darkness for 2 h and 4 h. Fifty-five data points (diamonds) were collected and presented. The black solid line represents the mean of the data.
 Iodine staining of leaves harvested at the end of the day showed that ATG6-silenced leaves accumulate more starch than the non-silenced ones.")
7 Supplemental Figure 5. The Starch-Excess Phenotype in ATG6-Silenced Plants Is Due to the Reduced Starch Degradation During the Night. (A) Iodine staining of leaves harvested at the end of the day showed that ATG6-silenced leaves accumulate more starch than the non-silenced ones. At least two replicate leaf samples were used for the staining. (B) and (C) Destarch assay revealed that starch overaccumulation in ATG6-silenced leaves is caused by reduced degradation rather than enhanced synthesis. After
8 exposure to darkness for 60 h, ATG6-silenced and non-silenced plants were returned to a regular 16-h light/8-h dark cycle (time point 0 h). The leaf starch content was measured during the next two days at different time points. (B) Leaf starch contents of ATG6-silenced (red circles) and non-silenced plants (black squares). Values represent means±se from at least two replicate leaf samples. White and black bars on the bottom indicate days and nights, respectively. (C) Percentage of starch degraded in ATG6-silenced (red column) and non-silenced (black column) plants during each night as a percentage of the starch synthesized during the day. The values are determined according to the starch content measured at each time point in (B).
9
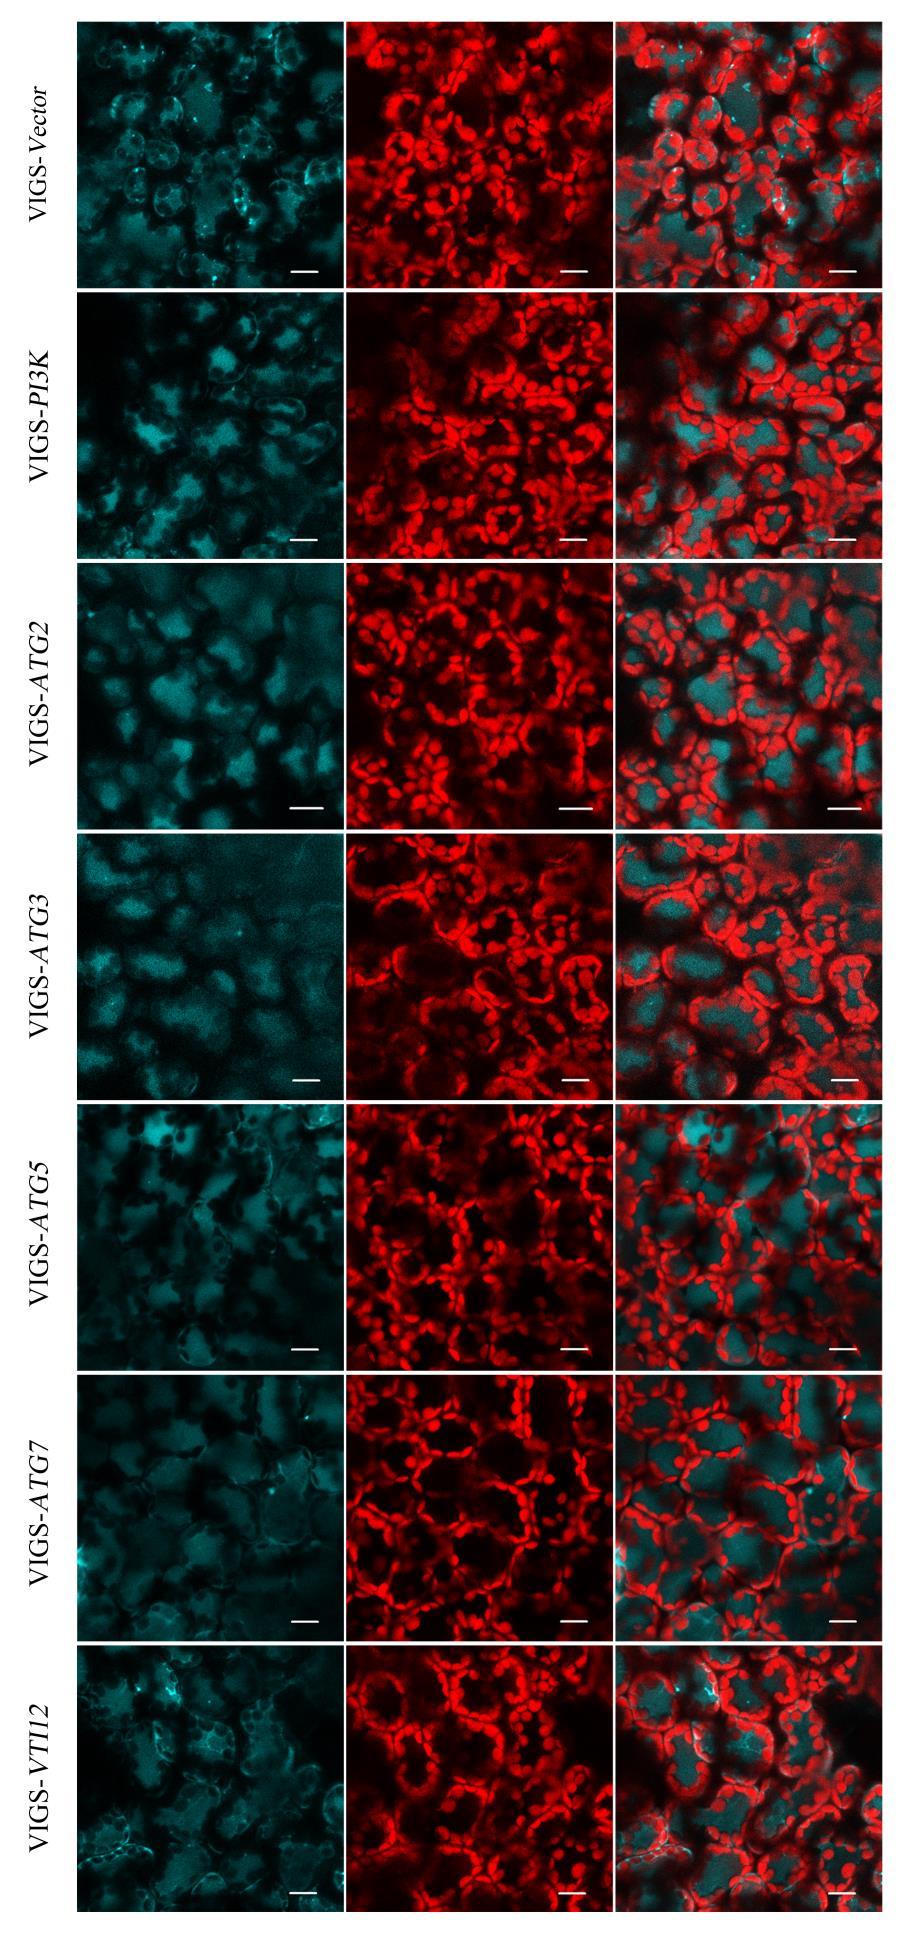
10 Supplemental Figure 6. Autophagosome Formation Is Reduced in Other ATG-Silenced Plants Examined by Laser-Scanning Confocal Microscopy. We monitored the autophagic activity in leaves of ATG-silenced and non-silenced plants using the autophagy marker, CFP-ATG8f. Enhanced autophagosome formation was usually detected in the leaves of non-silenced plants exposed to darkness for 4 h (VIGS-Vector), while few autophagosomes were observed in the ATG-silenced plants. The CFP-ATG8f fusion protein appears cyan and chloroplasts appear red. Scale bars = 10 μm.
 in the control sections (stained with TCH-SP or PA-SP or SP) and therefore they appeared electron-translucent, similar with")
11 Supplemental Figure 7. Ultrastructural Analysis of Silver Proteinate-Stained SSGLs (A) Control treatments for demonstration of starch components in SSGLs with PA-TCH-SP method. No silver grains were deposited on the starch granules and SSGLs (arrows) in the control sections (stained with TCH-SP or PA-SP or SP) and therefore they appeared electron-translucent, similar with the appearance of starch components in the unstained sections. However, intensive staining of the starch granules and SSGLs was observed in the sections treated with PA-TCH-SP. The results clearly demonstrated the SSGLs were starch components. The blue, cyan, red arrows indicate the unstained SSGLs in the vacuole, cytoplasm and autophagosome-like structures, respectively. The yellow arrow indicates the silver-stained SSGL in the vacuole. Osmiophilic granules (magenta arrowheads) were often observed in the chloroplasts. They appeared electron-dense in the non-oxidized sections (Unstained, TCH-SP, SP) and electron-lucent in the oxidized sections (PA-SP,
12 PA-TCH-SP) as the result of removal of the tissue-bound osmium from the sections by PA oxidation. The red asterisk refers to an isolation membrane (the autophagosome precursor). (B) Three types of silver proteinate-stained SSGLs in the vacuole. The red, yellow, and blue arrows refer to SSGLs engulfed by a single-membrane vesicle, SSGLs located directly in the vacuole, and SSLGs that had almost completely degraded, respectively. Areas enclosed by the magenta dashed line indicate the representative diffuse silver depositions which are supposed to be stained glucans released from the SSGLs. S, starch; V, vacuole; Cp, chloroplast; M, mitochondrion; CW, cell wall. Scale bars = 500 nm.
13
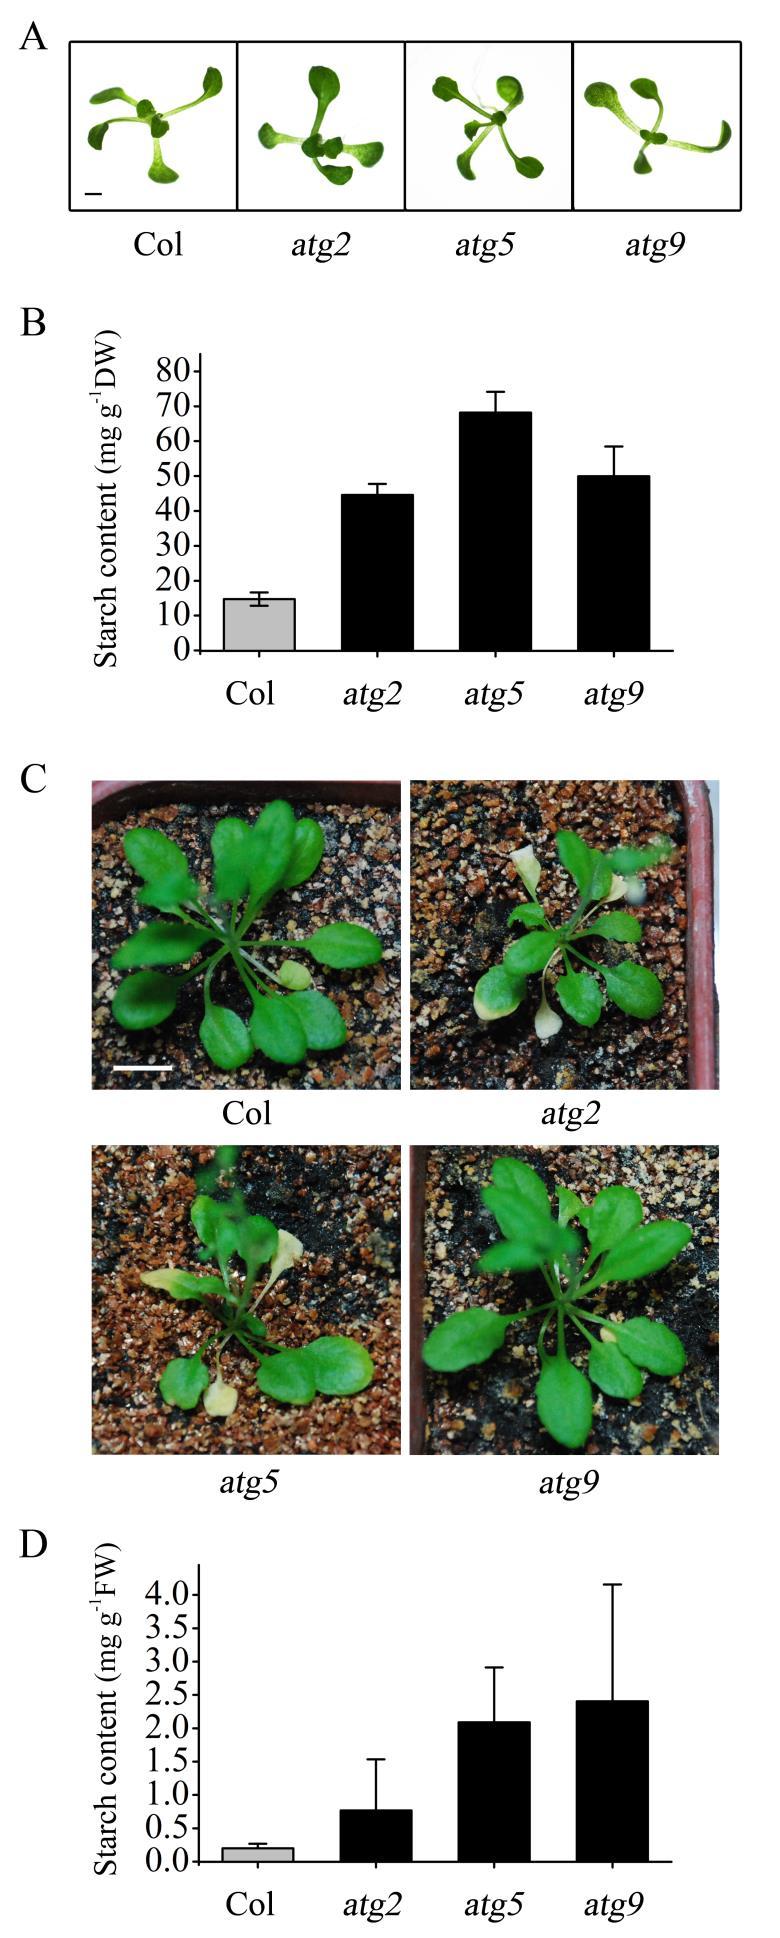
14 Supplemental Figure 8. Developmental Phenotypes and Leaf Starch Content in Wild-Type Arabidopsis and atg Mutantst. (A) Two-week-old atg2, atg5, and atg9 seedlings germinated on rich medium showed no significant difference in growth compared with wild-type Columbia seedlings. Scale bars = 1mm. (B) Quantification of starch content in the atg mutant seedlings germinated on rich medium at the end of the night. Approximately 25 seedlings were harvested and regarded as one sample for the starch quantification test. Values are means ± SE from four replicate samples. DW, dry weight. (C) The six-week-old soil-grown atg2, atg5 mutants showed reduced growth and early senescence while atg9 showed no significant difference compared with wild-type Columbia. Scale bars = 1cm. (D) Quantification of leaf starch content in the soil-grown atg mutants at the end of the night. Leaf samples were harvested from the six-week-old Arabidopsis plants grown under a 16-h light/8-h dark cycle Values are means±se from two more replicate samples. FW, fresh weight.
 in the silver proteinate-stained sections are shown in (A) and (B), respectively.")
15 Supplemental Figure 9. Ultrastructure of Fragmented Starch Granules in Leaves Exposed to Darkness. Two fragmented starch granules (indicated by blue squares) in the silver proteinate-stained sections are shown in (A) and (B), respectively. The arrowheads refer to the Small starch granule-like structures (SSGLs) segmented from the main body of the starch granule. S, starch; V, vacuole. Scale bars = 500 nm.
16 Supplemental Table 1. List of Primers Used in This Study Purpose Gene name Primer name Primer sequence(5 to 3 ) ATG2 ATG2-F GCGTAAGGACAGCCTCAATC RT-PCR ATG2-R CTGAAACTAATGGCATGGTC for confirming ATG3 ATG3-F TACTGTCGCAGAAGATTCAC gene silencing ATG3-R CTTTCTTTAGGTTTCCCATG ATG5 ATG5-F AAGCTCATACGCATTCAGGG ATG5-R GCTTCGGACCTTTGCTACCT ATG6 ATG6-F CCTTCTTCTTCATACAATGGCTCA ATG6-R AGACGGTTGCAGAAAGTGGC ATG7 ATG7-F TTGCTCCTATTGCATCAGCC ATG7-R ATTATCCCAGTCCAGCGTGT PI3K PI3K-F TTAGCAACTGGGCACGATGA PI3K-R CGGTGGAAAGGGCTTAGGAT VTI12 VTI12-F CAAGTGACAGAATCAGGGAG VTI12-R AAAGTAAACCCGTAGAGCAT EF1A EF1A-F CCCCTTCGTCTTCCACTTCA EF1A-R GCTTGGTCGGCATCATCTTA Real-time RT-PCR ATG1c ATG1c-F TGGAAAGTCCCTCATCTGCACCTG ATG1c-R GCCTGCCTACCTCAACCTTCTCAT ATG2 ATG2-F GCAATTGGGCTTGGAGTGCATTTG ATG2-R CCTGTCGGGCATCTCTAGGTTGAT ATG4 ATG4-F GGCGAAGCTGACTGGATACCTGTT ATG4-R ATCATCCTGCACGCCGACAATGTA ATG6 ATG6-F ACCTGCGTAAAGGAGTTTGCTGAC ATG6-R AGAGCTTTGGTCCAACTTTCCTGC ATG7 ATG7-F CCAGCAGTGGAAGCAGAAGGTCTT ATG7-R GCCACCGACTTTCCCGTGTATCA ATG9 ATG9-F TCCGGTGGATTTGCTGCTGTTCT ATG9-R ACATCGCTCCCTGTGGGTCAAG PI3K PI3K-F GCTGTGCTGGTTACTCCGTCATC PI3K-R ACTGACTTTCCGCTCCACCCATA ACTIN ACTIN-F CCCAGAGAGGAAATACAGTG SEX1 ATG6 ACTIN-R SEX1-F-for silencing test SEX1-R-for silencing test ATG6-F-for silencing test ATG6-R-for silencing test CAATAGACGGACCAGATTCG GTTATGCCGGTGCTGGCCTCTAT TTCCATCCCTCACTACACCCTCGA CCTCTGTCAGAACTGCCACAATCC TCCCTGGTCCCTGATTTCTTTGCT
17 Overlapping PCR amplification of CFP-ATG8f Overlapping PCR amplification of GBSSI-YFP CFP CFP-F CgACgACAAgACCgTgACCATGGTGAG CAAGGGCGAGGAGCTGT CFP-R CTTGTACAGCTCGTCCATGCCGAGA ATG8f ATG8f-F ATGGACGAGCTGTACAAGATGGCAA AGAGTTCATTCAAGCAAG ATG8f-R gaggagaagagccgtttacaccaagttg AGGTCGCCAAAT GBSSI GBSSI-F CgACgACAAgACCgTgACCATGGCAAG CATCACAGCTTCACACT GBSSI-R AGGAGTGGCCACATTTTCCTTGGCA YFP YFP-F GAAAATGTGGCCACTCCTATGGTGAG CAAGGGCGAGGAGCTGT YFP-R gaggagaagagccgttcacttgtacagct CGTCCATG
Supplemental Data. Beck et al. (2010). Plant Cell /tpc
. Plant Cell /tpc") Supplemental Figure 1. Phenotypic comparison of the rosette leaves of four-week-old mpk4 and Col-0 plants. A mpk4 vs Col-0 plants grown in soil. Note the extreme dwarfism of the mpk4 plants (white arrows)
Supplemental Figure 1. Phenotypic comparison of the rosette leaves of four-week-old mpk4 and Col-0 plants. A mpk4 vs Col-0 plants grown in soil. Note the extreme dwarfism of the mpk4 plants (white arrows)
Supporting Information
 Supporting Information Harries et al. 1.173/pnas.9923916 A Fig. S1. Disruption of microfilaments within epidermal cells after treatment with 5 M Lat. Images of N. benthamiana cells are from plants expressing
Supplementary Figures
 Supplementary Figures a miel1-2 (SALK_41369).1kb miel1-1 (SALK_978) b TUB MIEL1 Supplementary Figure 1. MIEL1 expression in miel1 mutant and S:MIEL1-MYC transgenic plants. (a) Mapping of the T-DNA insertion
Supplementary Figure 1 Transcription assay of nine ABA-responsive PP2C. Transcription assay of nine ABA-responsive PP2C genes. Total RNA was isolated
 Supplementary Figure 1 Transcription assay of nine ABA-responsive PP2C genes. Transcription assay of nine ABA-responsive PP2C genes. Total RNA was isolated from 7 day-old seedlings treated with or without
Supplemental Data. Deinlein et al. Plant Cell. (2012) /tpc
 /tpc") µm Zn 2+ 15 µm Zn 2+ Growth (% of control) empty vector NS1 NS2 NS3 NS4 S. pombe zhfδ Supplemental Figure 1. Functional characterization of. halleri NS genes in Zn 2+ hypersensitive S. pombe Δzhf mutant
µm Zn 2+ 15 µm Zn 2+ Growth (% of control) empty vector NS1 NS2 NS3 NS4 S. pombe zhfδ Supplemental Figure 1. Functional characterization of. halleri NS genes in Zn 2+ hypersensitive S. pombe Δzhf mutant
SUPPLEMENTARY INFORMATION
 DOI: 10.1038/ncb2294 Figure S1 Localization and function of cell wall polysaccharides in root hair cells. (a) Spinning-disk confocal sections of seven day-old A. thaliana seedlings stained with 0.1% S4B
Supplemental information contains 7 movies and 4 supplemental Figures
 1 2 3 4 5 6 7 8 9 10 11 12 13 14 15 16 17 18 19 20 21 22 23 24 25 26 27 Supplemental information contains 7 movies and 4 supplemental Figures Movies: Movie 1. Single virus tracking of A4-mCherry-WR MV
Open Flower. Juvenile leaf Flowerbud. Carpel 35 NA NA NA NA 61 NA 95 NA NA 15 NA 41 3 NA
 PaxDB Root Juvenile leaf Flowerbud Open Flower Carpel Mature Pollen Silique Seed Sec3a Sec3b Sec5a Sec5b Sec6 Sec8 Sec10a/b Sec15a Sec15b Exo84a Exo84b Exo84c Exo70A1 Exo70A2 Exo70A3 49 47 8 75 104 79
Supporting Information
 Supporting Information Lee et al. 10.1073/pnas.0910950106 Fig. S1. Fe (A), Zn (B), Cu (C), and Mn (D) concentrations in flag leaves from WT, osnas3-1, and OsNAS3-antisense (AN-2) plants. Each measurement
Expression constructs
 Gene expressed in bebe3 ZmBEa Expression constructs 35S ZmBEa Pnos:Hygromycin r 35S Pnos:Hygromycin r 35S ctp YFP Pnos:Hygromycin r B -1 Chl YFP- Merge Supplemental Figure S1: Constructs Used for the Expression
Supplemental Information. Spatial Auxin Signaling. Controls Leaf Flattening in Arabidopsis
 Current Biology, Volume 27 Supplemental Information Spatial Auxin Signaling Controls Leaf Flattening in Arabidopsis Chunmei Guan, Binbin Wu, Ting Yu, Qingqing Wang, Naden T. Krogan, Xigang Liu, and Yuling
Figure S1 Expression of AHL gene family members in diploid (Ler Col) and triploid (Ler
 and triploid (Ler") Supplemental material Supplemental figure legends Figure S Expression of AHL gene family members in diploid (Ler ) and triploid (Ler osd) seeds. AHLs from clade B are labelled with (I), and AHLs from clade
Supplemental material Supplemental figure legends Figure S Expression of AHL gene family members in diploid (Ler ) and triploid (Ler osd) seeds. AHLs from clade B are labelled with (I), and AHLs from clade
Supplementary Figures
 Supplementary Figures 9 10 11 Supplementary Figure 1. Old plants are more resistant to insect herbivores than young plants. (a) Image of young (1-day-old, 1D) and old (-day-old, D) plants of Arabidopsis
Supplemental Data. Candat et al. Plant Cell (2014) /tpc Cytosol. Nucleus. Mitochondria. Plastid. Peroxisome. Endomembrane system
 /tpc Cytosol. Nucleus. Mitochondria. Plastid. Peroxisome. Endomembrane system") Cytosol Nucleus 32 33 34 35 36 37 38 39 40 41 42 43 44 45 46 47 48 49 50 51 1 2 3 4 5 6 7 8 9 10 11 12 13 14 15 16 17 18 19 20 21 22 23 24 25 26 27 28 29 30 31 PSORT MultiLoc YLoc SubLoc BaCelLo WoLF PSORT
Cytosol Nucleus 32 33 34 35 36 37 38 39 40 41 42 43 44 45 46 47 48 49 50 51 1 2 3 4 5 6 7 8 9 10 11 12 13 14 15 16 17 18 19 20 21 22 23 24 25 26 27 28 29 30 31 PSORT MultiLoc YLoc SubLoc BaCelLo WoLF PSORT
Aim 19: Cellular Respiration
 1. During the process of cellular respiration, energy is released from A) carbon dioxide B) oxygen atoms C) water molecules D) chemical bonds 2. The energy used to obtain, transfer, and transport materials
Supporting Information
 Supporting Information Fig. S1. Overexpression of Rpr causes progenitor cell death. (A) TUNEL assay of control intestines. No progenitor cell death could be observed, except that some ECs are undergoing
SUPPLEMENTARY INFORMATION
 DOI: 10.1038/ncb2988 Supplementary Figure 1 Kif7 L130P encodes a stable protein that does not localize to cilia tips. (a) Immunoblot with KIF7 antibody in cell lysates of wild-type, Kif7 L130P and Kif7
Supplemental Data. Müller-Xing et al. (2014). Plant Cell /tpc
. Plant Cell /tpc") Supplemental Figure 1. Phenotypes of iclf (clf-28 swn-7 CLF pro :CLF-GR) plants. A, Late rescue of iclf plants by renewed DEX treatment; senescent inflorescence with elongated siliques (arrow; 90 DAG,
Supplemental Figure 1. Phenotypes of iclf (clf-28 swn-7 CLF pro :CLF-GR) plants. A, Late rescue of iclf plants by renewed DEX treatment; senescent inflorescence with elongated siliques (arrow; 90 DAG,
Supplementary Figure 1. SC35M polymerase activity in the presence of Bat or SC35M NP encoded from the phw2000 rescue plasmid.
 1 2 3 4 5 6 7 8 9 10 11 12 13 14 15 16 17 18 19 20 21 22 23 24 25 26 27 Supplementary Figure 1. SC35M polymerase activity in the presence of Bat or SC35M NP encoded from the phw2000 rescue plasmid. HEK293T
Supplementary Fig. 1 V-ATPase depletion induces unique and robust phenotype in Drosophila fat body cells.
 Supplementary Fig. 1 V-ATPase depletion induces unique and robust phenotype in Drosophila fat body cells. a. Schematic of the V-ATPase proton pump macro-complex structure. The V1 complex is composed of
Supplemental Figure S1.
 53 kda- WT TPS29.2 (ethanol) TPS29.2 (water) Supplemental Figure S1. Inducible expression of E. coli otsa (TPS) in Arabidopsis. Immunoblot of leaf proteins (20 µg per lane) extracted from: (i) WT Col-0,
Supplemental Data. Hao et al. (2014). Plant Cell /tpc
. Plant Cell /tpc") Supplemental Figure 1. Confocal Images and VA-TIRFM Analysis of GFP-RbohD in Arabidopsis Seedlings. (A) RbohD expression in whole Arabidopsis seedlings. RbohD was expressed in the leaves, hypocotyl, and
Supplemental Figure 1. Confocal Images and VA-TIRFM Analysis of GFP-RbohD in Arabidopsis Seedlings. (A) RbohD expression in whole Arabidopsis seedlings. RbohD was expressed in the leaves, hypocotyl, and
Thursday, October 16 th
 Thursday, October 16 th Good morning. Those of you needing to take the Enzymes and Energy Quiz will start very soon. Students who took the quiz Wednesday: Please QUIETLY work on the chapter 6 reading guide.
Disruption of Microtubules in Plants Suppresses Macroautophagy and Triggers Starch Excess- Associated Chloroplast Autophagy
 Autophagy ISSN: 1554-8627 (Print) 1554-8635 (Online) Journal homepage: http://www.tandfonline.com/loi/kaup20 Disruption of Microtubules in Plants Suppresses Macroautophagy and Triggers Starch Excess- Associated
Main differences between plant and animal cells: Plant cells have: cell walls, a large central vacuole, plastids and turgor pressure.
 Main differences between plant and animal cells: Plant cells have: cell walls, a large central vacuole, plastids and turgor pressure. Animal cells have a lysosome (related to vacuole) and centrioles (function
Cell wall components:
 Main differences between plant and animal cells: Plant cells have: cell walls, a large central vacuole, plastids and turgor pressure. The Cell Wall The primary cell wall is capable of rapid expansion during
Tyrosine phosphorylation and protein degradation control the transcriptional activity of WRKY involved in benzylisoquinoline alkaloid biosynthesis
 Supplementary information Tyrosine phosphorylation and protein degradation control the transcriptional activity of WRKY involved in benzylisoquinoline alkaloid biosynthesis Yasuyuki Yamada, Fumihiko Sato
s -1 (A) and (B) 2 s 1 in WT, riq1, and the riq1 mutant complemented by
 and (B) 2 s 1 in WT, riq1, and the riq1 mutant complemented by") A 250-2 s -1 B 250-2 s -1 Supplemental Figure 1. The NPQ Phenotype in riq Mutants Was Complemented by Introduction of RIQ Genes. (A) and (B) 2 s 1 in, riq1, and the riq1 mutant complemented by the RIQ1
A 250-2 s -1 B 250-2 s -1 Supplemental Figure 1. The NPQ Phenotype in riq Mutants Was Complemented by Introduction of RIQ Genes. (A) and (B) 2 s 1 in, riq1, and the riq1 mutant complemented by the RIQ1
Cloning and Expression of a Bacterial CGTase and Impacts on Phytoremediation. Sarah J. MacDonald Assistant Professor Missouri Valley College
 Cloning and Expression of a Bacterial CGTase and Impacts on Phytoremediation Sarah J. MacDonald Assistant Professor Missouri Valley College Phytoremediation of Organic Compounds Phytodegradation: Plants
T H E J O U R N A L O F C E L L B I O L O G Y
 Supplemental material Chen et al., http://www.jcb.org/cgi/content/full/jcb.201210119/dc1 T H E J O U R N A L O F C E L L B I O L O G Y Figure S1. Lack of fast reversibility of UVR8 dissociation. (A) HEK293T
F-actin VWF Vinculin. F-actin. Vinculin VWF
 a F-actin VWF Vinculin b F-actin VWF Vinculin Supplementary Fig. 1. WPBs in HUVECs are located along stress fibers and at focal adhesions. (a) Immunofluorescence images of f-actin (cyan), VWF (yellow),
Supplemental Data. Hiruma et al. Plant Cell. (2010) /tpc Col-0. pen2-1
 /tpc Col-0. pen2-1") A Ch B Col-0 Cg pen2-1 Supplemental Figure 1. Trypan Blue Staining of Leaves Inoculated with Adapted and Nonadapted Colletotrichum Species.(A) Conidial suspensions of C. higginsianum MAFF305635 (Ch) were
A Ch B Col-0 Cg pen2-1 Supplemental Figure 1. Trypan Blue Staining of Leaves Inoculated with Adapted and Nonadapted Colletotrichum Species.(A) Conidial suspensions of C. higginsianum MAFF305635 (Ch) were
Supplementary Figure 1. Genotyping strategies for Mcm3 +/+, Mcm3 +/Lox and Mcm3 +/- mice and luciferase activity in Mcm3 +/Lox mice. A.
 Supplementary Figure 1. Genotyping strategies for Mcm3 +/+, Mcm3 +/Lox and Mcm3 +/- mice and luciferase activity in Mcm3 +/Lox mice. A. Upper part, three-primer PCR strategy at the Mcm3 locus yielding
Supplemental Data. Shin et al. Plant Cell. (2012) /tpc YFP N
 /tpc YFP N") MYC YFP N PIF5 YFP C N-TIC TIC Supplemental Data. Shin et al. Plant Cell. ()..5/tpc..95 Supplemental Figure. TIC interacts with MYC in the nucleus. Bimolecular fluorescence complementation assay using
MYC YFP N PIF5 YFP C N-TIC TIC Supplemental Data. Shin et al. Plant Cell. ()..5/tpc..95 Supplemental Figure. TIC interacts with MYC in the nucleus. Bimolecular fluorescence complementation assay using
Table I: PHT1 transporter family comparison at the amino acid level. BLAST program was used to obtain percentage of similarity and identity (in bold).
.") Supplemental Tables Table I: PHT1 transporter family comparison at the amino acid level. BLAST program was used to obtain percentage of similarity and identity (in bold). PHT1;1 PHT1;2 PHT1;3 PHT1;4 PHT1;5
Supplemental Tables Table I: PHT1 transporter family comparison at the amino acid level. BLAST program was used to obtain percentage of similarity and identity (in bold). PHT1;1 PHT1;2 PHT1;3 PHT1;4 PHT1;5
SUPPLEMENTARY FIGURES AND TABLE
 SUPPLEMENTARY FIGURES AND TABLE Supplementary Figure S1: Characterization of IRE1α mutants. A. U87-LUC cells were transduced with the lentiviral vector containing the GFP sequence (U87-LUC Tet-ON GFP).
Supplemental Data. Wu et al. (2010). Plant Cell /tpc
. Plant Cell /tpc") Supplemental Figure 1. FIM5 is preferentially expressed in stamen and mature pollen. The expression data of FIM5 was extracted from Arabidopsis efp browser (http://www.bar.utoronto.ca/efp/development/),
Supplemental Figure 1. FIM5 is preferentially expressed in stamen and mature pollen. The expression data of FIM5 was extracted from Arabidopsis efp browser (http://www.bar.utoronto.ca/efp/development/),
Supplementary Materials for
 www.sciencetranslationalmedicine.org/cgi/content/full/4/117/117ra8/dc1 Supplementary Materials for Notch4 Normalization Reduces Blood Vessel Size in Arteriovenous Malformations Patrick A. Murphy, Tyson
Supplementary Figure 1 Expression of Crb3 in mouse sciatic nerve: biochemical analysis (a) Schematic of Crb3 isoforms, ERLI and CLPI, indicating the
 Schematic of Crb3 isoforms, ERLI and CLPI, indicating the") Supplementary Figure 1 Expression of Crb3 in mouse sciatic nerve: biochemical analysis (a) Schematic of Crb3 isoforms, ERLI and CLPI, indicating the location of the transmembrane (TM), FRM binding (FB)
Supplementary Figure 1 Expression of Crb3 in mouse sciatic nerve: biochemical analysis (a) Schematic of Crb3 isoforms, ERLI and CLPI, indicating the location of the transmembrane (TM), FRM binding (FB)
Tumor suppressor Spred2 interaction with LC3 promotes autophagosome maturation and induces autophagy-dependent cell death
 www.impactjournals.com/oncotarget/ Oncotarget, Supplementary Materials 2016 Tumor suppressor Spred2 interaction with LC3 promotes autophagosome maturation and induces autophagy-dependent cell death Supplementary
J. Cell Sci. 129: doi: /jcs : Supplementary information
 Movie 1. AgLDL is contained in small sub-regions of the lysosomal synapse that are acidic. J774 cells were incubated with agldl dual labeled with a ph sensitive and a ph insensitive fluorophore for 1 hr.
The Rab GTPase RabA4d Regulates Pollen Tube Tip Growth in Arabidopsis thaliana W
 The Plant Cell, Vol. 21: 526 544, February 2009, www.plantcell.org ã 2009 American Society of Plant Biologists The Rab GTPase RabA4d Regulates Pollen Tube Tip Growth in Arabidopsis thaliana W Amy L. Szumlanski
SUPPLEMENTARY INFORMATION. Supplementary Figures
 SUPPLEMENTARY INFORMATION Supplementary Figures Supplementary Figure 1: Characterization of CerTN-L15 expressed in Arabidopsis roots. a. Ratiometric images of CerTN-L15 in roots under osmotic stress Ratiometric
Nature Neuroscience: doi: /nn Supplementary Figure 1
 Supplementary Figure 1 Subcellular segregation of VGluT2-IR and TH-IR within the same VGluT2-TH axon (wild type rats). (a-e) Serial sections of a dual VGluT2-TH labeled axon. This axon (blue outline) has
Part 1 Multiple Choice Shade the correct answer on the SCANTRON sheet provided.
 Part 1 Multiple Choice Shade the correct answer on the SCANTRON sheet provided. 1. The type of electron microscope that gives 2 dimensional images. a) Scanning b) Condensing c) Transmission d) Multidimensional
Nature Structural & Molecular Biology: doi: /nsmb Supplementary Figure 1. Generation and validation of mtef4-knockout mice.
 Supplementary Figure 1 Generation and validation of mtef4-knockout mice. (a) Alignment of EF4 (E. coli) with mouse, yeast and human EF4. (b) Domain structures of mouse mtef4 compared to those of EF4 (E.
University of Groningen
 University of Groningen Mechanisms of Hemagglutinin Targeted Influenza Virus Neutralization Brandenburg, Boerries; Koudstaal, Wouter; Goudsmit, Jaap; Klaren, Vincent; Tang, Chan; Bujny, Miriam V.; Korse,
Supplementary Materials and Methods
 Supplementary Materials and Methods Immunoblotting Immunoblot analysis was performed as described previously (1). Due to high-molecular weight of MUC4 (~ 950 kda) and MUC1 (~ 250 kda) proteins, electrophoresis
Suppl. Figure 1. T 3 induces autophagic flux in hepatic cells. (A) RFP-GFP-LC3 transfected HepG2/TRα cells were visualized and cells were quantified
 RFP-GFP-LC3 transfected HepG2/TRα cells were visualized and cells were quantified") Suppl. Figure 1. T 3 induces autophagic flux in hepatic cells. (A) RFP-GFP-LC3 transfected HepG2/TRα cells were visualized and cells were quantified for RFP-LC3 puncta (red dots) representing both autolysosomes
Suppl. Figure 1. T 3 induces autophagic flux in hepatic cells. (A) RFP-GFP-LC3 transfected HepG2/TRα cells were visualized and cells were quantified for RFP-LC3 puncta (red dots) representing both autolysosomes
nature methods Organelle-specific, rapid induction of molecular activities and membrane tethering
 nature methods Organelle-specific, rapid induction of molecular activities and membrane tethering Toru Komatsu, Igor Kukelyansky, J Michael McCaffery, Tasuku Ueno, Lidenys C Varela & Takanari Inoue Supplementary
Figure S1. Standard curves for amino acid bioassays. (A) The standard curve for leucine concentration versus OD600 values for L. casei.
 The standard curve for leucine concentration versus OD600 values for L. casei.") Figure S1. Standard curves for amino acid bioassays. (A) The standard curve for leucine concentration versus OD600 values for L. casei. (B) The standard curve for lysine concentrations versus OD600 values
Figure S1. Standard curves for amino acid bioassays. (A) The standard curve for leucine concentration versus OD600 values for L. casei. (B) The standard curve for lysine concentrations versus OD600 values
Supplementary Figure 1. Nature Neuroscience: doi: /nn.4547
 Supplementary Figure 1 Characterization of the Microfetti mouse model. (a) Gating strategy for 8-color flow analysis of peripheral Ly-6C + monocytes from Microfetti mice 5-7 days after TAM treatment. Living
Supplemental Information. Figures. Figure S1
 Supplemental Information Figures Figure S1 Identification of JAGGER T-DNA insertions. A. Positions of T-DNA and Ds insertions in JAGGER are indicated by inverted triangles, the grey box represents the
TITLE: Fast-Track Development of Potato Clones with Pure Amylopectin Starch Used in the Paper, Textile and Food Industries by Using Induced Mutation.
 AGRICULTURAL RESEARCH FOUNDATION FINAL REPORT FUNDING CYCLE 2014 2016 TITLE: Fast-Track Development of Potato Clones with Pure Amylopectin Starch Used in the Paper, Textile and Food Industries by Using
CELL ORGANIZATION. Unit 19 LEARNING OBJECTIVES
 Unit 19 CELL ORGANIZATION LEARNING OBJECTIVES 1. Gain an appreciation for the small size of cells and the structures contained within the cell. 2. Learn about some of the ways one can study the parts of
T H E J O U R N A L O F C E L L B I O L O G Y
 Supplemental material Díaz et al., http://www.jcb.org/cgi/content/full/jcb.201209151/dc1 T H E J O U R N A L O F C E L L B I O L O G Y Figure S1. Hypoxia induces invadopodia formation in different epithelial
Temperature-Sensitive Mutants Isolated from Hamster and
 JOURNAL OF VIROLOGY, Nov. 1975, p. 1332-1336 Copyright i 1975 American Society for Microbiology Vol. 16, No. 5 Printed in U.S.A. Temperature-Sensitive Mutants Isolated from Hamster and Canine Cell Lines
Influenza virus exploits tunneling nanotubes for cell-to-cell spread
 Supplementary Information Influenza virus exploits tunneling nanotubes for cell-to-cell spread Amrita Kumar 1, Jin Hyang Kim 1, Priya Ranjan 1, Maureen G. Metcalfe 2, Weiping Cao 1, Margarita Mishina 1,
Figure S1. (A) SDS-PAGE separation of GST-fusion proteins purified from E.coli BL21 strain is shown. An equal amount of GST-tag control, LRRK2 LRR
 SDS-PAGE separation of GST-fusion proteins purified from E.coli BL21 strain is shown. An equal amount of GST-tag control, LRRK2 LRR") Figure S1. (A) SDS-PAGE separation of GST-fusion proteins purified from E.coli BL21 strain is shown. An equal amount of GST-tag control, LRRK2 LRR and LRRK2 WD40 GST fusion proteins (5 µg) were loaded
Figure S1. (A) SDS-PAGE separation of GST-fusion proteins purified from E.coli BL21 strain is shown. An equal amount of GST-tag control, LRRK2 LRR and LRRK2 WD40 GST fusion proteins (5 µg) were loaded
Lysosomes. Gr: lysis solution, soma body. Membrane bounded vesicles. Usually round ovoid or irregular electron dense bodies m.
 Lysosomes Gr: lysis solution, soma body Membrane bounded vesicles Usually round ovoid or irregular electron dense bodies 0.05 0.5 m. Lysosomes No. varies from a few to several hundred per cell, in different
Supplemental Information. Autophagy in Oncogenic K-Ras. Promotes Basal Extrusion. of Epithelial Cells by Degrading S1P. Current Biology, Volume 24
 Current Biology, Volume 24 Supplemental Information Autophagy in Oncogenic K-Ras Promotes Basal Extrusion of Epithelial Cells by Degrading S1P Gloria Slattum, Yapeng Gu, Roger Sabbadini, and Jody Rosenblatt
The N-end rule pathway regulates pathogen responses. in plants
 SUPPLEMENTARY INFORMATION The N-end rule pathway regulates pathogen responses in plants Rémi de Marchi 1,2, Maud Sorel 1, Brian Mooney 1, Isabelle Fudal 3, Kevin Goslin 1, Kamila Kwaśniewska 4, Patrick
Macrophages form functional vascular mimicry channels in vivo. SI Figures and Legend
 Macrophages form functional vascular mimicry channels in vivo Authors: *Faith H. Barnett, *Mauricio Rosenfeld, Malcolm Wood, William Kiosses, Yoshihiko Usui, Valentina Marchetti, Edith Aguilar, and Martin
Supplemental Materials Molecular Biology of the Cell
 Supplemental Materials Molecular Biology of the Cell Garcia-Alvarez et al. Supplementary Figure Legends Figure S1.Expression and RNAi-mediated silencing of STIM1 in hippocampal neurons (DIV, days in vitro).
Laboratory diagnosis of parasitic diseases. (Amoebiasis)
") Laboratory diagnosis of parasitic diseases (Amoebiasis) Sarah Alharbi Clinical Laboratory department Collage of Applied Medical Sciences King Saud University This document contains materials modified or
Laboratory diagnosis of parasitic diseases (Amoebiasis) Sarah Alharbi Clinical Laboratory department Collage of Applied Medical Sciences King Saud University This document contains materials modified or
CELL STRUCTURE AND CELL ORGANISATION
 CELL STRUCTURE AND CELL ORGANISATION CHAPTER 2 https://wickedbiology.wordpress.com Cellular components of animal & plant cells https://wickedbiology.wordpress.com Plant Cells Cell wall Plasma membrane
McWilliams et al., http :// /cgi /content /full /jcb /DC1
 Supplemental material JCB McWilliams et al., http ://www.jcb.org /cgi /content /full /jcb.201603039 /DC1 THE JOURNAL OF CELL BIOLOGY Figure S1. In vitro characterization of mito-qc. (A and B) Analysis
1. Arrows A, B, and C in the diagram below represent the processes necessary to make the energy stored in food available for muscle activity.
 1. Arrows A, B, and C in the diagram below represent the processes necessary to make the energy stored in food available for muscle activity. The correct sequence of processes represented by A, B, and
Supporting Information
 Supporting Information Dauvillée et al. 10.1073/pnas.0907424106 Fig. S1. Iodine screening of the C. cohnii mutant bank. Each single colony was grown on rich-medium agar plates then vaporized with iodine.
Plant Cell, Development & Ultrastructure
 PCDU Lecture Plant Cell, Development & Ultrastructure Plant Cell Biology Labs Download at: http://goo.gl/111tha Microtubules 13 Protofilamente 25nm Plant MT Cytoskeleton Animal MT cytoskeleton Preprophase
Supplementary Figure 1
 Supplementary Figure 1 Global TeNT expression effectively impairs synaptic transmission. Injection of 100 pg tent mrna leads to a reduction of vesicle mediated synaptic transmission in the spinal cord
SUPPLEMENTARY INFORMATION
 Figure S1 Induction of non-apoptotic death of SV40-transformed and primary DKO MEFs, and DKO thymocytes. (A-F) STS-induced non-apoptotic death of DKO MEF. (A, B) Reduced viability of DKO MEFs after exposure
JCB. Supplemental material. Gu et al.,
 Supplemental material Gu et al., http://www.jcb.org/cgi/content/full/jcb.201010075/dc1 T H E J O U R N A L O F C E L L B I O L O G Y Figure S1. S1P directly induces actin assembly. Actin assembly at the
Supplemental Figures:
 Supplemental Figures: Figure 1: Intracellular distribution of VWF by electron microscopy in human endothelial cells. a) Immunogold labeling of LC3 demonstrating an LC3-positive autophagosome (white arrow)
Expanded View Figures
 PEX13 functions in selective autophagy Ming Y Lee et al Expanded View Figures Figure EV1. PEX13 is required for Sindbis virophagy. A, B Quantification of mcherry-capsid puncta per cell (A) and GFP-LC3
OCR (A) Biology GCSE. Topic 1: Cell Level Systems
 Biology GCSE. Topic 1: Cell Level Systems") OCR (A) Biology GCSE Topic 1: Cell Level Systems Notes (Content in bold is for higher tier only) Cell structures Microscopes (1.1a and c) Light (optical) microscopes The specimen is placed onto a slide,
OCR (A) Biology GCSE Topic 1: Cell Level Systems Notes (Content in bold is for higher tier only) Cell structures Microscopes (1.1a and c) Light (optical) microscopes The specimen is placed onto a slide,
CAMBRIDGE INTERNATIONAL EXAMINATIONS General Certificate of Education Advanced Level
 Centre Number Candidate Number Name CAMBRIDGE INTERNATIONAL EXAMINATIONS General Certificate of Education Advanced Level BIOLOGY 9700/04 Paper 4 Structured Questions A2 Core Candidates answer on the Question
A Tour of the Cell. Chapter 6. Biology. Edited by Shawn Lester. Inner Life of Cell. Eighth Edition Neil Campbell and Jane Reece
 Chapter 6 A Tour of the Cell Inner Life of Cell Edited by Shawn Lester PowerPoint Lecture Presentations for Biology Eighth Edition Neil Campbell and Jane Reece Lectures by Chris Romero, updated by Erin
General Biology. The Fundamental Unit of Life The Cell. All organisms are made of cells The cell is the simplest collection of matter that can live
 General Biology Course No: BNG2003 Credits: 3.00 3. A Tour of the Cell Prof. Dr. Klaus Heese The Fundamental Unit of Life The Cell All organisms are made of cells The cell is the simplest collection of
A Tour of the Cell Chapter 4. Outline. Early contributors to Understanding Cells. Cell Theory. Cell Size s Matt Schleiden & Ted Schann
 A Tour of the Cell Chapter 4 Outline History of the science behind cells Cell theory & its importance Why are cells small? Microscopes Cell structure and function Prokaryotic cells Eukaryotic cells Early
Cell Processes Review
 1. Most green algae are able to obtain carbon dioxide from the environment and use it to synthesize organic compounds. This activity is an example of 1) hydrolysis 2) saprophytism 3) cellular respiration
Production of Exosomes in a Hollow Fiber Bioreactor
 Production of Exosomes in a Hollow Fiber Bioreactor John J S Cadwell, President and CEO, FiberCell Systems Inc INTRODUCTION Exosomes are small lipid membrane vesicles (80-120 nm) of endocytic origin generated
C) amount of carbon dioxide absorbed by the animal B) rate of respiration of the animal
 amount of carbon dioxide absorbed by the animal B) rate of respiration of the animal") Name: 1) A model of a section of a cell membrane is represented below. 4034-1 - Page 1 Which type of molecule is indicated by the arrow? A) carbohydrate B) protein C) lipid D) nucleotide 2) The movement
Name: 1) A model of a section of a cell membrane is represented below. 4034-1 - Page 1 Which type of molecule is indicated by the arrow? A) carbohydrate B) protein C) lipid D) nucleotide 2) The movement
Light triggers PILS-dependent reduction in nuclear auxin signalling for growth transition
 In the format provided y the authors and unedited. SUPPLEMENTARY INFORMATION VOLUME: 3 ARTICLE NUMBER: 217.15 Light triggers PILS-dependent reduction in nuclear auxin signalling for growth transition Chloé
Supplementary Figure 1. Gene expression analysis of GSNOR1 and NIA2 in genotypes with altered NO signalling. Relative expression of GSNOR1 in leaves
 Supplementary Figure 1. Gene expression analysis of GSNOR1 and NIA2 in genotypes with altered NO signalling. Relative expression of GSNOR1 in leaves (a) and roots (b) and NIA2 in leaves (c) and roots (d)
Supplemental Information. Otic Mesenchyme Cells Regulate. Spiral Ganglion Axon Fasciculation. through a Pou3f4/EphA4 Signaling Pathway
 Neuron, Volume 73 Supplemental Information Otic Mesenchyme Cells Regulate Spiral Ganglion Axon Fasciculation through a Pou3f4/EphA4 Signaling Pathway Thomas M. Coate, Steven Raft, Xiumei Zhao, Aimee K.
Supplementary Fig. S1. Schematic diagram of minigenome segments.
 open reading frame 1565 (segment 5) 47 (-) 3 5 (+) 76 101 125 149 173 197 221 246 287 open reading frame 890 (segment 8) 60 (-) 3 5 (+) 172 Supplementary Fig. S1. Schematic diagram of minigenome segments.
Cell Structure. Present in animal cell. Present in plant cell. Organelle. Function. strength, resist pressure created when water enters
 Cell Structure Though eukaryotic cells contain many organelles, it is important to know which are in plant cells, which are in animal cells and what their functions are. Organelle Present in plant cell
Pinwheels and Crystalline Structures Induced by Atropa Mild Mosaic Virus, a Plant Virus with Particles 925 nm. Long
 J. gen. Virol. (I970, xo, 71-78 Printed in Great BritMn 7I Pinwheels and Crystalline Structures Induced by Atropa Mild Mosaic Virus, a Plant Virus with Particles 925 nm. Long By B. D. HARRISON AND I. M.
3 Movement in and out of cells
 For more awesome GSE and level resources, visit us at www.savemyexams.co.uk/ Movement in and out of cells Question Paper Level IGSE Subject iology Exam oard ambridge International Examinations Unit 3 Movement
Session 2. TiLV isolation and Koch s Postulates
 Session 2 Win Surachetpong DVM, PhD, CertAqV, DTBVP Kathy Tang-Nelson PhD TiLV isolation and Koch s Postulates Learning objectives Describe how viruses are isolated Apply the appropriate method to the
Low Demand Questions QUESTIONSHEET 1 The diagrams show some organs in the human body.
 Low Demand Questions QUESTIONSHEET 1 The diagrams show some organs in the human body. (a) Name the organs labelled A, B, C, D and E. A.... [1] B.... [1] C.... [1] D.... [1] E.... [1] (b) Which of the organs
10/13/11. Cell Theory. Cell Structure
 Cell Structure Grade 12 Biology Cell Theory All organisms are composed of one or more cells. Cells are the smallest living units of all living organisms. Cells arise only by division of a previously existing
A mutant in Arabidopsis Lacking a Chloroplast Specific Lipid. Lewis Kurschner and Karen Thulasi Masters in Botany
 A mutant in Arabidopsis Lacking a Chloroplast Specific Lipid Lewis Kurschner and Karen Thulasi Masters in Botany Fatty acid nomenclature Fatty acyl composition Chain length Degree of unsaturation and position
3. Which cell has the greater ratio of surface area to volume?
 Chapter 4 Worksheet A Tour of the Cell Exercise 1 Metric System Review/Size and Scale of Our World (4.1) Use the information in the two modules and the chart in Module 4.2 to complete the following table
SUPPLEMENTARY FIG. S2. Representative counting fields used in quantification of the in vitro neural differentiation of pattern of dnscs.
 Supplementary Data SUPPLEMENTARY FIG. S1. Representative counting fields used in quantification of the in vitro neural differentiation of pattern of anpcs. A panel of lineage-specific markers were used
Nature Immunology: doi: /ni eee Supplementary Figure 1
 eee Supplementary Figure 1 Hyphae induce NET release, but yeast do not. (a) NET release by human peripheral neutrophils stimulated with a hgc1 yeast-locked C. albicans mutant (yeast) or pre-formed WT C.
The Microscopic World of Cells. The Microscopic World of Cells. The Microscopic World of Cells 9/21/2012
 Organisms are either: Single-celled, such as most prokaryotes and protists or Multicelled, such as plants, animals, and most fungi How do we study cells? Light microscopes can be used to explore the structures
A Tour of the Cell. Chapter 6. Biology Eighth Edition Neil Campbell and Jane Reece. PowerPoint Lecture Presentations for
 Chapter 6 A Tour of the Cell PowerPoint Lecture Presentations for Biology Eighth Edition Neil Campbell and Jane Reece Lectures by Chris Romero, updated by Erin Barley with contributions from Joan Sharp
UNIVERSITY OF CAMBRIDGE INTERNATIONAL EXAMINATIONS International General Certificate of Secondary Education
 UNIVERSITY OF CAMBRIDGE INTERNATIONAL EXAMINATIONS International General Certificate of Secondary Education *9254401758* BIOLOGY 0610/61 Paper 6 Alternative to Practical May/June 2011 1 hour Candidates