Perceptual constancy in auditory perception of distance to railway tracks a) Bert De Coensel b) Acoustics Group, Department of Information Technology,
|
|
|
- Charlene Nicholson
- 5 years ago
- Views:
Transcription
1 Perceptual constancy in auditory perception of distance to railway tracks a) Bert De Coensel b) Acoustics Group, Department of Information Technology, Ghent University, Belgium Mats E. Nilsson and Birgitta Berglund Gösta Ekman Laboratory for Sensory Research, Karolinska Institutet and Stockholm University, Sweden A. L. Brown Urban Research Program, Griffith School of Environment, Griffith University, Brisbane, Australia (Dated: March 31, 2013) a) Portions of this work were presented in Dwelling insulation as prior information in auditory distance perception of moving trains, Proceedings of Euronoise 2012, Prague, Czech Republic, June Perceptual constancy in auditory distance 1
2 Abstract Distance to a sound source can be accurately estimated solely from auditory information. With a sound source such as a train that is passing by at a relatively large distance, the most important auditory information for the listener for estimating its distance consists of the intensity of the sound, spectral changes in the sound caused by air absorption, and the motion-induced rate of change of intensity. However, these cues are relative, because prior information/experience of the sound source its source power, its spectrum and the typical speed at which it moves is required for such distance estimates. This paper describes two listening experiments that allow investigation of further prior contextual information taken into account by listeners viz whether they are indoors or outdoors. Asked to estimate the distance to the track of a railway, it is shown that listeners assesing sounds heard inside the dwelling based their distance estimates on the expected train passby sound level outdoors rather than on the passby sound level actually experienced indoors. This form of perceptual constancy may have consequences for the assessment of annoyance caused by railway noise. PACS numbers: Lj, Qp, Lj, Qp 2
3 I. INTRODUCTION The ability to accurately estimate the distance to a sound source solely based on auditory information, is an important component of human spatial hearing 1. At short range, perception of distance provides the listener with information for spatial navigation or for preparing evasive action 2, which may be important for survival in darkened environments or when objects are outside the field of view. As a consequence of the importance of this ability for self-preservation, a large part of past research into the perception and the neuronal representation 3 of auditory distance has focused on sound sources at relatively close distances from the head, up to a few meters. However, the distance to a sound source also plays an important role in effects on a larger spatial scale. For example, within several studies of community noise annoyance caused by railway noise, the distance to the railway track has been found to be a moderating factor 4,5. This may be explained, in part, by the rate of change in sound level caused by an approaching train, which is greater when the listener is located closer to the track. From an evolutionary perspective, sound sources that move towards the listener have a large biological saliency 6, and may evoke intense emotional responses 7. The goal of this paper is to extend our knowledge of the acoustical cues that play a role in the perceived auditory distance to outdoor sound sources that are moving at a relatively long range, as well as on the influence of prior information. It is well known that the auditory system uses several elements of acoustical information to estimate sound source distance 8. For stationary listeners and sound sources, the most important variables are the intensity of the sound 9, spectral changes due to air absorption 10 and, at close distance, interaural differences 11. Within enclosed environments with sound reflecting surfaces, important additional information is provided by the energy ratio of direct and reverberant sound 12 and spectral changes due to the acoustical properties of reflecting surfaces 13. When the sound source is moving, the motion-induced rate of change of intensity or rise speed may also provide the listener with distance information 14. In addition, when b) Electronic address: bert.decoensel@intec.ugent.be 3
4 the listener is moving, the change in direction of the sound source with respect to the change in direction of other stationary sources, or motion parallax, can be used to estimate sound source distance 15. Based on the above, it can be expected that the most important auditory information for estimating the distance to outdoor sound sources that are moving at long range, is formed by the intensity, the spectrum and the rate of change of intensity, of the sound. It is important to note that these auditory cues all depend on prior knowledge. In particular, prior information about the sound source such as its source power, its spectrum or the typical speed at which it moves, and about the context in which the listening occurs, are required to estimate distance to the source 16,17. The present study considered the particular case of a listener situated in an at-home context, who is asked to estimate the distance to the track of a railway, based solely on auditory information of the passing trains. In contrast to earlier work, in which virtual acoustics techniques have been applied to place sound sources at various distances 18,19, in this work, actual train passage recordings made in open field were used as experimental sounds. A first experiment (Section II.A) presented the baseline condition: participants were asked to estimate the distance to the railway track for train passages, binaurally recorded outdoors at varying distances from a railway, and presented through headphones. In a second experiment (Section II.B), the sound field of trains passing by at varying distance was reproduced through loudspeakers placed outside a house, while participants were seated inside the living room of the house. Results of both experiments are given in Section III from which conclusions are drawn on the particular acoustical cues that are used to estimate the distance to the track, as well as on the effect of prior contextual information about the dwelling. 4
5 II. METHODOLOGY A. Experiment 1 1. Experimental sounds The experimental sounds of the first experiment consisted of binaural recordings of train passages, made using a Brüel & Kjær type 4128C head and torso simulator (HATS), near a series of conventional railway tracks in The Netherlands and Austria, at varying distance from the track, and with trains driving at a wide range of speeds (but no highspeed trains). Recording locations were carefully selected on the basis of aerial photographs and visual inspection on the spot; only free field locations were selected where there were no buildings or noise barriers in the vicinity, and where there was either grassland or plowed agricultural field in between the microphone and the railway track. From the many train pass-by recordings available, the 25 passages of highest quality were selected (based on the absence of sound from other sources, thus eliminating non-train sources that might have provided a reference for the absolute level). Subsequently, sounds spanning the complete pass-by were created, with a duration ranging from 11 s to 75 s. An overview of the main acoustical parameters of the selected experimental sounds can be found in Table I. Figures 1 and 2 (diamond markers) show the actual distance to the railway track, as a function of two important known cues for auditory distance perception: sound intensity, as measured by the maximum A-weighted sound pressure level L Amax of the sounds (fast time weighting, with a time constant of 125 ms, is used throughout this paper), expressed in db(a), and rate of change, as measured by the rise speed v r (see below) of the sound level, expressed in db(a)/s. Note that the label L out Amax is used to stress that the level is measured in outdoor environment. From both figures, it can be concluded that for Experiment 1, v r contains less information about distance (Pearson s r = 0.56, p < 0.01, reducing to r = 0.32, p > 0.1 if the two trains at closest distance are excluded from the analysis) than sound intensity (Pearson s r = 0.82, p < 0.001). This may be due to the rise speed 5
6 log 10 ( d act [m]) Experiment 1 Experiment out L Amax [db(a)] FIG. 1. Actual distance to the railway track (d act ), as a function of L Amax as measured outdoors, for all experimental sounds of both experiments. being more affected by the combined effect of travelling speed of the train and the distance to the track, than the sound intensity. It could therefore be expected that sound intensity would be the main variable for estimating distance in Experiment 1. Furthermore, analysis pointed out a relatively low correlation (Pearson s r = 0.42, p < 0.05) between L out Amax and rise speed in Experiment 1. The procedure for calculating the rise speed of a train passage is illustrated in Figure 3. First, the timeseries of the continuous equivalent sound pressure level L Aeq,100ms of the passage is calculated with a time resolution of 100 ms. Subsequently, a sliding window is used to find the largest increase in sound level during 1 s. For the example of Figure 3, this amounts to about 15 db(a)/s. This procedure was found to be relatively robust, but nevertheless, calculated values were also checked visually. 2. Participants and apparatus Seventy-five listeners (36 females, 39 males), with self-reported normal hearing, participated in the experiment. The sample size was chosen to be as large as practically feasible. 6
7 log 10 ( d act [m]) Experiment 1 Experiment v r [db(a) / s] FIG. 2. Actual distance to the railway track (d act ), as a function of rise speed v r, for all experimental sounds of both experiments L Aeq,100ms [db(a)] time [s] FIG. 3. Illustration of the procedure used to calculate the rise speed of a train passage. In this case, v r 15 db(a)/s. The mean age of the listeners was 27.5 yr (s.d. = 9.1; range = 19 62); 80 % of the listeners reported that they were not exposed to railway noise at home. The listeners were tested individually. During the experiment, the participant was seated in a sound attenuating chamber. The 7
8 experimental sounds were presented through open-type headphones (Sennheiser HD435), combined with a subwoofer placed in the experiment room, in order to facilitate more accurate reproduction at low frequencies. The playback equipment was calibrated in 1/3- octave bands beforehand, using the HATS system. The experimental sounds, that is, outdoor recordings of train passages, were presented at the sound levels measured in open field and reported in Table I. The presentation and response collection were controlled by a computer program (a set of matlab scripts with graphical user interface); no visual image of the setting was shown. All instruction and tests were conducted in Dutch. 3. Procedure Before the start of the experiment, the participant was briefly informed about the experimental procedure, i.e. that he/she had to listen through headphones to the sound of train passages, and that he/she had to guess the distance to the railway track. Although outdoor recordings were to be presented, the participant was not explicitly instructed to pretend to be sitting outdoors. During the experiment, the participant was asked to provide an absolute estimate of the distance for a selection of sounds, by entering the distance (in m) on a numeric keypad. The participant was free to listen to each presented sound as many times as needed. Due to time constraints and limits caused by fatigue (the present test was part of a larger experiment, which had a duration of about 1 h for each participant), it was not feasible to present each of the 25 experimental sounds to each participant. Therefore, each participant was presented a sequence of 8 randomly selected sounds. Consequently, for each experimental sound, the auditory distance was estimated on average by 24 different participants. B. Experiment 2 The second experiment was part of a larger experiment on noise annoyance caused by different types of trains. A complete description of the methodology of this experiment 8
9 and the selection of participants can be found in a previous paper 20. Here, we will briefly summarize the methodology, with a focus on those parts that are most important for this work. 1. Experimental sounds In Experiment 2, the experimental sounds consisted of two-channel recordings of train pass-by noise, performed near a series of railway tracks in Belgium, France, The Netherlands and Germany. Recordings were made at varying distance from the track, and different types of trains were considered (conventional trains, high-speed trains and trains based on magnetic levitation), driving at various speeds ranging up to 400 km/h. All recordings for Experiment 2 were also performed in open space locations without noise barriers, selected according to the same principles as for Experiment 1. The 24 pass-by recordings of highest quality were selected, and sounds spanning the complete pass-by were created, each with a duration of 45 s. An overview of the main acoustical parameters of the selected experimental sounds can be found in Table II (outdoor values denoted with out). Figures 1 and 2 (rectangle markers) show the actual distance to the railway track, as a function of the L Amax (Pearson s r = 0.66, p < 0.001) and rise speed v r (Pearson s r = 0.45, p < 0.05) of the sounds. Note that the levels reported in previous work 20 are façade levels, which are approximately 3 db(a) higher than the outdoor free field levels given in Table II and shown in Figure 1. It can be seen that the range in L out Amax is similar to the range covered in Experiment 1, but the presence of high-speed trains obviously results in a larger number of trains with a high rise speed. Furthermore, analysis showed that L out Amax and rise speed were highly correlated in Experiment 2 (Pearson s r = 0.82, p < 0.001). 2. Participants and apparatus A group of 100 participants (49 females, 51 males), with self-reported normal hearing, was recruited to be representative of the Dutch population on factors such as age, gender, 9
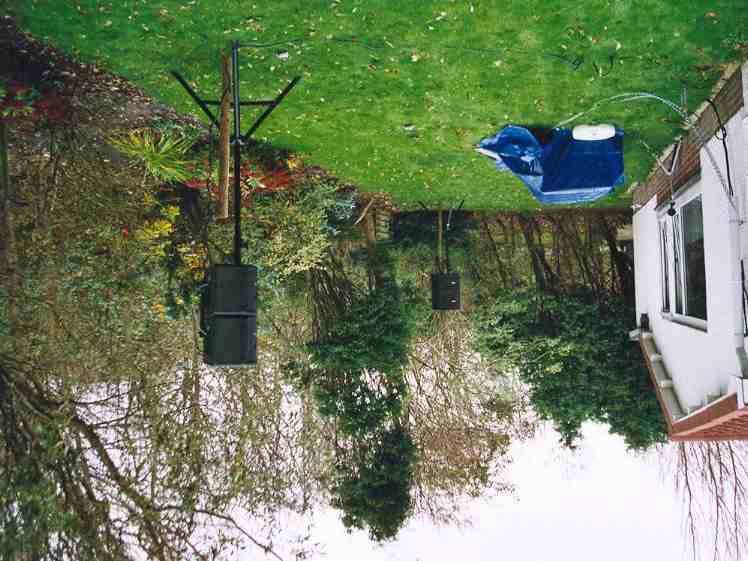
10 educational level, general health and noise sensitivity. The sample size was chosen to be as large as practically feasible. The mean age of the participants was 45.1 yr (s.d. = 13.4; range = 21 69); 69 % of the listeners reported that they were not exposed to railway noise at home, which corresponds to the nationwide average of the Dutch population 20. During the experiment, participants were seated in the living room of a house situated in a quiet environment, approximating a real-life at-home situation. In order to create a realistic indoor sound field, produced by a moving train outside the house, the experimental sounds were played back through 4 loudspeakers (stacked two by two) and a large subwoofer placed outside the house (invisible to the panelists). A sound level meter was placed outdoors in front of the façade of the living room, and the playback equipment was carefully calibrated in 1/3-octave bands, spanning the frequency range from 30 Hz to 16 khz, such that the sound levels measured at the façade corresponded to the measured sound levels in free field plus 3 db. During the experiments, one window of the living room was slightly opened, resulting in an insulation of the house of about 13 db(a), i.e. the difference between the level of the train passages outdoors (measured façade level minus 3 db) and indoors (measured using a HATS placed among the participants). Note that the living room was not square, not all walls were straight, and there was large furniture located against the walls; there were no indications that there would be a problem with room modes. A picture of the playback system is shown in Figure 4. The resulting sound levels inside the living room are given in Table II (indoor values denoted with in). In the remainder of this work, we will use L in Amax to explicitly refer to the sound levels as measured inside the living room. As in Experiment 1, the presentation of sounds was controlled through matlab. 3. Procedure The listening experiment was performed in sessions, during which four to six participants were seated in the living room of the house. A single session had a duration of about 4 h, and consisted of two parts. First, an experiment on annoyance caused by transportation 10
11 FIG. 4. (color online) Playback system used in Experiment 2. noise was carried out, in which participants performed daily activities such as reading a magazine or having a light conversation; results for this part are reported in earlier work 20. Second, a more conventional listening experiment was carried out, in which all sounds were presented sequentially, in random order, and in which perceived auditory distance to the track was assessed. After each train passage, the participants were asked to write down their impression of the distance (in m) from the house to the railway track on a sheet of paper. III. RESULTS A. Accuracy in estimated distance For each of the sounds of both experiments, the arithmetic mean, geometric mean and median of the estimated distances were calculated; values can be found in Tables I and II, together with the lower quartiles, upper quartiles and skewness of the distribution of distance estimates. It was found that, for both experiments, the distributions of distance estimates were strongly positively skewed. On average, the arithmetic means were larger than the medians by a factor of 2.0 for Experiment 1 and by a factor of 2.6 for Experiment 2. For 11
12 both experiments, the geometric mean and median perceived distance to the track showed the best correspondence with the actual distance (no significant difference between both measures is found); the arithmetic mean generally overestimated the actual distance. In the following analysis, median values will be used, in accordance with previous studies 17 ; the label m will be dropped from here on. Figure 5 shows the (logarithm of the) median perceived distance as a function of the (logarithm of the) actual distance, for all sounds of both experiments. A slightly better consistency in estimating distances is found for Experiment 1; Pearson s correlation between median perceived and actual distance is r = 0.89 for Experiment 1 and r = 0.64 for Experiment 2 (p < for both). Overall, the results show a more or less equal level of performance in estimating distances between both experiments. At the short end of the distance scale, the sounds presented in Experiment 1 were mainly estimated to be too near. On the other hand, the sounds presented in Experiment 2 were mainly estimated to be too far away. Experiment 2 had more trains with a high rise speed, thus, the existence of higher rise speeds did not make train passages sound nearer. Finally, it can be seen that there was negligible difference between experiments in terms of spread in perceived distance for a given actual distance, at least for all except the nearest actual distances. B. Influence of acoustical parameters Figure 6 shows, for all sounds of both experiments, the perceived auditory distance as a function of the maximum A-weighted sound pressure level, as measured at the location of the ear of the listener (L ear Amax, i.e. L out Amax for Experiment 1 and L in Amax for Experiment 2). The perceived auditory distance was found to be strongly negatively correlated to sound level; Pearson s correlation between median perceived distance and L ear Amax was r = 0.92 for Experiment 1 and r = 0.94 for Experiment 2 (p < for both). These results suggest that perceived loudness, as measured by L Amax, was the main variable used for distance assessment in both experiments. 12
13 log 10 ( d est [m]) Experiment 1 Experiment log ( 10 d act [m]) FIG. 5. Median perceived egocentric auditory distance (d est ) as a function of actual distance (d act ), for all sounds of both experiments. For equal sound levels, as presented at the ear of the listener, the sounds of Experiment 2 were perceived to be closer than those of Experiment 1, by almost one order of magnitude. One could argue that this may be due to spectral differences between the sounds of both experiments. However, the indoor sounds of Experiment 2 contained less energy at high frequencies because they had been filtered by the building envelope, and based on this argument, should have sounded further away at equal sound level. When results were plotted against outdoor levels, as shown in Figure 7, the difference between the results of both experiments disappeared. This suggests that the participants of Experiment 2 were taking into account the fact that they were listening to sounds that had been filtered by the dwelling, when estimating the distance based on sound level. In order to quantify the difference shown in Figure 6 between both experiments, a linear regression analysis was performed with L ear Amax as dependent variable, and the (logarithm of the) median perceived distance as independent variable, for the pooled data of both experiments. An independent-samples t-test (unequal sample sizes, unequal variance) was then conducted to compare the error terms of the estimated L ear Amax for both experiments. There was a significant difference between the error terms for the subset of data of Experiment 13
14 1 (mean = 4.18, s.d. = 5.46) and the subset of data of Experiment 2 (mean = 4.35, s.d. = 3.94), t(44) = 6.29 (p < 0.001), indicating a horizontal shift of 8.5 db(a) in Figure 6 between the data of both experiments. Finally, Figure 8 shows the perceived auditory distance as a function of the rise speed v r of the sounds. As expected, for Experiment 1, when the two train passages at close distance are not taken into account, there was no clear relationship between v r and perceived auditory distance. For Experiment 2, it was assumed that the rise speed measured inside the dwelling equals the rise speed measured outside the dwelling. In this case, a good correlation between d est and v r was found (Pearson s r = 0.85, Spearman s ρ = 0.94, p < for both), although the correlation with L out Amax was more linear and pronounced (Pearson s r = 0.95, Spearman s ρ = 0.98, p < for both). A sequential multiple linear regression analysis was performed with d est as dependent variable, and L out Amax and v r as independent variables. It was found that a model containing only L out Amax explained 90.0 % of variance in median auditory distance estimates. When v r was added as independent variable, the variance explained increased to 91.0 %, but the change in F-value was not significant (p > 0.1), so v r did not explain a significant additional amount of variance. IV. DISCUSSION AND CONCLUSIONS In this paper, two experiments were presented in which the distance to the track of passing trains had to be estimated, based only on auditory information. In the first experiment, train passages recorded outdoors were presented through headphones; in the second experiment, train passages were played back outside a house while the participants were seated inside the house. Although individual distance estimates showed high variability, median distance estimates were in good agreement with actual distances for both experiments. The effect of two important auditory cues that are known to influence perceived distance to outdoor sound sources that are moving at long range (maximum sound level and sound level rise speed) was investigated, and it was found, in both experiments, that the maximum sound 14
15 log 10 ( d est [m]) Experiment 1 Experiment ear L Amax [db(a)] FIG. 6. Median perceived egocentric auditory distance (d est ), as a function of L Amax at the location of the ear of the listener, for all sounds of both experiments log 10 ( d est [m]) Experiment 1 Experiment out L Amax [db(a)] FIG. 7. Median perceived egocentric auditory distance (d est ), as a function of L Amax as measured outdoors, for all sounds of both experiments. level explained most of the variance in estimated distance. However, of particular interest was the finding that, for equal maximum sound levels at the ear of the listeners, the trains in the second experiment were perceived to be closer than those in the first experiment, but 15
16 log 10 ( d est [m]) Experiment 1 Experiment v r [db(a) / s] FIG. 8. Median perceived egocentric auditory distance (d est ), as a function of rise speed v r, for all sounds of both experiments. when the oudoor levels of these train passages were examined, the differences disappeared. We suggest that this result could be explained as a form of perceptual constancy 21,22, whereby individuals base their distance estimates on the sound level they would expect to experience outside the dwelling, rather than on the sound level actually experienced indoors. The latter is, of course, lower as a result of the attenuation of the building envelope. Interestingly, similar perceptual constancy effects have been suggested in the case of noise annoyance, for changes in the sound level over time 23,24 as well as for judgements of the differences between indoor and outdoor sound levels 25. The authors acknowledge that differences in experimental sounds and reproduction techniques between both experiments could be considered to be confounding factors; therefore, much care was taken in the implementation of both experiments to avoid this possibility. Recording locations and experimental sounds were selected based on the same principles for both experiments. Subsequently, care was taken to achieve accurate reproduction (at-theear for the first experiment and at the façade for the second experiment), by calibrating the playback equipment in 1/3-octave bands. Consequently, differences between the at-the- 16
17 ear signals of both experiments are predominantly due to the attenuation of the building envelope and the effect of the room (i.e. due to being located indoors). For these reasons, it is argued that the observed at-the-ear level differences between sounds assessed equal in distance in both experiments is not attributable to differences in experimental sounds and reproduction techniques between the experiments. It is generally acknowledged that having access to both a quiet indoor and outdoor section of the dwelling is essential for general well-being 26. The results of this paper can thus be interpreted as additional justification of the use of façade levels to assess the effects of environmental noise in indoor situations 25. However, the indoor level still determines the probability that sounds originating outdoors are audible and noticed when inside, which is essential for annoyance to emerge 27. A comprehensive assessment of noise annoyance in indoor situations should therefore also account for the noticeability of sounds 28 ; once a sound is noticed, it may be appraised on the basis of the expected outdoor level and the information present in the sound 29, instead of the actual indoor level. Acknowledgments Bert De Coensel is a postdoctoral fellow of the Research Foundation Flanders (FWO Vlaanderen); the support of this organisation is gratefully acknowledged. The authors would also like to thank Peter Lercher for providing part of the sounds used in Experiment 1, and Gary J. Raw for providing information regarding the occurrence of perceptual constancy in noise annoyance. References 1 P. Zahorik, D. S. Brungart, and A. W. Bronkhorst, Auditory distance perception in humans: A summary of past and present research, Acta Acust. Acust. 91, (2005). 17
18 2 L. D. Rosenblum, A. P. Wuestefeld, and H. M. Saldaña, Auditory looming perception: Influences on anticipatory judgments, Perception 22, (1993). 3 M. S. A. Graziano, L. A. J. Reiss, and C. G. Gross, A neuronal representation of the location of nearby sounds, Nature 397, (1999). 4 T. Morihara, T. Sato, and T. Yano, Comparison of dose-response relationships between railway and road traffic noises: the moderating effect of distance, J. Sound Vib. 277, (2004). 5 A. Preis and R. Go lebiewski, Noise annoyance perception as a function of distance from a moving source, Noise Control Eng. J. 52, (2004). 6 J. G. Neuhoff, An adaptive bias in the perception of looming auditory motion, Ecol. Psychol. 13, (2001). 7 A. Tajadura-Jiménez, A. Väljamäe, E. Asutay, and D. Västfjäll, Embodied auditory perception: The emotional impact of approaching and receding sound sources, Emotion 10, (2010). 8 D. H. Mershon and J. N. Bowers, Absolute and relative cues for the auditory perception of egocentric distance, Perception 8, (1979). 9 P. D. Coleman, An analysis of cues to auditory depth perception in free space, Psychol. Bull. 60, (1963). 10 A. D. Little, D. H. Mershon, and P. H. Cox, Spectral content as a cue to perceived auditory distance, Perception 21, (1992). 11 D. S. Brungart, N. I. Durlach, and W. M. Rabinowitz, Auditory localization of nearby sources. II. Localization of a broadband source, J. Acoust. Soc. Am. 106, (1999). 12 Y.-C. Lu and M. Cooke, Binaural estimation of sound source distance via the directto-reverberant energy ratio for static and moving sources, IEEE Trans. Audio Speech Lang. Process. 18, (2010). 13 R. A. Butler, E. T. Levy, and W. D. Neff, Apparent distance of sounds recorded in echoic and anechoic chambers, J. Exp. Psychol. Hum. Percept. Perform. 6, (1980). 18
19 14 C. Pörschmann and C. Störig, Investigations into the velocity and distance perception of moving sound sources, Acta Acust. Acust. 95, (2009). 15 D. H. Ashmead, D. L. Davis, and A. Northington, Contribution of listeners approaching motion to auditory distance perception, J. Exp. Psychol. Hum. Percept. Perform. 21, (1995). 16 P. D. Coleman, Failure to localize the source distance of an unfamiliar sound, J. Acoust. Soc. Am. 34, (1962). 17 J. W. Philbeck and D. H. Mershon, Knowledge about typical source output influences perceived auditory distance, J. Acoust. Soc. Am. 111, (2002). 18 P. Zahorik, Assessing auditory distance perception using virtual acoustics, J. Acoust. Soc. Am. 111, (2002). 19 G. Kearney, M. Gorzel, H. Rice, and F. Boland, Distance perception in interactive virtual acoustic environments using first and higher order ambisonic sound fields, Acta Acust. Acust. 98, (2012). 20 B. De Coensel, D. Botteldooren, B. Berglund, M. E. Nilsson, T. De Muer, and P. Lercher, Experimental investigation of noise annoyance caused by high-speed trains, Acta Acust. Acust. 93, (2007). 21 P. Zahorik and F. L. Wightman, Loudness constancy with varying sound source distance, Nat. Neurosci. 4, (2001). 22 Y.-K. Min and D. H. Mershon, An adjacency effect in auditory distance perception, Acta Acust. Acust. 91, (2005). 23 G. J. Raw and I. D. Griffiths, Subjective response to changes in road traffic noise: A model, J. Sound Vib. 141, (1990). 24 A. L. Brown and I. van Kamp, Response to a change in transport noise exposure: Competing explanations of change effects, J. Acoust. Soc. Am. 125, (2009). 25 M. E. Nilsson and B. Berglund, Noise annoyance and activity disturbance before and after the erection of a roadside noise barrier, J. Acoust. Soc. Am. 119, (2006). 26 E. Öhrström, Longitudinal surveys on effects of changes in road traffic noise an- 19
20 noyance, activity disturbances, and psycho-social well-being, J. Acoust. Soc. Am. 115, (2004). 27 B. De Coensel, D. Botteldooren, T. De Muer, B. Berglund, M. E. Nilsson, and P. Lercher, A model for the perception of environmental sound based on notice-events, J. Acoust. Soc. Am. 126, (2009). 28 A. J. Torija, D. P. Ruiz, B. De Coensel, D. Botteldooren, B. Berglund, and A. Ramos- Ridao, Relationship between road and railway noise annoyance and overall indoor sound exposure, Transport. Res. D 16, (2011). 29 K. Genuit, The problem of predicting noise annoyance as a function of distance, in Proc. of the 17th International Conference on Acoustics (ICA), on CD-Rom (Rome, Italy) (2001). 20
21 List of Figures Figure 1: Actual distance to the railway track (d act ), as a function of L Amax as measured outdoors, for all experimental sounds of both experiments. Figure 2: Actual distance to the railway track (d act ), as a function of rise speed v r, for all experimental sounds of both experiments. Figure 3: Illustration of the procedure used to calculate the rise speed of a train passage. In this case, v r 15 db(a)/s. Figure 4: (color online) Playback system used in Experiment 2. Figure 5: Median perceived egocentric auditory distance (d est ) as a function of actual distance (d act ), for all sounds of both experiments. Figure 6: Median perceived egocentric auditory distance (d est ), as a function of L Amax at the location of the ear of the listener, for all sounds of both experiments. Figure 7: Median perceived egocentric auditory distance (d est ), as a function of L Amax as measured outdoors, for all sounds of both experiments. Figure 8: Median perceived egocentric auditory distance (d est ), as a function of rise speed v r, for all sounds of both experiments. 21
22 TABLE I. Maximum sound pressure level (L Amax ) and rise speed (v r ) of the experimental sounds of Experiment 1 (energetic averages between left and right ear), as measured outdoor (denoted with out), together with the actual distance (d act ) to the track, the perceived auditory distance (d est ) to the track (a = arithetic average, g = geometric average, l = lower quartile, m = median and u = upper quartile of estimates), and the skewness (γ est ) of the distribution of distance estimates (adjusted Fisher-Pearson standardized moment coefficient). Sound L out Amax v r d act d a est d g est d l est d m est d u est γ est [db(a)] [db(a)/s] [m] [m] [m] [m] [m] [m]
23
24 TABLE II. Maximum sound pressure level (L Amax ) and rise speed (v r ) of the experimental sounds of Experiment 2 (energetic averages between left and right ear), as measured outdoor (denoted with out) as well as indoor (denoted with in), together with the actual distance (d act ) to the track, the perceived auditory distance (d est ) to the track (a = arithetic average, g = geometric average, l = lower quartile, m = median and u = upper quartile of estimates), and the skewness (γ est ) of the distribution of distance estimates (adjusted Fisher-Pearson standardized moment coefficient). Sound L out Amax L in Amax v r d act d a est d g est d l est d m est d u est γ est [db(a)] [db(a)] [db(a)/s] [m] [m] [m] [m] [m] [m]
25
26 log ( [m]) 10 d act Experiment 1 Experiment out L Amax [db(a)]
27 log ( [m]) 10 d act Experiment 1 Experiment v r [db(a) / s]
28 80 75 L Aeq,100ms [db(a)] time [s]
29
30 log ( [m]) 10 d est Experiment 1 Experiment log ( [m]) 10 d act
31 log ( [m]) 10 d est Experiment 1 Experiment ear L Amax [db(a)]
32 log ( [m]) 10 d est Experiment 1 Experiment out L Amax [db(a)]
33 log ( [m]) 10 d est Experiment 1 Experiment v r [db(a) / s]
Perceptual constancy in auditory perception of distance to railway tracks
 Perceptual constancy in auditory perception of distance to railway tracks Author De Coensel, Bert, E. Nilsson, Mats, Berglund, Birgitta, Brown, Lex Published 2013 Journal Title Journal of the Acoustical
EXPERIMENTAL INVESTIGATION OF NOISE ANNOYANCE CAUSED BY HIGH-SPEED TRAINS
 Twelfth International Congress on Sound and Vibration EXPERIMENTAL INVESTIGATION OF NOISE ANNOYANCE CAUSED BY HIGH-SPEED TRAINS Dick Botteldooren, Bert De Coensel and Tom De Muer Acoustics Group, Dept.
Trading Directional Accuracy for Realism in a Virtual Auditory Display
 Trading Directional Accuracy for Realism in a Virtual Auditory Display Barbara G. Shinn-Cunningham, I-Fan Lin, and Tim Streeter Hearing Research Center, Boston University 677 Beacon St., Boston, MA 02215
Modeling task interference caused by traffic noise: results from a perception experiment
 Modeling task interference caused by traffic noise: results from a perception experiment Jonathan Terroir 1, Bert De Coensel 2, Dick Botteldooren 3, and Catherine Lavandier 4 1,4 Laboratoire Mobilités
The role of low frequency components in median plane localization
 Acoust. Sci. & Tech. 24, 2 (23) PAPER The role of low components in median plane localization Masayuki Morimoto 1;, Motoki Yairi 1, Kazuhiro Iida 2 and Motokuni Itoh 1 1 Environmental Acoustics Laboratory,
3-D Sound and Spatial Audio. What do these terms mean?
 3-D Sound and Spatial Audio What do these terms mean? Both terms are very general. 3-D sound usually implies the perception of point sources in 3-D space (could also be 2-D plane) whether the audio reproduction
Effect of spectral content and learning on auditory distance perception
 Effect of spectral content and learning on auditory distance perception Norbert Kopčo 1,2, Dávid Čeljuska 1, Miroslav Puszta 1, Michal Raček 1 a Martin Sarnovský 1 1 Department of Cybernetics and AI, Technical
inter.noise 2000 The 29th International Congress and Exhibition on Noise Control Engineering August 2000, Nice, FRANCE
 Copyright SFA - InterNoise 2000 1 inter.noise 2000 The 29th International Congress and Exhibition on Noise Control Engineering 27-30 August 2000, Nice, FRANCE I-INCE Classification: 6.3 PSYCHOLOGICAL EVALUATION
IN EAR TO OUT THERE: A MAGNITUDE BASED PARAMETERIZATION SCHEME FOR SOUND SOURCE EXTERNALIZATION. Griffin D. Romigh, Brian D. Simpson, Nandini Iyer
 IN EAR TO OUT THERE: A MAGNITUDE BASED PARAMETERIZATION SCHEME FOR SOUND SOURCE EXTERNALIZATION Griffin D. Romigh, Brian D. Simpson, Nandini Iyer 711th Human Performance Wing Air Force Research Laboratory
Binaural Hearing. Why two ears? Definitions
 Binaural Hearing Why two ears? Locating sounds in space: acuity is poorer than in vision by up to two orders of magnitude, but extends in all directions. Role in alerting and orienting? Separating sound
How the meaning a person gives to tranquility could affect the appraisal of the urban park soundscape
 How the meaning a person gives to tranquility could affect the appraisal of the urban park soundscape Dick BOTTELDOOREN; Karlo FILIPAN; Michiel BOES; Bert DE COENSEL Ghent University, Belgium ABSTRACT
Modeling the role of attention in the assessment of environmental noise annoyance
 Modeling the role of attention in the assessment of environmental noise annoyance Dick Botteldooren 1*, Bert De Coensel 1, Birgitta Berglund 2, Mats E. Nilsson 2, Peter Lercher 3 1 Acoustics Group, Department
The development of a modified spectral ripple test
 The development of a modified spectral ripple test Justin M. Aronoff a) and David M. Landsberger Communication and Neuroscience Division, House Research Institute, 2100 West 3rd Street, Los Angeles, California
Evaluation of noise barriers for soundscape perception through laboratory experiments
 Evaluation of noise barriers for soundscape perception through laboratory experiments Joo Young Hong, Hyung Suk Jang, Jin Yong Jeon To cite this version: Joo Young Hong, Hyung Suk Jang, Jin Yong Jeon.
Influence of temporal structure of the sonic environment on annoyance
 Influence of temporal structure of the sonic environment on annoyance A. Bockstael 1, B. De Coensel 1, P. Lercher 2, D. Botteldooren 1 1 2 Ghent University, Department of Information technology, Acoustics
The Residence Inn Hotel at 2 nd and Mace
 Environmental Noise Assessment The Residence Inn Hotel at 2 nd and Mace Davis, California BAC Job # 2016-095 Prepared For: Jackson Properties Mr. Eric Edelmayer 155 Cadillac Dr., Ste. 100 Sacramento, CA
The basic mechanisms of directional sound localization are well documented. In the horizontal plane, interaural difference INTRODUCTION I.
 Auditory localization of nearby sources. II. Localization of a broadband source Douglas S. Brungart, a) Nathaniel I. Durlach, and William M. Rabinowitz b) Research Laboratory of Electronics, Massachusetts
Indoor Noise Annoyance Due to Transportation Noise
 Indoor Noise Annoyance Due to Transportation Noise Hyeon Ku Park* 1 1 Professor, Department of Architectural Engineering, Songwon University, Korea Abstract This study examined the relationship between
TOPICS IN AMPLIFICATION
 August 2011 Directional modalities Directional Microphone Technology in Oasis 14.0 and Applications for Use Directional microphones are among the most important features found on hearing instruments today.
Perception of tonal components contained in wind turbine noise
 Perception of tonal components contained in wind turbine noise Sakae YOKOYAMA 1 ; Tomohiro KOBAYASHI 2 ; Hideki TACHIBANA 3 1,2 Kobayasi Institute of Physical Research, Japan 3 The University of Tokyo,
Proceedings of Meetings on Acoustics
 Proceedings of Meetings on Acoustics Volume 19, 2013 http://acousticalsociety.org/ ICA 2013 Montreal Montreal, Canada 2-7 June 2013 Psychological and Physiological Acoustics Session 4aPPb: Binaural Hearing
The effect of wearing conventional and level-dependent hearing protectors on speech production in noise and quiet
 The effect of wearing conventional and level-dependent hearing protectors on speech production in noise and quiet Ghazaleh Vaziri Christian Giguère Hilmi R. Dajani Nicolas Ellaham Annual National Hearing
19 th INTERNATIONAL CONGRESS ON ACOUSTICS MADRID, 2-7 SEPTEMBER 2007 THE DUPLEX-THEORY OF LOCALIZATION INVESTIGATED UNDER NATURAL CONDITIONS
 19 th INTERNATIONAL CONGRESS ON ACOUSTICS MADRID, 2-7 SEPTEMBER 27 THE DUPLEX-THEORY OF LOCALIZATION INVESTIGATED UNDER NATURAL CONDITIONS PACS: 43.66.Pn Seeber, Bernhard U. Auditory Perception Lab, Dept.
Perceptual Plasticity in Spatial Auditory Displays
 Perceptual Plasticity in Spatial Auditory Displays BARBARA G. SHINN-CUNNINGHAM, TIMOTHY STREETER, and JEAN-FRANÇOIS GYSS Hearing Research Center, Boston University Often, virtual acoustic environments
Identifying and recognizing noticeable sounds from physical measurements and their effect on soundscape
 Identifying and recognizing noticeable sounds from physical measurements and their effect on soundscape Karlo Filipan, Michiel Boes, Bert De Coensel Department of Information Technology, Ghent University,
The influence of binaural incoherence on annoyance reported for unpleasant low frequency sound
 The influence of binaural incoherence on annoyance reported for unpleasant low frequency sound Meisha Stevens (1), William L Martens (2) (1) Wood and Grieve Engineers, Sydney, Australia (2) School of Architecture,
The influence of audio-visual aptitude on audio-visual interaction in appraisal of the environment
 12th ICBEN Congress on Noise as a Public Health Problem The influence of audio-visual aptitude on audio-visual interaction in appraisal of the environment Dick Botteldooren 1, Kang Sun 1, Gemma Maria Echevarria
ICaD 2013 ADJUSTING THE PERCEIVED DISTANCE OF VIRTUAL SPEECH SOURCES BY MODIFYING BINAURAL ROOM IMPULSE RESPONSES
 ICaD 213 6 1 july, 213, Łódź, Poland international Conference on auditory Display ADJUSTING THE PERCEIVED DISTANCE OF VIRTUAL SPEECH SOURCES BY MODIFYING BINAURAL ROOM IMPULSE RESPONSES Robert Albrecht
Speech segregation in rooms: Effects of reverberation on both target and interferer
 Speech segregation in rooms: Effects of reverberation on both target and interferer Mathieu Lavandier a and John F. Culling School of Psychology, Cardiff University, Tower Building, Park Place, Cardiff,
Semantic assessment of water features used over road traffic noise Calarco, Francesca Maria Assunta; Galbrun, Laurent
 Heriot-Watt University Heriot-Watt University Research Gateway Semantic assessment of water features used over road traffic noise Calarco, Francesca Maria Assunta; Galbrun, Laurent Publication date: 2014
An active unpleasantness control system for indoor noise based on auditory masking
 An active unpleasantness control system for indoor noise based on auditory masking Daisuke Ikefuji, Masato Nakayama, Takanabu Nishiura and Yoich Yamashita Graduate School of Information Science and Engineering,
MAPPING ON INTERNAL AND EXTERNAL NOISE LEVELS
 A WRITE UP ON MAPPING ON INTERNAL AND EXTERNAL NOISE LEVELS BY ADEBIYI-WILLIAMS YETUNDE (ARC/09/7342) & ADEKUNLE ELIZABETH TOLUSE (ARC/09/7345) SUBMITTED TO THE DEPARTMENT OF ARCHITECTURE, SCHOOL OF ENVIRONMENTAL
Binaural Hearing. Steve Colburn Boston University
 Binaural Hearing Steve Colburn Boston University Outline Why do we (and many other animals) have two ears? What are the major advantages? What is the observed behavior? How do we accomplish this physiologically?
Sound localization psychophysics
 Sound localization psychophysics Eric Young A good reference: B.C.J. Moore An Introduction to the Psychology of Hearing Chapter 7, Space Perception. Elsevier, Amsterdam, pp. 233-267 (2004). Sound localization:
Impact of the ambient sound level on the system's measurements CAPA
 Impact of the ambient sound level on the system's measurements CAPA Jean Sébastien Niel December 212 CAPA is software used for the monitoring of the Attenuation of hearing protectors. This study will investigate
PERCEPTION OF URGENCY AND SPATIALIZATION OF AUDITORY ALARMS. A. Guillaume, M. Rivenez, G. Andéol and L. Pellieux
 PERCEPTION OF URGENCY AND SPATIALIZATION OF AUDITORY ALARMS A. Guillaume, M. Rivenez, G. Andéol and L. Pellieux Institut de médecine aérospatiale du service de santé des armées Département de sciences
Abstract. 1. Introduction. David Spargo 1, William L. Martens 2, and Densil Cabrera 3
 THE INFLUENCE OF ROOM REFLECTIONS ON SUBWOOFER REPRODUCTION IN A SMALL ROOM: BINAURAL INTERACTIONS PREDICT PERCEIVED LATERAL ANGLE OF PERCUSSIVE LOW- FREQUENCY MUSICAL TONES Abstract David Spargo 1, William
Study of perceptual balance for binaural dichotic presentation
 Paper No. 556 Proceedings of 20 th International Congress on Acoustics, ICA 2010 23-27 August 2010, Sydney, Australia Study of perceptual balance for binaural dichotic presentation Pandurangarao N. Kulkarni
INTRODUCTION J. Acoust. Soc. Am. 103 (2), February /98/103(2)/1080/5/$ Acoustical Society of America 1080
, February /98/103(2)/1080/5/$ Acoustical Society of America 1080") Perceptual segregation of a harmonic from a vowel by interaural time difference in conjunction with mistuning and onset asynchrony C. J. Darwin and R. W. Hukin Experimental Psychology, University of Sussex,
Perceptual segregation of a harmonic from a vowel by interaural time difference in conjunction with mistuning and onset asynchrony C. J. Darwin and R. W. Hukin Experimental Psychology, University of Sussex,
Acoustical Quality Assessment of Lecture halls at Lund University, Sweden
 Acoustical Quality Assessment of Lecture halls at Lund University, Sweden Rabab S.YOUSSEF 1 ; Delphine BARD 2 ; Abd El Fattah A. MAHMOUD 3 ; Nahed M. ESA 4 1, 3 National Institute for Standards (NIS),
Brian D. Simpson Veridian, 5200 Springfield Pike, Suite 200, Dayton, Ohio 45431
 The effects of spatial separation in distance on the informational and energetic masking of a nearby speech signal Douglas S. Brungart a) Air Force Research Laboratory, 2610 Seventh Street, Wright-Patterson
A LABORATORY STUDY OF SUBJECTIVE ANNOYANCE RESPONSE TO SONIC BOOMS AND AIRCRAFT FLYOVERS. Jack D. Leatherwood and Brenda M.
 A LABORATORY STUDY OF SUBJECTIVE ANNOYANCE RESPONSE TO SONIC BOOMS AND AIRCRAFT FLYOVERS By Jack D. Leatherwood and Brenda M. Sullivan Three experiments were conducted to determine subjective equivalence
Variation in spectral-shape discrimination weighting functions at different stimulus levels and signal strengths
 Variation in spectral-shape discrimination weighting functions at different stimulus levels and signal strengths Jennifer J. Lentz a Department of Speech and Hearing Sciences, Indiana University, Bloomington,
Noise-Robust Speech Recognition in a Car Environment Based on the Acoustic Features of Car Interior Noise
 4 Special Issue Speech-Based Interfaces in Vehicles Research Report Noise-Robust Speech Recognition in a Car Environment Based on the Acoustic Features of Car Interior Noise Hiroyuki Hoshino Abstract This
A NOVEL HEAD-RELATED TRANSFER FUNCTION MODEL BASED ON SPECTRAL AND INTERAURAL DIFFERENCE CUES
 A NOVEL HEAD-RELATED TRANSFER FUNCTION MODEL BASED ON SPECTRAL AND INTERAURAL DIFFERENCE CUES Kazuhiro IIDA, Motokuni ITOH AV Core Technology Development Center, Matsushita Electric Industrial Co., Ltd.
CLASSROOM AMPLIFICATION: WHO CARES? AND WHY SHOULD WE? James Blair and Jeffery Larsen Utah State University ASHA, San Diego, 2011
 CLASSROOM AMPLIFICATION: WHO CARES? AND WHY SHOULD WE? James Blair and Jeffery Larsen Utah State University ASHA, San Diego, 2011 What we know Classroom amplification has been reported to be an advantage
Speech Intelligibility Measurements in Auditorium
 Vol. 118 (2010) ACTA PHYSICA POLONICA A No. 1 Acoustic and Biomedical Engineering Speech Intelligibility Measurements in Auditorium K. Leo Faculty of Physics and Applied Mathematics, Technical University
3-D SOUND IMAGE LOCALIZATION BY INTERAURAL DIFFERENCES AND THE MEDIAN PLANE HRTF. Masayuki Morimoto Motokuni Itoh Kazuhiro Iida
 3-D SOUND IMAGE LOCALIZATION BY INTERAURAL DIFFERENCES AND THE MEDIAN PLANE HRTF Masayuki Morimoto Motokuni Itoh Kazuhiro Iida Kobe University Environmental Acoustics Laboratory Rokko, Nada, Kobe, 657-8501,
Soundwalk for evaluating community noise annoyance in urban spaces
 Soundwalk for evaluating community noise annoyance in urban spaces Pyoung Jik Lee, Jin Yong Jeon * Department of Architectural engineering, Hanyang university, Seoul, 133-791, Korea * corresponding author:
Influence of Visual Information on Subjective Evaluation of Road Traffic Noise
 Influence of Visual Information on Subjective Evaluation of Road Traffic Noise Yasunobu TOKUNAGA 1 ; Takane TERASHIMA 2 ; Ayumi ISHIKAWA 3 1 Maizuru National College of Technology, Japan 2, 3 Graduate
Methods of validation of occupational noise exposure measurement with multi aspect personal sound exposure meter
 Proceedings of ACOUSTICS 2016 Methods of validation of occupational noise exposure measurement with multi aspect personal sound exposure meter Marek Podgórski Svantek Sp. z o.o., Warsaw, Poland ABSTRACT
Detectability and hearing impression of additional warning sounds for electric or hybrid vehicles
 Detectability and hearing impression of additional warning sounds for electric or hybrid vehicles Katsuya YAMAUCHI 1 ; Takaichi SANO 2 ; Shin HASEGAWA 2 ; Fumio TAMURA 2 ; Yuichiro TAKEDA 2 1 Faculty of
Technical Discussion HUSHCORE Acoustical Products & Systems
 What Is Noise? Noise is unwanted sound which may be hazardous to health, interfere with speech and verbal communications or is otherwise disturbing, irritating or annoying. What Is Sound? Sound is defined
Minimum Audible Angles Measured with Simulated Normally-Sized and Oversized Pinnas for Normal-Hearing and Hearing- Impaired Test Subjects
 Minimum Audible Angles Measured with Simulated Normally-Sized and Oversized Pinnas for Normal-Hearing and Hearing- Impaired Test Subjects Filip M. Rønne, Søren Laugesen, Niels S. Jensen and Julie H. Pedersen
USING AUDITORY SALIENCY TO UNDERSTAND COMPLEX AUDITORY SCENES
 USING AUDITORY SALIENCY TO UNDERSTAND COMPLEX AUDITORY SCENES Varinthira Duangudom and David V Anderson School of Electrical and Computer Engineering, Georgia Institute of Technology Atlanta, GA 30332
Influence of music-induced floor vibration on impression of music in concert halls
 Buenos Aires 5 to 9 September, 216 PROCEEDINGS of the 22 nd International Congress on Acoustics Concert Hall Acoustics: Paper ICA216-694 Influence of music-induced floor vibration on impression of music
IS THERE A STARTING POINT IN THE NOISE LEVEL FOR THE LOMBARD EFFECT?
 IS THERE A STARTING POINT IN THE NOISE LEVEL FOR THE LOMBARD EFFECT? Pasquale Bottalico, Ivano Ipsaro Passione, Simone Graetzer, Eric J. Hunter Communicative Sciences and Disorders, Michigan State University,
HCS 7367 Speech Perception
 Long-term spectrum of speech HCS 7367 Speech Perception Connected speech Absolute threshold Males Dr. Peter Assmann Fall 212 Females Long-term spectrum of speech Vowels Males Females 2) Absolute threshold
An algorithm modelling the Irrelevant Sound Effect (ISE)
") An algorithm modelling the Irrelevant Sound Effect (ISE) S. J. Schlittmeier a, T. Weissgerber b, S. Kerber b, H. Fastl b and J. Hellbrueck a a Work, Environmental and Health Psychology, Catholic University
An algorithm modelling the Irrelevant Sound Effect (ISE) S. J. Schlittmeier a, T. Weissgerber b, S. Kerber b, H. Fastl b and J. Hellbrueck a a Work, Environmental and Health Psychology, Catholic University
Noise annoyance indicators for various industrial noise sources: Results and Discussion
 Noise annoyance indicators for various industrial noise sources: Results and Discussion M. Alayrac a, S. Viollon a and C. Marquis-Favre b a EDF R&D, 1 avenue général de Gaulle, 92141 Clamart Cedex, France
Supplement. Aircraft Noise Terminology & Metric
 Aircraft Noise Terminology & Metric Supplement San Francisco International Airport Noise Abatement Office P.O. Box 8097 San Francisco, CA 94128 (650) 821 5100 2014 Page 1 Aircraft Noise Terminology & Metric
Train noise - A psychoacoustic investigation for indoor aural comfort in high-rise urban environment in the tropics
 Train noise - A psychoacoustic investigation for indoor aural comfort in high-rise urban environment in the tropics ABSTRACT Mahbub Alam SHEIKH 1 ; Siew Eang LEE 2 National University of Singapore, Singapore
An Examination on Required Sound Levels for Acoustic Warning Devices for Quiet Vehicles
 QRTV, UN/ECE/WP.29, Berlin 27-29 Sep., 2010 An Examination on Required Sound Levels for Acoustic Warning Devices for Quiet Vehicles Katsuya Yamauchi Assistant Professor, Faculty of Engineering, Nagasaki
Communication with low-cost hearing protectors: hear, see and believe
 12th ICBEN Congress on Noise as a Public Health Problem Communication with low-cost hearing protectors: hear, see and believe Annelies Bockstael 1,3, Lies De Clercq 2, Dick Botteldooren 3 1 Université
CONTRIBUTION OF DIRECTIONAL ENERGY COMPONENTS OF LATE SOUND TO LISTENER ENVELOPMENT
 CONTRIBUTION OF DIRECTIONAL ENERGY COMPONENTS OF LATE SOUND TO LISTENER ENVELOPMENT PACS:..Hy Furuya, Hiroshi ; Wakuda, Akiko ; Anai, Ken ; Fujimoto, Kazutoshi Faculty of Engineering, Kyushu Kyoritsu University
Proceedings of Meetings on Acoustics
 Proceedings of Meetings on Acoustics Volume 19, 2013 http://acousticalsociety.org/ ICA 2013 Montreal Montreal, Canada 2-7 June 2013 Speech Communication Session 4aSCb: Voice and F0 Across Tasks (Poster
Low Frequency Noise and Its Assessment and Evaluation
 ARCHIVES OF ACOUSTICS Vol. 38, No. 2, pp. 265 270 (2013) Copyright c 2013 by PAN IPPT DOI: 10.2478/aoa-2013-0032 Low Frequency Noise and Its Assessment and Evaluation Stanislav ŽIARAN Faculty of Mechanical
Annoyance due to railway noise and vibration: A comparison of two methods of collecting annoyance scores
 12th ICBEN Congress on Noise as a Public Health Problem Annoyance due to railway noise and vibration: A comparison of two methods of collecting annoyance scores Philéas Maigrot 1, Catherine Marquis-Favre
Reference: Mark S. Sanders and Ernest J. McCormick. Human Factors Engineering and Design. McGRAW-HILL, 7 TH Edition. NOISE
 NOISE NOISE: It is considered in an information-theory context, as that auditory stimulus or stimuli bearing no informational relationship to the presence or completion of the immediate task. Human ear
Review of Methods for Quantifying Tonalness in Noise. Quantifying Tonalness
 Review of Methods for Quantifying Tonalness in Noise TC 2.6 Hot Topic Albuquerque, NM June 27, 2010 Lily M. Wang, PhD, PE, FASA Durham School of Architectural Engineering and Construction University of
Community response to Shinkansen noise and vibration: a survey in areas along the Sanyo Shinkansen Line
 Community response to noise and vibration: a survey in areas along the Sanyo Line Takashi Yano Kumamoto University, Kurokami, 2-39-1, Kumamoto 860-8555, Japan, yano@gpo.kumamoto-u.ac.jp, Takashi Morihara
Prominence of impulses from road bridge expansion joints
 Prominence of impulses from road bridge expansion joints Torben Holm Pedersen SenseLab, DELTA a part of FORCE Technology, Hørsholm, Denmark. Per Finne Acoustics, DELTA a part of FORCE Technology, Hørsholm,
Systems Neuroscience Oct. 16, Auditory system. http:
 Systems Neuroscience Oct. 16, 2018 Auditory system http: www.ini.unizh.ch/~kiper/system_neurosci.html The physics of sound Measuring sound intensity We are sensitive to an enormous range of intensities,
How the LIVELab helped us evaluate the benefits of SpeechPro with Spatial Awareness
 How the LIVELab helped us evaluate the benefits of SpeechPro with Author Donald Hayes, Ph.D. Director, Clinical Research Favorite sound: Blues guitar A Sonova brand Figure The LIVELab at McMaster University
EFFECTS OF TEMPORAL FINE STRUCTURE ON THE LOCALIZATION OF BROADBAND SOUNDS: POTENTIAL IMPLICATIONS FOR THE DESIGN OF SPATIAL AUDIO DISPLAYS
 Proceedings of the 14 International Conference on Auditory Display, Paris, France June 24-27, 28 EFFECTS OF TEMPORAL FINE STRUCTURE ON THE LOCALIZATION OF BROADBAND SOUNDS: POTENTIAL IMPLICATIONS FOR THE
Colin Cobbing ARM Acoustics
 Colin Cobbing ARM Acoustics colin.cobbing@armacoustics.co.uk 1997 2014 Single correction of 5 db for one or several features Graduated corrections for tonal and impulsive. Corrections for other features.
Improving sound quality measures through the multifaceted soundscape approach
 Improving sound quality measures through the multifaceted soundscape approach Brigitte SCHULTE-FORTKAMP 1 1 Technische Universität Berlin, Germany ABSTRACT Soundscape research represents a paradigm shift
Hearing. Juan P Bello
 Hearing Juan P Bello The human ear The human ear Outer Ear The human ear Middle Ear The human ear Inner Ear The cochlea (1) It separates sound into its various components If uncoiled it becomes a tapering
Emoacoustics: a study of the physical and psychological dimensions of emotional sound design
 3rd International Workshop on Perceptual Quality of Systems (PQS 2010) 6-8 September 2010, Bautzen, Germany Emoacoustics: a study of the physical and psychological dimensions of emotional sound design
Spatial unmasking in aided hearing-impaired listeners and the need for training
 Spatial unmasking in aided hearing-impaired listeners and the need for training Tobias Neher, Thomas Behrens, Louise Kragelund, and Anne Specht Petersen Oticon A/S, Research Centre Eriksholm, Kongevejen
The effect of binaural processing techniques on speech quality ratings of assistive listening devices in different room acoustics conditions
 Acoustics 8 Paris The effect of binaural processing techniques on speech quality ratings of assistive listening devices in different room acoustics conditions J. Odelius and Ö. Johansson Luleå University
European Wind Energy Association Oxford 12th December 2012
 European Wind Energy Association Oxford 12th December 2012 Noise Impact non-acoustic variables Ian Flindell ISVR, University of Southampton ian.flindell@btconnect.com General overview primary research
Prediction of vocal effort and speakers comfort in lecture rooms
 Prediction of vocal effort and speakers comfort in lecture rooms David Pelegrín-García a Jonas Brunskog b Acoustic Technology Group Technical University of Denmark Kgs. Lyngby, DK-2800 Denmark ABSTRACT
Proceedings of Meetings on Acoustics
 Proceedings of Meetings on Acoustics Volume 19, 2013 http://acousticalsociety.org/ ICA 2013 Montreal Montreal, Canada 2-7 June 2013 Noise Session 3aNSa: Wind Turbine Noise I 3aNSa5. Can wind turbine sound
Human Sensitivity to Interaural Phase Difference for Very Low Frequency Sound
 Acoustics 28 Geelong, Victoria, Australia 24 to 26 November 28 Acoustics and Sustainability: How should acoustics adapt to meet future demands? Human Sensitivity to Interaural Phase Difference for Very
Nova 3 Noise Attenuation Study
 Nova 3 Noise Attenuation Study Prepared by: Mathew Bancroft (BE Mech Hons, Canterbury) Design Engineer RPB Safety Limited June 2012 Table of Contents 1.0 Introduction... 3 1.1 Noise Attenuation Data...
Sound Workshop. What is sound Longitudinal Waves Frequency and pitch Hearing ranges Sounds in solids, liquids and gases Sound in a vacuum
 Sound Workshop a. b. c. d. e. f. g. h. i. j. k. l. What is sound Longitudinal Waves Frequency and pitch Hearing ranges Sounds in solids, liquids and gases Sound in a vacuum Echoes Ultrasound Loudspeakers
TOLERABLE DELAY FOR SPEECH PROCESSING: EFFECTS OF HEARING ABILITY AND ACCLIMATISATION
 TOLERABLE DELAY FOR SPEECH PROCESSING: EFFECTS OF HEARING ABILITY AND ACCLIMATISATION Tobias Goehring, PhD Previous affiliation (this project): Institute of Sound and Vibration Research University of Southampton
Neural System Model of Human Sound Localization
 in Advances in Neural Information Processing Systems 13 S.A. Solla, T.K. Leen, K.-R. Müller (eds.), 761 767 MIT Press (2000) Neural System Model of Human Sound Localization Craig T. Jin Department of Physiology
Communication quality for students with a hearing impairment: An experiment evaluating speech intelligibility and annoyance
 Communication quality for students with a hearing impairment: An experiment evaluating speech intelligibility and annoyance Johan Odelius, Örjan Johansson, Anders Ågren Division of Sound and Vibration,
[ V] Environmental Impacts, Threshold Levels and Health Effects
![[ V] Environmental Impacts, Threshold Levels and Health Effects](/thumbs/79/79838274.jpg "[ V] Environmental Impacts, Threshold Levels and Health Effects") [701-0662-00 V] Environmental Impacts, Threshold Levels and Health Effects Noise Part 2 (18.04.2018) Mark Brink ETH Zürich D-USYS Homepage: http://www.noise.ethz.ch/ei/ D-USYS M. Brink Environmental Impacts
[701-0662-00 V] Environmental Impacts, Threshold Levels and Health Effects Noise Part 2 (18.04.2018) Mark Brink ETH Zürich D-USYS Homepage: http://www.noise.ethz.ch/ei/ D-USYS M. Brink Environmental Impacts
Smart sound monitoring for sound event detection and characterization
 ABSTRACT Smart sound monitoring for sound event detection and characterization Bert DE COENSEL 1 ; Dick BOTTELDOOREN 2 Ghent University, Belgium As there is little doubt that the perception of one s acoustic
Development of a new loudness model in consideration of audio-visual interaction
 Development of a new loudness model in consideration of audio-visual interaction Kai AIZAWA ; Takashi KAMOGAWA ; Akihiko ARIMITSU 3 ; Takeshi TOI 4 Graduate school of Chuo University, Japan, 3, 4 Chuo
Aircraft Noise as a Public Health Problem
 Aircraft Noise as a Public Health Problem Birgitta Berglund Gösta Ekman Laboratory for Sensory Research Stockholms University and Karolinska Institutet The 16th AIAA/CEAS Aeroacoustics Conference June
Influence of acoustic complexity on spatial release from masking and lateralization
 Influence of acoustic complexity on spatial release from masking and lateralization Gusztáv Lőcsei, Sébastien Santurette, Torsten Dau, Ewen N. MacDonald Hearing Systems Group, Department of Electrical
Issues in the measurement of sleep-related noise events in road traffic streams
 Issues in the measurement of sleep-related noise events in road traffic streams A.L. Brown Urban Research Programme, Griffith School of Environment, Griffith University, Brisbane, Australia ABSTRACT The
The basic hearing abilities of absolute pitch possessors
 PAPER The basic hearing abilities of absolute pitch possessors Waka Fujisaki 1;2;* and Makio Kashino 2; { 1 Graduate School of Humanities and Sciences, Ochanomizu University, 2 1 1 Ootsuka, Bunkyo-ku,
Binaural processing of complex stimuli
 Binaural processing of complex stimuli Outline for today Binaural detection experiments and models Speech as an important waveform Experiments on understanding speech in complex environments (Cocktail
Background noise level to determine the speech privacy in open plan offices
 Background noise level to determine the speech privacy in open plan offices Twan Vervoort Peutz bv, Mook, The Netherlands. Martijn Vercammen Peutz bv, Mook, The Netherlands. Summary The acoustic comfort
functions grow at a higher rate than in normal{hearing subjects. In this chapter, the correlation
 Chapter Categorical loudness scaling in hearing{impaired listeners Abstract Most sensorineural hearing{impaired subjects show the recruitment phenomenon, i.e., loudness functions grow at a higher rate