Copyright Warning & Restrictions
|
|
|
- Evan Stephens
- 5 years ago
- Views:
Transcription
1 Copyright Warning & Restrictions The copyright law of the United States (Title 17, United States Code) governs the making of photocopies or other reproductions of copyrighted material. Under certain conditions specified in the law, libraries and archives are authorized to furnish a photocopy or other reproduction. One of these specified conditions is that the photocopy or reproduction is not to be used for any purpose other than private study, scholarship, or research. If a, user makes a request for, or later uses, a photocopy or reproduction for purposes in excess of fair use that user may be liable for copyright infringement, This institution reserves the right to refuse to accept a copying order if, in its judgment, fulfillment of the order would involve violation of copyright law. Please Note: The author retains the copyright while the New Jersey Institute of Technology reserves the right to distribute this thesis or dissertation Printing note: If you do not wish to print this page, then select Pages from: first page # to: last page # on the print dialog screen

2 The Van Houten library has removed some of the personal information and all signatures from the approval page and biographical sketches of theses and dissertations in order to protect the identity of NJIT graduates and faculty.
3 ABSTRACT ABSTRACTION, EXTENSION AND STRUCTURAL AUDITING WITH THE UMLS SEMANTIC NETWORK by Yan Chen The Unified Medical Language System (UMLS) is a two-level biomedical terminological knowledge base, consisting of the Metathesaurus (META) and the Semantic Network (SN), which is an upper-level ontology of broad categories called semantic types (STs). The two levels are related via assignments of one or more STs to each concept of the META. Although the SN provides a high-level abstraction for the META, it is not compact enough. Various metaschemas, which are compact higher-level abstraction networks of the SN, have been derived. A methodology is presented to evaluate and compare two given metaschemas, based on their structural properties. A consolidation algorithm is designed to yield a consolidated metaschema maintaining the best and avoiding the worst of the two given metaschemas. The methodology and consolidation algorithm were applied to the pair of heuristic metaschemas, the top-down metaschema and the bottom-up metaschema, which have been derived from two studies involving two groups of UMLS experts. The results show that the consolidated metaschema has better structural properties than either of the two input metaschemas. Better structural properties are expected to lead to better utilization of a metaschema in orientation and visualization of the SN. Repetitive consolidation, which leads to further structural improvements, is also shown. The META and SN were created in the absence of a comprehensive curated genomics terminology. The internal consistency of the SN's categories which are relevant to genomics is evaluated and changes to improve its ability to express genomic knowledge are proposed. The completeness of the SN with respect to genomic concepts is evaluated and corresponding extensions to the SN to fill identified gaps are proposed.
4 Due to the size and complexity of the UMLS, errors are inevitable. A group auditing methodolgy is presented, where the ST assignments for groups of similar concepts are audited. The extent of an ST, which is the group of all concepts assigned this ST, is divided into groups of concepts that have been assigned exactly the same set of STs. An algorithm finds subgroups of suspicious concepts. The auditor is presented with these subgroups, which purportedly exhibit the same semantics, and thus he will notice different concepts with wrong or missing ST assignments. Another methodology partitions these groups into smaller, singly rooted, hierarchically organized sets used to audit the hierarchical relationships. The algorithmic methodologies are compared with a comprehensive manual audit and show a very high error recall with a much higher precision than the manual exhaustive review.
5 ABSTRACTION, EXTENSION AND STRUCTURAL AUDITING WITH THE UMLS SEMANTIC NETWORK by Yan Chen A Dissertation Submitted to the Faculty of New Jersey Institute of Technology in Partial Fulfillment of the Requirements for the Degree of Doctor of Philosophy in Computer Science Computer Science Department January 2008
6 Copyright 2008 by Yan Chen ALL RIGHTS RESERVED
7 APPROVAL PAGE ABSTRACTION, EXTENSION AND STRUCTURAL AUDITING WITH THE UMLS SEMANTIC NETWORK Yan Chen Dr. Yehoshua Perl, Dissertation Advisor Professor, New Jersey Institute of Technology Date Dr. James Geller, Dissertation Co-Advisor Professor, NewJersey Institute of Technology Date Dr. 'Ames J. Cimino, Committee Member Professor, Columbia University Date Dr. Barry Cohen, Committee Member Assistant Professor, New Jersey Institute of Technology Date Dr. Helen Gu, Committee Member Associate Professor, University of Medicine and Dentistry of New Jersey Date Dr. Michael Halper, Committee Member Professor, Kean University Date
8 BIOGRAPHICAL SKETCH Author: Yan Chen Degree: Doctor of Philosophy Date: January 2008 Undergraduate and Graduate Education: Doctor of Philosophy in Computer Science, New Jersey Institute of Technology, Newark, NJ, 2008 Master of Science in Computer Science New Jersey Institute of Technology, Newark, NJ, 2002 Major: Computer Science Presentations and Publications: Y. Chen, H. Gu, Y. Perl, J. Geller and M. Halper, External Auditing of UMLS Semantic Type Assignments. to be submitted for journal publication. Y. Chen, H. Gu, Y. Perl, J. Geller and M. Halper, Structural Group-Based Auditing of UMLS Hierarchical Relationships. to be submitted for journal publication. Y. Chen, H. Gu, Y. Perl, J. Geller and M. Halper, Semantic Group-Based Auditing of UMLS Semantic Type Assignments. Journal of Biomedical Informatics, submitted for journal publication. Y. Chen, Y. Perl, J. Geller, G. Hripcsak and L. Zhang, Comparing and Consolidating Two Heuristic Metaschemas. Journal of Biomedical Informatics, accepted. B Cohen, Y. Chen and Y. Perl, Updating the Genomic Component of the UMLS Semantic Network. In Proceedings of AMIA Symposium 2007, pages M. Halper, Y. Wang, M. Hua, Y. Chen, Y. Perl, K. Spackman and G. Hripcsak. Analysis of Error Concentrations in SNOMED. In Proceedings of AMIA Symposium 2007, pages H. Gu, G. Hripcsak, Y. Chen, G. Elhanan, J. Cimino, J. Geller and Y. Perl, Evaluation of a UMLS Auditing Process of Semantic Type Assignments. In Proceedings of AMIA Symposium 2007, pages iv
9 Y. Wang, M. Halper, H. Min, Y. Perl, Y. Chen, J. Geller, and K. A. Spackman, Structural Techniques for Auditing SNOMED. Journal of Biomedical Informatics, 40(5), pages , October Y. Chen, Y. Perl, J. Geller and Cimino, The analysis of UMLS Users, Uses and Future Agenda. Journal of the American Medical Informatics Association, 14(2), pages , March/April H. Min, Y. Per!, Y. Chen, M. Halper, J. Geller, and Y. Wang, Auditing as part of the terminology design life cycle. Journal of the American Medical Informatics Association, 13(6), pages , November/December 2006.
10 To my beloved parents vi
11 ACKNOWLEDGMENT I would like to gratefully and sincerely thank my advisors Dr. Yehoshua Perl and Dr. James Geller for guidance, understanding, and patience. Their mentorship was paramount in providing a well rounded experience consistent with my long-term career goals. They encouraged me to not only grow as a computer scientist but also as an independent thinker. I gratefully acknowledge that Dr. James J. Cimino, Dr. Barry Cohen, Dr. Helen Gu and Dr. Michael Halper spent their precious time in reading this manuscript and offering valuable input. I also thank all members of Dr. Perl's research group for their support and friendship. I am indebted to my parents for creating the environment in which following this path seemed so natural. I would like to give my special thanks to my husband Litao for his patience and love, which enabled me to complete this work. Last, but not the least, I would like to thank Dr. Ronald Kane and Ms. Clarisa Gonzalez-Lenahan for their time and assistance during my graduate studies at the New Jersey Institute of Technology. vii
12 TABLE OF CONTENTS Chapter Page 1 INTRODUCTION Abstraction Extension Auditing 5 2 COMPARING AND CONSOLIDATING TWO HEURISTIC METASCHEMAS Background A Metaschema of the SN Top-down Heuristic Metaschema Methods Design of Bottom-up Heuristic Metaschema Comparing Metaschemas Structural Properties of Metaschemas Consolidation Repeated Consolidation of Metaschemas Results Bottom-up Heuristic Metaschema Results of Metaschema Comparison Results of Structural Evaluation Consolidated Consensus Metaschema 37 2,3.5 Properties of the Consolidated Consensus Metaschema Repeated Consolidation of Metaschemas Discussion Conclusions 58 3 UPDATING THE GENOMIC COMPONENT OF THE SEMANTIC NETWORK Background 63 viii
13 Chapter TABLE OF CONTENTS (Continued) Page 3.2 Methods Results Discussion Conclusions 71 4 GROUP AUDITING OF A SEMANTIC TYPE'S EXTENT, Background Methods Deriving Refined Semantic Type Extents Creating ST Assignment Table Identifying Suspicious Concepts Auditing Methodology for Semantic Type Assignment of Suspicious Concepts A Dynamic Auditing Methodology for Semantic Type Assignments Partition of Refined ST Extent into Cohesive Sets Auditing Hierarchical Relationships Based on Cohesive Sets Results Auditing the extent of EMD Auditing the extent of EEH Discussion Evaluation Interpretation Limitations Conclusions 121 REFERENCES 124 ix
14 LIST OF TABLES Table Page 2.1 Number of MSTs Each Expert Chose in the Top-down Study Inter-participant Agreement Matrix; Average = Number of Semantic Types Agreed on by at Least N Participants Number of MSTs Each Expert Chose in the Bottom-up study Number of MSTs Chosen by at Least N Participants Inter-participant Agreement Matrix; Average = Identical MSTs in Both Metaschemas Similar MSTs in Both Metaschemas Refinements in Bottom-up Consensus Metaschema Values for the Structural Measures for the Two Consensus Metaschemas Weight Distribution of the Two Consensus Metaschemas Relationship Number Codes Comparison of the Structural Measures for All Metaschemas Comparing Experts' Metaschemas of Both Studies Comparison of the Structural Measures for the Top-down, Bottom-up and Consolidated Metaschemas Sample ST Table All Concepts Assigned the Semantic Type EMD Refined Semantic Types and Their Assignments Derived from EMD Suspicious Concepts Identified in EMD Refined ST Reassignments for Erroneous Concepts After Applying the Auditing Suspicious ST Assignments Methodology Refined ST Reassignments for Erroneous Concepts by Applying the Dynamic Auditing Suspicious ST Assignments Methodology Concepts Assigned Originally EMD Which Are Assigned the Pure ST EMD and Intersection ST EMD fl NP after correction 99
15 LIST OF TABLES (Continued) Table Page 4.8 Concepts Originally Assigned EMD Which Were Moved Out of the EMD Extent by the Correction All Concepts (61 concepts) Assigned the Semantic Type EEH Concepts Assigned the Pure Semantic Type EEH and to Its Intersection Types Sample ST Table for EEH Suspicious Concepts Identified in Extents of Refined STs EEH and EEH n HPS Corrected ST Assignments of Concepts in Extents of Refined STs EEH and EEH n HPS Concepts Assigned the Pure Semantic Type EEH and Its Intersection Types After Correction Missing Hierarchical Relationship Between EMD Concepts and the Concepts' Source Terminologies 122 xi
16 Figure LIST OF FIGURES Page 2.1 A connected partition example of the Event hierarchy of the SN Metaschema hierarchy corresponding to the partition of the Event hierarchy of Figure Interpretation of the definition of meta-child-of Top-down consensus metaschema hierarchy The abstract semantic network and input metaschemas The flow chart of consolidation with numbered steps Consolidating and deleting corresponding MSTs Constructing MA" and S" Constructing MB" Consolidated metaschema Bottom-up consensus metaschema hierarchy Comparison of consensus metaschemas The Consolidation of Corresponding MSTs The partial consolidated metaschema with corresponding MSTs Auxiliary metaschemas MA', MB' and expanded semantic network SN' Induced Auxiliary metaschemas MA", MB" and Induced semantic network SN" MA' and MB' for Entity Processing for Entity Consolidated Consensus Metaschema hierarchy Consolidated Consensus Metaschema with relationships Cohesive Metashcema and Lexical Metaschema Comparison of consolidated metaschemas Final Consolidated Metaschema. 53 xii
17 Figure LIST OF FIGURES (Continued) Page 3.1 Updated Genomic Component of the UMLS Semantic Network The types and intersections of RSN for concepts assigned EMD An example of Cohesive Sets Audited hierarchical relationships for cohesive sets in Figure Intersections and types involving the original EMD extent after auditing EMD (Pure ST) after semantic auditing EMD n NP (Intersection ST) after semantic auditing EMD (Pure ST) after hierarchical auditing EMD n NP (Intersection ST) after hierarchical auditing EEH (Pure ST) after semantic auditing EEH (Pure ST) after hierarchical auditing. 117
18 CHAPTER 1 INTRODUCTION The Unified Medical Language System (UMLS) [1-3] project is an effort to overcome the fundamental barriers of communication and the lack of a standard machine-readable language in medicine [3]. It is a set of machine-readable knowledge sources, consisting of the Metathesaurus (META) [4,5], the Semantic Network (SN) [6-9] and the SPECIALIST lexicon. The META contains 1.4 million concepts (2007 AB) derived from a variety of more than 100 existing biomedical vocabularies and classifications. The SN which provides a high-level abstraction of the biomedical domain, consists of 135 semantic types (STs), with which all concepts of the META are categorized_ 1.1 Abstraction The SN can help in user orientation and navigation in the large META knowledge base and in interaction with the knowledge embedded in the UMLS. Although the SN provides a high-level abstraction of the META, it is still difficult for a user to obtain a full comprehension of the SN, since there are about 7,000 non-is-a semantic relationships connecting pairs of STs. Previous research has been conducted on reducing the complexity of the SN. McCray et al. [10] developed a methodology for aggregating STs into 15 groups, based on 6 general principles: semantic validity, parsimony, completeness, exclusivity, naturalness and utility. Kumar et al. [11] used a derivation formalized in predicate logic to reduce the complexity of the SN. Partitioning techniques to obtain a metaschema, which serves as a compact abstraction of the SN, have been developed in previous research [12]. According to the definition in [12], a metaschema is an abstraction based on an underlying partition of the SN into connected groups of STs. Each group is represented by a single Metasemantic Type (MST). The purpose of a metaschema is to present a compact 1
19 2 abstraction-level network of the SN, where each MST represents a subject area of the SN. That is, the STs of each subject area constitute a group in the partition underlying the metaschema. Similar to the SN itself, a metaschema of the SN is formally a directed network which consists of a set of nodes, the MSTs, connected via hierarchical meta-child-of relationships and semantic meta-relationships. For more details see Section In [13], The notion of a metaschema is extended to a Directed Acyclic Graph (DAG) network, rather than the tree structure of the SN. Then two different metaschemas were obtained from the Enriched Semantic Network [14], which is an extension of the SN having a DAG structure. Algorithms to generate two different metaschemas, the cohesive metaschema [12], and the lexical metaschema [15] have been designed. Each of these two metaschemas can serve as a higher-level abstract view of the SN to help users' understanding of the complex SN. An important assumption underlying the construction of these two metaschemas is that even though they were generated by algorithmic processes, they effectively yield subject areas meaningful and useful to a human. In order to evaluate the validity of this assumption, a heuristic top-down study [16] was conducted. In this study, a group of experts, who published on UMLS research or related subjects, was recruited, with each expert charged to derive his/her own metaschema. A consensus metaschema of all the experts' metaschemas was then derived. However, the result of the top-down study was disappointing, since the metaschemas obtained by the experts varied widely while a good degree of agreement among experts was expected. As a consequence, an alternative bottom-up approach, was introduced. The second study of experts applied this approach. Naturally, it is desirable to compare the two consensus metaschemas to find out which is better fitting for evaluating the algorithmically obtained metaschemas. Since the two consensus metaschemas are results of human considerations, only a comparison and evaluation of their structural properties can be objective. In this dissertation, methods
20 3 for comparing two metaschemas are presented. Several measures to help in assessing the quality of a metaschema for supporting user orientation into the SN are further introduced. These measures are structural measures, intended to reflect the ease of comprehension and orientation. Those structural measures were used for evaluating the two metaschemas. As will be shown, each of them has pros and cons, in terms of its structural properties. It is desirable to create a metaschema that can best facilitate user orientation into the SN, by enjoying the advantages of each of the consensus metaschemas and avoiding their disadvantages. To this end, an algorithm to obtain a consolidated metaschema of the two given metaschemas was designed. The consolidated metaschema obtained can serve as a yardstick for the measurement of the quality of the metaschemas generated by algorithms [12, 15], since it is derived from experts' metaschemas. The impact of repetitive consolidation is also studied in this dissertation. The consolidation algorithm was applied to two pairs of given metaschemas and to the two resulting consolidated metaschemas. The final consolidated metaschema is expected to have better structural properties so that it can be better utilized in orientation and visualization [12] of the SN. The reason is that the more uniform the sizes of the ST groups of a metaschema are, the easier it is to display the ST groups with their many internal and external relationships and comprehend them. It is harder to display and comprehend a larger group with its relationships than its two halves, due to the potentially quadratic (double) number of internal (external) relationships, assuming a constant density of edges. Although there is a loss of data in the metaschema, the full structure of the SN is presented by visualization of its groups [12] in small units following the metaschema framework. In [17], Gu et al. use the metaschema paradigm to locate concepts with high likelihood of errors. The metaschema framework can be extended beyond the UMLS to any dual level terminological system which consists of an upper level terminology of broad categories, in addition to the concept repository, with assignments of categories for every concept. Such a terminological system will have advantages in supporting abstraction, navigation
21 4 and integration. Metaschemas and their consolidation can further support abstraction of the upper level terminology. One effort in this direction is the IEEE Standard Upper Ontology (SUO) [18, 19] as an upper level terminology for the WordNet terminology [20]. An assignment of the SUO categories for the WordNet terminology is described in [21]. Another related dual level terminology is suggested in [22] for the Medical Entities Dictionary (MED) [23]. The upper level terminology there is called schema (following the Object-Oriented database paradigm). A metaschema for this schema is suggested in [24]. In addition to the notion of metaschema, other previous work has focused on different methods to facilitate UMLS knowledge comprehension and visualization. Bodenreider and McCray described how to use visualization of semantic relationships as important indicators to explore coherence of semantic groups and help in auditing and validating the SN [25]. In [26], Nelson, et al., presented the Hypercard browser MetaCard to enable users to extend the browsing process from META to a variety of different knowledge sources. Knowledge exploration tools using levels of indentation to represent items standing in hierarchical relationships were used for displaying biomedical hierarchies in environments such as Protégé-2000 [27]. A review of knowledge visualization and navigation in the medical domain was presented by Tuttle et al. in [28]. 1.2 Extension One of the fastest expanding areas in biomedical research is the study of genes and genomes. Since the completion of the sequencing of the human genome, the volume of genomic sequence information has continued to expand at an exponential pace. Through techniques of comparative genomics, all of this information sheds light on the functioning of the human genomic system. The UMLS Metathesaurus is a comprehensive biomedical resource that has been steadily extended by the incorporation of additional source vocabularies. However, as noted by McCray [9], "Some of the UMLS vocabularies contain terminology
22 5 at the cellular and molecular level, but none has been created specifically for genetic resources." This has resulted in some gaps in its coverage. It is important that a user of genomic knowledge be able to connect it to the general body of biomedical knowledge. The UMLS enables this partially by integrating the Gene Ontology (GO) [29], which allows researchers to report results regarding genes and gene products. To this end, gaps in the SN were identified by evaluating the internal consistency of the SN's categories relevant to genomics and the completeness of the SN with respect to genomic concepts. A genomic component, an extension of the SN, was added to fill the identified gaps. 1.3 Auditing The UMLS is an invaluable resource to the biomedical community. The META's extensive size and inherent complexity make some wrong assignments unavoidable. Some categorization errors and inconsistencies have been introduced into it. This may be caused by the nature of the UMLS, integrating various source terminologies, which are not always consistent with each other, or by the different views of domain experts who categorize the concepts. Incorrect ST assignments ("mis-assignments") may, in fact, reflect various kinds of misunderstandings, such as inaccurate or wrong meaning or ambiguity of concepts. Such wrong assignments may lead to the misinterpretation of those concepts. Thus, an ST assignment error for a concept may indicate the potential presence of other errors. In a recent study of UMLS user preferences [30], users expressed that 35% of a putative UMLS budget should be spent for auditing (more than for any other task). There were questions in the study about the degrees to which each user is bothered by twelve kinds of errors. Among the six errors related to wrong aspects of a concept, the highest and the third highest in user concern were wrong semantic types and wrong hierarchical relationships, respectively. Among the six errors related to missing aspects of a concept, the highest two in user concern were missing hierarchical relationships and missing semantic types. Therefore, it is imperative to audit the META for semantic type assignments and
23 . 6 hierarchical relationships to ensure the overall quality and usability of the UMLS. Moreover, locating incorrect ST assignments and missing or incorrect hierarchical relationships may help to expose other kinds of errors, such as missing lateral relationships and redundant or ambiguous concepts [31, 32]. In this disseration, a concept group-centered approach is presented. It applied two "divide and conquer" techniques to facilitate the task of auditing of both semantic type assignments and hierarchical relationships, concentrating on auditing the whole logical unit of all concepts assigned the same ST. This logical unit was partitioned into smaller logical units through two phases of processing. The resulting groups of concepts are more comprehensible due to their uniform semantics and are therefore easier to audit. The first phase of partitioning involves a methodology to facilitate the process of finding ST mis-assignments. The basic premise is that a review of purportedly semantically similar concepts in a group is more likely to be effective in locating such errors than a review of random concepts with disparate semantics. In such a group, all concepts are intended to share an overarching semantics, so those that do not may be more readily detected by an auditor. This methodology utilizes semantic types of the Refined Semantic Network (RSN) [31, 32], which has the characteristic of semantically uniform extents. The methodology algorithmically suggests to the auditor that certain concepts are "suspicious" and warrant review. An interesting feature of the methodology is its dynamic nature, where a re-invocation after the correction of an ST mis-assignment at a parent concept can lead to the discovery of errors at the children, which were initially not suspicious. The second phase includes a novel partitioning technique, forming smaller connected groups with concepts of uniform refined semantics. The partition potentially exposes some new errors that become apparent only in view of the context of the semantically uniform sets of that specific partition. Auditing is carried out with respect to these different levels of granularity and detail. The new auditing techniques, designed for processing one ST at a time, are demonstrated by examining the extents of the semantic types Experimental
24 7 Model of Disease (EMD) and Environmental Effect of Humans (EEH) of the UMLS 2006AB version. It is necessary to stress the difference between partitioning the META's concepts of one ST extent which is performed here and partitioning of the STs of the UMLS Semantic Network into groups of STs as found e.g., in McCray, Burgun and Bodenreider [10], Bodenreider and McCray [25] and Chen et al. [33]. Partitioning the SN appears also in deriving metaschemas of the Semantic Network e.g., in Perl et al. [12] and Zhang et al. [15]. The first kind of partitioning, of META's concepts, helps auditing the ST assignments of concepts. The second kind of partitioning helps in abstraction and comprehension of the Semantic Network and may help in auditing its structure. That is, those two partitioning tasks occur on different levels.
25 CHAPTER 2 COMPARING AND CONSOLIDATING TWO HEURISTIC METASCHEMAS 2.1 Background A Metaschema of the SN The notion of a metaschema was introduced in [12] as an abstraction of the SN. An ST group is called connected if its STs together with their respective IS-A links constitute a connected subgraph of the SN hierarchy with a unique root. A partition of the SN is called connected if all of its ST groups are connected. A metaschema is based on a connected partition of the SN, where the SN's STs are partitioned into disjoint ST groups. Figure 2.1 shows a partition of the Event' portion of the UMLS SN hierarchy. Each box represents an ST. Each arrow represents an IS-A link. Dotted lines circumscribe groups of STs which are close in meaning to each other. Additionally, while an ST group can be a singleton (i.e., a group of one ST), it is required that such an ST cannot be a leaf in the SN hierarchy. This condition was imposed because the metaschema should manifest some size reduction of the SN, which singletons do not contribute to. However, a singleton containing a non-leaf ST with more than one child is allowed, since it may express an important internal branching point in the metaschema. For example, in Figure 2.1, the singleton {Biologic Function} serves as a branching point for the groups rooted at Physiologic Function and Pathologic Function. In a metaschema, each ST group of the partition is represented by a single node, called a metasemantic type (MST) named after the root of the group. MSTs are connected by two kinds of relationships, the hierarchical meta-child-of relationships and the nonhierarchical meta-relationships. Figure 2.2 shows the metaschema hierarchy corresponding 'Semantic types will be written in bold style and MSTs will be written in "small caps" style 8
26 9 Figure 2.1: A connected partition example of the Event hierarchy of the SN. Figure 2.2: Metaschema hierarchy corresponding to the partition of the Event hierarchy of Figure 2.1.
27 10 to Figure 2.1. The number of STs in each MST is listed in parenthesis following its name. This example contains no meta-relationships. A meta-child-of relationship ("meta-child-of" for short) is a link between two MSTs representing an IS-A relationship between two STs of the corresponding ST groups. More specifically, let A i and B r be STs in the ST groups of MSTs A and B, respectively (see Figure 2.3). Furthermore, let B r be the root of B and let B r IS-A A i. Then in the metaschema, a meta-child-of directed from B to A is defined. Note that the ST A i does not need to be the root of its MST. Only the source B r has to be a root in order for a new meta-child-of to be induced in the metaschema. A meta-relationship is a link between two MSTs representing a specific semantic relationship (non-is-a relationship) between the two corresponding ST groups (for details see [12]). The derivation of the meta-child-of and the meta-relationships is motivated in detail in [12]. For example, the hierarchy of the Event portion of the SN could be partitioned into the eight ST groups shown in Figure 2.1. Each semantic-type group is represented
28 11 by an MST in the corresponding metaschema. An MST PHENoMENoN or PRoCESS is defined to represent the ST group rooted at Phenomenon or Process in Figure 2.1. The metaschema hierarchy derived from the partition in Figure 2.1 is shown in Figure 2.2. Overall, a diagram of a metaschema serves as a good visualization mechanism that supports orientation to the SN and, in turn, the META. In addition, it helps in navigating the UMLS knowledge. In [12] various partial graphical views of groups of STs supported by a metaschema were introduced. These views can help in orientation of a user to the full scope of the SN's semantic relationships Top-down Heuristic Metaschema An important assumption underlying the construction of the algorithmically generated metaschemas in previous research [12, 15] is that the resulting subject areas of the SN are natural to a human. In order to validate this assumption, the following study [15] was conducted. A number of experts with reputation in the UMLS research area or related areas were selected. A diagram of the SN's IS-A hierarchy, i.e., the two trees rooted at Event and Entity, was sent to each expert. The experts were asked to partition the SN starting at the roots (i.e. top-down). The design of the study follows the Aristotelian [34] paradigm, where categories ("species") are specified according to genus and differentiate. Partitioning is done based on the extent of the difference between the child ST and its more general parent ST. Details of this study have appeared in previous publications [12, 16] and are omitted. The design of the metaschema utilizes the one-to-one correspondence between the ST groups underlying the MSTs, and their root STs. By selecting a set of STs that are "important and quite different" from their parents, a participating expert induces a partition of the SN, where each selected semantic type is a root of its group, implying a corresponding "expert metaschema."
29 12 When responses from the eleven UMLS experts were studied, it was found that individual participants' responses varied greatly, both in the choice of STs marked as roots of groups and their numbers. For example, experts 1 and 2 chose 21 and 34 STs to name MSTs in their expert metaschemas, respectively. Table 2.1 shows the number of STs marked by each expert with minimum, maximum and average numbers of 12, 36 and about 26, respectively. The standard deviation is Table 2.1: Number of MSTs Each Expert Chose in the Top-down Study In order to better understand the results, the variability of the experts' responses were quantified. Towards this end, the X-by-X agreement matrix, among X experts, was computed to examine the agreement between any two experts in the same study group. In the agreement matrix, the number in row i and column j indicates how many MSTs expert i and expert j agree on. The agreement matrix of all eleven experts (Table 2.2) demonstrates the high variability of participant responses. For instance, participants 2 and 5 both marked 34 STs and agreed on 27 of them. The average inter-participant agreement is (only about 63% of the average number of marked STs, 26.73), with a high of 30 and a low of 6. The large range shows the high variability of participant responses. It was expected that some choices would be made by many participating experts. It was desirable to see metaschemas that represent an aggregation of the experts' responses rather than just the expert metaschemas of the individuals. In particular, a sequence of cumulative metaschemas was constructed, each of which reflects a specific level of aggregation of the experts. Suppose there are X experts' responses. A threshold value N in the range (1, X) is defined to represent the level of aggregation. The cumulative metaschema for a given N is constructed as follows. For each ST marked by at least N participating
30 experts, an MST is defined and given the name of its root ST. Then meta-child-of's and meta-relationships are derived as described before. Table 2.2: Inter-participant Agreement Matrix; Average = I In the study, responses from eleven experts (X = 11) were received and thus resulting in eleven cumulative metaschemas by varying N over the range (1, 11). For example, when N = 8, the same 16 STs were marked by at least eight out of the eleven experts, and thus the corresponding cumulative metaschema contains 16 MSTs. Table 2.3 shows the number of semantic types marked for each N. Obviously, the larger the value of N, the smaller the number of common MSTs. Table 2.3: Number of Semantic Types Agreed on by at Least N Participants Threshold (N) # Marked MSTs As can be seen from Table 2.3, the number of MSTs varies from two (for N = 11) to 45 (for N = 1, 2, and 3). The corresponding metaschema for the N = 11 case contains only two MSTs ENTITY and EVENT, each spanning the whole corresponding tree of the SN. For the N < 3 cases, each non-leaf ST names an MST. The metaschema that emerges in those cases is effectively just the SN itself, without its leaves. No real grouping of related STs occurs. Obviously, such extreme metaschemas are not interesting.
31 14 The cumulative metaschema with the threshold value N, which represents a simple majority of the experts (i.e., N = (X121) is denoted as the consensus metaschema [35]. For the top-down study, the consensus metaschema (N = 6) contains 26 MSTs. Its hierarchy is shown in Figure 2.4. This metaschema is called the Top-down Consensus Metaschema. Unfortunately, the Top-down Consensus Metaschema is not desirable to be used as reflecting experts' opinions. The variations among the various experts' metaschemas were too wide. For example, there were no STs that all experts chose, except for the roots, Entity and Event, which were dictated by the top-down approach. In the study. the numbers of MSTs chosen by different experts varied greatly. Also, important MSTs such as MoLECULAR SEQUENCE(4), which appears in the lexical metaschema, or ANAToMICAL ABNoRMALITY(3), ANIMAL(9), PLANT(2) which appear in the cohesive metaschema, are missing from the Top-down Consensus Metaschema, although they were expected. One possible explanation for the large variations and the lack of expected MSTs is that the instructions that were provided to the experts were deficient. The decision of choosing an ST to head a group is made without considering the group members (which are further down in the tree of SN) and thus were not seen yet, in the top-down processing approach. The decision was made by experts solely based on comparing the current ST to its parent (P) and deciding whether it is too important and different from P to be in P's group. The exact instruction given was "while scanning, mark by star, semantic types, which you judge as IMPORTANT AND QUITE DIFFERENT from their parent semantic types." No further elaboration was given. In other words, the domain experts were asked to identify substantial or unusual shifts of granularity in the taxonomy of SN. The lower level of agreement seems to be caused by the need of the experts to make their decisions without full knowledge. This refers to the inherent problem of choosing the current ST to represent a group of decscendant STs, without knowing what will be in the group, since they were not scanned yet. Furthermore, although it is known that the group members are descendants of the current ST, it is not
32 known which descendants, will be in the group as some of them may be selected later to lead their own groups. The described problems led to an alternative approach, where the SN is scanned bottom-up and a decision regarding a root of a group is made by an expert considering the whole group as well as the comparison to its parent. This was expected to enable experts to create a better metaschema based on semantic considerations, as their decisions would be based on more knowledge. In the next section, the bottom-up approach is presented Design of Bottom-up Heuristic Metaschema The Bottom-up Study To find a better way for validating algorithmically generated metaschemas, a bottom-up study with thirteen participants was conducted. Instead of scanning the STs of SN from the roots to the leaves as in the top-down study, the participants in the bottom-up study were instructed to scan the two SN trees from the leaves up to the roots. The detailed instructions are as follows: "1. A leaf (semantic type without children) is not chosen to head a group.
33 16 2. When processing the current semantic type, consider to what extent the descendant semantic types of its group are more specific than its parent semantic type. If it is much more specific, then choose the current semantic type to head its group by marking it with a star. That means the parent will be in a separate group. Otherwise, the parent semantic type should be added to the group of the current semantic type. Remark: Although the marking is attached to the current semantic type, the decision is actually whether to include the parent in the same group. 3. The star marking of each participant will be used to define a metaschema, where each semantic type marked by a star names a metasemantic type. The metaschema will be compared with the results of other respondents and with our algorithmically derived metaschema." Reliability of the experts The reliability theory [36] is used to assess the variability of the experts in producing the bottom-up metaschema. When experts designate each ST as belonging or not belonging to a metaschema, their answers may reflect an idealized consensus opinion about which STs truly belong to it, or they may reflect error, noise, and differences of opinion. Cronbachs alpha [36] is used to estimate the proportion of the total variability in the experts' answers that is due to true differences among STs (some do and some do not belong in the metaschema). The remainder of the variability (1 Cronbach's alpha) represents the error, noise, and differences of opinion. Cronbach's alpha ranges from 0 to 1, where 0 represents pure noise and 1 represents perfect consensus among the experts. A value of.7 is often used as a target for reasonable reliability. In general, by combining the answers of several experts, one obtains a better and more reliable result. One can report the average per rater reliability, which measures the degree to which the average expert tends to agree with other experts, or one can report the reliability of the combined result, which will always be higher than the per rater estimate. For example, a metaschema produced by one expert will not be as good as one produced by the combined opinion of several experts (a consensus metaschema). Cronbach's alpha estimates the reliability of the combined result, but the per rater reliability can be calculated easily from it [36].
34 17 Cronbach's alpha for the bottom-up metaschema was calculated, treating each of the 45 candidate STs as expert tasks. Then the result is compared to that of the top-down metaschema. These results appear in Section Comparing Metaschemas In the comparison of two metaschemas, not only the MST names are considered, but also the underlying ST groups represented by the MSTs. To support the comparison, four definitions are presented as follows. Let MA and MB be two metaschemas of the SN. Definition 1 (Identical): An MST A in MA is identical to an MST B in MB if both MSTs have the same underlying ST group. 0 Since the ST group of an MST is connected and is part of the tree hierarchy of SN, this group is a tree. Since the root is used to name the MST of the group, both MSTs A and B share the same name. Definition 2 (Similar): An MST A in MA is similar to an MST B in MB if both MSTs have the same name and the same root. El Again, the names are the same, because the roots are the same. To better understand the differences between pairs of similar MSTs, it is noted that in some cases the differences reflect various levels of granularity in the partition, rather than major disagreements between the metaschemas. An MST in one metaschema may be split into several MSTs in the other metaschema. Now "refinement" is defined as follows. Let Gm (A) denote the ST group represented by the MST A in the metaschema M. Definition 3 (Refinement): Let A be an MST in the metaschema MA. If there exists a set of MSTs {B1, B2,..., (k > 2) in the metaschema MB such that A and B1 (which is the root of {B i }) are similar (that is, the STs A and B 1 are equal) and GmA (A) = (B i), then the set {B 1, B2,..., Bk} is called a refinement of A in MB.
35 18 Definition 4 (Refinable): Two similar MSTs A in the metaschema MA and B in the metaschema MB are called refinable if either A has a refinement in MB or B has a refinement in MA. 1:1 Definition 5 (Non-Refinable): Two similar MSTs A in the metaschema MA and B in the metaschema MB, neither of which has a refinement in the other metaschema, are called non-refinable. To illustrate these definitions, Figure 2.5 demonstrates an abstract semantic network S of STs (Figure 2.5(a)) and the two abstract metaschemas MA (Figure 2.5(b)) and MB (Figure 2.5(c)). Figure 2.5: The abstract semantic network and input metaschemas. A black shadow for two MSTs with identical names in the two metaschemas MA and MB indicates identical MSTs. For example, the ST set for MST S1 is {S1} for both MA and MB. Both MSTs S2 and S3 for the metaschemas MA and MB are similar. But their characteristics differ. The occurrences of S2 in both metaschemas define a refinement. More precisely, {S2(3), S5(2)1 in MA is a refinement of S2(5) in MB, since the ST group of S2(5)={S2, S4, S6, S5, S9} is equal to the union S2(3) U S5(2)={S2, S4, S6} 1 J {S5,
36 19 S9}. The occurrences of S2 in both metaschemas are refinable. The occurrences of S3 in both metaschemas are non-refinable. Two metaschemas are compared using the above three terms to measure the similarity between their ST coverages. To capture cases of either identical MSTs or MSTs which reflect only granularity differences between two metaschemas, another term, correspondable MSTs is introduced. Definition 6 (Correspondable): An MST A in MA is correspondable to an MST B in MB if A and B are either identical or refinable. 0 Definition 7 (Corresponding MST groups): Two groups of MSTs in two metaschemas MA and MB, respectively, are corresponding MST groups if either both groups are singletons of identical MSTs or one group is a singleton and the other group is a refinement of the MST of the singleton. 0 For example, in Figure 2.5 there are two pairs of corresponding MST groups, shown by broken lines circumscribing them. They are the identical S 1(1) in MA and S 1(1) in MB and the groups S2(3) U S5(2) in MA and S2(5) in MB of which the first is a refinement of the second Structural Properties of Metaschemas Now several structural metrics for characterizing a metaschema M are listed below. 1 Cardinality C: The number of MSTs in a metaschema: 2 Complexity: The ratio of the number of relationships (both hierarchical and semantic relationships) to the Cardinality; For convenience the number of STs represented by an MST M i, i = 1,..., C is referred as the weight W (Mi ) of the MST.
37 20 8 Coverage: Percentage of SN semantic relationships covered by the meta-relationships of the metaschema. This measure is based on [15, 16] and will be used sparingly in this paper. From the structural point of view, in an ideal partition of n elements into k groups, each group will have an almost equal weight (WS is at most 1). Such a partition is called a uniform partition. However, if the elements are nodes of a tree and the partition is into connected subtrees, then due to the structure of the tree, a uniform partition is not always possible. Thus, as an approximation to a uniform partition, a partition with a minimum weight spread is desirable. Other alternatives are a partition with a minimum heaviest weight (MIN-MAX partition) or a partition with a maximum lightest weight (MAX-MIN partition). For algorithms to construct a MAX-MIN partition and a MIN-MAX partition of a weighted tree, see [37, 38]. Beyond the two extreme measures, MAXW and MINW, of the partition, all its weights should be as close as possible to the average weight. For this purpose, it is desirable that the standard deviation of the weights be as small as possible. Furthermore, the partition underlying a metaschema will probably not be uniform due to its need to capture different subject areas correctly. This is a much more important consideration than the equal size of the MST groups. Nevertheless, there are cases where one can choose between two options regarding the grouping, for which there is no clear-cut semantic reason to decide between them. In such a case, the structural criteria should be followed and the option which tends to equalize the weights of the groups is preferred, avoiding groups which are too large or too small.
38 Consolidation An consolidation algorithm was developed, which takes two given metaschemas MA = {A1, A2,..., Am } and MB = {B1, B2,..., /372} for an abstract Semantic Network S as input, and generates an output Mc, which is a consolidated metaschema. When constructing the consolidated metaschema, the algorithm attempts to minimize the MAXW and the weights' standard deviation, while maximizing the MI NW for this metaschema. In doing this, the algorithm tries to improve the structural properties of the resulting consolidated metaschemas by choosing MSTs of the two given metaschemas accordingly. In this algorithm, a sequence of auxiliary Semantic Networks and auxiliary metaschemas derived from the original Semantic Network S and the metaschemas MA and MB is constructed in this 'algorithm. In the description of the algorithm, the previously defined terms will be used: identical MSTs, similar MSTs, refinable MSTs, correspondable MSTs, non-refinable MSTs and corresponding MST groups. A few more definitions will be needed. Definition 8 (Auxiliary Induced Metaschema): Given a metaschema MA defined for a semantic Network S, an auxiliary induced metaschema MA' is obtained from MA by deleting some selected MSTs of MA or by combining some groups of MSTs of MA into new MSTs such that all the child-of in the original metaschema MA among MSTs of MA' exist in MA'. Definition 9 (Expanded Semantic Network): Let MA' be an auxiliary induced metaschema of the metaschema MA defined for Semantic Network S. The expanded Semantic Network S' of the metaschema MA' contains all the STs of all MSTs of MA' and all IS-A relationships in the original Semantic Network S among the STs of S'. It is worth pointing out that S may consist of several connected components (as for the UMLS SN). In such a case the algorithm works independently on each component. The algorithm MAIN-CONSOLIDATE (MA, MB, S, Mc) consists of two stages. It first invokes
39 22 its core procedure R-CONSOLIDATE (MA, MB, S, Mc) to obtain an initial consolidated metaschema Mc, and then further modifies Mc to complete the consolidation. A highlevel description of the algorithm MAIN-CONSOLIDATE (MA, MB, S, Mc) will now be presented, followed by a step-by-step description. The procedure R-CONSOLIDATE (MA, MB, S, Mc) is a recursive procedure to create a consolidated metaschema Mc from two given metaschemas MA and MB of a Semantic Network S. The procedure starts by selecting all the identical MSTs of MA and MB for Mc. It continues by selecting from each pair of corresponding MST groups of MA and MB, an MST or a group of MSTs, which minimizes the standard deviation contributions, to be added to Mc. The identical MSTs and corresponding MST groups of both input metaschemas are deleted from MA and MB in such a way that auxiliary induced metaschemas MA' and MB' are generated. Next, the expanded semantic network S' of MA ' (and of MB', which is identical) is created. At this stage, all root MSTs of./14a' and MB' are non-refinable. Let A i and B3 be two similar root MSTs of MA' and MB', respectively. The one of A i and Bj which minimizes the standard deviation contribution is added to Mc. Without loss of generality, assume that MST A i of MA' was selected for adding to Mc. The induced auxiliary metaschema MA " is derived by removing the MST A, from MA'. Next, the expanded semantic network S" from MA" is obtained. If MA" (and S") are empty, Mc is returned and the algorithm is finished. If MA" is not empty, there is a difficulty. The auxiliary metaschema MB" cannot be obtained from MB' by deleting Ai, since Ai is not an MST in MB', neither does it have a refinement in MB', since the MST A, of MA' is non-refinable. As a result, MB" will be obtained in an indirect way, following the derivation of several auxiliary induced metaschemas of MB' and their expanded semantic networks. First the auxiliary induced metaschema MB * is obtained from MB' which will include all the MSTs of MB' for which all their STs are in S". The expanded semantic network S*
40 23 of MB * is derived. The semantic network D is derived by deleting from S' all the STs of S*. Next, an auxiliary induced metaschema SD is induced for the semantic Network D, consisting of the connected components of D. Each component is represented by one MST, named after its root. Finally, the desired auxiliary induced metaschema MB" is derived by combining the metaschemas MB* and SD. At this stage, it is ready for a recursive call of the procedure R-CONSOLIDATE (MA", MB'', S", Mc), to update the metascherna Mc. After receiving the updated Mc, it is returned as a partial result. If Mc contains an MST of one ST, with at most one child, it is added to its parent MST. Now, this algorithm will be described as a series of separate steps. To keep track of this fairly complicated process, a diagram is provided in Figure 2.6, which reflects the process described in R-CONSOLIDATE and which the reader may use as a road map. The procedure's steps are labeled by numbers. By necessity some of the numbers occur twice in the diagram, because they describe operations with two inputs or because the described operation may occur for either one of the two input metaschemas. Following the step-bystep algorithm description, there is an example. The reader is advised to review the example in parallel to reading the algorithm. Procedure R-CONSOLIDATE (MA, MB, S, Mc) Step 1: All MSTs that are identical (as defined above) in both input metaschemas MA, MB are included in the output metaschema Mc. Step 2: When given an ST in one input metaschema and its refinement in the other input metaschema, for example, the set {B 1, B2,..., Bk} with a refinement of Aj, then if The same rule applies to an MST B1 with a refinement {A1, A2,..., Am}. In case of different cardinalities for MA and MB the average of the two cardinalities is used for calculating the contribution to the standard deviation.
41 24 Figure 2.6: The flow chart of consolidation with numbered steps. Step 3: Two auxiliary induced metaschemas MA' (MB') are constructed from MA (MB) by removing from MA (MB) all corresponding MST groups (identified in the two previous steps). Step 4: An expanded semantic network S' of MA' is constructed from the given semantic network S. Step 5: Choosing from non-refinable similar root MSTs A, and Bj (in MA' and MB', respectively), (i) if SDC(Ai) < SDC(Bj ), include A i in the consolidated metaschema Mc. Otherwise, (ii) include B 3 in Mc. If there are several roots, such a choice is made for each root. Step 6: Assuming without loss of generality that Ai of MA' was selected (case (i)), an auxiliary induced metaschema MA" from MA' is constructed by removing from MA' the root MST Ai. If MA" is empty then return. Note that, if Bj was selected for case (ii), a role reversal of MA' and MB' is assumed.
42 25 Step 7: An expanded semantic network S" of MA" and the semantic network S' is constructed. Step 8: An auxiliary induced metaschema MB * is constructed from MB' is as follows. Only those MSTs (from MB') which have all their semantic types in S" are included in MB *. Step 9: An expanded semantic network S* of MB * and the semantic network S* is constructed. Step 10: The difference D of S" and S* is constructed as follows. D contains all the STs of S" which are not in S*, i.e., traditional set difference is used. Step 11: An auxiliary induced metaschema SD is constructed, which consists of the maximally connected components of D, with each component corresponding to one MST, named after its root. Step 12: The auxiliary induced metaschema MB" is constructed as follows. SD is combined with MB * using appropriate meta child-of relationships from the MSTs of MB * up to the MSTs of SD. Step 13: If the metaschemas MA" and MB" consist of one connected component then recursively call R-CONSOLIDATE (MA", MB", 8", Mc). Otherwise, recursively call R- CONSOLIDATE for every pair of connected components (MA,", MB,"), such that MA " and MBA " have similar MST roots, A, and 13j, with their corresponding expanded semantic network. Return the partially consolidated metaschema Mc. END Procedure R-CONSOLIDATE Algorithm MAIN-CONSOLIDATE (MA, MB, 8, Mc) Stage 1: Invoke R-CONSOLIDATE (MA, MB, 8, MC) Stage 2 (Modification): Each MST in Mc, with only one ST (such MSTs are called singletons) is combined with its parent MST whenever this child MST is a leaf or has a single child in Mc..
43 26 Return the completely consolidated metaschema Mc. END Algorithm MAIN-CONSOLIDATE Example The MAIN-CONSOLIDATE (MA, MB, S, Mc) algorithm is demonstrated for MA, MB and S given in Figure 2.5. The algorithm first invokes the procedure MAIN-CONSOLIDATE, passing MA, MB, S and an empty Mc as arguments. The following Steps 1 to 13 show the process of MAIN- CONSOLIDATE. Step 1: S1 is an identical MST in MA and MB and is included in Mc (Figure 2.7(a), (b), (c)). There are 19 STs in the abstract semantic network S, and 5 MSTs in both MA and MB. Thus, the average MST's weight for both metaschemas is 3.8, which is used for computing the SDC. Step 2: S2(5) in MB (Figure 2.7(b)) contributes 1.44 to the standard deviation, while its refinement {S2(3), S5(2)1 in MA (Figure 2.7(a)) contributes = In this case, S2(5) of MB is chosen for Mc (Figure 2.7(c)). Step 3: S1(1), S2(3) and S5(2) are removed from MA to yield MA'. S1(1) and S2(5) are removed from MB to yield MB' (Figure 2.7(d), (e)). Step 4: S' is constructed by expanding of S3(3) and S 10(10) of MA' (Figure 2.7(0). Step 5: For this example, S3(3) in MA' (Figure 2.7(d)), which contributes 0.64 to the standard deviation, is chosen, rather than S3(8), in MB' (Figure 2.7(e)), which contributes Step 6: The MST S3(3) of MA' is deleted as is indicated in Figure 2.8(a) by diagonal lines, to obtain MA" as shown in Figure 2.8(d). Step 7: S" is generated by reexpanding M4", which has one MST S 10(10) (See Figure 2.8(e))
44 Figure 2.7: Consolidating and deleting corresponding MSTs. 27
45 Figure 2.8: Constructing MA" and S". 28
46 29 Step 8: For MB' of Figure 2.9(a) and S" of Figure 2.9(b), MB * = {S14(2), S16(3)}, see Figure 2.9(c). S3(8) is not included in MB*, because S3 is not in S". Step 9: MB * is expanded to get S*. For the MB * of Figure 2.9(c), S* is shown in Figure 2.9(d). Step 10: D is constructed by removing S 14(2) and S 16(3) from S" (Figure 2.9(e)). Step 11: As there is only one component, the induced auxiliary metaschema SD consists of S 10(5) only (Figure 2.9(0). Step 12: S 10(5) is combined with S 14(2) and S 16(3) into MB" (Figure 2.9(g)). Please note that the MST S 10(5) was not an MST in the original MB metaschema. What have been achieved now? MB" is a metaschema for S". MA" has been a metaschema of S" all along. Most importantly, neither MA" nor MB" represents any semantic types which are represented by the MSTs in Mc. Thus, the output metaschema has been extended, while the two input metaschemas have been shrunk correctly, and they correctly summarize their corresponding "shrunk" semantic network. Step 13: The MST group S10(5), S 14(2), S 16(3) of MB", in Figure 2.9(g), is the refinement of S10(10) of MA" in Figure 2.8(d). In this case the refinement in MB" has lower standard deviation contribution than S10(10) and is chosen for the consolidated metaschema. After the deletion of the corresponding MSTs, the resulting metaschemas are empty and the procedure returns. At this point, the Mc is a partially consolidated metaschema and the first stage of the MAIN-CONSOLIDATE algorithm is done. At the second stage, S 1(1) is a singleton MST, but it has two children, thus it is legitimate and no modification occurs. The consolidated metaschema Mc for the given metaschemas MA and MB for the abstract semantic network S is shown in Figure Repeated Consolidation of Metaschemas It is interesting to see whether repetitive consolidation leads to further structural improvements, since better structural properties are expected to lead to better utilization of a metasch-
47 Figure 2.10: Consolidated metaschema. 30
48 31 ema in orientation and visualization of the SN. In this subsection, the effect of applying the algorithm MAIN-CONSOLIDATE repeatedly to different pairs of metaschemas is described. First, it is applied to the two algorithmically generated metaschemas Cohesive Metaschema and Lexical Metaschema, resulting in the Consolidated Algorithmic Metaschema. Then, the algorithm is applied to the two (human experts) consensus metaschemas Top-down Consensus Metaschema and Bottom-up Consensus Metaschema to obtain a Consolidated Consensus Metaschema. Lastly, the algorithm is applied to the two consolidated metaschemas, the Consolidated Algorithmic Metaschema and the Consolidated Consensus Metaschema, and a Final Consolidated Metaschema is derived. These seven metaschemas, the four original ones and the three obtained by repeated consolidation, will be compared according to their structural properties. 2.3 Results Bottom-up Heuristic Metaschema In the bottom-up study, responses from thirteen experts were collected. Individual participants' responses varied both in the choice of STs marked and their numbers. For example, experts 1 and 3 chose 28 and 17 STs, respectively, to name MSTs in their expert metaschemas. Table 2.4 shows the number of MSTs for each expert metaschema, corresponding to the number of STs marked by that expert. The average number of MSTs marked is 23, with minimum and maximum numbers of 16 and 30, respectively. The standard deviation is Table 2.4: Number of MSTs Each Expert Chose in the Bottom-up study Participant I Averagel # MSTs I 28 I I 25 I 22 I I I 20 I 29 I 30 I 23 1 Each expert's response can be used to construct one expert's metaschema. thirteen cumulative metaschemas were obtained, from the thirteen experts' (X=13) metaschemas,
49 by varying N over the range (1,13). In the N-th cumulative metaschema, N = 1,..., 13, each MST was chosen by at least N experts. For N=8, for example, there were 16 STs marked by at least eight out of the thirteen experts, and thus the corresponding cumulative metaschema has 16 MSTs. Table 2.5 shows the number of STs marked for each N. Table 2.5: Number of MSTs Chosen by at Least N Participants Threshold (N) # MSTs As can be seen from the table, the number of MSTs varies from 3 (for N=13) to 41 (for N=1 and 2). Obviously such extreme metaschemas are not interesting. The consensus metaschema (N=7) contains 25 MSTs. Its hierarchy is shown in Figure In the bottom-up study too, individual participants' responses varied greatly, both in the choice of STs marked and their numbers. To substantiate this, the agreement matrix of all thirteen experts was constructed (Table 2.6), which demonstrates the agreement as well as the high variability of participant responses. For instance, participants 1 and 4 marked 28 and 25 STs respectively, and agreed on only 16 of them. The average inter-participant agreement is 14.41, only 67% of the average number of 23 marked STs, with a high of 25 and a low of 6. Table 2.6: Inter-participant Agreement Matrix; Average = I
50 33 Figure 2.11: Bottom-up consensus metaschema hierarchy. Cronbach's alpha for the consensus bottom-up metaschema was This implies that the consensus metaschema is sufficiently reliable (greater than 0.7; see Section 2.2.1). For the Top-down Consensus Metaschema, Cronbach's alpha was 0.62, which is lower than the threshold, but still reasonable. By looking at the per rater reliability, one can correct for the fact that the Bottom-up Consensus Metaschema had more experts than the top-down one. The per rater reliability for the Bottom-up Consensus Metaschema was 0.23, and for the Top-down Consensus Metaschema it was The difference was borderline significant (p =.053). These results imply that a metaschema produced by a single expert by either method is insufficiently reliable (i.e., both are well below 0.7) and that the bottom-up approach is probably more reliable than the top-down approach, although the difference did not quite achieve statistical significance. Another way to understand the results is to ask how many experts' answers would need to be combined to achieve the target reliability of 0.7. The bottom-up approach would require eight experts on average, whereas the top-down approach would require 16.
51 Results of Metaschema Comparison To facilitate the comparison between the consensus metaschemas obtained from the two studies, both their hierarchies are shown in Figure MSTs identical in both metaschemas are indicated by black shadows. Similar MSTs are denoted by gray shadows. There are 12 MSTs identical for the two metaschemas. For example PATHOLoGICAL FUNCTION(6) is an MST in both metaschemas, representing the same underlying ST group. Table 2.7 lists all the identical MSTs and their sizes. Hence, both metaschemas agree that these 12 MSTs represent important subject areas in the SN. Altogether, they cover 47 STs (i.e. 34.8% of the SN). Table 2.7: Identical MSTs in Both Metaschemas MST Size BEHAVIOR 3 BIOLOGICALLY ACTIVE SUBSTANCE 7 EVENT 1 FINDING 3 GROUP 6 HEALTH CARE ACTIVITY 4 MANUFACTURED OBJECT 5 OCCUPATION OR DISPLINE 2 ORGANIZATION 4 PATHOLOGIC FUNCTION 6 PHENOMENON OR PROCESS 5 PLANT 2 Total: There are seven similar MSTs. For example, BIOLOGICAL FUNCTION(8) in the Topdown Consensus Metaschema is similar to BIOLOGICAL FUNCTION(1) in the Bottom-up Consensus Metaschema. Table 2.8 shows these similar MSTs along with their sizes in each of the two metaschemas. In the top-down study metaschema, these seven MSTs cover 60 STs, which is about 44% of the SN. In the Bottom-up Consensus Metaschema, these seven MSTs cover 38 STs, which is about 28%.
52 Figure 2.12: Comparison of consensus metaschemas. 35
53 36 Table 2.8: Similar MSTs in Both Metaschemas MST Weight in Top-down Consensus Metaschema Weight in Bottomup Consensus Metaschema ANATOMICAL STRUCTURE 11 8 ACTIVITY 6 8 BIOLOGICAL FUNCTION I 8 1 ENTITY 1 8 ORGANISM 15 6 SPATIAL CONCEPT 8 4 SUBSTANCE 11 3 Total: To better understand the nature of the similarity represented in Table 2.8, refinements will be explored in both directions. Consider the MST ORGANISM(15) in the Top-down Consensus Metaschema. This MST is split into two separate MSTs, ORGANISM(6), and ANIMAL(9), in the Bottom-up Consensus Metaschema. In other words, {ORGANISM(6), ANIMAL(9)} in the Bottom-up Consensus Metaschema is a refinement of ORGANISM(15) in the Top-down Consensus Metaschema. The refinement cases cover 42 STs in both metaschemas. Table 2.9 lists the refinement cases of the Top-down Consensus Metaschema. Table 2.9: Refinements in Bottom-up Consensus Metaschema MST in Top-down Consensus Metaschema ANATOMICAL STRUCTURE(1 1) BIOLOGICAL FUNCTION(8) ORGANISM(15) Refinement in the Bottom-up Consensus Metaschema {ANATOMICAL STRUCTURE(8), ANATOMICAL ABNOR- MALITY(3)} {BIOLOGICAL FUNCTION(1), PHYSIOLOGICAL FUNCTION(7)} {ORGANISM(6), ANIMAL(9)} SPATIAL CONCEPT(8) {SPATIAL CONCEPT(4), MOLECULAR SEQUENCE(4)} Total: 4 42 Considering refinements of the Bottom-up Consensus Metaschema, i.e. in the other direction, there is one case. {ACTIVITY(6), RESEARCH ACTIVITY(2)} in the Top-down Consensus Metaschema is the refinement of ACTIVITY(8) in the Bottom-up Consensus metaschema.
54 Results of Structural Evaluation In Table 2.10, the values of the eight structural measures for both the consensus metaschemas are shown. For example, the Top-down Consensus Metaschemas has the cardinality 26, while the Bottom-up Consensus Metaschema has the cardinality 25. Table 2.11 shows the distribution of the weights for both metaschemas. For example, both metaschemas contain three MSTs of weight six. Remember that weight six means there are six STs in the group represented by the MST. Table 2.10: Values for the Structural Measures for the Two Consensus Metaschemas Measures Top-down Consensus Metaschema Bottom-up Consensus Metaschema Cardinality Complexity Maximum weight Minimum weight 1 1 Weight spread Average weight Standard deviation Coverage 70.6% 75.93% Table 2.11: Weight Distribution of the Two Consensus Metaschemas Weight Topdown Bottomup Weight Topdown Bottomup Consolidated Consensus Metaschema Following the MAIN-CONSOLIDATE algorithm, a consolidated consensus metaschema of the two consensus metaschemas, may be derived as follows. Steps 1 to 13 show the process of the R-CONSOLIDATE procedure (see Section 2.2.4).
55 Step 1 The 12 identical MSTs in both metaschemas (marked with black shadows in Figure 2.12) are included in the Consolidated Consensus Metaschema. 38 Step 2 The MST or its refinement whichever minimizes the SDC is selected. The two consensus metaschemas have different cardinalities, 25 and 26. Thus, in calculating the contribution to the standard deviation, the average 25.5 of the two cardinalities is used. For instance, on one hand, BIOLOGICAL FUNCTION(8) in the Top-down Consensus Metaschema contributes 7.3 to the standard deviation, while the refinement {BIOLOGICAL FUNCTION(1), PHYSIOLOGICALFUNCTION(7)} in the Bottom-up Consensus Metaschema contributes In this case, BIOLoGICAL FUNCTION (8) is selected for the consolidated metaschema. On the other hand, ORGANISM(15) in the Top-down Consensus Metaschema contributes 94.1, but its refinement in the bottom-up metaschema {ORGANISM(6), ANIMA- L(9)} only contributes This refinement is selected for the consolidated metaschema. The corresponding MSTs are marked either by black shadows for identical MSTs or are marked with dashed borders for similar MSTs with refinements (see Figure 2.13(a), (b)). Figure 2.14 shows the partial consolidated metaschema after selecting corresponding MSTs. The corresponding groups of MSTs selected for the Consolidated Consensus Metaschema to minimize the SDC, are circumscribed by broken lines. Step 3 Two auxiliary metaschemas MA' and MB' are constructed by deleting from MA and MB the identical MSTs and the corresponding MST groups, as shown in Figures 2.15(a) and 2.15(b). Step 4 An expanded semantic network SN' is derived using all STs summarized by all MSTs of MA' together with the IS-A relationships directed to them in SN. Figure 2.15(c) shows SN', which consists of two subtrees, one rooted at Substance and the other at Entity. Each of the two auxiliary metaschemas MA' and MB' is a metaschema of SN'. The consol-

56 Figure 2.13: The Consolidation of Corresponding MSTs. 39
57 40 Figure 2.14: The partial consolidated metaschema with corresponding MSTs. idation of each of the subtrees is now described independently. Please note that at this stage the Event portion of the consolidated metaschema is fully determined. Step 5 for Substance For the subtree of SN' rooted at Substance (Figure 2.15(c)), based on the SDC, SUBSTANCE(3) in the Bottom-up Consensus Metaschema MB' is chosen, rather than SUBSTANCE(11) in the Top-down Consensus Metaschema MA'. Step 6 for Chemical Since SUBSTANCE(3) in the Bottom-up Consensus Metaschema is selected for the Consolidated Consensus Metaschema, an auxiliary induced metaschema MA" is obtained, which contains only one MST, CHEMICAL(18). Step 7 for Chemical SN" is the expanded Semantic Network for MA" (see Figure 2.16 (a) and (b)). Step 8 for Substance Since SUBSTANCE(3) is not an MST of the Top-down Consensus Metaschema, MB * needs to be constructed from MB' in order to obtain MB". MB * contains the MSTs from MB' which have all their STs in SN", in this case, PHARMA- COLOGIC SUBSTANCE(2) and ORGANIC CHEMICAL(8) (see Figure 2.16 (c)).
58 Figure 2.15: Auxiliary metaschemas MA', MB' and expanded semantic network SN'. 41
59 Figure 2.16: Induced Auxiliary metaschemas MA", MB" and Induced semantic network SN". 42
60 Step 9 for Pharmacologic Substance and Organic Chemical An expanded semantic network SN* from the metaschema MB * is constructed ((see Figure 2.16 (d)). 43 Step 10 for Chemical The difference D of SN" and SN* is constructed ((see Figure 2.16 (e)). Step 11 for Chemical The SD now consists of CHEMICAL(8) obtained from the grouping of the STs which are contained in D. Step 12 for Chemical Once MB * and SD are obtained, MB" can be derived. It contains all MSTs from SD and MB*, CHEMICAL(8), PHARMACOLOGIC SUBSTANCE(2) and ORG- ANIC CHEMICAL(8), as well as the meta-child-of relationships from the last two MSTs to CHEMICAL(8). ((see Figure 2.16 (f)). Step 13 for Chemical Comparing MA", which consists of CHEMICAL(18), of the Bottomup Consensus Metaschema and MB", consisting of {CHEMICAL(8), PHARMACoLOGIC SUBSTANCE(2) and ORGANIC CHEMICAL(8)}, this is a case of similar MSTs with a refinement. This situation is handled as discussed in Step 3. The refinement {CHEMICAL(8), PHARMACOLOGIC SUBSTANCE(2) and ORGANIC CHEMICAL(8)} is selected for the conso lidated metaschema rather than CHEMICAL(18) because it contributes less to the standard deviation, compared to CHEMICAL(18). Note that the only MST of the Consolidated consensus Metaschema (of the SUBSTANCE component) which is not an MST of a given metaschema is CHEMICAL(8). Step 5 for Entity For the subtree rooted at Entity, ENTITY(1) is less expensive than ENTITY(14) (see Figure 2.17), in terms of the standard deviation contribution. Therefore ENTITY(1) in the Top-down Consensus Metaschema is chosen (see Figure 2.17(a)).
61 44 Step 6 for Entity ENTITY(1) will be removed from the Top-down Consensus Metaschema together with the two meta-child-of relationships directed to it, as shown in Figure 2.17(a). An MA", which is {PHYSICAL OBJECT(1), CONCEPTUAL ENTITY(5), INTELLECTUAL PRODUCT(3), IDEA or CONCEPT(6)} (Figure 2.18(a)), is obtained as a result of the deletion. The metaschema MA" consists of two disconnected MST subtrees, one rooted at PHYSICAL OBJECT(1) and the other at CoNCEPTUAL ENTITY(3). Step 7 for Physical Object and Conceptual Entity The expanded semantic network SN" constructed from MA", consists of two subtrees rooted at Physical Object and Conceptual Entity, respectively (Figure 2.18(b)). Summary of Steps 8 to 13 Since ENTITY(1) is not an MST of the Bottom-up Consensus Metaschema, an MB * needs to be derived, which consists of ORGANISM ATTRIBUTE(2) only (See Figure 2.18(c)). The semantic network SN* constructed from MB * includes Organism Attribute and Clinical Attribute (Figure 2.18(d)). SD can then be obtained as {PHYSICAL OBJECT(1), CONCEPTUAL ENTITY(12)} as a grouping of the difference D of SN" and SN* into maximally connected components (Figure 2.18(e)). The resulting MB" combining MB * and SD and all meta-child-of links connecting them is therefore {PHYSICAL OBJECT(1), CONCEPTUAL ENTITY(12), ORGANISM ATTRIBUTE(2)} (Figure 2.18(f)). Since MA" and MB" are not empty, the R-CONSOLIDATE procedure can be applied recursively to the MA" of the Top-down Consensus Metaschema and the MB" of
62 Figure 2.18: Processing for Entity. 45
63 46 the Bottom-up Consensus Metaschema and their common semantic network SN". To avoid repetition, the details of this recursive call are omitted. Obtaining the Consolidated Consensus Metaschema Mc In the modification stage of the MAIN-CONSOLIDATE algorithm, the entire Consolidated Consensus Metaschema is scanned, looking for singleton MSTs which are not branching points in the metaschema. The singleton MST PHYSICAL OBJECT(1) is not a branching point in the metaschema. Thus, PHYSICAL OBJECT(1) is merged with its parent ENTITY(1) to create the MST ENTITY(2). The MST MANUFACTURED OBJECT(5) which was meta-child-of PHYSICAL OBJECT(1), is now meta-child-of ENTITY(2) Properties of the Consolidated Consensus Metaschema The Consolidated Consensus Metaschema is shown in Figure There are 28 MSTs in the Consolidated Consensus Metaschema. Twelve MSTs were derived from the identical MSTs in the two original consensus metaschemas. Eight MSTs were taken from cases of refinement, seven of which come from the Bottom-up Consensus Metaschema. Only BIOLOGICAL FUNCTION(8) comes from the Top-down Consensus Metaschema. The remaining 8 MSTs come from the two subtrees rooted in non-refinable similar MSTs, namely Entity and Substance. Among those 8 MSTs, CoNCEPTUAL ENTITY(5), INTELLECTUAL PRODUCT(3), IDEA or CoNCEPT(6), ORGANIC CHEMICAL(8) and PHARMACOLoGIC SUBSTANCE(2) are from the Top-down Consensus Metaschema, while only SUBSTANCE(3) is from the Bottom-up Consensus Metaschema. ENTITY(2) and CHEMICAL(8) are the only two MSTs, of the consolidated metaschema which do not appear as MSTs in the Top-down or Bottom-up Consensus Metaschemas. They are still similar to MSTs, in the two given metaschemas respectively, but with different groups. The structural properties of the Consolidated Consensus Metaschema will be compared to those of the consensus metaschemas in Section 2.4.
64 Figure 2.19: Consolidated Consensus Metaschema hierarchy. 47
65 To complete the analysis of the Consolidated Consensus Metaschema, non-is-a, i.e. associative relationships are considered. An occurrence of an associative relationship at an MST is called an introduction occurrence for this kind of relationship if this kind of relationship is not defined for the parent of this MST. Please note that the same kind of relationship, e.g. "issue in," may have several introduction occurrences at several MSTs, none of which is an ancestor of another. All other occurrences the same relationship are inherited from some introduction occurrence of this kind of relationship. The complete Consolidated Consensus Metaschema including the introduction occurrences of associative (semantic) relationships appears in Figure Each relationship name has to be coded as a number (See Table 2.12). The inherited relationships are omitted from Figure 2.20 to reduce its graphical complexity, as they can be deduced by inheritance. However, the inherited associative relationships will be taken into account in calculating the complexity of the metaschema (see Section 2.4). Table 2.12: Relationship Number Codes Number Relationship Number Relationship Number Relationship 1 co-occurs_with 2 part_of 3 result_of 4 associated_with 5 affects 6 occurs_in 7 complicates 8 location_of 9 manifestation_of 10 exhibits 11 produces 12 process_of 13 disrupts 14 interacts_with 15 issue_in 16 evaluation_of 17 performs 18 uses 19 method_of 20 conceptual_part_of 21 causes 22 carries_out 23 precedes 24 degree_of 25 diagnoses_of 26 treats 27 prevents 28 ingredient_of I Repeated Consolidation of Metaschemas In Figure 2.22, the Consolidated Algorithmic Metaschema is shown, which results from the consolidation of the Cohesive Metaschema and the Lexical Metaschema in Figure The fill patterns of the boxes show the sources of the non-identical MSTs. Many more MSTs are from the Cohesive Metaschema than from the Lexcial Metaschema. Figure 2.19
66 Figure 2.20: Consolidated Consensus Metaschema with relationships.
67 shows the Consensus Consolidated Metaschema obtained from the Top-down Consensus Metaschema and the Bottom-up Consensus metaschema. The fill patterns help to compare the Consolidated Algorithmic Metaschema and the Consolidated Consensus Metaschema for the purpose of their consolidation into the Final Consolidated Metaschema (Figure 2.23). The fill patterns show for Final Consolidated Metaschema show the sources of the nonidentical MSTs from the Consolidated Algorithmic Metaschema and the Consolidated Consensus Metaschema. The structural properties of all metaschemas appear in Table Table 2.13: Comparison of the Structural Measures for All Metaschemas Measures Lexical Cohesive Top-down Bottom-up CM CCb Final Cardinality Complexity Maximum weight Minimum weight Weight Spread Average weight Standard deviation Coverage 'Consolidated Algorithmic Metaschema bconsolidated Consensus Metaschema 2.4 Discussion The purpose of the present research was to obtain a high quality metaschema. As discussed in the background section, the motivation for conducting the bottom-up study came from the dissatisfaction with the large variations in the top-down experts' metaschemas. It was hoped that the bottom-up heuristics would lead experts to produce metaschemas with less variability and higher agreement due to the higher amount of data considered in the bottom-up process compared with the top-down approach. The results indeed show lower variations among the experts (Table 2.14). Note that although the average interparticipant agreement is higher for the top-down study (16.76 vs ), this is misleading due to the larger cardinalities of the MSTs chosen by experts for the top-down study. When the


68 Figure 2.21: Cohesive Metashcema and Lexical Metaschema. 51


69 Figure 2.22: Comparison of consolidated metaschemas. 52

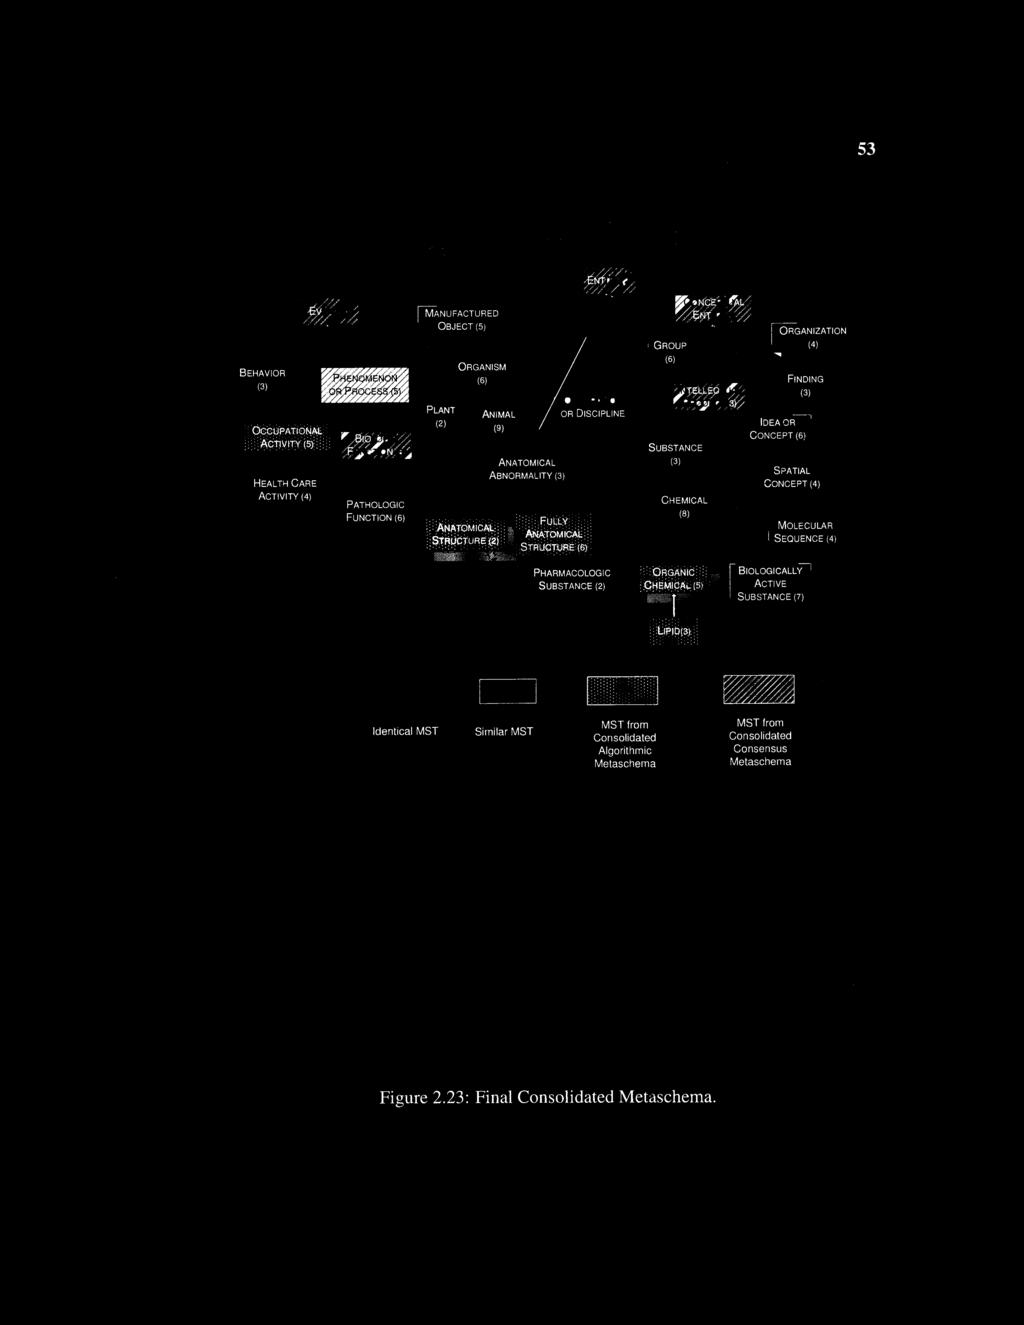
70 Figure 2.23: Final Consolidated Metaschema. 53
71 54 average agreement is measured relative to the average cardinality (26.73 vs. 23), the higher proportion of agreement is obtained for the bottom-up study (0.67 vs. 0.63). Table 2.14: Comparing Experts' Metaschemas of Both Studies Experts' Metaschema Properties Top-down Study Bottom-up Study 1 Lowest cardinality I Highest cardinality Cardinality range Average cardinality Cardinality standard deviation Upper threshold 45 I 41 Lower threshold 2 3 Threshold range Average interparticipant agreement Ratio of average agreement to average cardinality Although the variability of the experts' metaschemas is lower in the bottom-up study than in the top-down study, it is still quite high. The large range shows the high variability of participant responses, Thus, there is a problem when using any individual expert's metaschema to evaluate an algorithmically derived metaschema, as experts vary so much in their opinions (Section 4.1). It seems that one cannot rely on any one expert to provide an authoritative metaschema for the SN. At first this sounds quite disappointing. However, this phenomenon is understandable when one realizes that there is an exponential number of connected partitions for the SN, each of which would lead to a different metaschema. Furthermore, the experts are asked to make choices of importance and distinctions which are subjective and are influenced by their experience, background, specialty and personal preferences. Therefore the consensus metaschemas for both studies were derived, to overcome the variability of the individual experts' metaschemas. The two consensus metaschemas, the Top-down Consensus Metaschema and the Bottom-up Consensus Metaschema, reflect human considerations,since they are metaschemas resulting from several human experts' input. At the same time, their cumulative nature
72 55 helped to overcome the variability mentioned above. However, as their evaluations show, each of them has pros and cons, in term of its structural properties. Thus, the consolidated metaschema was constructed, which is expected to best facilitate user orientation into the SN, by enjoying the advantages of each of the consensus metaschemas and avoiding their disadvantages. Altogether, in the Consolidated Consensus Metaschema, the groups identical to both input metaschemas contain 48 (36%) STs, the groups identical only to those in the bottom up consensus metaschema contain 45 (33%) STs and the groups identical only to the Topdown Consensus Metaschema contain 32 (24%) STs. Only 10 (7%) STs are contained in MSTs which did not appear in either one of the given metaschemas, although they are similar to such MSTs (according to the definition of similar MSTs in Section 2.2.2). Hence, in the consolidated metaschema, 93% of the STs from the SN appear in MSTs selected by human experts. In [10], McCray et al. defined the naturalness property of a partition of the SN as the condition that "the groups must characterize the domain in a way that is acceptable to a domain expert." As can be seen, all MSTs except for two satisfy the naturalness property, as required for a partition of the SN by [10]. From the semantic viewpoint, it can be seen that important MSTs, missing in either of the consensus metaschemas but occurring in the other one, are now in the consolidated metaschema. For instance, MOLECULAR SEQUENCE(4), ANATOMICAL ABNORMALITY(3) and ANIMAL(9) are missing from the Top-down Consensus Metaschema. Similarly, ORGANIC CHEMICAL(8), INTELLECTUAL PRODUCT(3), IDEA or CONCEPT(6), PHARMACOLOGIC SUBSTANCE(2) and CONCEPTUAL ENTITY(5) are missing from the Bottom-up Consensus Metaschema. All these MSTs appear in the Consolidated Consensus Metaschema. In addition, the Consolidated Consensus Metaschema shows better structural properties than either of the input metaschemas (see Table 2.15). In particular, the Consolidated Consensus Metaschema has a lower weight range and a lower standard deviation. There were no statistically significant differences of the average weights of the Top-down
73 Consensus Metaschema, Bottom-up Consensus Metaschema, and Consolidated Consensus Metaschema. Table 2.15: Comparison of the Structural Measures for the Top-down, Bottom-up and Consolidated Metaschemas Measures Top-down Bottom-up Consolidated Cardinality 26 I Complexity Maximum weight I Minimum weight Weight Spread Average weight Standard deviation Coverage 70.6% 75.93% 75.05% 56 By an F test for equality of variance [39], the standard deviations of the Top-down and Bottom-up Consensus Metaschemas did not differ, but both were greater than that of the Consolidated Consensus Metaschema (p <.05). Using a bootstrap estimator [40], the maximum weight of the Top-down Consenus Metaschema was determined to be statistically significantly greater than that of the Consolidated Consensus Metaschema, but the other differences among the maxima did not achieve statistical significance. As can be seen, the Bottom-up Consensus Metaschema contributed more of its groups to the Consolidated Consensus Metaschema than the Top-down Consensus Metaschema. On one hand, this is in line with the bottom-up study being based on providing the experts with more data and the lower variability of this study. On the other hand, this is surprising in view of (Table 2.14) better structural measures of the Top-down Consensus Metaschema with regard to maximum weight and standard deviation. However, as mentioned before, these differences are not statistically significant. In spite of the much lower variability of the bottom-up experts' metaschemas, the advantage of the bottom-up study disappeared when the consensus metaschemas were obtained. This phenomenon is attributed to the largest MST, CHEMICAL(18) in the Bottom-up Consensus Metaschema. Working bottomup, most of the experts did not identify any ST in the group CHEMICAL(18), while experts
74 57 scanning the SN top down, identified ORGANIC CHEMICAL(8) and PHARMACOLOGIC SUBSTANCE(2). This largest weight contributed much more to the weight range and standard deviation of the weight than the largest MST ORGANISM(15) in the Top-down Consensus Metaschema. However, this does not imply better quality of the Top-down Consensus Metaschema for the other MSTs. Interestingly, the MAIN-CONSOLIDATE algorithm avoided selecting any large MSTs, and instead chose smaller natural MSTs covering the STs of the large MSTs in the other metaschema. The results in Table 2.13 show that consolidation indeed improves the structural properties of metaschemas and repeated consolidation improves them further. This phenomenon is demonstrated by the systematic decrease in the weight spread and the standard deviation of the weight. All four given metaschemas have a weight spread of about 15. The weight spread of the consolidated metaschemas is about half this number. The standard deviation is also cut by about a half and the standard deviation for the Final Consolidated Metaschema is 1.9, representing a grouping of the weights around the average weight of 135/30=4.5. The Final Consolidated Metaschema has neither too large groups nor groups consisting of single MSTs. Hence, the abstraction of the SN by the Final Consolidated Metaschema achieves a relatively uniform ratio of reduction across the network, a desired property for a compact abstraction. There is a tradeoff between the complexity and the coverage percentage. Naturally, a higher number of meta-relationships (which determine complexity) covers more semantic relationships of the SN. The Final Consolidated Metaschema complexity is slightly higher than that of the Consolidated Consensus Metaschema. The Final Consolidated Metaschema has coverage percentages approximately in the middle between the Consolidated Algorithmic Metaschema and the Consolidated Consensus Metaschema. Combined with the low weight spread and standard deviation, the Final Consolidated Metaschema is a well rounded metaschema in terms of its structural properties. Please note that both the complexity and coverage are high for the Cohesive Metaschema (and thus for
75 58 Consolidated Algorithmic Metaschema) due to the definition of the Cohesive Metaschema, where the partition follows the structure of the relationships [12]. The intention of the design of the consolidation algorithm was that by deriving a metaschema with improved structural properties, a better coverage of the UMLS subject areas will emerge. This happened with the Final Consolidated Metaschema. Many desired subject areas appeared in some metaschemas but not in others. Examples of such MSTs in the Cohesive Metaschema but not in the Lexical Metaschema are ANIMAL, PLANT, BEHAVIOR, OCCUPATIONAL ACTIVITY, and MANUFACTURED OBJECT. An example of such an MST in the Lexical Metaschema but not in the Cohesive Metaschema is ORGANIC CHEMICAL. But all these MSTs appear in the Final Consolidated Metaschema. Thus, the extensive research conducted on the design of metaschemas has led to one which is suggested as a complement to the partition of the SN by McCray et al. in [10]. Their partition consists of 15 groups of STs which are not necessarily connected. The Final Consolidated Metaschema represents a partition of higher granularity into 30 connected groups, which satisfy the six desired properties for an SN partition as listed in [10]. Most importantly, The Final Consolidated Metaschema satisfies the naturalness property, as all except for four MSTs (dotted) appear also in the Consensus Consolidated Metaschema representing a consensus of experts. It is interesting to note that Consolidated Algorithmic Metaschema and Consolidated Consensus Metaschema, obtained by consolidation of different metaschemas, already share 20 identical MSTs. This fact demonstrates the power of consolidation to select MST groups of medium size, which capture the subject areas of the UMLS well. 2.5 Conclusions In this chapter, two heuristic metaschemas, the Top-down and Bottom-up Consensus Metaschemas, derived from two studies involving two groups of UMLS experts, are compared from a structural point of view. Different levels of similarity are defined, such as refinment
76 59 and non-refinement. Using these definitions, it is found that both heuristic metaschemas agree in almost half (12) of the MSTs. There are seven similar MSTs, five of which are cases of refinement. Several structural properties of a metaschema are defined, such as, cardinality, complexity, maximum weight, minimum weight, weight spread, average weight, standard deviation and coverage percentage. They are used for evaluation of both consensus metaschemas. Secondly, an algorithm was designed to construct a consolidated metaschema from two given metaschemas, enjoying the advantages and avoiding the disadvantages of both. The consolidated metaschema has better structural properties, such as lower weight range as well as lower standard deviation than its inputs. It can better serve as an abstract network and support user orientation and navigation of the semantic network, due to its naturalness in identifying many groups selected by most experts in either of the studies. Furthermore, the relative structural uniformity of the consolidated metaschema, as expressed in the low weight range and standard deviation, will also support user orientation and navigation when accessing the underlying ST groups using various SN graphical views described in [12,15]. In previous research, algorithmically generated metaschemas have been derived. The Consolidated Consensus Metaschema, being a digest of many domain experts' input. has been used to evaluate the naturalness of the algorithmic cohesive [12] and lexical [15] metaschemas, rather than the Top-down Consensus Metaschema used for their evaluation in [12] and [16], respectively. The impact of repetitive consolidation of four previously developed metaschemas of the UMLS SN was also studied. The algorithm was applied to two pairs of given metaschemas and to the two resulting consolidated metaschemas. Comparing the structural properties of all seven metaschemas showed that repetitive consolidation indeed continues to improve structural properties. Especially the (most important) standard deviation WSTD reached a minimum of 1.9. The lower the WSTD is, the better is the full scope of SN
77 60 relationships visualized and comprehended. Furthermore, the Final Consolidated Metaschemas captures the subjects represented by the UMLS better than the initial metaschemas.
78 61 Glossary of Metaschemas: Metaschema: A compact, acyclic abstraction network of the SN based on a partition of the IS-A hierarchy of the SN into connected components. The nodes of the metaschema, called metasemantic types (MSTs), represent connected groups of semantic types of the SN. The MSTs are linked by hierarchical meta-child-of relationships and non-hierarchical meta-relationships. Cohesive Metaschema: A metaschema created by an algorithm based on structural considerations, described in [12]. Lexical Metaschema: A metaschema created by an algorithm based on lexical considerations, described in [15]. Expert Metaschema: A metaschema created by a domain expert. Top-Down Expert Metaschema: An expert metaschema created using a heuristic methodology, processing the SN starting at its roots and proceeding down the tree. It is described in [16] and reviewed in Section Bottom-Up Expert Metaschema: An expert metaschema created using a heuristic methodology processing the SN starting at its leaves and proceeding up the tree. It is described in Section Cumulative Metaschema: A metaschema resulting from aggregating experts' metaschemas according to a threshold value. Consensus Metaschema: The cumulative metaschema resulting from aggregating the experts' metaschemas according to a threshold of a simple majority of experts. Top-Down Consensus Metaschema: A consensus metaschema of the top-down expert metaschemas. Bottom-Up Consensus Metaschema: A consensus metaschema of the bottom-up expert metaschemas.
79 62 Consolidated Consensus Metaschema: A metaschema created by the MAIN-CONS- OLIDATE algorithm, combining the best features of the Top-Down Consensus Metaschema and the Bottom-Up Consensus Metaschema. Consolidated Algorithmic Metaschema: A metaschema created by the MAIN-CONS- OLIDATE algorithm, combining the best features of the Cohesive Metaschema and the Lexical Consensus Metaschema. Final Consolidated Metaschema: A metaschema created by the MAIN-CONSOLID- ATE algorithm, combining the best features of the Consolidated Consensus Metaschema and the Consolidated Algorithmic Metaschema.
80 CHAPTER 3 UPDATING THE GENOMIC COMPONENT OF THE SEMANTIC NETWORK 3.1 Background The UMLS Semantic Network [9] (SN) is an upper level terminology for biomedicine composed of broad categories called semantic types (STs). A step in the integration of a new source terminology into the UMLS is the assignment of STs of the SN to the concepts being added. In [41], Lomax and McCray discuss the successful mapping of all GO terms into the UMLS. The mapping of GO concepts by the STs of the Semantic Network, however, was less satisfactory. They note that the SN does not allow for some of the distinctions present in GO, because there is a relatively small number of STs at the level of molecular phenomena. They point out that GO makes a distinction between a molecular function that is a "direct [molecular] activity" and a molecular function that consists of an ordered assembly of activities. GO categorizes the latter as a "biological process." They say that "No similar distinction, however, is made within the UMLS semantic network. Thus a large proportion of both molecular function and biological process terms were assigned the same ST, 'Molecular Function' (or its child, 'Genetic Function'), losing much of the resolution present in GO." The STs which were assigned to GO's cellular component terms similarly show a lack of sufficient resolution. Most GO cellular component terms were assigned the ST Cell Component, but additional children or siblings of Cell Component are needed to retain all the semantics captured in GO. Other GO categories not currently available as separate semantic types include developmental processes. As can be seen, a number of new semantic types are needed for proper coverage of genomic concepts. For example, the SN has no subhierarchy specifically concerned with the storage, replication and use of genetic information. 63
81 64 In [42], Yu et al. identify more than 30 existing UMLS STs as relevant to genomics and suggest extending the SN's coverage of genomics. They propose the addition of six semantic types: Complex and Protein Structure, and the latters children 1D, 2D, 3D and 4D. Further, they identify relevant existing relationships and suggest more relationships to enhance genomic coverage in the SN. They deem 24 out of the 53 semantic relationships of the UMLS SN relevant, and add 16 new ones, which are createbond, breakbond, follows, releases, signals, transports, activates, promotes, deactivates, similarity_related_to, physically_similar_to, 1D _structure _related_to, 2D _structure _related Jo, 3D _structure _related _to, 4D_structure_related_to, and functionally_similari_to. 3.2 Methods Previous approaches have identified elements that would improve the genomic coverage of the SN. The work of Yu, et al. [42] is notable in identifying both STs of the SN that are relevant to genomics and new STs. The need expressed by Lomax and McCray [41] to provide finer granularity of molecular activity is addressed. A second method that has been employed as a basis for the identification of genomic semantic types (GSTs) is a manual review of terms used in comprehensive online genomic resources, including Entrez Gene [43] and OMIM (Online Mendelian Inheritance in Man) [44] and several biology, genetics and molecular evolution texts [45-47]. More than 200 relevant terms were extracted from these sources. These genomics terms are treated in one of two ways. If a term is of sufficiently high frequency, is a broad category and has become standardized in its usage, it is recruited as an ST. More specialized genomic terms are used to measure the inclusiveness of the broader semantic categories. The GSTs defined should be sufficiently broad so that every genomic term encountered is naturally susceptible to assignment of one or more GSTs, and every GST covers numerous concepts. Sometimes a broad category is also a concept in META as a result of being a concept in a source terminology. This is not a contradiction, since a META concept may have many descendants.
82 65 Third, the existing genomically relevant categories within the SN were examined for uniformity and internal consistency. For example, as noted in [41], a comparison of the SN's Biologically Active Substance subtree with its Natural Phenomenon or Process subtree found that the former has Immunological Factor but the latter does not have a corresponding Immunological Function or Immunological Process. This reflects an inconsistency in the structure of the subhierarchies of the SN. Understanding of genomic entities and processes often requires that they be viewed from multiple angles. Multiple parents are usually allowed in terminologies, including META, to permit this. Multiple parents for STs of the SN are only allowed in the Enhanced Semantic Network (ESN) [14], creating a directed acyclic graph (DAG) structure for the IS- A hierarchy. The proposed modifications of the SN were submitted to two domain experts for review. 3.3 Results Figure 3.1 shows the modified genomic portions of the Semantic Network. The numbered items in bold or italic in Figure 3.1 follow from the suggestions of the corresponding references. The additions are in bold, including the STs assigned multiple parents. A starred entry (*) has multiple parents and thus appears more than once in the hierarchy, in keeping with the suggestion that a directed acyclic graphic structure is required to encompass the multiple subsumption of STs. For example, an Enzyme is both a Biologically Active Substance and an Amino Acid, Peptide, or Protein, corresponding to perspectives on its biological activity and its structure, respectively. Genomic terms within the UMLS are currently assigned the STs Gene or Genome; Nucleic Acid, Nucleoside or Nucleotide; Biologically Active Substance; Idea or Concept; Cell Component; Amino Acid, Peptide or Nucleotide; and Genomic Function and their subhierarchies.
83 66 Entity Physical Object Anatomical Structure Molecular Sequence Nucleotide Sequence Amino Acid Sequence Carbohydrate Structure Protein Structure [421 Primary Structure 142] Secondary Structure /421 Tertiary Structure [42] Quaternary Structure 1421 Fully Formed Anatomical Structure Body Part, Organ, or Organ Component Tissue Cell Cell Component Organelle Chromosome Mitochondrion Chloroplast DNA Element. Genome Gene Protein Coding Gene RNA Coding Gene Translated Region Transcribed Region Transcription Factor Binding Site Exon Intron Control Region Promoter Receptor [14]* Membrane Component 142] Substance Chemical Viewed Functionally Biologically Active Substance Neuroreactive Substance or Biogenic Amine Hormone Enzyme Vitamin Immunologic Factor Receptor * Chemical Viewed Structurally Chemical Complex /411 Organic Chemical Nucleic Acid, Nucleoside, or Nucleotide Amino Acid, Peptide. cr Protein Enzyme [14j Inorganic Chemical Element, Ion, or Isotope Event Activity Occupational Activity Research Activity Molecular Biology Research Technique Phenomenon or Process Natural Phenomenon or Process Biologic Process Developmental Process Regulation of Biologic Process Reproduction Biologic Function Physiologic Function Organism Function Immunologic. Function 1411 Cell Function Molecular Function Genetic Function Binding Transcription Regulator Activity Translation Regulator Activity Pathologic Function Disease or Syndrome Neoplastic Process Cell or Molecular Dysfunction Experimental Model of Disease Legend Red Bold: New proposed ST Green /loth, New proposed ST based on previous work [reference in square brackets] Blue*: Existing ST with proposed second parent Grey Background Bold*: Second position for existing ST Brown. Existing ST in new position Figure 3.1: Updated Genomic Component of the UMLS Semantic Network.
84 67 The currently defined ST Gene or Genome is clearly a particularly important one for genomic concepts. Following the review of existing STs for internal consistency. dividing this ST into two separate STs is proposed, Gene and Genome. A genome is a collection of one or more macromolecules containing an organism's (or cell's) genetic complement. A gene is one of the functional elements of a genome (that is, it is a part-of a genome). The "or" conjunction of Gene or Genome implies a joining of types at an equal conceptual level and does not correctly express their relationship. Molecular Sequence is likewise of fundamental significance for genomics. It is intended, according to its UMLS definition, to comprise the genetic sequences and gene product sequences reported in the published literature and/or "deposited in" databanks such as GenBank, European Molecular Biology Laboratory (EMBL), National Biomedical Research Foundation (NBRF), or other sequence repositories. Its child STs include Nucleotide Sequence and Amino Acid Sequence. The assignment of Molecular Sequence to the Conceptual Entity hierarchy, however, fails to capture the concrete character of the sequences in the sequence databases. Placing Molecular Sequence as a child of the ST Anatomical Structure is proposed. This places it as a grandchild of Physical Object and a sibling of Protein Structure. Carbohydrate Sequence (a child of Molecular Sequence) would more accurately be called Carbohydrate Structure, since it is not necessarily linear. Following the review of genomic terms in the literature, two child STs of Cell Component are added to the genomic repertoire of the SN. The first, Organelle, would include as child types the major categories of genomic entities that are the persistent repositories of an organisms hereditary information and are the targets of sequencing (Chromosome, Mitochondrion and Chloroplast). The major genomic databanks, for example, GenBank, are organized around these entities. Organelle would also apply to a variety of nongenomic cell components. This requires identification of the organism's genes and other functional elements, which includes regulatory and other non-coding elements; identification of the sequence and structure of the expressed products; and mapping of the
85 68 regulatory networks of the various subsystems of the organism. The proposed child types of DNA Element include Genome, Gene, Translated Region, Transcribed Region, Transcription Factor Binding Site, Exon, Intron, Control Region, Promoter, and Chromosome Band. A large number of specialized databases are devoted to these various types of elements (e.g., regulatory networks, functional RNAs). There are also specialized databases that contain elements, not necessarily naturally occurring, generated by genetic technologies (Expressed Sequence Tags, for example). Each Gene is of one of two fundamentally different types, according to whether it is a template for a functional RNA or for a protein. Functional RNAs and proteins have many subdivisions according to the structure or function of the gene product. STs for these broadest divisions of genes, Protein Coding Gene and RNA Coding Gene, are included. In the Event hierarchy, a Biologic Process ST to encompass ordered sequences of activities is proposed. This addresses the observation in [41] that it would be desirable to have a higher degree of granularity in processes at the molecular level, and to be able to discriminate composite processes from simple molecular activities. This is a semantic distinction that was lost in the incorporation of GO terms into the UMLS. To provide a new ST Biologic Process with greater discrimination, three child STs are introduced: Developmental Process; Regulation of Biologic Process and Reproduction. These are major subhierarchies in GO. To improve the granularity of the SN's Molecular Function category related to genomics, three child STs are introduced: Binding, Transcription Regulator Activity and Translation Regulator Activity. These also are major subhierarchies in GO. Two domain experts were requested to review the ST hierarchy as shown in Figure 3.1. Reviewer 1 suggested adding four STs: Multiorganism Process, Cellular Process, Organism Process and Catalytic Function. She also suggested moving two STs to different positions in the hierarchy, which is implemented in the present version. Reviewer 2 recommended removing four STs: Chromosome, Mitochondria and Chloroplast (for uniformity
86 69 of granularity) and Chromosome Band. The feedback concerning the rest of the hierarchy was positive. 3.4 Discussion An effort to consider the SN as a conceptual framework for genomics from both internal and external perspectives was undertaken. The work shows that the consideration of internal consistency and the consideration of completeness with respect to the state of the field both yield notable improvements in the scope and organization of the SN's GSTs. The mining of literature for genomics terms proved to be a useful method. However, the journal literature that should be surveyed for a thorough literature mining is vast and requires automated natural language processing techniques. Extending these methods to enable a comprehensive literature review in the future is expected. To be included in the proposed additions to the SN, a GST had to meet rather strict criteria intended to guarantee that it is mature and of general significance. Each new GST must refer to a core biological phenomenon; have a standardized nomenclature; be backed by a very large data set; and have universal (or close to universal) applicability to living things. The result is a small and tightly grouped set of GSTs, closely reflecting the genome sequencing program that has driven advances in genomic knowledge. The adherence to these criteria provides a strong basis for agreement on their inclusion. However, the boundaries of inclusion are a matter of judgment. The coherence of biological processes can be expected to be reflected in a high degree of symmetry between entities and events in the respective hierarchies of the SN. Thus, an Action Entity should be complemented by a corresponding Event. In genomic systems, a more complex triangular relationship often exists among the genomic information (encoded in a defined region of a relatively passive macromolecule), an action agent (a smaller molecule) and an event. An example of such a triad is a transcription factor binding site (a sequence on a DNA molecule), a transcription factor (a molecular complex)
87 70 and the initiation of transcription. While the categories that have been introduced in the SN's Entity and Event hierarchies are somewhat complementary, such internal coherence does not yet fully exist among them. The STs representing encoded information are more complete than the action agents and events. Completeness and internal consistency should be goals of a more fully elaborated representation of genomic phenomena. Some of the terms extracted by the literature search do not readily fall under either the Entity or Event hierarchies of the SN. For example, the UMLS concept Genetic Code is the relation of codons (nucleotide triplets) in a DNA coding region to the corresponding amino acids in the protein gene product. It is a function from a DNA strand to an amino acid sequence. Genetic Code is currently assigned the semantic type Molecular Sequence in the SN, though it is neither a nucleotide sequence nor an amino acid sequence, but the relation of the two. Measured by how strongly it is conserved and its universal nature, the Genetic Code must be considered among the basic elements of the system of hereditary information. The categorization of the concepts ancestors, descendants, and paralogy and orthology suffer related problems, where orthology describes genes in different species that derive from a common ancestor and paralogy describes homologous genes within a single species that diverged by gene duplication. The representation of genomic concepts is a future research topic. In the absence of a general genomics terminology as a UMLS source, many genomics terms found in the reviewed texts are absent from the Metathesaurus. These include, for example, tetrad, Glade, synonymous codon, DNA strand, deme, RNA coding gene and reversion. Despite the incomplete nature of the UMLS as a genomics vocabulary, the SN, as an upper-level ontology, should be planned to accommodate a wide range of terms not yet present. The understanding of the processes by which the elements of an organism's genetic program interact to replicate, differentiate and modulate the use of the information in the genome are still at an early stage. This is a rapidly developing area and many new concepts may be expected to be added.
88 71 The introduction of associative semantic relationships pertinent to genomics will be delayed until a stable set of GSTs has been established. The work of Yu et al. [42] in this regard will guide us in this future research. One of the key benefits of a representation in a semantic type hierarchy is that it permits the introduction and inheritance of correspondingly specific semantic relationships, each with a defined and limited domain of values that participate in the relationships. This is a first version of work on genomic semantic types. The performed limited expert review of this work was critical. Methods for future work include additional expert review and consensus, as well as automated analysis of the scientific literature to enhance reproducibility and completeness. 3.5 Conclusions The SN was created before the quantitative and qualitative explosion of genomic knowledge precipitated by genome sequencing projects. It was designed to categorize the concepts contained in a large number of biomedical vocabularies, none of which focuses on genomics. An expansion of the set of STs of the SN to accommodate new knowledge and research directions is in order. Some changes and additions to the set of genomically relevant STs have been proposed, which improve the SN's capacity to capture the current significance of genomics in the biomedical domain. In the absence of a curated general genomic ontology or terminology, an independent review of terms in the relevant literature forms an important foundation for the creation of a sound semantics of genomics. Given the significance of genomics to biology and biomedicine, it is important that the SN contain a consistent set of categories that systematically integrate genomic knowledge and link it to other biomedical domains. In this chapter, the internal consistency of the SN's categories relevant to genomics was evaluated Changes were proposed to improve its ability to express genomic knowledge. The completeness of the SN with respect to genomic concepts was evaluated and cone-
89 72 sponding extensions to the SN were proposed to fill identified gaps. In total, 31 new STs were proposed to be added to the SN, eight of them were based on previous work and 23 of them were new proposed ones. The STs Receptor and Enzyme were assigned a second parents. Four existing STs, Molecular Sequence, Nucleotide Sequence, Amino Acid Sequence and Carbohydrate Structures were proposed to be moved to new positions.
90 CHAPTER 4 GROUP AUDITING OF A SEMANTIC TYPE'S EXTENT 4.1 Background The META is a large and complex collection of biomedical concepts. Each concept in the META is assigned one or more semantic types from the SN. Each semantic type T has an extent E(T) of all concepts it is assigned to. However, it may be that not all concepts in E(T) exhibit the same semantics. For example, in the extent of Experimental Model of Disease, E(EMD), the concept Neoplasms, Experimental is assigned EMD and Neoplastic Process (NP), while the concept Arthritis, Experimental is assigned only EMD. Thus, an extent, such as E(EMD), may be semantically non-uniform. Similarly, the extent of Enviromental Effect of Humans(EEH) is semantically non-uniform either. In previous research [31,32], a technique has been developed for automatically constructing an RSN (Refined Semantic Network), a semantically uniform abstraction network, for a two-level terminology such as the UMLS. To provide a brief summary, the RSN is used to handle the semantic differences between concepts such as Neoplasms, Experimental and Arthritis, Experimental. Given a set of original semantic types and their assignments to concepts, the methodology creates an RSN consisting of two kinds of semantic types: pure semantic types (Pure STs) and intersection semantic types (Intersection STs). Figure 4.1 uses a Venn diagram to show part of the RSN constructed for E(EMD). Each ellipse represents the extent of the semantic type written above it. Each box represents a concept. Overlapping ellipses represent intersections of extents, corresponding to Intersection STs. In Figure 4.1, there are 46 concepts, for example, Arthritis, Experimental and Disease Model, which are assigned the Pure ST EMD; 26 concepts, for example, Melanoma, Experimental and Experimental Hepatoma, are assigned the Intersection ST EMD fl Neoplastic Process, where the intersection is denoted by the mathematicaloperator fl, and one concept, Knock-in Mouse is assigned EMD fl Mammal. 73
91 74 Collectively, Pure STs and Intersection STs are called Refined Semantic Types (Refined STs). Each Pure ST is derived directly from one of the original semantic types; however, only those concepts that were not assigned any other semantic type are still assigned this ST. A concept originally assigned more than one ST is now assigned a unique Intersection ST. An Intersection ST is defined for each non-empty intersection of extents, involving any number of original semantic types. Here,"intersection" is used in the sense of the standard mathematical notion of set intersection, since extents are defined as sets. For example, EMD is a Pure ST; EMD n Neoplastic Process is an Intersection ST. Neoplastic Process (NP) Experimental Model of Disease (EMD) Mama! Figure 4.1: The types and intersections of RSN for concepts assigned EMD. A concept with an assignment of a Pure ST is considered to have the simple semantics expressed by its Pure ST. For example, Arthritis, Experimental has the simple semantics of Experimental Model of Disease. A concept with an assignment of an Intersection ST is considered to have a compound semantics. For example, the concept Neoplasms, Experimental has the compound semantics, EMD n Neoplastic Process. The meaning of the compound semantics is that Neoplasms, Experimental is both an Experimental Model of Disease and a Neoplastic Process. Note that in [31, 32] auditing was carried out based on Intersection STs. However, it was only done with respect to Intersection STs having very small extents, meaning only extents with small numbers of concepts. No effort was made to audit the whole ST extent,
92 75 In [17], auditing of small extents of Intersection STs with high semantic distance is studied, due to being in separate groups of STs, according to the grouping of STs in the cohesive metaschema [12] of SN. In that study, it was observed that more errors were found in very small Intersection ST extents (with up to 6 concepts) of high semantic distance. In [48], an algorithm was presented for identifying all redundant ST assignments, forbidden by the rules of the UMLS [49]. 4.2 Methods In the group-based approach underlying the methodology, an auditor is presented with a group comprising concepts purportedly exhibiting exactly the same overarching semantics In this way, concepts not conforming to the semantics should be readily discernable. This motif will be repeated twice in the following methods for different kinds of groups Deriving Refined Semantic Type Extents A concept assigned more than one ST resides in several different extents, e.g. Knock-in Mouse in Figure 4.1. As a result, not all concepts in the extent of a single ST exhibit the same semantics. In this sense, the extent of an ST is typically semantically non-uniform. As such, extents of STs are themselves not suitable groups for auditing purposes. However, every concept has exactly one assigned Refined ST. Therefore, the Refined STs derived from a semantic type T serve as a partition of its extent E(T). Thus, in Figure 4.1, E(EMD) is partitioned into three groups of concepts. Importantly, an individual Refined ST T. derived from T, is characterized by exhibiting a unique set of ST assignments across all its concepts. In this sense, E(T i) is semantically uniform. Therefore, the extents E(T i) of the Refined STs Ti have been chosen as the concept groups underlying the search for ST mis-assignments in E(T). An auditor is presented with the extents of the Refined STs of an original ST T one by one. Note that the size of each such E(T i) is smaller than that of E(T) Therefore, the auditor is not only given the advantage of semantically uniform groups but also the added benefit of reviewing such smaller groups.
93 Creating ST Assignment Table The algorithm for identifying concepts with possible ST mis-assignments needs to use information about concepts and their ST assignments. Instead of using the huge original UMLS file (MRSTY) in the algorithm, a table of type assignments, called ST table, was created, which is a small subset of that file. The table contains all concepts of E(T) divided into sections for the Refined STs of E(T). For each concept c, the table lists its ST assignments, denoted as Types(c), as well as its parent concepts and their ST assignments Table 4.1 shows an excerpt of the ST table for E(EMD), where the following abbreviations are used: DS (Disease or Syndrome), RA (Research Activity) and RD (Research Device). For example, Mouse Model of Human Cancer and its parent Rodent Model are both assigned EMD. However, Animal Model, the parent of Rodent Model, is assigned Animal. Some concepts have multiple parents, for example, Carcinoma 256, Walker, has two parents, Carcinosarcoma and Neoplasms, Experimental. In this case, the STs of all parents are included in the ST table. Table 4.1 is a short form of the real ST table used for illustration purposes. When a concept has multiple parents, the concept is listed in one row with each of its parent in the ST table. However, in Table 4.1, the cells for the same concepts are merged into one cell. For example, Carcinoma 256, Walker is listed once in Table 4.1, although it has two parents Identifying Suspicious Concepts As discussed in [50], ideally, a concept in the META is either supposed to be assigned all ST assignments of its parent(s) or have ST assignments that are more specific than those of its parents. Six cases were identified as the causes of unexpected relationships: parent too specific, child too general, parent type missing, child type missing, wrong IS-A, and missing ancestor descendant [50]. Therefore, it is reasonable to suspect that a concept, say c, is in error if it satisfies the following condition: A parent of c is assigned an ST X such that neither c is assigned X nor c is assigned an ST Y, which is a descendant of X in SN.
94 77 Table 4.1: Sample ST Table Concept ST Parent Parent ST EMD Mouse Models of Human EMD Rodent Model EMD Cancer Cancer Model EMD Biological Models RD n IP Predictive Cancer Model EMD Cancer Model EMD Tissue Model EMD in vitro Model RA Liver Cirrhosis, Animal Disease Models EMD EMD Experimental Liver Cirrhosis DS Rodent Model EMD Animal Model EMD n NP EMD n NP Carcinoma 256, Walker Carcinosarcoma NP EMD n NP Neoplasms, Experimental EMD n NP Rous Sarcoma EMD n NP Experimental Organism Classification Diagnosis EMD n Mammal Knock-in Mouse EMD I EMD n Mammal Genetically Engineered Mouse Note that if c were assigned such a Y, it is a legitimate configuration of ST assignments for a pair of parent and child concepts according to [50]. For example, the ST assigned to Mouse Choroid Plexus Carcinoma is EMD, while the ST assignments of its parents, Mouse Carcinoma and Mouse Choroid Plexus Tumors, are both Neoplastic Process. Since EMD is different from Neoplastic Process and not a descendant of Neoplastic Process in the SN, Mouse Choroid Plexus Carcinoma is identified as a suspicious concept with a possible ST mis-assignment. Upon review, it is found that Mouse Choroid Plexus Carcinoma is "a malignant Choroid Plexus Tumor which shows anaplastic features and usually invades neighboring brain structures." It should thus be reassigned the Intersection ST EMD n Neoplastic Process. With the reassignment, a legitimate configuration of Mouse Choroid Plexus Carcinoma has been achieved. In another example, sewage is assigned Environmental Effect of Humans (EEH). Its parents waste product and waste management are assigned the STs Substance and Human Caused Phenomenon or Process (HCPP), respectively. In this case, the child's
95 78 ST EEH is a child-of the parent's ST HCPP. According to the algorithm for identifying suspicious concepts, in such a case where the ST of the child concept is a child-of the ST of the parent concept, this ST contributes to a legitimate configuration. But sewage's parent, waste product, has ST assignment Substance, which is different from sewage's ST EEH and is not an ancestor of EEH in the SN. Note that ancestors include parents, grandparents, etc. Thus, the concept sewage is deemed suspicious by the defined condition. Upon review, the ST Substance was added for sewage by the auditor. With this addition, a legitimate configuration of STs for the concept sewage was achieved. The procedure Identify Suspicious Concepts(G) uses a pseudo code description for identifying all suspicious concepts in a given set of concepts G. In an initial invocation of the algorithm, G is the extent of some Refined ST of interest, Once all suspicious concepts in that Refined ST's extent have been identified by the algorithm, they are presented to the auditor for consideration.
96 Auditing Methodology for Semantic 'Type Assignment of Suspicious Concepts In this subsection, a methodology for correcting ST assignments of suspicious concepts is presented. If the auditor deems that an original ST assignment to some suspicious concept c is incorrect, then a reassignment is done and the ST table is updated. The following steps describe the process of correcting a suspicious concept's ST assignments. Using this methodology, an auditor can reassign the suspicious concept Mouse Choroid Plexus Carcinoma the Intersection ST EMD fl Neoplastic Process and the suspicious concept sewage the Intersection ST EEH fl Substance. The auditor needs only to focus on suspicious concepts rather than the whole Refined ST's extent. The number of suspicious concepts is expected to be much smaller than the number of concepts in the Refined ST's extent. This methodology thus significantly reduces the auditor's scope of review and identifies possible ST mis-assignments with higher precision A Dynamic Auditing Methodology for Semantic Type Assignments In the previous subsection, a straightforward methodology was presented, in which auditing is conducted only on a suspicious concept c identified by comparing the ST assignments of c and that of the parents of c. However, it is possible that c has children in the same extent with the same ST assignment as c. In such a case, if c's ST assignment changed. the
97 80 ST assignments of its children become different from those of c. The Identify Suspicious Concepts procedure will be re-applied to the set of c's children to determine if any are now suspicious. The methodology will be repeated recursively until there are no more suspicious concepts in the extent. (A recursive methodology is reapplied to smaller subproblems of the original problem. Eventually, all the applications of the methodology to the subproblems result in a solution to the original problem.) In order to discover all suspicious concepts, a second version of the methodology, called Dynamic Auditing Suspicious ST Assignments, was designed for handling this situation. Below is the pesudocode description of the dynamic methodology. The dynamic nature of the recursion of the methodology enables the auditor to increase the number of errors found with only a little more effort. As an example, the concept Cancer Model is identified as a suspicious concept according to its definition: Any model that can be used to study issues important in cancer such as cancer development or prediction (NCI). Cancer Model is reassigned Intellectual Products. Due to this change, the algorithm looks for the set of its children Breast Cancer Model and Predictive Cancer Model and finds
98 81 they are now suspicious. By using the non-dynamic auditing methodology, they were not deemed suspicious because they were assigned EMD just as their parent Cancer Model originally was. These two concepts were subsequently reviewed and also reassigned Intellectual Products, for reasons similar to those for their parent Cancer Model Partition of Refined ST Extent into Cohesive Sets After semantic auditing, E(T i), the extent of the Refined ST T i, for a fixed i, is deemed semantically uniform. To aid in the further auditing of the concepts of this extent, a second step of the "divide and conquer" approach is now employed. While all concepts of E(Ti), for a fixed i, have the same semantics as expressed by the Refined ST assignments, they still differ in their details. For a better comprehension of the concepts of E(Ti), it would help to further partition this set into smaller subsets, each of which has a more refined semantics than the set E(T i) as a whole. The child-of hierarchical relationships between concepts of E(T i ) are utilized in this refined partition. The child-of relationship is a fundamental feature in the Metathesaurus, which represents increasing levels of generalization. Definition (descendant-of Path): A sequence of concepts Mc', c2, of E(Ti) is called a descendant-of path if V j : 1 < i < n, cj is child-of cj+1. Note that for n = 2, the descendent-of Path consists just of c 1 child-of c2. Thus, in such a case, it is also c 1 descendent-of c2. Definition (transitive): A relationship R is transitive if whenever (a R b) and (b R c) is true, it is also true that (a R c). As a descendant of another descendant is also a descendant, "descendant-of" is a transitive relationship. All of the concepts of a descendant-of path are (by transitivity of the descendant-of relationship) specializations of the last concept cn, of the path. Definition (Root Concept): A concept r of E(T i ) is a root of E(Ti) if no parent of r is in E(Ti).
99 82 Definition (Cohesive Set): A set of concepts of E(T i) is called a cohesive set if it contains a root concept such that all the other concepts of the set have a descendant-of path directed to the root concept. The name cohesive set is used for this set of vertices since all its concepts are descendant-of the root concept (by transitivity of descendant-of), that is, all these concepts are specializations of the root concept. In such a case, it is said that all the concepts in the cohesive set are sharing the semantics of the root concept. For example, there are six cohesive sets in Figure 4.2, which are rooted at Neoplasm, Experimental; Mouse Glucagonoma; Sarcoma, Jensen; Rouse Sarcoma; Experimental Hepatoma; and Hepatoma, Morris respectively. The cohesive set rooted at Neoplasm, Experimental (Figure 4.2(a)) contains 21 concepts at three different layers of the hierarchy. All these concepts share the common semantics of the root Neoplasm, Experimental, but with increased specializations. For example, Sarcoma, Avian has both meanings Tumor Virus Infection and Sarcoma, Experimental, both of which are specializations of Neoplasm, Experimental. Definition (Singleton set (in E(Ti))): A singleton set is a cohesive set of one concept (which is its root). Definition (Singleton Concept): The only concept of a singleton set is called a singleton concept. In Figure 4.2(b), there are five singleton concepts. They are Mouse Glucagonoma; Sarcoma, Jensen; Rous Sarcoma; Experimental Hepatoma and Hepatoma Morris. The partitioning technique further divides a Refined ST extent into cohesive sets. The cohesive sets are typically smaller than the original Refined ST extents. The cohesive sets help auditors in orientation to and navigation of the Refined ST extents in the auditing process. The hierarchical relationships in a cohesive set can help in exposing different kinds of errors. Ideally, one can partition the extent of a Refined ST into several disjoint cohesive sets. However, a component of a Refined ST may have multiple roots, in which case, this
100 Figure 4.2: An example of Cohesive Sets. 83
101 84 component is not a cohesive set. In this stage of the research, a partition of the extent of a refined ST into disjoint cohesive sets is assumed. In future research, the problem for components with multiple roots will be investigated. The second phase of the audit process focuses on cohesive sets with very few concepts. This kind of sets represent potential irregularities and has a high likelihood of errors. The reason is that if a cohesive set exists due to its legitimate hierarchical relationships, then there would probably be at least several concepts in it. The following hypothesis is presented: Hypothesis 1: The probability of erroneous concepts is higher for roots of small cohesive sets with 3 or fewer concepts and especially for singletons, than for roots of larger cohesive sets. For example, the singletons in Figure 4.2(b), are likely to erroneously lack hierarchical relationships to other concepts. Following this hypothesis, the auditing methodology requires an auditor to manually review the small cohesive sets which have a relatively high likelihood of errors. This methodology requires only a limited amount of time of an auditor. For the example of Figure 4.2(b), all singletons are indeed missing child-of relationships. For example, Sarcoma, Jensen should be child-of Sarcoma, Experimental and Experimental Hepatoma should be child-of Neoplasms, Experimental. The second hypothesis relates to the connection between concepts having an ST assignment error and concepts having other errors. In this specific case of considering missing hierarchical relationships for concepts with wrong ST assignments, the following hypothesis is presented: Hypothesis 2: The probability of a missing hierarchical relationship is higher for concepts which had a wrong ST assignment than for concepts with a correct ST assignment. The reasoning for this hypothesis is that an error in the ST assignment may indicate a misconception or confusion regarding the concept with erroneous ST assignments. Such a misconception or confusion may cause further errors.
102 Auditing Hierarchical Relationships Based on Cohesive Sets The t cohesive sets for a Refined ST are partitioned into two groups: small sets, with up to three concepts, in one group and large sets, with more than three concepts, in the second group. The k small (t k large) cohesive sets are arranged in an increasing (decreasing) order of their numbers of concepts. Let r 1, r2,, rk be the roots of these arranged small cohesive sets. Let rt, rt-1, rk+1 be the roots of these arranged large cohesive sets. That is, r1 is the root of a smallest cohesive set (probably a singleton) and r t is the root of a largest cohesive set. In case of equality of size the order is arbitrary. In Auditing Hierarchical Relationships methodology, it is described how to insert a singleton set into an appropriate cohesive set, if such a cohesive set exists. Remember that ri, the root of each singleton set, has neither parents nor children in the extent of a Refined ST. This methodology is performed in a recursive way. Thus, the steps in the recursive methodology considering root rj, k < j < t, of a large cohesive set describe only traversing through one level of the large cohesive set. Traversal of lower levels is implicitly described by the recursion. In the following description, r j has m (m > 0) child concepts c i, c2,, Cm. The root of the singleton cohesive set is ri and the purpose is to find whether ri fits into the cohesive set rj. If the answer is yes, then it is checked whether it fits into the subhierarchy of rj rooted at its first child c 1. This decision has to be made by a human. In case that this is indeed true, the process continues recursively at the children of c 1. If the answer is no, the methodology continues to check all other children cq, 2 < q < m, of rj. If ri does not fit into any of the subhierarchies of the children of rj, it is added as a new child of rj, since it is more specific than rj. Note that ri may be more specific than several children of r j, in which case it will be added as a child of several concepts. In such a case, ri ends up with multiple parents. Also note that if rt is not more specific than c1, the methodology checks whether c1 is more
103 specific than r,. In such a case, r, is added between rj and e l, as child of r; and parent of 86 By applying this recursive methodology through all the levels of the large cohesive set, the process described is similar to the classical classification process used when constructing an ontology. Classification is a limited reasoning mechanism that was introduced as part of the KL-ONE family of knowledge representation systems [51]. A detailed description of the KL-ONE classifier can be found in [52]. Citing [53], "Classification is the process of taking a new class description and putting it where it belongs in the class hierarchy... A class is in the right place if it is below all classes that subsume it and above all that it subsumes." Thus, the classification algorithm is also referred to as subsumption algorithm. Following [54] "the classifier for KL-ONE deduces that the set denoted by some concept necessarily includes the set denoted by a second concept but where no subsumption relation between the concepts was explicitly entered." In other words, the classification algorithm
104 87 takes the descriptions of two concepts as input, for which no "IS-A relationship" was explicitly entered by the knowledge base builder, and it determines whether such an IS- A relationship should hold between those two concepts. In a landmark paper, reprinted and extended in [55], the authors analyzed two languages FL and FL- that differ only in one representational feature. They show that for FLsubsumption can be computed in polynomial time, while for FL subsumption is intractable. In other words, there is a fundamental tradeoff between the number of features a knowledge representation language provides (expressibility) and the computability of its reasoning algorithms, as demonstrated for subsumption. Thus, the knowledge to which the subsumption algorithm can be applied is fairly limited. Secondly, obtaining the logically precise descriptions of the two concepts which are used as input to the classification algorithm is difficult for natural (real world) concepts. These two problems have limited the practical use of the classification algorithm considerably. The lack of formality of some members of the KL-ONE family led to a general move towards recasting KL-ONE-like structured inheritance networks as Terminological Logics [56, 57] and subsequently as Description Logics. Note that [57] is considered the first of an (almost) annual series of Description Logics workshops [58]. The Description Logic Handbook [59] makes it clear that the subsumption algorithm is still front and center stage in Description Logics. [60] write: "The basic inference on concept expressions in Description Logics is subsumption,..." Determining subsumption is the problem of checking whether the subsumer is considered more general that the subsumee. "In other words, subsumption checks whether the first concept always denotes a subset of the set denoted by the second concept." In addition to the steps in the presented methodology, it is also necessary to check for the "unusual case" that rj is more specific than Ti. Checking this "unusual case" will occur when auditing the hierarchical relationships of the whole Refined ST extent. It is
105 88 also possible that r i is not related by a child-of relationship to rj or any of its descendants. In other words, it is possible that the relationship "is more specific than" does not exist between ri and rj, in either direction. The singletons in Figure 4.2(b) will be used to demonstrate the above methodology. The goal is to check if those singletons fit into the large cohesive set rooted at Neoplasms, Experimental by applying the methodology. Several common scenarios are shown here: Adding a Concept as a Leaf Child of the Root: The first singleton to be auditied is Mouse Glucagonoma. The root of the large cohesive set is Neoplasms, Experimental. An auditor checks whether Mouse Glucagonoma is more specific than Neoplasms, Experimental. The answer is yes. Then the flag inserted is set to 0 (line 7), indicating Mouse Glucagonoma has not been inserted into the large cohesive set. The recursive call is applied to the 10 children of Neoplasms, Experimental one by one (lines 8-9). Tumor Virus Infections Leukemia, Experimental Liver Neoplasms, Experimental Carcinoma Lewis Lung Carcinoma Krebs 2 Sarcoma, Experimental Carcinoma Ehrlich Tumor Mammary Neoplasms, Experimental Melanoma, Experimental Carcinoma 256, Walker It is found that Mouse Glucagonoma is not more specific than any of the children. It is then checked whether any of the 1 0 children of Neoplasms, Experimental are more specific than Mouse Glucagonoma. The answer is again no. Therefore, lines are not executed in this case and the flag inserted remains 0. The recursive calls exit at the first
106 89 level of children. Since the flag inserted is 0 (line 15), Mouse Glucagonoma is added to the cohesive set as a leaf child of Neoplasms, Experimental. Adding a Concept as a Leaf Descendant of a Child of the Root: When auditing the second singleton Sarcoma, Jensen, it was found that it is more specific than Neoplasms, Experimental. The flag inserted is set be 0 and it is checked whether it is more specific than any children of Neoplasms, Experimental (line 3). Thus, Sarcoma, Jensen is recursively compared with all 10 children of Neoplasms, Experimental (line 7). Tumor Virus Infections; Leukemia, Experimental; Liver Neoplasms, Experimental; Carcinoma Lewis Lung; and Carcinoma Krebs 2, are neither more specific nor more general than Sarcomam, Jensen. The recursions exit when applied to those children. However, when compared with Sarcoma, Experimental; Sarcoma, Jensen is more specific. Therefore, recursive calls are applied to the children of Sarcoma, Experimental, namely Sarcoma Avian; Sarcoma, Yoshida; Sarcoma 37 and Sarcoma 180. However none of these children is either more specific or more general than Sarcoma, Jensen. Therefore, lines are not executed in this case, the flag inserted remains 0 and Sarcoma, Jensen is inserted as a child of Sarcoma, Experimental. Using the same methodology, Sarcoma, Jensen is compared with the rest of the children of Neoplasms, Experimental. But no other concept is found that is more specific or less specific than it. Adding a Concept as a Child of Multiple Concepts: When auditing the third singleton Rous Sarcoma, it is found that it is more specific than Neoplasms, Experimental. The flag inserted is set to be 0 and if it is still more specific than any children of Neoplasms, Experimental is checked. Thus, Rous Sarcoma is recursively compared with all 10 children of Neoplasms, Experimental. Rous Sarcoma is more specific than Tumor Virus Infections, therefore, it is compared with the only child, Sarcoma Avian, of Tumor Virus Infections. The recursion is complete. Since Rous Sarcoma is neither more specific nor more general than Sarcoma Avian, lines are not executed and the flag inserted remains 0. Rous Sarcoma is thus added as a direct child of Tumor Virus Infections. For the rest of the
107 90 children of Neoplasms, Experimental, Rous Sarcoma is more specific than Sarcoma, Experimental. Rous Sarcoma is added as a child of Sarcoma, Experimental. In this scenario, Rous Sarcoma will have two parents Tumor Virus Infections and Sarcoma, Experimental. The process for inserting the remaining two singletons in Figure 4.2(b) depends on the order in which these singletons are selected as input. For example, if the order in the figure is used, Experimental Hepatoma will be considered first, then Hepatoma, Morris. In this case, Experimental Hepatoma is added as a child of the root Neoplasms. Experimental followed by adding the leaf Hepatoma, Morris as a child of a child (Experimental Hepatoma) of the root (Neoplasms, Experimental). However, if Hepatoma, Morris is selected as an input before Experimental Hepatoma, adding Hepatoma, Morris follows the case of adding a leaf as a child of the root, but adding Experimental Hepatoma becomes complicated. It needs to be inserted between Hepatoma, Morris and Neoplasms, Experimental, since Experimental Hepatoma is more specific than Neoplasms, Experimental, but more general than Hepatoma, Morris, as will be discussed. Inserting a Singleton between Two Concepts: Suppose Hepatoma, Morris is added before Experimental Hepatoma as a child of Neoplasms, Experimental. The recursive methodology is applied here. As Experimental Hepatoma is more specific than Neoplasms, Experimental ; it is compared with all 11 children (including Hepatoma, Morris) of Neoplasms, Experimental. All the recursive calls exit at the first level, since Experimental Hepatoma is not more specific than any of those 11 concepts. When each recursive call exits, a test is performed whether any of the 11 children is more specific than Experimental Hepatoma, and only Hepatoma, Morris is, Therefore, Experimental Hepatoma is inserted between Hepatoma, Morris and Neoplasms, Experimental. After auditing the hierarchical relationships, the cohesive sets in Figure 4.2 are shown in Figure 4.3. Broken lines represent the missing hierarchical relationships added after auditing E(T i ) by applying the Auditing All Hierarchical Relationships methodology to E(Ti).
108 91 Figure 4.3: Audited hierarchical relationships for cohesive sets in Figure 4.2. The Auditing Hierarchical Relationships methodology has been described and demonstrated by illustrating several common scenarios when inserting a singleton into a large cohesive set. Now the methodology Auditing All Hierarchical Relationship to audit the hierarchical relationships among all the small cohesive sets and all large cohesive sets is presented, which calls the Auditing Hierarchical Relationship methodology for each small cohesive set and each large cohesive set in the Refined ST T i. The non-singleton small cohesive sets are first split into singleton concepts, inserting their concepts into the large cohesive sets one by one. Then the "unusual case" that a large cohesive set rj is more specific than a singleton rh is checked, in which case, r3 is made child-of rh (and thus it becomes the new root of this large cohesive set). At last, it is checked if each singleton concept fits into any large cohesive set by calling the Auditing Hierarchical Relationship methodology. The pseudo code description for the methodology follows. As discussed before, the order of inputs affects the auditing results. It is possible that some hierarchical relationships are missing among singleton concepts, which will be demonstrated in the Results section. To identify most of those missing hierarchical
109 92 relationships, if there are still some singleton left after the first round checking if each singleton fits some large cohesive sets, the checking will repeat the second time. The description for the auditing methodology follows. The list of small cohesive sets were reviewed. For each root r i of such a small cohesive set, try to insert its root (for a singleton, just the concept ) into a large cohesive set. For this the large (with more than 3 concepts) cohesive sets were reviewed in increasing order. For each root ri of small cohesive set, it is checked whether it is a child-of a root concept rj of a large cohesive set. If not, it was moved to the next large cohesive set. In the auditing process, it is concentrated on two kinds of errors, semantic type assignment error and hierarchical relationship error, either wrong or missing. If any semantic type assignment errors are found for a concept, the concept will be moved to the right Refined ST extent and reexamine the whole cohesive set. For hierarchical relationship errors, the error will be corrected and the newly formed cohesive set will be audited.
110 Results The extents of Experimental Model of Disease (EMD), defined as "representation in a non-human organism of a human disease for the purpose of research into its mechanism or treatment", and Environmental Effect of Humans (EEH), defined as "change in the natural environment that is a result of the activities of human beings", of the UMLS 2006AB release, have been chosen to demonstrate the partitioning and auditing techniques Auditing the extent of EMD Deriving Refined Semantic Type Extents The original extent of EMD, containing 73 concepts, is listed in Table 4.2. This extent is semantically non-uniform. Being of different semantics, the concepts of this group, all assigned EMD, are not lending themselves easily to identifying errors. Upon review, they indeed seem to have an EMD semantics. The original EMD extent exhibits three different kinds of semantics. Therefore, three Refined STs and their extents are derived from E(EMD), as shown in Table 4.3, to facilitate auditing of semantically uniform extents. The Pure ST EMD is assigned to 46 concepts. The two Intersection STs are EMD n Neoplastic Process, assigned to 26 concepts, and EMD n Mammal, assigned to one concept. For example, Diabetes Mellitus, Experimental is assigned EMD, Sarcoma, Avian is assigned EMD n Neoplastic Process and knock-in mouse is assigned EMD n Mammal. Table 4.3 shows the non-empty Refined ST's extents involving EMD. (Also revisit Figure 4.1.) Creating ST Assignment Table Once Refined STs had been derived, an ST table for E(EMD) was created, which was separated into different Refined ST portions. Table 4.1 shows an excerpt from the ST table for the original EMD. Identifying Suspicious Concepts The algorithm of "Identifying Suspicious Concepts" was applied to the extent of EMD. It yielded 31 suspicious concepts out of the total of
111 94 Table 4.2: All Concepts Assigned the Semantic Type EMD Alloxan Diabetes 1 Gene Knock-Out Model Nervous System Autoimmune Disease, Experimental Animal Cancer Model Genetically Engineered Mouse Non-Mammalian Organisms as Models for Cancer Animal Disease Models Hepatoma, Morris Non-Rodent Model Arthritis, Adjuvant-Induced j Hepatoma, Novikoff Nwuritis, Autoimmue. Experiential Arthritis, Collagen-Induced Hyperpiesia, Experimental Parkinsonism, Experimental Arthritis, Experimental Knock-in Mouse Predictive Cancer Model Autoimmune Myositis, Experimental Knock-out Rodent Model Breast Cancer Model j Leukemia L1210 Rous Sarcoma Cancer Model Leukemia L5178 Sarcoma 180 Carcinoma 256, Walker Leukemia P388 Sarcoma 37 Carcinoma, Ehrlich Tumor Leukemia, Experimental Sarcoma, Avian Carcinoma, Krebs 2 Liver Cirrhosis, Experimental Sarcoma, Engelbreth- -1 Holm-Swarm Carcinoma, Lewis Lung Liver Neoplasms, Experimental Sarcoma, Experimental decorticate CNS Mammary Neoplasms, Sarcoma, Jensen Experimental Diabetes Mellitus, Experimental Melanoma, B 16 Sarcoma, Yoshida Diencephalic brain model Melanoma, Cloudman S91 spinal model Disease model Melanoma, Experimental Streptozotocin Diabetes Experimental Autoimmune Melanoma, Harding-Passey Tissue Model Encephalomyelitis Experimental Autoimmune Myasthenia Gravis, Passive Transfer Mouse Choroid Plexus Carcinoma Transgenic Model Experimental Epilepsy Mouse Choroid Plexus Papilloma Transient Gene Knock-Out Model Experimental Hepatoma Mouse Glucagonoma Tumor Cell Graft Experimental High Pressure Murine Acquired lmmunodeficiency Tumor Virus Infections Neurological Syndrome Syndrome Experimental Lung Infl ammation Myasthenia Gravis, Xenograft Model Autoimmune, Experimental Experimental Pneumococcal Meningitis Myasthenia Gravis, Passive Transfer Experimental Spinal Cord Ischemia Neoplasms, Experimental
112 95 Table 4.3: Refined Semantic Types and Their Assignments Derived from EMD EMD (Pure ST) (46 concepts) Alloxan Diabetes Experimental Lung Inflammation Myasthenia Gravis, Autoimmune, Experimental Animal Cancer Model Experimental Pneumococcal Meningitis Nervous System Autoimmune Animal Disease Modelss Experimental Spinal Cord Ischemia Neuritis, Autoimmune, Experimental Arthritis, Adjuvant-Induced I Gene Knock-Out Model Non-Mammalian Organisms as Models for Cancer Arthritis, Collagen-Induced Genetically Engineered Non-Rodent Model Mouse Arthritis, Experimental Hypokinesia, Experimental Parkinsonism, Experimental Autoimmune Myositis, Knock-out Predictive Cancer Model Experimental Breast Cancer Model Leukemia, Experimental Rodent Model Cancer Model Liver Cirrhosis, Experimental spinal model decorticate CNS Models for Cancer Streptozotocin Diabetes Diabetes Mellitus, Experimental I Mouse Choroid Plexus Tissue Model 1 Carcinoma diencephalic brain model Mouse Choroid Plexus Transgenic Model Papilloma Disease model Mouse Glucagonoma Transient Gene Knock-Out Model Experimental Autoimmune Encephalomyelitis Mouse Models of Human Cancer Tumor Cell Graft Experimental Autoimmune 1 Gravis, Passive Transfer Murine Acquired Immunodeficiency Syndrome I Myasthenia Experimental Epilepsy Xenograft Model EMD fl NP (26 concepts) Carcinoma 256, Walker I Leukemia P388 Sarcoma 180 Carcinoma, Ehrlich Tumor 1 Liver Neoplasms, Experimental Sarcoma 37 Carcinoma, Krebs 2 Mammary Neoplasms, Sarcoma, Avian 1 Experimental Carcinoma, Lewis Lung Melanoma, B 16 Sarcoma, Engelbreth- Holm-Swarm Experimental Hepatoma Melanoma, Cloudman S91 Sarcoma, Experimental Hepatoma, Morris Melanoma, Experimental Sarcoma, Jensen Hepatoma, Novikoff I Melanoma, Harding-Passey Sarcoma, Yoshida Leukemia L1210 Neoplasms, Experimental Tumor Virus Infections Leukemia L5178 I Rous Sarcoma EMD fl Mammal (1 concept) Knock-in Mouse I
113 96 73 concepts in the extent. These suspicious concepts are listed in Table 4.4, where the following additional abbreviation is used: OTF (Organ or Tissue Function). Correcting Semantic Type Assignments of Suspicious Concepts After the 31 suspicious concepts were reviewed, 13 of them, which are shaded in Table 4.4, were found to have incorrect ST assignments. These 13 ST assignments were corrected (see Table 4.5) and the ST table was updated by applying the Auditing Suspicious ST Assignments methodology. Due to the modified ST assignments for these concepts, assignments of their children may also change. The Dynamic Auditing Suspicious ST Assignments methodology was applied to the same 31 suspicious concepts and two additional suspicious concepts, Breast Cancer Model and Predictive Cancer Model, were discovered. They were reassigned the ST Intellectual Product, joining their parent Cancer Model. Therefore, a total of 15 concepts' ST assignments were changed with the aid of the algorithm. The ST reassignments are listed in Table 4.6, where the two reassignments due to the dynamic methodology are shaded. The only error missed by the dynamic auditing methodology was the assignment of Mouse Models of Human Cancer. It was not suspicious, as it has the same EMD assignment as its parent Rodent Model. Although Rodent Model was a suspicious concept, its assignment was not changed, so the dynamic methodology did not expose the above error, which was later found by an exhaustive review. Table 4.7 shows concepts assigned the Pure ST EMD and its Intersection STs involving EMD after correction. There are six concepts that were moved to EMD Ii NP from EMD. Nine concepts were moved away from EMD, two to Mammal, four to Intellectual Product, two to Research Activity and one to Organism Tissue Function (See Table 4.8). Figure 4.1 used a Venn diagram to show the intersections involving EMD before semantic auditing. Figure 4.4 shows a Venn diagram for the same concepts after semantic auditing. The numbers in the diagram indicate the numbers of concepts of the respective Pure STs and Intersection STs. For example, the intersection EMD Mammal in Figure 4. i,
114 97 Table 4.4: Suspicious Concepts Identified in EMD Concept Parents' ST set EMD (Pure ST) (29 concepts) Animal Cancer Model {Animal} Animal Disease Modelss {DS, RA, IP, Animal} Arthritis, Adjuvant-Induced {DS} Arthritis, Experimental DS, EMD Cancer Model {RD n IP} Decorticate CNS {OTF} Diabetes Mellitus, Experimental {EMD, DS} Diencephalic brain model {OTF} Experimental Autoimmune Encephalomyelitis {DS, EMD} Experimental Epilepsy {DS} Genetically Engineered Mouse {RA} knock-out {RA} Leukemia Experimental {NP, EMD fl NP} Liver Cirrhosis, Experimental {DS, EMD} Mouse Choroid Plexus Carcinoma {NP} Mouse Choroid Plexus Papilloma {NP} Mouse Glucagonoma {NP} Murine Acquired Immunodeficiency Syndrome {DS, EMD fl NP, Finding, Animal} Myasthenia Gravis Autoimmune, Experimental {DS, EMD} Nervous System Autoimmune Disease, Experimental {EMD, DS} Neuritis, Autoimmune, Experimental {DS, EMD} Non-Mammalian Organisms as Models for Cancer {Animal} Non-Rodent Model {Animal} Rodent Model {Animal} Spinal model {OTF} Tissue Model {RA} Transgenic Model {Animal} Tumor Cell Graft {RA} Xenograft Model {Animal} EMD fl NP (Intersection ST) (1 concept) Rous Sarcoma I {Classification} EMD n Mammal (Intersection ST) (1 concept) Knock-in mouse I {EMD}
115 98 Table 4.5: Refined ST Reassignments for Erroneous Concepts After Applying the Auditing Suspicious ST Assignments Methodology Concept I Reassigned type Animal Cancer Model EMD n NP Leukemia, Experimental EMD n NP Mouse Choroid Plexus Carcinoma EMD n NP Mouse Choroid Plexus Papilloma EMD n NP 1 Mouse Glucagonoma EMD n NP 1 Non-Mammalian Organisms as Models for Cancer EMD n NP Genetically Engineered Mouse Mammal Knock-in mouse Mammal Cancer Model IP Tissue model IP knock-out RA Tumor cell Graft RA Spinal model OTF Table 4.6: Refined ST Reassignments for Erroneous Concepts by Applying the Dynamic Auditing Suspicious ST Assignments Methodology Concept Animal Cancer Model Leukemia, Experimental Mouse Choroid Plexus Carcinoma Mouse Choroid Plexus Papilloma Mouse Glucagonoma Non-Mammalian Organisms as Models for Cancer Genetically Engineered Mouse Knock-in mouse Cancer Model Breast Cancer Model Predictive Cancer Model Tissue model knock-out Tumor cell Graft Spinal model Reassigned type EMD n NP EMD n NP EMD n NP EMD n NP i EMD n NP EMD n NP Mammal Mammal IP IP IP IP RA I RA 1 OTF
116 99 Table 4.7: Concepts Assigned Originally EMD Which Are Assigned the Pure ST EMD and Intersection ST EMD n NP after correction EMD (Pure ST) (31 concepts) Alloxan Diabetes Experimental Autoimmune Nervous System Myasthenia Gravis, Passive Autoimmune Transfer Animal Disease Modelss Experimental Epilepsy Neuritis, Autoimmune, Experimental Arthritis, Adjuvant-Induced Experimental Lung Inflam- Non-Mammalian mation Organisms as Arthritis, Collagen-Induced Experimental Pneumo- Non-Rodent Model coccal Meningitis Arthritis, Experimental Experimental Spinal Cord Parkinsonism, Experi- Ischemia mental Autoimmune Myositis, Gene Knock-Out Model Rodent Model Experimental decorticate CNS Hypokinesia, Experimental Streptozotocin Diabetes Diabetes Mellitus, Experi- Liver Cirrhosis, Experi- Transgenic Model mental mental diencephalic brain model Murine Acquired Immun- Transient Gene Knock-Out odeficiency Syndrome Model Disease model Myasthenia Gravis, Xenograft Model Autoimmune, Experimental Experimental Autoimmune Encephalomyelitis EMD fl NP (33 concepts) Animal Cancer Model Leukemia P388 Neoplasms, Experimental Carcinoma 256, Walker Liver Neoplasms, Experi- Non-Mammalian mental Organisms as Models for Cancer Carcinoma, Ehrlich Tumor Mammary Neoplasms, Rous Sarcoma Experimental Carcinoma, Krebs 2 Melanoma, B16 Sarcoma 180 Carcinoma, Lewis Lung Melanoma, Cloudman S91 Sarcoma 37 Experimental Hepatoma Melanoma, Experimental Sarcoma, Avian Hepatoma, Morris Melanoma, Harding-Passey Sarcoma, Engelbreth- Holm-S warm Hepatoma, Novikoff Mouse Choroid Plexus Mouse Choroid Plexus Carcinoma Carcinoma Leukemia, Experimental Mouse Choroid Plexus Sarcoma, Jensen Papilloma Leukemia L1210 Mouse Glucagonoma Sarcoma, Yoshida Leukemia L5178 Mouse Models of Human Tumor Virus Infections Cancer
117 100 Table 4.8: Concepts Originally Assigned EMD Which Were Moved Out of the EMD Extent by the Correction Mammal (2 concepts) Genetically Engineered Knock-in Mouse Mouse Intellectual Product (4 concepts) Breast cancer model Cancer model Predictive Cancer model Tissue model Research Activity (2 concepts) knock-out Tumor Cell Graft Organ and Tissue Function (1 concept) Spinal model which represents the concept Knock-in Mouse, was removed after semantic auditing (see Figure 4.4). Also several concepts formerly assigned EMD are moved to extents of other STs, e.g., Intellectural Product and Research Activity. Figure 4.4: Intersections and types involving the original EMD extent after auditing. Partition of Refined ST Extent into Cohesive Sets Figures 4.5 and 4,6 show the hierarchies of the extents of the Refined STs EMD and EMD n Neoplastic Process after the semantic auditing with 23 and 14 cohesive sets respectively. There are 23 cohesive sets in Figure 4.5, a large cohesive set containing eight concepts, one cohesive set containing three concepts and 21 singletons. According to the hypothesis, these cohesive sets with
118 101 three concepts or less are highly suspicious groups. Therefore, the auditing of hierarchical relationships focused on these 21 small cohesive sets. The methodology Auditing Hierarchical Relationships (E(T i)) was first applied to the extent of the Refined ST EMD. In Figure 4.5, there is one cohesive set rooted at Transgenic Model containing three concepts. According the methodology Auditing Hierarchical Relationships, this cohesive set is to be split into three singletons. Therefore, after the split, there are = 24 singletons in E(EMD). Then it is checked whether each of these 24 singletons fits into this large cohesive set starting at the root concept Animal Disease Models, Eleven concepts are added as leaf children of the root Animal Disease Models since they are more specific than Animal Disease Models, but none of the eleven is more specific than or more general than any of the children concepts of Animal Disease Models (see Figure 4.7). Five additional concepts are added as leaf descendants of children of the root Animal Disease Models, see Figure 4.7. Adding a Concept as Parent of the Root: The singleton concept Disease Model is more general than Animal Disease Models, which is a case of the methodology Auditing Hierarchical Relationships not demonstrated in Section Thus, a child-of relationship is added from Animal Disease Models to Disease Model. After the root has been changed to Disease Model, the singletons rooted at Rodent Model, Non-Rodent Model, Xenograft Model and Transgenic Model are inserted as leaf children of the root. The cohesive set rooted at Transgenic Model is split into singletons one by one and considered for insertion from top to bottom. Therefore, the addition of the first of these three singleton concepts Transgenic Model follows the steps of adding a leaf child of the root, while the other two are added as leaf descedants of a child of the root. As a consequence, the original cohesive set of three concepts appears as a whole, under Disease Model (see Figure 4.7). In total, 21 hierarchical links to E(Pure ST EMD) were added and one cohesive set (Figure 4.7) is obtained.
119 Figure 4.5 EMD (Pure ST) after semantic auditing.
120 Figure 4.6: EMD fl NP (Intersection ST) after semantic auditing.
121 Figure 4.7: EMD (Pure ST) after hierarchical auditing.
122 Figure 4.8: EMI) rl NP (Intersection ST) after hierarchical auditing.
123 106 Among the 13 cohesive sets in E(EMD n Neoplastic Process) (see Figure 4.8), there are one large cohesive set with 21 concepts, and 12 singleton cohesive sets. These 12 singleton sets are highly suspicious "groups." Therefore the auditing efforts concentrated on them. In a process similar to the auditing of E(Pure ST EMD), the methodology Auditing All Hierarchical Relationships is applied to E(EMD n Neoplastic Process). Five concepts are added as leaf children of the root Neoplasm, Experimental. Six concepts were added as leaf children of the descendants of the root. As was demonstrated in Section 4.2.7, one concept, Rous Sarcoma, appears as a child of multiple parents. In total, 13 hierarchical links are added, as shown in Figure 4.8, and as a result all concepts in the extent of E(EMD n Neoplastic Process) are connected. To study the hypotheses on auditing of the hierarchical relationships for the EMD extent, an exhaustive review was conducted. The result shows that the recall of the Hypothesis 1 is 1.0. Among the two roots of the large cohesive sets, one (50%) - Animal Disease Model - was missing an IS-A relationship. Among the 34 small cohesive sets (22 for the pure EMD extent and 12 for the EMD n NP extent) 33 (21+12) were missing hierarchical relationships. (One concept, Rous Sarcoma, missed two hierarchical relationships). Hence for the EMD extent, 97% of the roots of the small cohesive sets missed hierarchical relationships. For Hypothesis 2, only E(EMD n NP) can provide data. Since, all the concepts in E(pure EMD) did not change their ST assignment. For EMD n NP, there were six concepts with missing hierarchical relationships among the seven concepts with erroneous ST assignments (84%) versus six concepts with missing hierarchical relationships (one missing two such relationships), among 26 concepts with correct ST assignments (23%) Auditing the extent of EEH Deriving Refined Semantic Type Extents In [31], Geller et al. pointed out that errors occured in the ST assignments of some EEH concepts, which were also assigned other
124 107 STs, such as Finding. That is, errors are concentrated on intersections with small extents. Those errors were communicated to the NLM in a workshop "The future of the UMLS Semantic Network" [61]. In the current release 2007AB of the UMLS, the assignments of the concepts with erroneous ST assignments reported in [31] were changed. The changes were not necessarily following the recommendations. It can be seen that the role of an auditor to raise questions and sometimes suggest alternative modeling. But it is up to an editor of the UMLS to make an authoritative decision about a change in the modeling. Only such an editor can be aware of the general approach used in systematic modeling, while designing a terminology or assigning STs to concepts of UMLS source terminologies. As a result of these changes, the 2007AB release has only one intersection for EEH with Hazadorous or Poisonous Substance. All other intersections of EEH disappeared. In this chapter, the assignment of the 2007AB release are the starting point, when the whole extent of EEH is now considered. Table 4.9 lists the original EEH extent consisting of 61 concepts. As can be seen, the original EEH extent is also semantically non-uniform. For example, Second hand cigarette smoke is assigned only EEH and exhibits simple semantics, while Smoke has compound semantics since it is assigned both EEH and Hazardous or Poisonous Substance. When an auditor review the orignal EEH's extent, all concepts seem to have the EEH semantics, except four, which are college, drug free school, classroom environment and educational environment. The last two were probably categorized as EEH by a string matching technique due to the word "environment." In order to facilitate auditing semantically uniform extents, two Refined STs (Table 4.10) EEH (Pure ST), EEH n HPS (Intersection ST) and their extents were derived. There are 56 concepts assigned only EEH, having simple semantics. The remaining five concepts are assigned EEH n HPS, having compound semantics. For example, Air Pollution is assigned EEH, while Acid Rain is assigned EEH n HPS.
125 108 Table 4.9: All Concepts (61 concepts) Assigned the Semantic Type EEH Acid Rain Environmental Pollution Pollution Air Pollution Environmental sludge pollution (of environment) Air Pollution, Indoor environmental transport POLLUTION AND POLLUTION EXPOSURES Air Pollution, Radioactive Exhaust fumes Poor sanitation Air Quality, Indoor factory smoke Radioactive fallout atmospheric pollution Food Contamination, Radioactive Waste Radioactive automobile emission Garbage Sanitation problem Bathing water pollution Global Warming Second hand cigarette smoke Bioremediation Greenhouse Effect Sewage classroom environment Heating Smoke College indoor pollution Smoking, Passive contaminant transport Industrial smog Soil Degradation Deforestation Industrial waste Soil pollution --I Desertification Lead pollution Thermal Water Pollution Drinking water pollution Noise pollution Tobacco Smoke Pollution Drinking water problem Noise, Transportation Water fluoridation drug-free school Non-occupational radiation Water Pollution exposure Dust pollution Oil spill Water Pollution, Chemical educational environment PBC airborne level Water Pollution, Radioactive air flow pollutant flux HL_Environmental environmental flux pollutant transport
126 109 Table 4.10: Concepts Assigned the Pure Semantic Type EEH and to Its Intersection Types EEH (Pure ST) (56 concepts) Air Pollution environmental flux pollutant flux Air Pollution, Indoor Environmental Pollution pollutant transport Air. Pollution, Radioactive Environmental sludge Pollution Air Quality, Indoor environmental transport pollution (of environment) I atmospheric pollution Exhaust fumes POLLUTION AND POLLUTION EXPOSURES automobile emission factory smoke Poor sanitation Bathing water pollution Food Contamination, Sanitation problem Radioactive Bioremediation Garbage Second hand cigarette smoke classroom environment Global Warming Sewage College 1 Greenhouse Effect Smoking, Passive contaminant transport Heating Soil Degradation Deforestation indoor pollution Soil pollution Desertification j Industrial smog Thermal Water Pollution 1 Drinking water pollution Lead pollution Tobacco Smoke Pollution Drinking water problem Noise pollution Water fluoridation Drug-free school Noise, Transportation Water Pollution Dust pollution Non-occupational radiation Water Pollution, Chemical exposure educational environment Environmental air flow Oil spill PBC airborne level Water Pollution, Radioactive ---I EEH n HPS (Intersection ST) (5 concepts) Acid Rain 1 Industrial Waste 1 Radioactive Fallout 1 Radioactive Waste I Smoke I
127 Creating the Semantic Type Table Once the Refined STs have been derived, an ST table for E(EEH) is created, which is separated into the different Refined ST portions. Table shows an excerpt from the ST table for the original EEH, where the following abbreviations are used: BOD (Biomedical Occupation or Discipline), NPP (Natural Phenomenon or Process), IC (Idea or Concept), and CVS (Chemical Viewed Structurally). Table 4.11: Sample ST Table for EEH Concept ST Parent Parent ST EEH Noise pollution EEH Environmental Pollution EEH Air Pollution, EEH Radiologic Health BOD Radioactive automobile emission EEH Smog NPP classroom. Academic Environment IC EEH environment Student Characteristics Classification Academic Environment Classification (PsycINFO Subcluster Term) PBC airborne level EEH SPECIFIC OCCUPA- j Classification TIONAL EQUIPMENT AND HAZARDS Air Pollution EEH I I Sewage EEH Waste Products Substance Garbage j EEH Refuse Disposal OA Indoor pollution j EEH Environmental Pollution EEH EEH in HPS Waste Products I Substance Environmental Pollutants HPS Industrial waste EEH n HPS environmental contamination EEH Industrial Product CVS Air PollutionEEH Substance categorized strut Substance 1 Smoke EEH n HPS turally Physical Forces NPP 1 NATURAL PHYSICAL Classification [FORCES Gaseous substance I CVS I Identifying Suspicious Concepts The algorithm of Identifying_Suspicious_Concepts was applied to the extents of the Refined STs EEH and EEH n HPS, respectively. This application yielded 27 suspicious concepts out of a total of 56 concepts in EEH, and four
128 111 suspicious concepts out of five in EEH n HPS. These suspicious concepts are listed in Table 4.12, where additional abbreviations are used as follows: MO (Manufactured Object) and SB (Social Behavior). For example, Second hand cigarette smoke is assigned EEH, however, the set of ST assignments of its parents (Natural Physical Forces and smoke) is {Classification, EEH, Hazardous Substance}, which is a superset of the ST assignment of Second hand cigarette smoke, rather than a subset of it as it should be. Therefore, this is identified as a suspicious ST assignment. Another example is Garbage, whose parents (Refuse Disposal, Specific Occupational Equipment and Hazards and Occupational hazard) have ST assignments {Occupational Activity, Classification, Phenomenon or Process}. Although Phenomenon or Process is an ancestor of EEH (the ST assignment for Garbage), the other two STs, Occupational Activity and Classification, are STs that Garbage is lacking. Thus, the ST assignment of Garbage is suspicious. All concepts with incorrect ST assignments are highlighted in Table Correcting Suspicious Semantic Type Assignments Out of the 30 suspicious concepts for EEH, 14 have erroneous ST assignments. For example, Second hand cigarette smoke is known as associated with an increased risk of developing lung cancer. It obviously has the meaning of hazardous or poisonous substance. Therefore, it should be assigned EEH n HPS, that is, both EEH and HPS. Another example is Garbage, which is assigned EEH, according to the definition of the EEH, which emphasizes the "change of the environment." However, Garbage is not only an environmental effect of humans but also a substance. Therefore, it should be reassigned EEH n Substance. In this example, all the 14 erroneous concepts identified in the previous steps do not have children. In this case, dynamic and non-dynamic auditing methodologies yield the same results. The ST assignments of EEH to 13 concepts and one assignment of EEH n HPS were corrected (See Table 4.13). The only error missed by the methodology

129 112 Table 4.12: Suspicious Concepts Identified in Extents of Refined STs EEH and EEH HPS Concepts Parents' ST 1 EEH Air Pollution, Radioactive {BOD} automobile emission {NPP } classroom environment {IC, Classification} College I {Classification, MO, organization, EEH} 1 drug-free school {Governmental or Regulatory Activity} educational environment {Educational Activity, IC, Classification} Environmental air flow {SC} Environmental Pollution {NPP, SC, BOD, EEH} Exhaust fumes {NPP, Classification, EEH} factory smoke {NPP} Food Contamination, {BOD, PP } Radioactive Garbage {OA, Classification, PP } Greenhouse Effect {SC, NPP, EEH} Industrial smog {NPP, Classification, EEH} Oil spill {Classification} PBC airborne level {Classification, EEH} Pollution {NPP, EEH, Conceptual Entity, Finding, SB} POLLUTION AND {Classification} POLLUTION EXPOSURES Poor sanitation {Finding n SB} Second hand cigarette smoke {Classification, EEH, Hazardous or Poisonous Substance} Sewage {Substance, Human-caused Phenomenon or Process} Smoking, Passive {Finding, Injury or Poisoning, EEH} Tobacco Smoke Pollution {EEH, HPS} Water fluoridation {Quantitative Concept, BOD} Water Pollution {Finding, SB, EEH} Water Pollution, Radioactive {BOD} EEH n HPS industrial waste I { Substance, HPS, BOD} Radioactive Fallout I { HPS, BOD, CVS } Radioactive waste { BOD, HPS, MO, Biological Function} Smoke { EEH, Substance, NPP, Classification, CVS}
130 is Environmental sludge, which was reassigned EEH fl SB. The reason for this omission is that this concept has no parents. Table 4.13: Corrected ST Assignments of Concepts in Extents of Refined STs EEH and EEH P HPS 113 fl Concept...All 1,,,, L.7 1 automobile emission 1 {EEH, HPS} classroom environment I {Organization} College {Organization} drug-free school {Governmental or Regulatory Activity } educational environment {IC, Classification} Exhaust fumes {EEH, HPS} - factory smoke {EEH, HPS} Garbage {EEH, Substance } Industrial smog {EEH, HPS} PBC airborne level {Quantitative Concept } Second hand cigarette smoke {EEH, HPS} Sewage {EEH, Substance} Tobacco Smoke Pollution {EEH, HPS} Industrial waste {EEH, Substance} Table 4.13 lists the 14 concepts with the semantic type reassignments after the group auditing. Six concepts are moved from EEH to EEH fl HPS, three concepts to EEH P SB, and one concept to EEH P Quantitative Concept. There are also five concepts which should not be assigned EEH at all. They are Classroom environment, College, which should be reassigned Organization, Organization, Drug free school, which should be assigned Governmental or Regulatory Activity, Educational environment which should be assigned Idea or Concept n Classification and PBC airborne level to be assigned Quantitative Concept. Since all these corrected concepts don't have children, no recursive calls are needed, and no difference exists between the dynamic and non dynamic methodologies Two concepts originally assigned the Pure ST EEH were reassigned EEH nsb. Five concepts originally assigned the Pure ST EEH were reassigned EEH P HPS. One concept Industrial Waste originally assigned EEH P HPS was reassigned EEH P SB. As a result, among the original 61 concepts in the extent of the ST EEH, 43 concepts end up in the
131 114 extent of Pure ST EEH, nine end up in the extent of the Intersection ST EEH 11 HPS, and three in the extent of the Intersection ST EEH n SB. Six concepts are not assigned EEH anymore. Table 4.14 Concepts Assigned the Pure Semantic Type EEH and Its Intersection Types After Correction EEH (Pure ST) (43 concepts) Air Pollution Environmental Pollution Pollution (of environment) 1 Air Pollution, Indoor I environmental transport POLLUTION AND POLLUTION EXPOSURES Air Pollution, Radioactive Food Contamination, Poor sanitation Radioactive Air Quality, Indoor Global Warming Sanitation problem Atmospheric Pollution Greenhouse Effect Smoking, Passive Bathing water pollution Heating Soil Degradation Bioremediation indoor pollution Soil pollution Contaminant Transport Lead pollution Thermal Water Pollution 1 Deforestation Noise pollution Tobacco Smoke Pollution I Desertification Noise, Transportation Water fluoridation Drinking water problem i Non-occupational radiation Water Pollution exposure J Drinking WaterPpollution Oil spill Water Pollution, Chemical Dust pollution pollutant flux Water Pollution, Radioactive Environmental air flow pollutant transport environmental flux I Pollution EEH 11 HPS (Intersection ST) (9 concepts) Acid Rain factory smoke Radioactive Waste automobile emission Industrial smog Second hand cigarette smoke Exhaust fumes Radioactive Fallout Smoke EEH 11 Substance (Intersection ST) (4 concepts) Environmental sludge a I Garbage Industry waste Sewage 1 'This concept was not found by the auditing methodology. Partition Refined ST Extent into Cohesive Sets Hierarchical relationship auditing is performed on EEH related Refined STs. After semantic auditing (Figure 4.9), there are 21 cohesive sets for the Refined ST EEH, among which 20 are singletons. six child-of
132 115 relationships are added (Figure 4.10). For example, Thermal Water Pollution is more specific than Water Pollution. Therefore, a child-of was added to establish the hierarchical relationships between these two concepts. Environmental sludge and atmospheric pollution were singletons. They actually are kinds of Environmental Pollution, just as their counterparts, such as indoor pollution. Pollutant transport and Contaminant transport are specifications for Environmental transport. Therefore, proper child-of links were established. No hierarchical relationships are modified for the Refined STs EEH n HPS, EEH n Substance and EEH n Quantitative Concept. To study the hypotheses on auditing of the hierarchical relationships for the EEH extent, an exhaustive review was also conducted. The result shows that the recall for Hypothesis 1 is 1.0. Among the 20 small cohesive sets, six were missing hierarchical relationships. Hence for the EEH extent, 30% of the roots of the small cohesive sets missed hierarchical relationships. No missing hierarchical relationships were found from the large cohesive set. For Hypothesis 2, the EEH extent does not provide data. The reason is that all the concepts in E(pure EEH) did not change their ST assignments, while no missing hierarchical relationships were found from the other refined extents E(EEH n Substance) or E(EEH n HPS). 4.4 Discussion Evaluation In order to evaluate the auditing results obtained by the presented methodologies, they were applied to two different STs with small extents, EMD and EEH. To measure the performance of the methodologies, a comprehensive manual audit was conducted for each of the two tasks for the two STs. With respect to the extents of the refined STs of EMD, the pure ST EMD and the ST EMD n NP, the auditing results achieved with the dynamic methodology nearly matched those obtained by a comprehensive manual review of all the extents' concepts. Assuming that the comprehensive manual review found all errors, then
133 Figure 4.9: EEH (Pure ST) after semantic auditing.
134 Figure 4.10: EEH (Pure ST) after hierarchical auditing.
135 118 our straightforward and dynamic auditing methodologies have a recall of 12/16= 0.80 and a recall of 15/16=0.94, respectively. The precisions are 12/30 = 0.4 and 15/30= 0.50, respectively, much higher than the precision 16/73=0.22 for the comprehensive manual review. For the methodology of finding missing IS-A relationships, a recall of 1.0 is achieved for the whole extent of EMD, since when the process was completed there were two cohesive groups, one for each refined ST, connecting all the previously isolated smaller cohesive groups. With regard to the EEH extent, there was no difference between the straightforward and the dynamic methodologies. The reason is that no concept for which a reassignment was made had children, the ST assignments of which may have become suspicious now. The precision of the comprehensive manual review is 15/61=0.25. Assuming that the comprehensive manual review found all errors, the algorithmic (either dynamic or straightforward) methodology has a recall of 14/15=0.93. The precision is 14/30=0.47, much higher than for the exhaustive review. The methodology was also evaluated when used in auditing the hierarchical relationships in EEH-related extents. The recall was 1.0, as for EMD. The results for the STs EMD and EEH confirmed Hypothesis 1 that the probability of missing IS-As for roots of cohesive sets is higher in small cohesive sets with three or fewer concepts, than in large cohesive sets. Only the results for EMD confirmed Hypothesis 2 about as expected higher likelihood of missing hierarchical relationships for concepts with erroneous ST assignments. This confirmation shows that ST assignment errors tend to expose other errors as well. The results for the ST EEH did not provide data to support Hypothesis Interpretation As mentioned earlier, errors found in ST assignments do not simply indicate incorrect categorizations, but may also expose other kinds of errors. For example, a concept may have an incorrect child-of to a parent from which it inherits an incorrect ST assignment.
136 119 Once the ST mis-assignment is uncovered, the incorrect child-of may be corrected in the process. For example, the child-of relationship from Genetically Engineered Mouse (reassigned from EMD to Mammal), originally directed to Organism Modification (assigned Research Activity), was indeed redirected in release 2006AD to Laboratory Animal. Furthermore, lateral relationships inherited via the erroneous child-of can be removed. If a concept is assigned a new ST, it may indicate that it was missing a child-of For example, the concept Mouse Models of Human Cancer, originally assigned EMD, additionally assigned Neoplastic Process as a result of auditing, should have had a child-of to Animal Cancer Model, also assigned EMD fl Neoplastic Process. In the case of the ST EMD, one can further limit the amount of suspicious concepts needing review. This improvement is based on the observation that many concepts assigned EMD represent an experimental disease and have as a parent the respective concept representing the same disease in humans. For example, Melanoma, experimental has the parent Melanoma. Thus, the ST Disease or Sydrome should be allowed as a legitimate assignment for a parent of an EMD concept. For example, the concept Arthritis, Experimental assigned EMD will not be considered suspicious due to its parent Arthritis being assigned Disease or Sydrome. Utilizing this improvement, eight concepts in Table 4.4 would not be considered suspicious, saving an auditor's efforts by reducing the number of reviewed concepts from 30 to 23 and improving error precision from 12/30 = 0.42 to 12/22 = Note that the same effect would have occurred if ST EMD would have been changed to "IS-A Disease or Syndrome", rather than the current "IS-A Pathologic Function." By the definition of the two STs, this is a desirable change, since EMD models a human disease represented in an experimental organism Limitations Experiments with STs having large extents are needed to further examine the efficiency of the presented methodology for auditing ST assignments and the percentage of suspicious concepts found. The methodology described in this chapter may still be difficult to apply to
137 120 very large ST extents, since for such extents, it may be that even the number of suspicious concepts will be overwhelming. In such cases, it may help to partition the suspicious concepts into cohesive sets of narrower semantics (as was done for Auditing Hierarchical Relationships Methodology). A human review of such smaller groups will be comparatively more feasible. Furthermore, by looking at the roots of such cohesive sets, one may choose to manually review only those promising a potentially higher likelihood of errors. Those ideas require further experiments with STs with large extents. The ST assignments for UMLS concepts are an artifact created by the NLM when integrating various source terminologies [41]. Hence, the NLM has no outside constraints preventing it from correcting wrong assignments. However, there are problems in correcting wrong child-of relationships or adding missing ones. According to the NLM policy, only relationships appearing in a source terminology can be represented in the UMLS. In Table- 4.15, all the missing child-of relationships we identified for the concepts assigned EMD are listed. For both the child and the parent their source terminologies are listed. For 15 (highlighted) out of 27 concepts, both child and parent appear in the MESH [62] source terminology. Thus, these results can be submitted to the MESH editor suggesting to add the missing child-of relationships. The corrections in the MESH terminology would then propagate to the future release of the UMLS. One missing child-of appears between two concepts from the NCI [63] source terminology. Those can be corrected by an NCI editor. The rest of the cases are between concepts from different source terminologies. For EEH only one child-of is missing between two concepts of the source terminology MESH, from Thermal Water Pollution to Water Pollution. Note that the partition of the extent of a Refined ST into cohesive sets, i.e. singly rooted Directed Acyclic Graph (DAG) structure hierarchies is not always possible. A connected component of an extent may have several roots. For such cases, the methodology for finding missing child-of relationships needs modification. Future research in designing
138 121 modifications for this methodology for multi-rooted connected component hierarchies is needed. 4.5 Conclusions An auditing paradigm for the UMLS was presented, which is based on groups of concepts which, by their definitions in the UMLS, are purportedly of similar semantics. A human expert auditor looking at such a group is usually able to tell quickly whether one or more of the concepts does not fit in, or if there is a concept that is obviously missing because it is similar to the group of existing concepts. The approach is based on the extents of semantic types. However, because ST extents are often not uniform, a Refined Semantic Network (RSN) was constructed and used. Every concept of the UMLS is assigned exactly one refined semantic type from the RSN, and all concepts in the extent of such a refined semantic type have a uniform semantics. As a result of this, auditors see smaller groups of concepts of uniform semantics, and detecting concepts that do not fit in becomes easier. However, groups may still be large, and this chapter presented an additional mechanism to select suspicious concepts. A concept is suspicious if one of its semantic types is neither equal to the semantic type of its parent, nor a descendant of the semantic type of the parent. In a second step, the uniform groups of concepts are further partitioned into cohesive sets. In a cohesive set, one special concept, the root, is reachable from every other concept by a chain of child-of links. The root itself does not have any child-of links to other concepts within the same extent. A recursive methodology has been developed, which allows a human expert, with the support of an algorithm, to combine pairs of cohesive sets into a smaller number of conesive sets by inserting missing child-of links. The resulting structure will be tree or a Directed Acyclic Graph (DAG). It is not always possible to combine all concepts of a group into singly rooted DAGs, however, in the chapter, examples where shown where this is possible. The methodologies were demonstrated with the extents
 Alloxan Diabetes Source(s) MSH Parent I Source(s) Diabetes Mellitus, Experi- I")
139 2 2 Table 4.15: Missing Hierarchical Relationship Between EMD Concepts and the Concepts' Source Terminologies Concept EMD (Pure ST) Alloxan Diabetes Source(s) MSH Parent I Source(s) Diabetes Mellitus, Experi- I MSH, NDFRT mental Animal Disease Models MSH, MTH Disease model MTH Arthritis, Adjuvant-Induced MSH Arthritis, Experimental MSH _I Arthritis, Collagen-Induced MSH Arthritis, Experimental MSH Experimental Autoimmune I MSH Myasthenia Gravis, MSH, NDFRT 1 Myasthenia Gravis, Passive I Autoimmune, Experimental Transfer Experimental Autoimmune MSH Animal Disease Models MSH, MTH 1 Myasthenia Gravis, Passive Transfer Experimental High Pressure I MSH Animal Disease Models MSH, MTH Neurological Syndrome Experimental Lung Inflamation MSH, MTH Animal Disease Models MSH, MTH.. I Experimental Pneumococcal MSH 1 Animal Disease Models MSH, MTH --1 Meningitis I I 1 Hypokinesia, Experimental MSH Animal Disease Models MSH, MTH No-rodent Model NCI Disease model MTH Rodent Model NCI Disease model MTH Streotozotocin Diabetes MSH Diabetes Mellitus, Experi- MSH, NDFRT 1 mental Transgenic Model NCI Disease model MTH Xenograft Model NCI Disease model IMTH 1 EMD fl NP (Intersection ST) Experimental Hepatoma MSH Neoplasms, Experimental MSH, NDFRT Hepatoma, Morris j MSH Hypokinesia, Experimental MSH Hepatoma, Novikoff MSH Hypokinesia, Experimental MSH ---1 Plexus Mouse Choroid NCI MTH, Neoplasms, Experimental MSH, NDFRT Carcinoma Mouse Choroid Plexus MTH, NCI Neoplasms, Experimental MSH, NDFRT Papilloma I Mouse Glucagonoma MTH, NCI Neoplasms, Experimental MSH, NDFRT Mouse Models of Human NCI Animal Cancer Model I NCI Cancer Rous Sarcoma NCI, MSH I Tumor Virus Infections MSH, NDFRT Rous Sarcoma I NCI, MSH Sarcoma, Experimental MSH, NDFRT I Sarcoma, Engelbreth- MSH Sarcoma, Experimental MSH, NDFRT Holm-Swarm Sarcoma, Jensen i MSH Sarcoma, Experimental MSH, NDFRT
Auditing SNOMED Relationships Using a Converse Abstraction Network
 Auditing SNOMED Relationships Using a Converse Abstraction Network Duo Wei, MS 1, Michael Halper, PhD 2, Gai Elhanan, MD 1, Yan Chen, PhD 3, Yehoshua Perl, PhD 1, James Geller, PhD 1, Kent A. Spackman,
Formalizing UMLS Relations using Semantic Partitions in the context of task-based Clinical Guidelines Model
 Formalizing UMLS Relations using Semantic Partitions in the context of task-based Clinical Guidelines Model Anand Kumar, Matteo Piazza, Silvana Quaglini, Mario Stefanelli Laboratory of Medical Informatics,
Copyright Warning & Restrictions
 Copyright Warning & Restrictions The copyright law of the United States (Title 17, United States Code) governs the making of photocopies or other reproductions of copyrighted material. Under certain conditions
A Descriptive Delta for Identifying Changes in SNOMED CT
 A Descriptive Delta for Identifying Changes in SNOMED CT Christopher Ochs, Yehoshua Perl, Gai Elhanan Department of Computer Science New Jersey Institute of Technology Newark, NJ, USA {cro3, perl, elhanan}@njit.edu
Chapter 1. Introduction
 Chapter 1 Introduction 1.1 Motivation and Goals The increasing availability and decreasing cost of high-throughput (HT) technologies coupled with the availability of computational tools and data form a
Deriving an Abstraction Network to Support Quality Assurance in OCRe
 Deriving an Abstraction Network to Support Quality Assurance in OCRe Christopher Ochs, MS 1, Ankur Agrawal, BE 1, Yehoshua Perl, PhD 1, Michael Halper, PhD 1, Samson W. Tu, MS 3, Simona Carini, MA 2, Ida
IAASB Main Agenda (March 2005) Page Agenda Item. DRAFT EXPLANATORY MEMORANDUM ISA 701 and ISA 702 Exposure Drafts February 2005
 Page Agenda Item. DRAFT EXPLANATORY MEMORANDUM ISA 701 and ISA 702 Exposure Drafts February 2005") IAASB Main Agenda (March 2005) Page 2005 579 Agenda Item 13-F DRAFT EXPLANATORY MEMORANDUM ISA 701 and ISA 702 Exposure Drafts February 2005 Introduction This memorandum provides some background to, and
IAASB Main Agenda (March 2005) Page 2005 579 Agenda Item 13-F DRAFT EXPLANATORY MEMORANDUM ISA 701 and ISA 702 Exposure Drafts February 2005 Introduction This memorandum provides some background to, and
Biomedical resources for text mining
 August 30, 2005 Workshop Terminologies and ontologies in biomedicine: Can text mining help? Biomedical resources for text mining Olivier Bodenreider Lister Hill National Center for Biomedical Communications
Essential Skills for Evidence-based Practice Understanding and Using Systematic Reviews
 J Nurs Sci Vol.28 No.4 Oct - Dec 2010 Essential Skills for Evidence-based Practice Understanding and Using Systematic Reviews Jeanne Grace Corresponding author: J Grace E-mail: Jeanne_Grace@urmc.rochester.edu
A Comparison of Collaborative Filtering Methods for Medication Reconciliation
 A Comparison of Collaborative Filtering Methods for Medication Reconciliation Huanian Zheng, Rema Padman, Daniel B. Neill The H. John Heinz III College, Carnegie Mellon University, Pittsburgh, PA, 15213,
ISA 540, Auditing Accounting Estimates, Including Fair Value Accounting Estimates, and Related Disclosures Issues and Task Force Recommendations
 Agenda Item 1-A ISA 540, Auditing Accounting Estimates, Including Fair Value Accounting Estimates, and Related Disclosures Issues and Task Force Recommendations Introduction 1. Since the September 2016
Chapter IR:VIII. VIII. Evaluation. Laboratory Experiments Logging Effectiveness Measures Efficiency Measures Training and Testing
 Chapter IR:VIII VIII. Evaluation Laboratory Experiments Logging Effectiveness Measures Efficiency Measures Training and Testing IR:VIII-1 Evaluation HAGEN/POTTHAST/STEIN 2018 Retrieval Tasks Ad hoc retrieval:
Answers to end of chapter questions
 Answers to end of chapter questions Chapter 1 What are the three most important characteristics of QCA as a method of data analysis? QCA is (1) systematic, (2) flexible, and (3) it reduces data. What are
Perceived similarity and visual descriptions in content-based image retrieval
 University of Wollongong Research Online Faculty of Informatics - Papers (Archive) Faculty of Engineering and Information Sciences 2007 Perceived similarity and visual descriptions in content-based image
How preferred are preferred terms?
 How preferred are preferred terms? Gintare Grigonyte 1, Simon Clematide 2, Fabio Rinaldi 2 1 Computational Linguistics Group, Department of Linguistics, Stockholm University Universitetsvagen 10 C SE-106
IAASB Main Agenda (September 2005) Page Agenda Item. Analysis of ISA 330 and Mapping Document
 Page Agenda Item. Analysis of ISA 330 and Mapping Document") IAASB Main Agenda (September 2005 Page 2005 1869 Agenda Item 4-D.1 Analysis of ISA 330 and Mapping Document 1. Exhibit 1 sets out statements in ISA 330 that use the present tense to describe auditor actions,
IAASB Main Agenda (September 2005 Page 2005 1869 Agenda Item 4-D.1 Analysis of ISA 330 and Mapping Document 1. Exhibit 1 sets out statements in ISA 330 that use the present tense to describe auditor actions,
A Comparison of Three Measures of the Association Between a Feature and a Concept
 A Comparison of Three Measures of the Association Between a Feature and a Concept Matthew D. Zeigenfuse (mzeigenf@msu.edu) Department of Psychology, Michigan State University East Lansing, MI 48823 USA
Mapping the elements of physical security towards the creation of a holistic physical security model
 Edith Cowan University Research Online Theses: Doctorates and Masters Theses 2007 Mapping the elements of physical security towards the creation of a holistic physical security model Zachary J. Alach Edith
Basis for Conclusions: ISA 230 (Redrafted), Audit Documentation
, Audit Documentation") Basis for Conclusions: ISA 230 (Redrafted), Audit Documentation Prepared by the Staff of the International Auditing and Assurance Standards Board December 2007 , AUDIT DOCUMENTATION This Basis for Conclusions
Basis for Conclusions: ISA 230 (Redrafted), Audit Documentation Prepared by the Staff of the International Auditing and Assurance Standards Board December 2007 , AUDIT DOCUMENTATION This Basis for Conclusions
Recognizing Scenes by Simulating Implied Social Interaction Networks
 Recognizing Scenes by Simulating Implied Social Interaction Networks MaryAnne Fields and Craig Lennon Army Research Laboratory, Aberdeen, MD, USA Christian Lebiere and Michael Martin Carnegie Mellon University,
Fiona Campbell. ISA 315 (Revised) Responding to Comments to the Exposure Draft. Deputy Chair of the IAASB and Chair of the ISA 315 Task Force
 Responding to Comments to the Exposure Draft. Deputy Chair of the IAASB and Chair of the ISA 315 Task Force") ISA 315 (Revised) Responding to Comments to the Exposure Draft IAASB Meeting March 12 th, 2019 Fiona Campbell Deputy Chair of the IAASB and Chair of the ISA 315 Task Force Responses to ED-315 Broad concerns
ISA 315 (Revised) Responding to Comments to the Exposure Draft IAASB Meeting March 12 th, 2019 Fiona Campbell Deputy Chair of the IAASB and Chair of the ISA 315 Task Force Responses to ED-315 Broad concerns
English 10 Writing Assessment Results and Analysis
 Academic Assessment English 10 Writing Assessment Results and Analysis OVERVIEW This study is part of a multi-year effort undertaken by the Department of English to develop sustainable outcomes assessment
Technical Specifications
 Technical Specifications In order to provide summary information across a set of exercises, all tests must employ some form of scoring models. The most familiar of these scoring models is the one typically
Stepwise Knowledge Acquisition in a Fuzzy Knowledge Representation Framework
 Stepwise Knowledge Acquisition in a Fuzzy Knowledge Representation Framework Thomas E. Rothenfluh 1, Karl Bögl 2, and Klaus-Peter Adlassnig 2 1 Department of Psychology University of Zurich, Zürichbergstraße
CHAPTER 3 METHOD AND PROCEDURE
 CHAPTER 3 METHOD AND PROCEDURE Previous chapter namely Review of the Literature was concerned with the review of the research studies conducted in the field of teacher education, with special reference
DON M. PALLAIS, CPA 14 Dahlgren Road Richmond, Virginia Telephone: (804) Fax: (804)
 Fax: (804)") DON M. PALLAIS, CPA 14 Dahlgren Road Richmond, Virginia 23233 Telephone: (804) 784-0884 Fax: (804) 784-0885 Office of the Secretary PCAOB 1666 K Street, NW Washington, DC 20006-2083 Gentlemen: November
DON M. PALLAIS, CPA 14 Dahlgren Road Richmond, Virginia 23233 Telephone: (804) 784-0884 Fax: (804) 784-0885 Office of the Secretary PCAOB 1666 K Street, NW Washington, DC 20006-2083 Gentlemen: November
Principles of publishing
 Principles of publishing Issues of authorship, duplicate publication and plagiarism in scientific journal papers can cause considerable conflict among members of research teams and embarrassment for both
Basis for Conclusions: ISA 530 (Redrafted), Audit Sampling
, Audit Sampling") Basis for Conclusions: ISA 530 (Redrafted), Audit Sampling Prepared by the Staff of the International Auditing and Assurance Standards Board October 2008 , AUDIT SAMPLING This Basis for Conclusions has
Basis for Conclusions: ISA 530 (Redrafted), Audit Sampling Prepared by the Staff of the International Auditing and Assurance Standards Board October 2008 , AUDIT SAMPLING This Basis for Conclusions has
What Is A Knowledge Representation? Lecture 13
 What Is A Knowledge Representation? 6.871 - Lecture 13 Outline What Is A Representation? Five Roles What Should A Representation Be? What Consequences Does This View Have For Research And Practice? One
Analyzing Spammers Social Networks for Fun and Profit
 Chao Yang Robert Harkreader Jialong Zhang Seungwon Shin Guofei Gu Texas A&M University Analyzing Spammers Social Networks for Fun and Profit A Case Study of Cyber Criminal Ecosystem on Twitter Presentation:
A Study of Abbreviations in Clinical Notes Hua Xu MS, MA 1, Peter D. Stetson, MD, MA 1, 2, Carol Friedman Ph.D. 1
 A Study of Abbreviations in Clinical Notes Hua Xu MS, MA 1, Peter D. Stetson, MD, MA 1, 2, Carol Friedman Ph.D. 1 1 Department of Biomedical Informatics, Columbia University, New York, NY, USA 2 Department
NODE CONNECTIVITY AND CONDITIONAL DENSITY D. White and F. Harary. Definitions of Cohesive Sets in Social Networks
 NODE CONNECTIVITY AND CONDITIONAL DENSITY D. White and F. Harary Definitions of Cohesive Sets in Social Networks The connectivity K (G) kappa of a connected graph G is the minimum number of nodes needed
International Journal of Software and Web Sciences (IJSWS)
") International Association of Scientific Innovation and Research (IASIR) (An Association Unifying the Sciences, Engineering, and Applied Research) ISSN (Print): 2279-0063 ISSN (Online): 2279-0071 International
International Association of Scientific Innovation and Research (IASIR) (An Association Unifying the Sciences, Engineering, and Applied Research) ISSN (Print): 2279-0063 ISSN (Online): 2279-0071 International
Bayesian (Belief) Network Models,
 Network Models,") Bayesian (Belief) Network Models, 2/10/03 & 2/12/03 Outline of This Lecture 1. Overview of the model 2. Bayes Probability and Rules of Inference Conditional Probabilities Priors and posteriors Joint distributions
Bayesian (Belief) Network Models, 2/10/03 & 2/12/03 Outline of This Lecture 1. Overview of the model 2. Bayes Probability and Rules of Inference Conditional Probabilities Priors and posteriors Joint distributions
This memo includes background of the project, the major themes within the comments, and specific issues that require further CSAC/HITAC action.
 TO: FR: RE: Consensus Standards Approval Committee (CSAC) Health IT Advisory Committee (HITAC) Helen Burstin, Karen Pace, and Christopher Millet Comments Received on Draft Report: Review and Update of
2013 Supervisor Survey Reliability Analysis
 2013 Supervisor Survey Reliability Analysis In preparation for the submission of the Reliability Analysis for the 2013 Supervisor Survey, we wanted to revisit the purpose of this analysis. This analysis
11-3. Learning Objectives
 11-1 Measurement Learning Objectives 11-3 Understand... The distinction between measuring objects, properties, and indicants of properties. The similarities and differences between the four scale types
CHAPTER VI RESEARCH METHODOLOGY
 CHAPTER VI RESEARCH METHODOLOGY 6.1 Research Design Research is an organized, systematic, data based, critical, objective, scientific inquiry or investigation into a specific problem, undertaken with the
Schema-Driven Relationship Extraction from Unstructured Text
 Wright State University CORE Scholar Kno.e.sis Publications The Ohio Center of Excellence in Knowledge- Enabled Computing (Kno.e.sis) 2007 Schema-Driven Relationship Extraction from Unstructured Text Cartic
Incorporation of Imaging-Based Functional Assessment Procedures into the DICOM Standard Draft version 0.1 7/27/2011
 Incorporation of Imaging-Based Functional Assessment Procedures into the DICOM Standard Draft version 0.1 7/27/2011 I. Purpose Drawing from the profile development of the QIBA-fMRI Technical Committee,
Building a Diseases Symptoms Ontology for Medical Diagnosis: An Integrative Approach
 Building a Diseases Symptoms Ontology for Medical Diagnosis: An Integrative Approach Osama Mohammed, Rachid Benlamri and Simon Fong* Department of Software Engineering, Lakehead University, Ontario, Canada
Fuzzy Decision Tree FID
 Fuzzy Decision Tree FID Cezary Z. Janikow Krzysztof Kawa Math & Computer Science Department Math & Computer Science Department University of Missouri St. Louis University of Missouri St. Louis St. Louis,
Systems Theory: Should Information Researchers Even Care?
 Association for Information Systems AIS Electronic Library (AISeL) SAIS 2016 Proceedings Southern (SAIS) 2016 Systems Theory: Should Information Researchers Even Care? Kane J. Smith Virginia Commonwealth
PO Box 19015, Arlington, TX {ramirez, 5323 Harry Hines Boulevard, Dallas, TX
 From: Proceedings of the Eleventh International FLAIRS Conference. Copyright 1998, AAAI (www.aaai.org). All rights reserved. A Sequence Building Approach to Pattern Discovery in Medical Data Jorge C. G.
From where does the content of a certain geo-communication come? semiotics in web-based geo-communication Brodersen, Lars
 Downloaded from vbn.aau.dk on: april 02, 2019 Aalborg Universitet From where does the content of a certain geo-communication come? semiotics in web-based geo-communication Brodersen, Lars Published in:
These Terms Synonym Term Manual Used Relationship
 These Terms Synonym Term Manual Used Relationship For more information see the 'Term Basket' section below. In this manner, a set of GO terms can be selected that can then be used to retrieve window showing
COMPUTING READER AGREEMENT FOR THE GRE
 RM-00-8 R E S E A R C H M E M O R A N D U M COMPUTING READER AGREEMENT FOR THE GRE WRITING ASSESSMENT Donald E. Powers Princeton, New Jersey 08541 October 2000 Computing Reader Agreement for the GRE Writing
A review of statistical methods in the analysis of data arising from observer reliability studies (Part 11) *
 *") A review of statistical methods in the analysis of data arising from observer reliability studies (Part 11) * by J. RICHARD LANDIS** and GARY G. KOCH** 4 Methods proposed for nominal and ordinal data Many
A review of statistical methods in the analysis of data arising from observer reliability studies (Part 11) * by J. RICHARD LANDIS** and GARY G. KOCH** 4 Methods proposed for nominal and ordinal data Many
Measuring Performance Of Physicians In The Diagnosis Of Endometriosis Using An Expectation-Maximization Algorithm
 Yale University EliScholar A Digital Platform for Scholarly Publishing at Yale Public Health Theses School of Public Health January 2014 Measuring Performance Of Physicians In The Diagnosis Of Endometriosis
Copyright is owned by the Author of the thesis. Permission is given for a copy to be downloaded by an individual for the purpose of research and
 Copyright is owned by the Author of the thesis. Permission is given for a copy to be downloaded by an individual for the purpose of research and private study only. The thesis may not be reproduced elsewhere
Some Thoughts on the Principle of Revealed Preference 1
 Some Thoughts on the Principle of Revealed Preference 1 Ariel Rubinstein School of Economics, Tel Aviv University and Department of Economics, New York University and Yuval Salant Graduate School of Business,
A Bayesian Network Model of Knowledge-Based Authentication
 Association for Information Systems AIS Electronic Library (AISeL) AMCIS 2007 Proceedings Americas Conference on Information Systems (AMCIS) December 2007 A Bayesian Network Model of Knowledge-Based Authentication
Author s response to reviews
 Author s response to reviews Title: The epidemiologic characteristics of healthcare provider-diagnosed eczema, asthma, allergic rhinitis, and food allergy in children: a retrospective cohort study Authors:
Using Perceptual Grouping for Object Group Selection
 Using Perceptual Grouping for Object Group Selection Hoda Dehmeshki Department of Computer Science and Engineering, York University, 4700 Keele Street Toronto, Ontario, M3J 1P3 Canada hoda@cs.yorku.ca
Basis for Conclusions: ISA 500 (Redrafted), Audit Evidence
, Audit Evidence") Basis for Conclusions: ISA 500 (Redrafted), Audit Evidence Prepared by the Staff of the International Auditing and Assurance Standards Board December 2008 , AUDIT EVIDENCE This Basis for Conclusions has
Basis for Conclusions: ISA 500 (Redrafted), Audit Evidence Prepared by the Staff of the International Auditing and Assurance Standards Board December 2008 , AUDIT EVIDENCE This Basis for Conclusions has
Chapter 5: Field experimental designs in agriculture
 Chapter 5: Field experimental designs in agriculture Jose Crossa Biometrics and Statistics Unit Crop Research Informatics Lab (CRIL) CIMMYT. Int. Apdo. Postal 6-641, 06600 Mexico, DF, Mexico Introduction
FSA Training Papers Grade 7 Exemplars. Rationales
 FSA Training Papers Grade 7 Exemplars Rationales Rationales for Grade 7 Exemplars Reading Grade 7 Reading Exemplar #1: Score 3 Comprehension of the passages and task clearly evident Generally purposeful
SUPPLEMENTARY INFORMATION In format provided by Javier DeFelipe et al. (MARCH 2013)
") Supplementary Online Information S2 Analysis of raw data Forty-two out of the 48 experts finished the experiment, and only data from these 42 experts are considered in the remainder of the analysis. We
Supplementary Online Information S2 Analysis of raw data Forty-two out of the 48 experts finished the experiment, and only data from these 42 experts are considered in the remainder of the analysis. We
Unit 1 Exploring and Understanding Data
 Unit 1 Exploring and Understanding Data Area Principle Bar Chart Boxplot Conditional Distribution Dotplot Empirical Rule Five Number Summary Frequency Distribution Frequency Polygon Histogram Interquartile
Erasmus MC at CLEF ehealth 2016: Concept Recognition and Coding in French Texts
 Erasmus MC at CLEF ehealth 2016: Concept Recognition and Coding in French Texts Erik M. van Mulligen, Zubair Afzal, Saber A. Akhondi, Dang Vo, and Jan A. Kors Department of Medical Informatics, Erasmus
Copyright is owned by the Author of the thesis. Permission is given for a copy to be downloaded by an individual for the purpose of research and
 Copyright is owned by the Author of the thesis. Permission is given for a copy to be downloaded by an individual for the purpose of research and private study only. The thesis may not be reproduced elsewhere
Pilot Study: Clinical Trial Task Ontology Development. A prototype ontology of common participant-oriented clinical research tasks and
 Pilot Study: Clinical Trial Task Ontology Development Introduction A prototype ontology of common participant-oriented clinical research tasks and events was developed using a multi-step process as summarized
FINAL REPORT Measuring Semantic Relatedness using a Medical Taxonomy. Siddharth Patwardhan. August 2003
 FINAL REPORT Measuring Semantic Relatedness using a Medical Taxonomy by Siddharth Patwardhan August 2003 A report describing the research work carried out at the Mayo Clinic in Rochester as part of an
Developing an instrument to measure informed consent comprehension in non-cognitively impaired adults
 University of Wollongong Research Online University of Wollongong Thesis Collection 1954-2016 University of Wollongong Thesis Collections 2009 Developing an instrument to measure informed consent comprehension
INTERNATIONAL STANDARD ON ASSURANCE ENGAGEMENTS 3000 ASSURANCE ENGAGEMENTS OTHER THAN AUDITS OR REVIEWS OF HISTORICAL FINANCIAL INFORMATION CONTENTS
 INTERNATIONAL STANDARD ON ASSURANCE ENGAGEMENTS 3000 ASSURANCE ENGAGEMENTS OTHER THAN AUDITS OR REVIEWS OF HISTORICAL FINANCIAL INFORMATION (Effective for assurance reports dated on or after January 1,
PRIDE TECHNICAL REPORT
 PRIDE TECHNICAL REPORT THE PRIDE QUESTIONNAIRE FOR GRADES 6 12 Validity and Reliability Study By Leroy Metze, Ph.D. Director of Educational Technology / Professor of Psychology Western Kentucky University
STATISTICAL METHODS FOR DIAGNOSTIC TESTING: AN ILLUSTRATION USING A NEW METHOD FOR CANCER DETECTION XIN SUN. PhD, Kansas State University, 2012
 STATISTICAL METHODS FOR DIAGNOSTIC TESTING: AN ILLUSTRATION USING A NEW METHOD FOR CANCER DETECTION by XIN SUN PhD, Kansas State University, 2012 A THESIS Submitted in partial fulfillment of the requirements
Enumerative and Analytic Studies. Description versus prediction
 Quality Digest, July 9, 2018 Manuscript 334 Description versus prediction The ultimate purpose for collecting data is to take action. In some cases the action taken will depend upon a description of what
Reliability of feedback fechanism based on root cause defect analysis - case study
 Annales UMCS Informatica AI XI, 4 (2011) 21 32 DOI: 10.2478/v10065-011-0037-0 Reliability of feedback fechanism based on root cause defect analysis - case study Marek G. Stochel 1 1 Motorola Solutions
Position Paper: How Certain is Recommended Trust-Information?
 Position Paper: How Certain is Recommended Trust-Information? Uwe Roth University of Luxembourg FSTC Campus Kirchberg 6, rue Richard Coudenhove-Kalergi L-1359 Luxembourg uwe.roth@uni.lu ABSTRACT Nowadays
Using Data Mining Techniques to Analyze Crime patterns in Sri Lanka National Crime Data. K.P.S.D. Kumarapathirana A
 !_ & Jv OT-: j! O6 / *; a IT Oi/i34- Using Data Mining Techniques to Analyze Crime patterns in Sri Lanka National Crime Data K.P.S.D. Kumarapathirana 139169A LIBRARY UNIVERSITY or MORATL^VA, SRI LANKA
Identification of Tissue Independent Cancer Driver Genes
 Identification of Tissue Independent Cancer Driver Genes Alexandros Manolakos, Idoia Ochoa, Kartik Venkat Supervisor: Olivier Gevaert Abstract Identification of genomic patterns in tumors is an important
Support system for breast cancer treatment
 Support system for breast cancer treatment SNEZANA ADZEMOVIC Civil Hospital of Cacak, Cara Lazara bb, 32000 Cacak, SERBIA Abstract:-The aim of this paper is to seek out optimal relation between diagnostic
Positive and Unlabeled Relational Classification through Label Frequency Estimation
 Positive and Unlabeled Relational Classification through Label Frequency Estimation Jessa Bekker and Jesse Davis Computer Science Department, KU Leuven, Belgium firstname.lastname@cs.kuleuven.be Abstract.
How Does Analysis of Competing Hypotheses (ACH) Improve Intelligence Analysis?
 Improve Intelligence Analysis?") How Does Analysis of Competing Hypotheses (ACH) Improve Intelligence Analysis? Richards J. Heuer, Jr. Version 1.2, October 16, 2005 This document is from a collection of works by Richards J. Heuer, Jr.
How Does Analysis of Competing Hypotheses (ACH) Improve Intelligence Analysis? Richards J. Heuer, Jr. Version 1.2, October 16, 2005 This document is from a collection of works by Richards J. Heuer, Jr.
Comparing Vertical and Horizontal Scoring of Open-Ended Questionnaires
 A peer-reviewed electronic journal. Copyright is retained by the first or sole author, who grants right of first publication to the Practical Assessment, Research & Evaluation. Permission is granted to
Neuroscience and Generalized Empirical Method Go Three Rounds
 Bruce Anderson, Neuroscience and Generalized Empirical Method Go Three Rounds: Review of Robert Henman s Global Collaboration: Neuroscience as Paradigmatic Journal of Macrodynamic Analysis 9 (2016): 74-78.
PubMed Tutorial Author: Gökhan Alpaslan DMD,Ph.D. e-vident
 PubMed Tutorial Author: Gökhan Alpaslan DMD,Ph.D e-vident Objectives Introducing Practitioner PubMed Searching for Systematic Reviews Combining Search Terms MeSH Search Outline What is PubMed Searching
THE RELATIONSHIP BETWEEN PERSONAL MEANING, SENSE OF COHERENCE AND ORGANISATIONAL COMMITMENT INGRA DU BUISSON-NARSAI
 THE RELATIONSHIP BETWEEN PERSONAL MEANING, SENSE OF COHERENCE AND ORGANISATIONAL COMMITMENT by INGRA DU BUISSON-NARSAI submitted in part fulfillment of the requirements for the degree of MASTER OF COMMERCE
PROPOSED WORK PROGRAMME FOR THE CLEARING-HOUSE MECHANISM IN SUPPORT OF THE STRATEGIC PLAN FOR BIODIVERSITY Note by the Executive Secretary
 CBD Distr. GENERAL UNEP/CBD/COP/11/31 30 July 2012 ORIGINAL: ENGLISH CONFERENCE OF THE PARTIES TO THE CONVENTION ON BIOLOGICAL DIVERSITY Eleventh meeting Hyderabad, India, 8 19 October 2012 Item 3.2 of
Mining Low-Support Discriminative Patterns from Dense and High-Dimensional Data. Technical Report
 Mining Low-Support Discriminative Patterns from Dense and High-Dimensional Data Technical Report Department of Computer Science and Engineering University of Minnesota 4-192 EECS Building 200 Union Street
A Study on a Comparison of Diagnostic Domain between SNOMED CT and Korea Standard Terminology of Medicine. Mijung Kim 1* Abstract
 , pp.49-60 http://dx.doi.org/10.14257/ijdta.2016.9.11.05 A Study on a Comparison of Diagnostic Domain between SNOMED CT and Korea Standard Terminology of Medicine Mijung Kim 1* 1 Dept. Of Health Administration,
Characteristics of Serial Title Changes and Recognition of New Serial Works: Theoretical and Practical Implications
 Utah State University DigitalCommons@USU Library Faculty & Staff Publications Libraries 12-2011 Characteristics of Serial Title Changes and Recognition of New Serial Works: Theoretical and Practical Implications
AMIA 2005 Symposium Proceedings Page - 166
 Two DL-based Methods for Auditing Medical Terminological Systems Ronald Cornet MSc, Ameen Abu-Hanna PhD Dept. of Medical Informatics, Academic Medical Center, University of Amsterdam Amsterdam, The Netherlands
A FRAMEWORK FOR CLINICAL DECISION SUPPORT IN INTERNAL MEDICINE A PRELIMINARY VIEW Kopecky D 1, Adlassnig K-P 1
 A FRAMEWORK FOR CLINICAL DECISION SUPPORT IN INTERNAL MEDICINE A PRELIMINARY VIEW Kopecky D 1, Adlassnig K-P 1 Abstract MedFrame provides a medical institution with a set of software tools for developing
The Exploration by Means of Repertory Grids of Semantic Differences Among Names for Office Documents.
 Syracuse University SURFACE School of Information Studies: Faculty Scholarship School of Information Studies (ischool) 1-1-1992 The Exploration by Means of Repertory Grids of Semantic Differences Among
AN ANALYSIS ON VALIDITY AND RELIABILITY OF TEST ITEMS IN PRE-NATIONAL EXAMINATION TEST SMPN 14 PONTIANAK
 AN ANALYSIS ON VALIDITY AND RELIABILITY OF TEST ITEMS IN PRE-NATIONAL EXAMINATION TEST SMPN 14 PONTIANAK Hanny Pradana, Gatot Sutapa, Luwandi Suhartono Sarjana Degree of English Language Education, Teacher
Core Competencies for Peer Workers in Behavioral Health Services
 BRINGING RECOVERY SUPPORTS TO SCALE Technical Assistance Center Strategy (BRSS TACS) Core Competencies for Peer Workers in Behavioral Health Services OVERVIEW In 2015, SAMHSA led an effort to identify
Artificial Intelligence For Homeopathic Remedy Selection
 Artificial Intelligence For Homeopathic Remedy Selection A. R. Pawar, amrut.pawar@yahoo.co.in, S. N. Kini, snkini@gmail.com, M. R. More mangeshmore88@gmail.com Department of Computer Science and Engineering,
Analyzing the Semantics of Patient Data to Rank Records of Literature Retrieval
 Proceedings of the Workshop on Natural Language Processing in the Biomedical Domain, Philadelphia, July 2002, pp. 69-76. Association for Computational Linguistics. Analyzing the Semantics of Patient Data
A Cue Imputation Bayesian Model of Information Aggregation
 A Cue Imputation Bayesian Model of Information Aggregation Jennifer S. Trueblood, George Kachergis, and John K. Kruschke {jstruebl, gkacherg, kruschke}@indiana.edu Cognitive Science Program, 819 Eigenmann,
The Common Priors Assumption: A comment on Bargaining and the Nature of War
 The Common Priors Assumption: A comment on Bargaining and the Nature of War Mark Fey Kristopher W. Ramsay June 10, 2005 Abstract In a recent article in the JCR, Smith and Stam (2004) call into question
PDRF About Propensity Weighting emma in Australia Adam Hodgson & Andrey Ponomarev Ipsos Connect Australia
 1. Introduction It is not news for the research industry that over time, we have to face lower response rates from consumer surveys (Cook, 2000, Holbrook, 2008). It is not infrequent these days, especially
Description of components in tailored testing
 Behavior Research Methods & Instrumentation 1977. Vol. 9 (2).153-157 Description of components in tailored testing WAYNE M. PATIENCE University ofmissouri, Columbia, Missouri 65201 The major purpose of
Reviewing the TIMSS Advanced 2015 Achievement Item Statistics
 CHAPTER 11 Reviewing the TIMSS Advanced 2015 Achievement Item Statistics Pierre Foy Michael O. Martin Ina V.S. Mullis Liqun Yin Kerry Cotter Jenny Liu The TIMSS & PIRLS conducted a review of a range of
Assignment 4: True or Quasi-Experiment
 Assignment 4: True or Quasi-Experiment Objectives: After completing this assignment, you will be able to Evaluate when you must use an experiment to answer a research question Develop statistical hypotheses
Recognizing Ambiguity
 Recognizing Ambiguity How Lack of Information Scares Us Mark Clements Columbia University I. Abstract In this paper, I will examine two different approaches to an experimental decision problem posed by
APPROVAL SHEET. Uncertainty in Semantic Web. Doctor of Philosophy, 2005
 APPROVAL SHEET Title of Dissertation: BayesOWL: A Probabilistic Framework for Uncertainty in Semantic Web Name of Candidate: Zhongli Ding Doctor of Philosophy, 2005 Dissertation and Abstract Approved:
Status of Empirical Research in Software Engineering
 Status of Empirical Research in Software Engineering Andreas Höfer, Walter F. Tichy Fakultät für Informatik, Universität Karlsruhe, Am Fasanengarten 5, 76131 Karlsruhe, Germany {ahoefer tichy}@ipd.uni-karlsruhe.de
Multiple Act criterion:
 Common Features of Trait Theories Generality and Stability of Traits: Trait theorists all use consistencies in an individual s behavior and explain why persons respond in different ways to the same stimulus