(C) Jamalludin Ab Rahman
|
|
|
- Prosper Hicks
- 5 years ago
- Views:
Transcription
1 SPSS Note The GLM Multivariate procedure is based on the General Linear Model procedure, in which factors and covariates are assumed to have a linear relationship to the dependent variable. Factors. Categorical predictors should be selected as factors in the model. Each level of a factor can have a different linear effect on the value of the dependent variable. Fixed effects factors are generally thought of as variables whose values of interest are all represented in the data file. Random effects factors are variables whose values in the data file can be considered a random sample from a larger population of values. They are useful for explaining excess variability in the dependent variable. Covariates. Scale predictors should be selected as covariates in the model. Within combinations of factor levels (or cells), values of covariates are assumed to be linearly correlated with values of the dependent variables. Interactions. By default, the GLM Univariate procedure produces a model with all factorial interactions, which means that each combination of factor levels can have a different linear effect on the dependent variable. Additionally, you may specify factor covariate interactions, if you believe that the linear relationship between a covariate and the dependent variable changes for different levels of a factor. For the purposes of testing hypotheses concerning parameter estimates, the GLM Multivariate procedure assumes: 1. The values of errors are independent of each other across observations and the independent variables in the model. Good study design generally avoids violation of this assumption. 2. The covariance of dependent variables is constant across cells. This can be particularly important when there are unequal cell sizes; that is, different numbers of observations across factor level combinations. 3. Across the dependent variables, the errors have a multivariate normal distribution with a mean of 0. (C) Jamalludin Ab Rahman 1
2 (C) Jamalludin Ab Rahman 2
3 (C) Jamalludin Ab Rahman 3
4 As part of the initial treatment for myocardial infarction (MI, or "heart attack"), a thrombolytic drug is usually administered to help clear the patient's arteries before surgery*. Three of the available drugs are alteplase, reteplase, and streptokinase. Alteplase and reteplase are newer, more expensive drugs, and a regional health care system wants to determine whether they are cost effective enough to adopt in place of streptokinase. One of the benefits of thrombolytic drugs is that surgery generally proceeds more smoothly, resulting in a shorter recovery period. If the newer drugs are effective, then patients given those drugs should have shorter lengths of stay in the hospital. Hopefully, the shorter lengths of stay will help to make up for the greater initial cost of the newer drugs. The data file patlos_sample.sav, contains the treatment records of a sample of patients who received thrombolytics during treatment for MI. This hypothetical data file contains the treatment records of a sample of patients who received thrombolytics during treatment for myocardial infarction (MI, or "heart attack"). Each case corresponds to a separate patient and records many variables related to their hospital stay. * PTCA = percutaneous transluminal coronary angioplasty, CABG = coronary artery bypass grafting (Which is better? (C) Jamalludin Ab Rahman 4
5 5
")
6 1. Please open patlos_sample.sav 2. Click Analyze > General Linear Model > Multivariate (C) Jamalludin Ab Rahman 6
 box 5.")
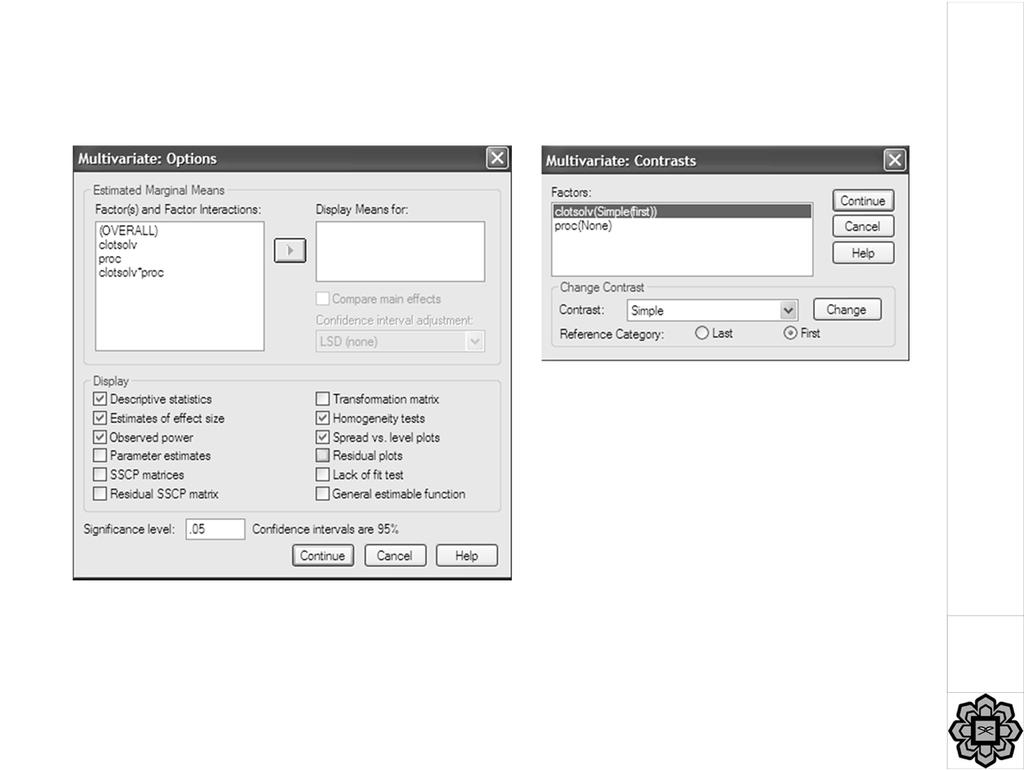
7 3. Transfer Length of stay & Treatment costs to Dependent Variables box 4. Transfer Clot dissolving drugs & Surgical treatment to Fixed Factor(s) box 5. Then click Contrasts button (C) Jamalludin Ab Rahman 7

8 We would like to create a indicator variable for thrombolytic drugs (clotsolv) but not to the surgery (proc). 6. Select clotsolv, choose Simple Contrast & put Reference Category as First, click Change Leave proc as None because we don t want to compare CABG to PTCA 7. Click Continue 8. Then click Options button 9. Check Descriptive statistics, Estimates of effect size, Observed power, Homogeneity tests & Spread vs. level plot 10. Click Continue 11. And finally OK button to see the result (C) Jamalludin Ab Rahman 8
9 Check the Between Subjects Factors table. Is the sample size correct? Observe what will be compared in the analysis. (C) Jamalludin Ab Rahman 9
10 MANOVA and MANCOVA assume that for each group (each cell in the factor design matrix) the covariance matrix is similar. Box's M tests this assumption. We want M not to be significant in order to conclude there is insufficient evidence that the covariance matrices differ. Here M is significant, so we have violated an assumption. That is, the length of stay & cost differ in their covariance matrices. Note, however, that the F test is quite robust even when there are departures from this assumption. (C) Jamalludin Ab Rahman 10
11 This table answers, Is each effect significant? The multivariate simultaneously tests each factor effect on the dependent groups. The multivariate formula for F is based not only on the sum of squares between and within groups, as in ANOVA, but also on the sum of crossproducts that is, it takes covariance into account as well as group means. The statistics: 1. Pillai's trace, also called Pillai Bartlett trace is a positive valued statistic. Increasing values of the statistic indicate effects that contribute more to the model.there is evidence that Pillai's trace is more robust than the other statistics to violations of model assumptions (Olson, 1974). 2. Wilks' Lambda is a positive valued statistic that ranges from 0 to 1. Decreasing values of the statistic indicate effects that contribute more to the model. Usually for more than 2 dependents. 3. Hotelling's trace is the sum of the eigenvalues of the test matrix. It is a positive valued statistic for which increasing values indicate effects that contribute more to the model. Hotelling's trace is always larger than Pillai's trace, but when the eigenvalues of the test matrix are small, these two statistics will be nearly equal. This indicates that the effect probably does not contribute much to the model. Usually use this statistics for 2 dependents model. 4. Roy's largest root is the largest eigenvalue of the test matrix. Thus, it is a positive valued statistic for which increasing values indicate effects that contribute more to the model. Roy's largest root is always less than or equal to Hotelling's trace. When these two statistics are equal, the effect is predominantly associated with just one of the dependent variables, there is a strong correlation between the dependent variables, or the effect does not contribute much to the model. How to interpret the result? The significance values of the main effects, CLOTSOLV and PROC, are less than 0.05, indicating that the effects contribute to the model. By contrast, their interaction effect does not contribute to the model. However, though CLOTSOLV does contribute to the model, since the value of Pillai's trace is close to Hotelling's trace, it doesn't contribute very much. A more straightforward way to see this is to look at partial eta squared. Eta squared is the proportion of the total variability in the dependent variable accounted for by the variation in the independent variable. The partial eta squared statistic reports the "practical" significance of each term, based upon the "ratio" of the variation accounted for by the effect to the sum of the variation accounted for by the effect and the variation left to error. Partial eta reports effect size (meaningfulness). Larger values of partial eta squared indicate a greater amount of variation accounted for by the model effect, to a maximum of 1. Psychometric borderline is 0.14 (max is 1). Since partial eta squared is very small (<0.14) for CLOTSOLV, it does not contribute very much to the model. By comparison, partial eta squared for PROC is quite large, which is to be expected. The surgical procedure a patient must undergo for MI treatment is going to have a much greater effect on the length of their hospital stay and final costs than the type of thrombolytic they receive. Looking at our initial objective of the analysis, it is enough for the multivariate tests to show that CLOTSOLV is significant, which means that the effect of at least one of the drugs is different from the others. The contrast results will show you where the differences are. (C) Jamalludin Ab Rahman 11
12 This table answers this question, Is the model significant for each dependent? The "corrected model" effect reflects the variation in the dependent attributed to other effects (except the intercept) in the model, after corrected by the mean. It is possible to have one or more significant univariate test on an effect without multivariate test to be significant & vice versa. (C) Jamalludin Ab Rahman 12
13 Level 2 vs. Level 1 (Reteplase vs. Streptokinase) The contrast estimates show that, on average, patients given reteplase spend fewer days in the hospital and incur almost 600 dollars more in treatment costs than patients given streptokinase. Since the significance value for Length of stay is less than 0.05, you can conclude this difference is not due to chance. But the significance value for Treatment costs is greater than 0.10, so this difference may be entirely due to chance variation. Level 3 vs. Level 1 (Alteplase vs. Streptokinase) The contrast estimates show that, on average, patients given alteplase spend about half a day less in the hospital and incur slightly over 700 dollars more in treatment costs. Since the significance value for Length of stay is less than 0.05, you can conclude this difference is not due to chance. The significance value for Treatment costs is greater than 0.10, so this difference may be entirely due to chance variation. Conclusion: The contrast results show that alteplase and reteplase seem to reduce patient length of stay. Moreover, the reduction is enough to equalize the treatment costs, or at least bring the difference within the random variation. Thus, the model suggests that alteplase and reteplase should be used in place of streptokinase. However, before adopting this plan, you should check some tests of the model assumptions. (C) Jamalludin Ab Rahman 13
14 Box's M tests the null hypothesis that the observed covariance matrices of the dependent variables are equal across groups. The significance value of the test is less than 0.05, suggesting that the assumptions are not met, and thus the model results are suspect. However please be reminded that F test is quite robust for the deviation from this assumption. It is sensitive to large data files, meaning that when there are a large number of cases, it can detect even small departures from homogeneity. Moreover, it can be sensitive to departures from the assumption of normality. As an additional check of the diagonals of the covariance matrices, look at Levene's tests. Levene s Test Equality of Variances tests equality of the error variances across the cells defined by the combination of factor levels. The significance value for Length of stay is greater than 0.10, so there is no reason to believe that the equal variances assumption is violated for this variable. However, the significance value for the test of Treatment costs is less than 0.05, indicating that the equal variances assumption is violated for this variable. Like Box's M, Levene's test can be sensitive to large data files, so look at the spread vs. level plot for Treatment costs for visual confirmation. (C) Jamalludin Ab Rahman 14

15 The spread versus level plot is a scatterplot of the cell means and standard deviations. It provides a visual test of the equal variances assumption, with the added benefit of helping you to assess whether violations of the assumption are due to a relationship between the cell means and standard deviations. (C) Jamalludin Ab Rahman 15
16 This plot agrees with the result of Levene's test, that the equal variances assumption is violated for Treatment costs. There is also a clear positive relationship in the scatterplot, showing that as the cell mean increases, so does the variability. This relationship suggests a possible solution to the problem. Since Treatment costs is a positive valued variable, you could propose that the error term has a multiplicative, rather than additive, effect on cost. Instead of modeling Treatment costs, you will analyze Log cost. Now could you please run the similar test but this time using Log cost rather than Treatment costs. (C) Jamalludin Ab Rahman 16
17 Replace cost with lncost. (C) Jamalludin Ab Rahman 17
18 18
19 19
20 20
21 (C) Jamalludin Ab Rahman 21
22 The results for Log cost are slightly different from those for Treatment costs. The significance values for both contrasts are less than 0.05, suggesting that the differences in costs between the newer drugs and streptokinase are not due to chance. The contrast estimate for the difference between reteplase and streptokinase is Since you are looking at differences in logtransformed cost, this means that the ratio of costs is e = That is, the ratio of the costs incurred by patients given reteplase is approximately 2.19 % higher than the costs incurred by patients given streptokinase. If the typical MI patient incurs 25,000 to 35,000 dollars in treatment costs, that means reteplase patients incur, roughly, an extra 550 to 770 dollars in costs. The contrast estimate for the difference between alteplase and streptokinase is Since you are looking at differences in log transformed cost, this means that the ratio of costs is e = That is, the ratio of the costs incurred by patients given alteplase is approximately 2.43 % higher than the costs incurred by patients given streptokinase. If the typical MI patient incurs 25,000 to 35,000 dollars in treatment costs, that means alteplase patients incur, roughly, an extra 600 to 860 dollars in costs. These contrast results show that while alteplase and reteplase do seem to reduce patient length of stay, the reduction is not enough to equalize the treatment costs. Thus, determining whether alteplase and reteplase should be used in place of streptokinase will require further study of the cost of these drugs versus their effectiveness at increasing the success of surgery. (C) Jamalludin Ab Rahman 22
23 23
24 24
Tutorial 3: MANOVA. Pekka Malo 30E00500 Quantitative Empirical Research Spring 2016
 Tutorial 3: Pekka Malo 30E00500 Quantitative Empirical Research Spring 2016 Step 1: Research design Adequacy of sample size Choice of dependent variables Choice of independent variables (treatment effects)
Profile Analysis. Intro and Assumptions Psy 524 Andrew Ainsworth
 Profile Analysis Intro and Assumptions Psy 524 Andrew Ainsworth Profile Analysis Profile analysis is the repeated measures extension of MANOVA where a set of DVs are commensurate (on the same scale). Profile
1. You want to find out what factors predict achievement in English. Develop a model that
 Questions and answers for Chapter 10 1. You want to find out what factors predict achievement in English. Develop a model that you think can explain this. As usual many alternative predictors are possible
One-Way Independent ANOVA
 One-Way Independent ANOVA Analysis of Variance (ANOVA) is a common and robust statistical test that you can use to compare the mean scores collected from different conditions or groups in an experiment.
isc ove ring i Statistics sing SPSS
 isc ove ring i Statistics sing SPSS S E C O N D! E D I T I O N (and sex, drugs and rock V roll) A N D Y F I E L D Publications London o Thousand Oaks New Delhi CONTENTS Preface How To Use This Book Acknowledgements
The SAGE Encyclopedia of Educational Research, Measurement, and Evaluation Multivariate Analysis of Variance
 The SAGE Encyclopedia of Educational Research, Measurement, Multivariate Analysis of Variance Contributors: David W. Stockburger Edited by: Bruce B. Frey Book Title: Chapter Title: "Multivariate Analysis
Overview of Lecture. Survey Methods & Design in Psychology. Correlational statistics vs tests of differences between groups
 Survey Methods & Design in Psychology Lecture 10 ANOVA (2007) Lecturer: James Neill Overview of Lecture Testing mean differences ANOVA models Interactions Follow-up tests Effect sizes Parametric Tests
Small Group Presentations
 Admin Assignment 1 due next Tuesday at 3pm in the Psychology course centre. Matrix Quiz during the first hour of next lecture. Assignment 2 due 13 May at 10am. I will upload and distribute these at the
Repeated Measures ANOVA and Mixed Model ANOVA. Comparing more than two measurements of the same or matched participants
 Repeated Measures ANOVA and Mixed Model ANOVA Comparing more than two measurements of the same or matched participants Data files Fatigue.sav MentalRotation.sav AttachAndSleep.sav Attitude.sav Homework:
Two-Way Independent ANOVA
 Two-Way Independent ANOVA Analysis of Variance (ANOVA) a common and robust statistical test that you can use to compare the mean scores collected from different conditions or groups in an experiment. There
Advanced ANOVA Procedures
 Advanced ANOVA Procedures Session Lecture Outline:. An example. An example. Two-way ANOVA. An example. Two-way Repeated Measures ANOVA. MANOVA. ANalysis of Co-Variance (): an ANOVA procedure whereby the
Applications. DSC 410/510 Multivariate Statistical Methods. Discriminating Two Groups. What is Discriminant Analysis
 DSC 4/5 Multivariate Statistical Methods Applications DSC 4/5 Multivariate Statistical Methods Discriminant Analysis Identify the group to which an object or case (e.g. person, firm, product) belongs:
Daniel Boduszek University of Huddersfield
 Daniel Boduszek University of Huddersfield d.boduszek@hud.ac.uk Introduction to Multiple Regression (MR) Types of MR Assumptions of MR SPSS procedure of MR Example based on prison data Interpretation of
Examining differences between two sets of scores
 6 Examining differences between two sets of scores In this chapter you will learn about tests which tell us if there is a statistically significant difference between two sets of scores. In so doing you
Using SPSS for Correlation
 Using SPSS for Correlation This tutorial will show you how to use SPSS version 12.0 to perform bivariate correlations. You will use SPSS to calculate Pearson's r. This tutorial assumes that you have: Downloaded
ANOVA in SPSS (Practical)
") ANOVA in SPSS (Practical) Analysis of Variance practical In this practical we will investigate how we model the influence of a categorical predictor on a continuous response. Centre for Multilevel Modelling
ANOVA in SPSS (Practical) Analysis of Variance practical In this practical we will investigate how we model the influence of a categorical predictor on a continuous response. Centre for Multilevel Modelling
BIOL 458 BIOMETRY Lab 7 Multi-Factor ANOVA
 BIOL 458 BIOMETRY Lab 7 Multi-Factor ANOVA PART 1: Introduction to Factorial ANOVA ingle factor or One - Way Analysis of Variance can be used to test the null hypothesis that k or more treatment or group
Two-Way Independent Samples ANOVA with SPSS
 Two-Way Independent Samples ANOVA with SPSS Obtain the file ANOVA.SAV from my SPSS Data page. The data are those that appear in Table 17-3 of Howell s Fundamental statistics for the behavioral sciences
CHAPTER VI RESEARCH METHODOLOGY
 CHAPTER VI RESEARCH METHODOLOGY 6.1 Research Design Research is an organized, systematic, data based, critical, objective, scientific inquiry or investigation into a specific problem, undertaken with the
MULTIPLE LINEAR REGRESSION 24.1 INTRODUCTION AND OBJECTIVES OBJECTIVES
 24 MULTIPLE LINEAR REGRESSION 24.1 INTRODUCTION AND OBJECTIVES In the previous chapter, simple linear regression was used when you have one independent variable and one dependent variable. This chapter
Linear Regression in SAS
 1 Suppose we wish to examine factors that predict patient s hemoglobin levels. Simulated data for six patients is used throughout this tutorial. data hgb_data; input id age race $ bmi hgb; cards; 21 25
Stat Wk 9: Hypothesis Tests and Analysis
 Stat 342 - Wk 9: Hypothesis Tests and Analysis Crash course on ANOVA, proc glm Stat 342 Notes. Week 9 Page 1 / 57 Crash Course: ANOVA AnOVa stands for Analysis Of Variance. Sometimes it s called ANOVA,
HANDOUTS FOR BST 660 ARE AVAILABLE in ACROBAT PDF FORMAT AT:
 Applied Multivariate Analysis BST 660 T. Mark Beasley, Ph.D. Associate Professor, Department of Biostatistics RPHB 309-E E-Mail: mbeasley@uab.edu Voice:(205) 975-4957 Website: http://www.soph.uab.edu/statgenetics/people/beasley/tmbindex.html
Analysis of Variance (ANOVA) Program Transcript
 Program Transcript") Analysis of Variance (ANOVA) Program Transcript DR. JENNIFER ANN MORROW: Welcome to Analysis of Variance. My name is Dr. Jennifer Ann Morrow. In today's demonstration, I'll review with you the definition
Analysis of Variance (ANOVA) Program Transcript DR. JENNIFER ANN MORROW: Welcome to Analysis of Variance. My name is Dr. Jennifer Ann Morrow. In today's demonstration, I'll review with you the definition
Statistical analysis DIANA SAPLACAN 2017 * SLIDES ADAPTED BASED ON LECTURE NOTES BY ALMA LEORA CULEN
 Statistical analysis DIANA SAPLACAN 2017 * SLIDES ADAPTED BASED ON LECTURE NOTES BY ALMA LEORA CULEN Vs. 2 Background 3 There are different types of research methods to study behaviour: Descriptive: observations,
10. LINEAR REGRESSION AND CORRELATION
 1 10. LINEAR REGRESSION AND CORRELATION The contingency table describes an association between two nominal (categorical) variables (e.g., use of supplemental oxygen and mountaineer survival ). We have
Section 6: Analysing Relationships Between Variables
 6. 1 Analysing Relationships Between Variables Section 6: Analysing Relationships Between Variables Choosing a Technique The Crosstabs Procedure The Chi Square Test The Means Procedure The Correlations
Day 11: Measures of Association and ANOVA
 Day 11: Measures of Association and ANOVA Daniel J. Mallinson School of Public Affairs Penn State Harrisburg mallinson@psu.edu PADM-HADM 503 Mallinson Day 11 November 2, 2017 1 / 45 Road map Measures of
CHAPTER TWO REGRESSION
 CHAPTER TWO REGRESSION 2.0 Introduction The second chapter, Regression analysis is an extension of correlation. The aim of the discussion of exercises is to enhance students capability to assess the effect
LAB ASSIGNMENT 4 INFERENCES FOR NUMERICAL DATA. Comparison of Cancer Survival*
 LAB ASSIGNMENT 4 1 INFERENCES FOR NUMERICAL DATA In this lab assignment, you will analyze the data from a study to compare survival times of patients of both genders with different primary cancers. First,
Lessons in biostatistics
 Lessons in biostatistics The test of independence Mary L. McHugh Department of Nursing, School of Health and Human Services, National University, Aero Court, San Diego, California, USA Corresponding author:
SPSS output for 420 midterm study
 Ψ Psy Midterm Part In lab (5 points total) Your professor decides that he wants to find out how much impact amount of study time has on the first midterm. He randomly assigns students to study for hours,
Readings Assumed knowledge
 3 N = 59 EDUCAT 59 TEACHG 59 CAMP US 59 SOCIAL Analysis of Variance 95% CI Lecture 9 Survey Research & Design in Psychology James Neill, 2012 Readings Assumed knowledge Howell (2010): Ch3 The Normal Distribution
Introduction to Multilevel Models for Longitudinal and Repeated Measures Data
 Introduction to Multilevel Models for Longitudinal and Repeated Measures Data Today s Class: Features of longitudinal data Features of longitudinal models What can MLM do for you? What to expect in this
EPS 625 INTERMEDIATE STATISTICS TWO-WAY ANOVA IN-CLASS EXAMPLE (FLEXIBILITY)
") EPS 625 INTERMEDIATE STATISTICS TO-AY ANOVA IN-CLASS EXAMPLE (FLEXIBILITY) A researcher conducts a study to evaluate the effects of the length of an exercise program on the flexibility of female and male
EPS 625 INTERMEDIATE STATISTICS TO-AY ANOVA IN-CLASS EXAMPLE (FLEXIBILITY) A researcher conducts a study to evaluate the effects of the length of an exercise program on the flexibility of female and male
ANALYSIS OF VARIANCE (ANOVA): TESTING DIFFERENCES INVOLVING THREE OR MORE MEANS
: TESTING DIFFERENCES INVOLVING THREE OR MORE MEANS") ANALYSIS OF VARIANCE (ANOVA): TESTING DIFFERENCES INVOLVING THREE OR MORE MEANS REVIEW Testing hypothesis using the difference between two means: One-sample t-test Independent-samples t-test Dependent/Paired-samples
ANALYSIS OF VARIANCE (ANOVA): TESTING DIFFERENCES INVOLVING THREE OR MORE MEANS REVIEW Testing hypothesis using the difference between two means: One-sample t-test Independent-samples t-test Dependent/Paired-samples
C.3 Repeated Measures ANOVA
 C. Repeated Measures ANOVA A study was conducted to find the effect of yoga on lowering the total serum cholesterol level in newly diagnosed patients of hypercholesterolemia. Thirty patients were selected
List of Figures. List of Tables. Preface to the Second Edition. Preface to the First Edition
 List of Figures List of Tables Preface to the Second Edition Preface to the First Edition xv xxv xxix xxxi 1 What Is R? 1 1.1 Introduction to R................................ 1 1.2 Downloading and Installing
Introduction to Multilevel Models for Longitudinal and Repeated Measures Data
 Introduction to Multilevel Models for Longitudinal and Repeated Measures Data Today s Class: Features of longitudinal data Features of longitudinal models What can MLM do for you? What to expect in this
Supplementary Online Content
 Supplementary Online Content Leibowitz M, Karpati T, Cohen-Stavi CJ, et al. Association between achieved low-density lipoprotein levels and major adverse cardiac events in patients with stable ischemic
Table of Contents. Plots. Essential Statistics for Nursing Research 1/12/2017
 Essential Statistics for Nursing Research Kristen Carlin, MPH Seattle Nursing Research Workshop January 30, 2017 Table of Contents Plots Descriptive statistics Sample size/power Correlations Hypothesis
12/30/2017. PSY 5102: Advanced Statistics for Psychological and Behavioral Research 2
 PSY 5102: Advanced Statistics for Psychological and Behavioral Research 2 Selecting a statistical test Relationships among major statistical methods General Linear Model and multiple regression Special
Unit 1 Exploring and Understanding Data
 Unit 1 Exploring and Understanding Data Area Principle Bar Chart Boxplot Conditional Distribution Dotplot Empirical Rule Five Number Summary Frequency Distribution Frequency Polygon Histogram Interquartile
USER INSTITUTIONS OF OFFICE WORKERS IN GHANA: INVESTIGATING THE DIFFERENCES ABSTRACT
 USER INSTITUTIONS OF OFFICE WORKERS IN GHANA: INVESTIGATING THE DIFFERENCES Adu, G. Department of Interior Architecture & Furniture Production, Kumasi Polytechnic Kumasi GHANA Adu, S. Department of Wood
Doing Quantitative Research 26E02900, 6 ECTS Lecture 6: Structural Equations Modeling. Olli-Pekka Kauppila Daria Kautto
 Doing Quantitative Research 26E02900, 6 ECTS Lecture 6: Structural Equations Modeling Olli-Pekka Kauppila Daria Kautto Session VI, September 20 2017 Learning objectives 1. Get familiar with the basic idea
Intro to SPSS. Using SPSS through WebFAS
 Intro to SPSS Using SPSS through WebFAS http://www.yorku.ca/computing/students/labs/webfas/ Try it early (make sure it works from your computer) If you need help contact UIT Client Services Voice: 416-736-5800
Assignment #6. Chapter 10: 14, 15 Chapter 11: 14, 18. Due tomorrow Nov. 6 th by 2pm in your TA s homework box
 Assignment #6 Chapter 10: 14, 15 Chapter 11: 14, 18 Due tomorrow Nov. 6 th by 2pm in your TA s homework box Assignment #7 Chapter 12: 18, 24 Chapter 13: 28 Due next Friday Nov. 13 th by 2pm in your TA
Correlation and Regression
 Dublin Institute of Technology ARROW@DIT Books/Book Chapters School of Management 2012-10 Correlation and Regression Donal O'Brien Dublin Institute of Technology, donal.obrien@dit.ie Pamela Sharkey Scott
Principal Components Factor Analysis in the Literature. Stage 1: Define the Research Problem
 Principal Components Factor Analysis in the Literature This problem is taken from the research article: Charles P. Flynn and Suzanne R. Kunkel, "Deprivation, Compensation, and Conceptions of an Afterlife."
MULTIPLE REGRESSION OF CPS DATA
 MULTIPLE REGRESSION OF CPS DATA A further inspection of the relationship between hourly wages and education level can show whether other factors, such as gender and work experience, influence wages. Linear
Data Analysis in Practice-Based Research. Stephen Zyzanski, PhD Department of Family Medicine Case Western Reserve University School of Medicine
 Data Analysis in Practice-Based Research Stephen Zyzanski, PhD Department of Family Medicine Case Western Reserve University School of Medicine Multilevel Data Statistical analyses that fail to recognize
bivariate analysis: The statistical analysis of the relationship between two variables.
 bivariate analysis: The statistical analysis of the relationship between two variables. cell frequency: The number of cases in a cell of a cross-tabulation (contingency table). chi-square (χ 2 ) test for
CHAPTER ONE CORRELATION
 CHAPTER ONE CORRELATION 1.0 Introduction The first chapter focuses on the nature of statistical data of correlation. The aim of the series of exercises is to ensure the students are able to use SPSS to
Chapter 12: Analysis of covariance, ANCOVA
 Chapter 12: Analysis of covariance, ANCOVA Smart Alex s Solutions Task 1 A few years back I was stalked. You d think they could have found someone a bit more interesting to stalk, but apparently times
SPSS output for 420 midterm study
 Ψ Psy Midterm Part In lab (5 points total) Your professor decides that he wants to find out how much impact amount of study time has on the first midterm. He randomly assigns students to study for hours,
Part 8 Logistic Regression
 1 Quantitative Methods for Health Research A Practical Interactive Guide to Epidemiology and Statistics Practical Course in Quantitative Data Handling SPSS (Statistical Package for the Social Sciences)
Comparability of patient-reported health status: multi-country analysis of EQ-5D responses in patients with type 2 diabetes
 Comparability of patient-reported health status: multi-country analysis of EQ-5D responses in patients with type 2 diabetes Joshua A Salomon, Anushka Patel, Bruce Neal, Paul Glasziou, Diederick E. Grobbee,
Supplementary Online Content
 Supplementary Online Content Li S, Chiuve SE, Flint A, et al. Better diet quality and decreased mortality among myocardial infarction survivors. JAMA Intern Med. Published online September 2, 2013. doi:10.1001/jamainternmed.2013.9768.
Pharmacy Clinical Support Technician. Cardiac Sciences Program
 Pharmacy Clinical Support Technician Cardiac Sciences Program Cardiology Patient Medication History This project started with a pharmacy technician in august 2009 The main objective is to get a medication
Analysis of Variance: repeated measures
 Analysis of Variance: repeated measures Tests for comparing three or more groups or conditions: (a) Nonparametric tests: Independent measures: Kruskal-Wallis. Repeated measures: Friedman s. (b) Parametric
MANOVA OVER ANOVA - A BETTER OBJECTIVE IN BIOEQUIVALENCE STUDY
 IJPSR (2013), Vol. 4, Issue 5 (Research Article) Received on 08 January, 2013; received in revised form, 27 February, 2013; accepted, 25 April, 2013 MANOVA OVER ANOVA - A BETTER OBJECTIVE IN BIOEQUIVALENCE
DESCRIPTION: Percentage of patients aged 18 years and older undergoing isolated CABG surgery who received an IMA graft
 Measure #43 (NQF 0134): Coronary Artery Bypass Graft (CABG): Use of Internal Mammary Artery (IMA) in Patients with Isolated CABG Surgery National Quality Strategy Domain: Effective Clinical Care 2017 OPTIONS
Worksheet 6 - Multifactor ANOVA models
 Worksheet 6 - Multifactor ANOVA models Multifactor ANOVA Quinn & Keough (2002) - Chpt 9 Question 1 - Nested ANOVA - one between factor In an unusually detailed preparation for an Environmental Effects
Basic Biostatistics. Chapter 1. Content
 Chapter 1 Basic Biostatistics Jamalludin Ab Rahman MD MPH Department of Community Medicine Kulliyyah of Medicine Content 2 Basic premises variables, level of measurements, probability distribution Descriptive
11/18/2013. Correlational Research. Correlational Designs. Why Use a Correlational Design? CORRELATIONAL RESEARCH STUDIES
 Correlational Research Correlational Designs Correlational research is used to describe the relationship between two or more naturally occurring variables. Is age related to political conservativism? Are
Measures of Effect Size for Comparative Studies: Applications, Interpretations, and Limitations
 Contemporary Educational Psychology 25, 241 286 (2000) doi:10.1006/ceps.2000.1040, available online at http://www.idealibrary.com on Measures of Effect Size for Comparative Studies: Applications, Interpretations,
STAT 503X Case Study 1: Restaurant Tipping
 STAT 503X Case Study 1: Restaurant Tipping 1 Description Food server s tips in restaurants may be influenced by many factors including the nature of the restaurant, size of the party, table locations in
Statistics Guide. Prepared by: Amanda J. Rockinson- Szapkiw, Ed.D.
 This guide contains a summary of the statistical terms and procedures. This guide can be used as a reference for course work and the dissertation process. However, it is recommended that you refer to statistical
Link between effectiveness and cost data Costing was conducted prospectively on the same patient sample as that used in the effectiveness analysis.
 Heparin after percutaneous intervention (HAPI): a prospective multicenter randomized trial of three heparin regimens after successful coronary intervention Rabah M, Mason D, Muller D W, Hundley R, Kugelmass
Analysis of Covariance (ANCOVA)
") Analysis of Covariance (ANCOVA) Some background ANOVA can be extended to include one or more continuous variables that predict the outcome (or dependent variable). Continuous variables such as these, that
Analysis of Covariance (ANCOVA) Some background ANOVA can be extended to include one or more continuous variables that predict the outcome (or dependent variable). Continuous variables such as these, that
f WILEY ANOVA and ANCOVA A GLM Approach Second Edition ANDREW RUTHERFORD Staffordshire, United Kingdom Keele University School of Psychology
 ANOVA and ANCOVA A GLM Approach Second Edition ANDREW RUTHERFORD Keele University School of Psychology Staffordshire, United Kingdom f WILEY A JOHN WILEY & SONS, INC., PUBLICATION Contents Acknowledgments
PSY 216: Elementary Statistics Exam 4
 Name: PSY 16: Elementary Statistics Exam 4 This exam consists of multiple-choice questions and essay / problem questions. For each multiple-choice question, circle the one letter that corresponds to the
Balloon angioplasty versus bypass grafting in the era of coronary stenting Ekstein S, Elami A, Merin G, Gotsman M S, Lotan C
 Balloon angioplasty versus bypass grafting in the era of coronary stenting Ekstein S, Elami A, Merin G, Gotsman M S, Lotan C Record Status This is a critical abstract of an economic evaluation that meets
Chapter 13: Factorial ANOVA
 Chapter 13: Factorial ANOVA Smart Alex s Solutions Task 1 People s musical tastes tend to change as they get older. My parents, for example, after years of listening to relatively cool music when I was
7 Statistical Issues that Researchers Shouldn t Worry (So Much) About
 About") 7 Statistical Issues that Researchers Shouldn t Worry (So Much) About By Karen Grace-Martin Founder & President About the Author Karen Grace-Martin is the founder and president of The Analysis Factor.
7 Statistical Issues that Researchers Shouldn t Worry (So Much) About By Karen Grace-Martin Founder & President About the Author Karen Grace-Martin is the founder and president of The Analysis Factor.
1. Family context. a) Positive Disengaged
 Positive Disengaged") Online Supplementary Materials for Emotion manuscript 015-197 Emotions and Concerns: Situational Evidence for their Systematic Co-Occurrence. by Jozefien De Leersnyder, Peter Koval, Peter Kuppens, & Batja
Online Supplementary Materials for Emotion manuscript 015-197 Emotions and Concerns: Situational Evidence for their Systematic Co-Occurrence. by Jozefien De Leersnyder, Peter Koval, Peter Kuppens, & Batja
Statistics as a Tool. A set of tools for collecting, organizing, presenting and analyzing numerical facts or observations.
 Statistics as a Tool A set of tools for collecting, organizing, presenting and analyzing numerical facts or observations. Descriptive Statistics Numerical facts or observations that are organized describe
THE UNIVERSITY OF SUSSEX. BSc Second Year Examination DISCOVERING STATISTICS SAMPLE PAPER INSTRUCTIONS
 C8552 THE UNIVERSITY OF SUSSEX BSc Second Year Examination DISCOVERING STATISTICS SAMPLE PAPER INSTRUCTIONS Do not, under any circumstances, remove the question paper, used or unused, from the examination
Lec 02: Estimation & Hypothesis Testing in Animal Ecology
 Lec 02: Estimation & Hypothesis Testing in Animal Ecology Parameter Estimation from Samples Samples We typically observe systems incompletely, i.e., we sample according to a designed protocol. We then
MHSPHP Metrics Forum. Diabetes.
 MHSPHP Metrics Forum Diabetes Judith.rosen.1.ctr@us.af.mil Overview Methodology of the HEDIS metrics What is the future of LDL metrics? How does the action list differ from the metrics FAQs 2 Diabetes
Investigating the robustness of the nonparametric Levene test with more than two groups
 Psicológica (2014), 35, 361-383. Investigating the robustness of the nonparametric Levene test with more than two groups David W. Nordstokke * and S. Mitchell Colp University of Calgary, Canada Testing
CHAPTER OBJECTIVES - STUDENTS SHOULD BE ABLE TO:
 3 Chapter 8 Introducing Inferential Statistics CHAPTER OBJECTIVES - STUDENTS SHOULD BE ABLE TO: Explain the difference between descriptive and inferential statistics. Define the central limit theorem and
EXERCISE: HOW TO DO POWER CALCULATIONS IN OPTIMAL DESIGN SOFTWARE
 ...... EXERCISE: HOW TO DO POWER CALCULATIONS IN OPTIMAL DESIGN SOFTWARE TABLE OF CONTENTS 73TKey Vocabulary37T... 1 73TIntroduction37T... 73TUsing the Optimal Design Software37T... 73TEstimating Sample
investigate. educate. inform.
 investigate. educate. inform. Research Design What drives your research design? The battle between Qualitative and Quantitative is over Think before you leap What SHOULD drive your research design. Advanced
RESULTS. Chapter INTRODUCTION
 8.1 Chapter 8 RESULTS 8.1 INTRODUCTION The previous chapter provided a theoretical discussion of the research and statistical methodology. This chapter focuses on the interpretation and discussion of the
Appendix. I. Map of former Car Doctors site. Soil for the greenhouse study was collected in the area indicated by the arrow.
 Appendix I. Map of former Car Doctors site. Soil for the greenhouse study was collected in the area indicated by the arrow. 73 II. Photo of former Car Doctors site. Site, facing Burlington Drive, before
Type of intervention Diagnosis. Economic study type Cost-effectiveness analysis.
 The utility and potential cost-effectiveness of stress myocardial perfusion thallium SPECT imaging in hospitalized patients with chest pain and normal or non-diagnostic electrocardiogram Ben-Gal T, Zafrir
Ecological Statistics
 A Primer of Ecological Statistics Second Edition Nicholas J. Gotelli University of Vermont Aaron M. Ellison Harvard Forest Sinauer Associates, Inc. Publishers Sunderland, Massachusetts U.S.A. Brief Contents
Confidence Intervals On Subsets May Be Misleading
 Journal of Modern Applied Statistical Methods Volume 3 Issue 2 Article 2 11-1-2004 Confidence Intervals On Subsets May Be Misleading Juliet Popper Shaffer University of California, Berkeley, shaffer@stat.berkeley.edu
Analysis of Variance (ANOVA)
") Research Methods and Ethics in Psychology Week 4 Analysis of Variance (ANOVA) One Way Independent Groups ANOVA Brief revision of some important concepts To introduce the concept of familywise error rate.
Research Methods and Ethics in Psychology Week 4 Analysis of Variance (ANOVA) One Way Independent Groups ANOVA Brief revision of some important concepts To introduce the concept of familywise error rate.
CRITERIA FOR USE. A GRAPHICAL EXPLANATION OF BI-VARIATE (2 VARIABLE) REGRESSION ANALYSISSys
 REGRESSION ANALYSISSys") Multiple Regression Analysis 1 CRITERIA FOR USE Multiple regression analysis is used to test the effects of n independent (predictor) variables on a single dependent (criterion) variable. Regression tests
Multiple Regression Analysis 1 CRITERIA FOR USE Multiple regression analysis is used to test the effects of n independent (predictor) variables on a single dependent (criterion) variable. Regression tests
Department of Allergy-Pneumonology, Penteli Children s Hospital, Palaia Penteli, Greece
 International Pediatrics Volume 2009, Article ID 952042, 6 pages doi:10.1155/2009/952042 Clinical Study Logistic Regression and Linear Discriminant Analyses in Evaluating Factors Associated with Asthma
MAKING THE NSQIP PARTICIPANT USE DATA FILE (PUF) WORK FOR YOU
 WORK FOR YOU") MAKING THE NSQIP PARTICIPANT USE DATA FILE (PUF) WORK FOR YOU Hani Tamim, PhD Clinical Research Institute Department of Internal Medicine American University of Beirut Medical Center Beirut - Lebanon Participant
MAKING THE NSQIP PARTICIPANT USE DATA FILE (PUF) WORK FOR YOU Hani Tamim, PhD Clinical Research Institute Department of Internal Medicine American University of Beirut Medical Center Beirut - Lebanon Participant
Business Research Methods. Introduction to Data Analysis
 Business Research Methods Introduction to Data Analysis Data Analysis Process STAGES OF DATA ANALYSIS EDITING CODING DATA ENTRY ERROR CHECKING AND VERIFICATION DATA ANALYSIS Introduction Preparation of
Chapter 14: More Powerful Statistical Methods
 Chapter 14: More Powerful Statistical Methods Most questions will be on correlation and regression analysis, but I would like you to know just basically what cluster analysis, factor analysis, and conjoint
Chapter 13: Introduction to Analysis of Variance
 Chapter 13: Introduction to Analysis of Variance Although the t-test is a useful statistic, it is limited to testing hypotheses about two conditions or levels. The analysis of variance (ANOVA) was developed
Daniel Boduszek University of Huddersfield
 Daniel Boduszek University of Huddersfield d.boduszek@hud.ac.uk Introduction to Multinominal Logistic Regression SPSS procedure of MLR Example based on prison data Interpretation of SPSS output Presenting
11/4/2010. represent the average scores for BOTH A1 & A2 at each level of B. The red lines. are graphing B Main Effects. Red line is the Average A1
 Factorial ANOVA Chapter 12 Research Designs Between Between (2 between subjects factors) Mixed Design (1 between, 1 within subjects factor) Within Within (2 within subjects factors) The purpose of this