Meeting-5 MEASUREMENT 8-1
|
|
|
- Emma Harrington
- 5 years ago
- Views:
Transcription

1 Meeting-5 MEASUREMENT 8-1
2 Measurement Measurement Process: 1. Selecting observable empirical events 2. Using numbers or symbols to represent aspects of the events being measured 3. Applying a mapping rule to connect the observation to the symbol 8-2
3 8-3 Characteristics of Measurement
4 What is Measured? Objects: Things of ordinary experience: furniture, people, cars Some things not concrete: genes, attitudes etc. Properties: characteristics of objects: Physical : weight, height and posture Psycological : attitudes, behaviour, intelligence Social : leadership ability, status 8-4

5 Levels of Measurement Nominal Ordinal interval Ratio Classification Classification Order Classification Order Classification Order Distance Distance Natural Origin 8-5
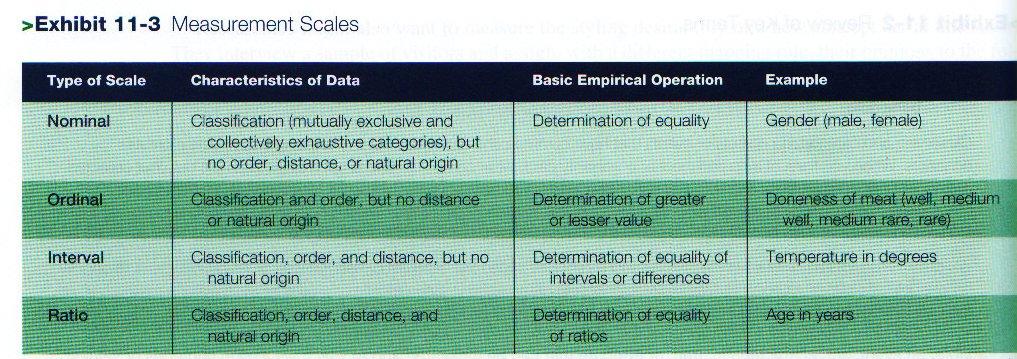
6 8-6 Measurement Scales
7 Data Types Order Distance Origin Nominal none none none Ordinal yes unequal none Interval yes equal or none unequal Ratio yes equal zero 8-7
8 Sources of Measurement Differences Respondent: employee status, ethnic, social class, fatigue, boredom, hunger, impatience, anxiety Situational factors: the existence of other person Measurer or researcher: rewording, reordering questions, incorrect coding, careless tabulation, faulty statistical calculation Data collection instrument: the use of complex words and syntax, ambigious meaning, mechanical defects 8-8
9 The Criteria for Evaluating a Measurement Validity: a characteristic of measurement concerned with the extent that a test measures what we actually wish to measure. Reliability: a characteristic of measurement concerned with accuracy, precision and consistency. Practicality is concerned with a wide range of factors of economy, convenience, and interpretability. 8-9

10 8-10 Understanding Validity and Reliability
11 Validity and Reliability Test Questionnaire Test Validity Realibility Correlation Analysis (Pearson): Total Variable & Each Variable If Sig. < 0,05 valid If Sig. > 0,05 not valid delete the question Realibility Statistics If Cronbach s Alpha > 0,6 the instrument is reliable. If Cronbach s Alpha < 0,6 the instrument is not reliable 8-11
12 Validity and Reliability Test 1. Validity Test Using SPSS software to do the correlation analysis Pearson Correlation. Find correlation between each question in the questionnaire and its total value. See the significance value (Sig.): If Sig. < 0.05 the question/instrument is valid If Sig. > 0.05 the question/instrument in not valid deleted/removed 8-12
13 Validity and Reliability Test Example of validity test: Open SPSS program Open the data: validity&reliability1_original.sav First Step: Making new variable Total 1. Choose Transform Compute variable 2. Type the new name variable. Total in the Target variable box. 3. Entry and suming all variables (from question1 to question15) to Numeric Expression box. 4. Click OK. 5. Then in SPSS - Data View, you can see the new variable (Total) with its values. 8-13
14 Validity and Reliability Test Second Step: Correlation Analysis 1.Open the data: validity&reliability1_original.sav 2.Choose Analyze Correlation Bivariate 3.Enter all variables to the Variables box 4.Click Pearson s box in the Correlation Coefficient box and click Flag significant correlation s box. 5.Click OK 6.The output as seen below: 8-14
15 8-15 Validity and Reliability Test
16 Validity and Reliability Test 2. Realibility Test Using SPSS software to find Realibility Statistics Cronbach s Alpha. If Cronbach s Alpha > 0.6 the instrument is reliable If Cronbach s Alpha < 0.6 not reliable Example of realibility test: The steps: 1.Open SPSS program 2.Open the data: validity&reliability1_original.sav 3.Choose Analyze Scale Reliability Analysis box 4.Entry all variables to the Items box 5.Click Statistics Reliability Analysis box. 6.Click Scale if item deleted in the Decriptive for box 7.Click Continue 8.Click OK. 8-16
17 Validity and Reliability Test The output of reliability analysis: 8-17
11-3. Learning Objectives
 11-1 Measurement Learning Objectives 11-3 Understand... The distinction between measuring objects, properties, and indicants of properties. The similarities and differences between the four scale types
Daniel Boduszek University of Huddersfield
 Daniel Boduszek University of Huddersfield d.boduszek@hud.ac.uk Introduction to Correlation SPSS procedure for Pearson r Interpretation of SPSS output Presenting results Partial Correlation Correlation
Ch. 11 Measurement. Paul I-Hai Lin, Professor A Core Course for M.S. Technology Purdue University Fort Wayne Campus
 TECH 646 Analysis of Research in Industry and Technology PART III The Sources and Collection of data: Measurement, Measurement Scales, Questionnaires & Instruments, Sampling Ch. 11 Measurement Lecture
Ch. 11 Measurement. Measurement
 TECH 646 Analysis of Research in Industry and Technology PART III The Sources and Collection of data: Measurement, Measurement Scales, Questionnaires & Instruments, Sampling Ch. 11 Measurement Lecture
TESTING AND MEASUREMENT. MERVE DENİZCİ NAZLIGÜL, M.S. Çankaya University
 TESTING AND MEASUREMENT MERVE DENİZCİ NAZLIGÜL, M.S. Çankaya University RELIABILITY ANALYSIS Reliability can take on values of 0 to 1.0, inclusive. There are various ways of testing reliability: 1. test-retest
Measurement and Scales
 Topic 5 Measurement and Scales LEARNING OUTCOMES By the end of this topic, you should be able to: 1. Define conceptualisation and operationalisation ; 2. Explain the four types of scales used in research;
CHAPTER 4 THE QUESTIONNAIRE DESIGN /SOLUTION DESIGN. This chapter contains explanations that become a basic knowledge to create a good
 CHAPTER 4 THE QUESTIONNAIRE DESIGN /SOLUTION DESIGN This chapter contains explanations that become a basic knowledge to create a good questionnaire which is able to meet its objective. Just like the thesis
32.5. percent of U.S. manufacturers experiencing unfair currency manipulation in the trade practices of other countries.
 TECH 646 Analysis of Research in Industry and Technology PART III The Sources and Collection of data: Measurement, Measurement Scales, Questionnaires & Instruments, Sampling Ch. 11 Measurement Lecture
02a: Test-Retest and Parallel Forms Reliability
 1 02a: Test-Retest and Parallel Forms Reliability Quantitative Variables 1. Classic Test Theory (CTT) 2. Correlation for Test-retest (or Parallel Forms): Stability and Equivalence for Quantitative Measures
On the purpose of testing:
 Why Evaluation & Assessment is Important Feedback to students Feedback to teachers Information to parents Information for selection and certification Information for accountability Incentives to increase
Data Analysis. A cross-tabulation allows the researcher to see the relationships between the values of two different variables
 Data Analysis A cross-tabulation allows the researcher to see the relationships between the values of two different variables One variable is typically the dependent variable (such as attitude toward the
CHAPTER ONE CORRELATION
 CHAPTER ONE CORRELATION 1.0 Introduction The first chapter focuses on the nature of statistical data of correlation. The aim of the series of exercises is to ensure the students are able to use SPSS to
Business Research Methods. Introduction to Data Analysis
 Business Research Methods Introduction to Data Analysis Data Analysis Process STAGES OF DATA ANALYSIS EDITING CODING DATA ENTRY ERROR CHECKING AND VERIFICATION DATA ANALYSIS Introduction Preparation of
ADMS Sampling Technique and Survey Studies
 Principles of Measurement Measurement As a way of understanding, evaluating, and differentiating characteristics Provides a mechanism to achieve precision in this understanding, the extent or quality As
Intro to SPSS. Using SPSS through WebFAS
 Intro to SPSS Using SPSS through WebFAS http://www.yorku.ca/computing/students/labs/webfas/ Try it early (make sure it works from your computer) If you need help contact UIT Client Services Voice: 416-736-5800
Daniel Boduszek University of Huddersfield
 Daniel Boduszek University of Huddersfield d.boduszek@hud.ac.uk Introduction to Multiple Regression (MR) Types of MR Assumptions of MR SPSS procedure of MR Example based on prison data Interpretation of
POL 242Y Final Test (Take Home) Name
 Name") POL 242Y Final Test (Take Home) Name_ Due August 6, 2008 The take-home final test should be returned in the classroom (FE 36) by the end of the class on August 6. Students who fail to submit the final
POL 242Y Final Test (Take Home) Name_ Due August 6, 2008 The take-home final test should be returned in the classroom (FE 36) by the end of the class on August 6. Students who fail to submit the final
Data Analysis for Project. Tutorial
 Data Analysis for Project Tutorial Research Model Topic 2 Remanufactured Products Environmental Concern Attitude towards Recycling H2 (+) H1 (+) Subjective Norm Perceived Moral Obligation Convenience Perceived
DATA is derived either through. Self-Report Observation Measurement
 Data Management DATA is derived either through Self-Report Observation Measurement QUESTION ANSWER DATA DATA may be from Structured or Unstructured questions? Quantitative or Qualitative? Numerical or
Daniel Boduszek University of Huddersfield
 Daniel Boduszek University of Huddersfield d.boduszek@hud.ac.uk Introduction to Multinominal Logistic Regression SPSS procedure of MLR Example based on prison data Interpretation of SPSS output Presenting
PTHP 7101 Research 1 Chapter Assignments
 PTHP 7101 Research 1 Chapter Assignments INSTRUCTIONS: Go over the questions/pointers pertaining to the chapters and turn in a hard copy of your answers at the beginning of class (on the day that it is
Day 11: Measures of Association and ANOVA
 Day 11: Measures of Association and ANOVA Daniel J. Mallinson School of Public Affairs Penn State Harrisburg mallinson@psu.edu PADM-HADM 503 Mallinson Day 11 November 2, 2017 1 / 45 Road map Measures of
EVALUATING AND IMPROVING MULTIPLE CHOICE QUESTIONS
 DePaul University INTRODUCTION TO ITEM ANALYSIS: EVALUATING AND IMPROVING MULTIPLE CHOICE QUESTIONS Ivan Hernandez, PhD OVERVIEW What is Item Analysis? Overview Benefits of Item Analysis Applications Main
Measurement and Scaling Techniques
 Measurement and Scaling Techniques 69 5 Measurement and Scaling Techniques MEASUREMENT IN RESEARCH In our daily life we are said to measure when we use some yardstick to determine weight, height, or some
WELCOME! Lecture 11 Thommy Perlinger
 Quantitative Methods II WELCOME! Lecture 11 Thommy Perlinger Regression based on violated assumptions If any of the assumptions are violated, potential inaccuracies may be present in the estimated regression
Making a psychometric. Dr Benjamin Cowan- Lecture 9
 Making a psychometric Dr Benjamin Cowan- Lecture 9 What this lecture will cover What is a questionnaire? Development of questionnaires Item development Scale options Scale reliability & validity Factor
Using SPSS for Correlation
 Using SPSS for Correlation This tutorial will show you how to use SPSS version 12.0 to perform bivariate correlations. You will use SPSS to calculate Pearson's r. This tutorial assumes that you have: Downloaded
Survey Project Data Analysis Guide
 Survey Project Data Analysis Guide I. Computing Scale Scores. - In the data file that I have given you, I have already done the following. - Reverse scored all of the appropriate items. For: Aggression
Daniel Boduszek University of Huddersfield
 Daniel Boduszek University of Huddersfield d.boduszek@hud.ac.uk Introduction to Logistic Regression SPSS procedure of LR Interpretation of SPSS output Presenting results from LR Logistic regression is
So far. INFOWO Lecture M5 Homogeneity and Reliability. Homogeneity. Homogeneity
 So far INFOWO Lecture M5 Homogeneity and Reliability Peter de Waal Department of Information and Computing Sciences Faculty of Science, Universiteit Utrecht Descriptive statistics Scores and probability
Introduction to SPSS: Defining Variables and Data Entry
 Introduction to SPSS: Defining Variables and Data Entry You will be on this page after SPSS is started Click Cancel Choose variable view by clicking this button Type the name of the variable here Lets
Correlation and Regression
 Dublin Institute of Technology ARROW@DIT Books/Book Chapters School of Management 2012-10 Correlation and Regression Donal O'Brien Dublin Institute of Technology, donal.obrien@dit.ie Pamela Sharkey Scott
Student name: SOCI 420 Advanced Methods of Social Research Fall 2017
 SOCI 420 Advanced Methods of Social Research Fall 2017 EXAM 1 RUBRIC Instructor: Ernesto F. L. Amaral, Assistant Professor, Department of Sociology Date: October 12, 2017 (Thursday) Section 904: 2:20 3:35pm
Bivariate Correlations
 Bivariate Correlations Brawijaya Professional Statistical Analysis BPSA MALANG Jl. Kertoasri 66 Malang (0341) 580342 081 753 3962 Bivariate Correlations The Bivariate Correlations procedure computes the
Chapter 14: More Powerful Statistical Methods
 Chapter 14: More Powerful Statistical Methods Most questions will be on correlation and regression analysis, but I would like you to know just basically what cluster analysis, factor analysis, and conjoint
CHAPTER 3 RESEARCH METHODOLOGY. In this chapter, research design, data collection, sampling frame and analysis
 CHAPTER 3 RESEARCH METHODOLOGY 3.1 Introduction In this chapter, research design, data collection, sampling frame and analysis procedure will be discussed in order to meet the objectives of the study.
Collecting & Making Sense of
 Collecting & Making Sense of Quantitative Data Deborah Eldredge, PhD, RN Director, Quality, Research & Magnet Recognition i Oregon Health & Science University Margo A. Halm, RN, PhD, ACNS-BC, FAHA Director,
 alternate-form reliability The degree to which two or more versions of the same test correlate with one another. In clinical studies in which a given function is going to be tested more than once over
DATA GATHERING. Define : Is a process of collecting data from sample, so as for testing & analyzing before reporting research findings.
 DATA GATHERING Define : Is a process of collecting data from sample, so as for testing & analyzing before reporting research findings. 2012 John Wiley & Sons Ltd. Measurement Measurement: the assignment
Basic SPSS for Postgraduate
 Basic SPSS for Postgraduate Dr. Shamshuritawati Sharif School of Quantitative Science Email : shamshurita@uum.edu.my Office : +6049286336 Mobile :+60194248001 In the process of carrying out the research,
SOME NOTES ON STATISTICAL INTERPRETATION
 1 SOME NOTES ON STATISTICAL INTERPRETATION Below I provide some basic notes on statistical interpretation. These are intended to serve as a resource for the Soci 380 data analysis. The information provided
RELATIONSHIP BETWEEN EMOTIONAL INTELLIGENCE AND ETHICAL COMPETENCE: AN EMPIRICAL STUDY
 International Journal of Management, IT & Engineering Vol. 7 Issue 12, December 2017, ISSN: 2249-0558 Impact Factor: 7.119 Journal Homepage: Double-Blind Peer Reviewed Refereed Open Access International
The Asian Conference on Education & International Development 2015 Official Conference Proceedings. iafor
 Constructing and Validating Behavioral Components Scale of Motivational Goals in Mathematics Nancy Castro, University of Santo Tomas, Philippines Michelle Cruz, University of Santo Tomas, Philippines Maria
Effect of work stress on auditor performance in the financial audit board of the republic of Indonesia representative of North Sulawesi province
 Scientific Research Journal (SCIRJ), Volume V, Issue XII, December 2017 7 Effect of work stress on auditor performance in the financial audit board of the republic of Indonesia representative of North
Analysis and Interpretation of Data Part 1
 Analysis and Interpretation of Data Part 1 DATA ANALYSIS: PRELIMINARY STEPS 1. Editing Field Edit Completeness Legibility Comprehensibility Consistency Uniformity Central Office Edit 2. Coding Specifying
Part 8 Logistic Regression
 1 Quantitative Methods for Health Research A Practical Interactive Guide to Epidemiology and Statistics Practical Course in Quantitative Data Handling SPSS (Statistical Package for the Social Sciences)
CHAPTER VI RESEARCH METHODOLOGY
 CHAPTER VI RESEARCH METHODOLOGY 6.1 Research Design Research is an organized, systematic, data based, critical, objective, scientific inquiry or investigation into a specific problem, undertaken with the
Skala Stress. Putaran 1 Reliability. Case Processing Summary. N % Excluded a 0.0 Total
 Skala Stress Putaran 1 Reliability Case Processing Summary N % Cases Valid Excluded a 0.0 Total a. Listwise deletion based on all variables in the procedure. Reliability Statistics Cronbach's Alpha N of
Prepared by: Assoc. Prof. Dr Bahaman Abu Samah Department of Professional Development and Continuing Education Faculty of Educational Studies
 Prepared by: Assoc. Prof. Dr Bahaman Abu Samah Department of Professional Development and Continuing Education Faculty of Educational Studies Universiti Putra Malaysia Serdang At the end of this session,
FACTORIAL CONSTRUCTION OF A LIKERT SCALE
 FACTORIAL CONSTRUCTION OF A LIKERT SCALE Mukhtar Ahmad Wani (Ph.D. JMI) Lecturer, School Education Department (J&K Govt.) Email: mukhtar137897@st.jmi.ac.in, wanimukhtar913@gmail.com Abstract: The purpose
Title: The Theory of Planned Behavior (TPB) and Texting While Driving Behavior in College Students MS # Manuscript ID GCPI
 and Texting While Driving Behavior in College Students MS # Manuscript ID GCPI") Title: The Theory of Planned Behavior (TPB) and Texting While Driving Behavior in College Students MS # Manuscript ID GCPI-2015-02298 Appendix 1 Role of TPB in changing other behaviors TPB has been applied
Title: The Theory of Planned Behavior (TPB) and Texting While Driving Behavior in College Students MS # Manuscript ID GCPI-2015-02298 Appendix 1 Role of TPB in changing other behaviors TPB has been applied
An Introduction to Research Statistics
 An Introduction to Research Statistics An Introduction to Research Statistics Cris Burgess Statistics are like a lamppost to a drunken man - more for leaning on than illumination David Brent (alias Ricky
Published by: PIONEER RESEARCH & DEVELOPMENT GROUP ( 108
 Stress Coping Strategies By It Professionals In South India V. Sreecharan 1, S. Gautami 2, V. Satish Kumar 3 1,2,3 Department of Management Studies, RIIMS, Tirupati, Chittoor(Dist.), Andhra Pradesh ABSTRACT
Reliability. Scale: Empathy
 /VARIABLES=Empathy1 Empathy2 Empathy3 Empathy4 /STATISTICS=DESCRIPTIVE SCALE Reliability Notes Output Created Comments Input Missing Value Handling Syntax Resources Scale: Empathy Data Active Dataset Filter
Overview of Experimentation
 The Basics of Experimentation Overview of Experiments. IVs & DVs. Operational Definitions. Reliability. Validity. Internal vs. External Validity. Classic Threats to Internal Validity. Lab: FP Overview;
Quantitative Methods in Computing Education Research (A brief overview tips and techniques)
") Quantitative Methods in Computing Education Research (A brief overview tips and techniques) Dr Judy Sheard Senior Lecturer Co-Director, Computing Education Research Group Monash University judy.sheard@monash.edu
Quantitative Methods in Computing Education Research (A brief overview tips and techniques) Dr Judy Sheard Senior Lecturer Co-Director, Computing Education Research Group Monash University judy.sheard@monash.edu
CHAPTER III RESEARCH METHOD. method the major components include: Research Design, Research Site and
 CHAPTER III RESEARCH METHOD This chapter presents the research method and design. In this research method the major components include: Research Design, Research Site and Access, Population and Sample,
The Institute of Chartered Accountants of Sri Lanka
 The Institute of Chartered Accountants of Sri Lanka Postgraduate Diploma in Business Finance and Strategy Quantitative Methods for Business Studies Handout 01: Basic Statistics What is Statistics? Statistics
INTRODUCTION TO STATISTICS SORANA D. BOLBOACĂ
 INTRODUCTION TO STATISTICS SORANA D. BOLBOACĂ OBJECTIVES Definitions Stages of Scientific Knowledge Quantification and Accuracy Types of Medical Data Population and sample Sampling methods DEFINITIONS
Introduction to SPSS S0
 Basic medical statistics for clinical and experimental research Introduction to SPSS S0 Katarzyna Jóźwiak k.jozwiak@nki.nl November 10, 2017 1/55 Introduction SPSS = Statistical Package for the Social
Examining differences between two sets of scores
 6 Examining differences between two sets of scores In this chapter you will learn about tests which tell us if there is a statistically significant difference between two sets of scores. In so doing you
CHAPTER TWO REGRESSION
 CHAPTER TWO REGRESSION 2.0 Introduction The second chapter, Regression analysis is an extension of correlation. The aim of the discussion of exercises is to enhance students capability to assess the effect
Step 3 Tutorial #3: Obtaining equations for scoring new cases in an advanced example with quadratic term
 Step 3 Tutorial #3: Obtaining equations for scoring new cases in an advanced example with quadratic term DemoData = diabetes.lgf, diabetes.dat, data5.dat We begin by opening a saved 3-class latent class
Psychometric Instrument Development
 Psychometric Instrument Development Lecture 6 Survey Research & Design in Psychology James Neill, 2012 Readings: Psychometrics 1. Bryman & Cramer (1997). Concepts and their measurement. [chapter - ereserve]
Module One: What is Statistics? Online Session
 Module One: What is Statistics? Online Session Introduction The purpose of this online workshop is to aid you in better understanding the materials you have read within the class textbook. The goal of
bivariate analysis: The statistical analysis of the relationship between two variables.
 bivariate analysis: The statistical analysis of the relationship between two variables. cell frequency: The number of cases in a cell of a cross-tabulation (contingency table). chi-square (χ 2 ) test for
CHAPTER III METHODOLOGY
 24 CHAPTER III METHODOLOGY This chapter presents the methodology of the study. There are three main sub-titles explained; research design, data collection, and data analysis. 3.1. Research Design The study
The following are questions that students had difficulty with on the first three exams.
 The following are questions that students had difficulty with on the first three exams. Exam 1 1. A measure has construct validity if it: a) really measures what it is supposed to measure b) appears, on
Selecting the Right Data Analysis Technique
 Selecting the Right Data Analysis Technique Levels of Measurement Nominal Ordinal Interval Ratio Discrete Continuous Continuous Variable Borgatta and Bohrnstedt state that "the most of central constructs
The Nature of Probability and Statistics
 Chapter 1 The Nature of Probability and Statistics Chapter 1 Overview Introduction 1-1 Descriptive and Inferential Statistics 1-2 Variables and Types of Data 1-3 Data Collection & Sampling Techniques 1-4
Psychology Research Methods Lab Session Week 10. Survey Design. Due at the Start of Lab: Lab Assignment 3. Rationale for Today s Lab Session
 Psychology Research Methods Lab Session Week 10 Due at the Start of Lab: Lab Assignment 3 Rationale for Today s Lab Session Survey Design This tutorial supplements your lecture notes on Measurement by
Effect of Sample Size on Correlation and Regression Coefficients
 Effect of Sample Size on Correlation and Regression Coefficients Swati Gupta 1 Research Scholar, Department of Education, Aligarh Muslim University, India Dr. Mamun Ali Naji Qasem 2 Faculty of Education,
Simple Linear Regression One Categorical Independent Variable with Several Categories
 Simple Linear Regression One Categorical Independent Variable with Several Categories Does ethnicity influence total GCSE score? We ve learned that variables with just two categories are called binary
Tech Talk: Using the Lafayette ESS Report Generator
 Raymond Nelson Included in LXSoftware is a fully featured manual score sheet that can be used with any validated comparison question test format. Included in the manual score sheet utility of LXSoftware
Designing a Questionnaire
 Designing a Questionnaire What Makes a Good Questionnaire? As a rule of thumb, never to attempt to design a questionnaire! A questionnaire is very easy to design, but a good questionnaire is virtually
CHAPTER 3. Research Methodology
 CHAPTER 3 Research Methodology The research studies the youth s attitude towards Thai cuisine in Dongguan City, China in 2013. Researcher has selected survey methodology by operating under procedures as
UNDERSTANDING QUANTITATIVE RESEARCH
 UNIT I Structure UNDERSTANDING QUANTITATIVE RESEARCH Kiran Prasad Understanding Quantitative Research 1.1 Introduction 1.2 Objectives 1.3 Foregrounding Quantitative Research 1.4 Concepts and Constructs
POLS 5377 Scope & Method of Political Science. Correlation within SPSS. Key Questions: How to compute and interpret the following measures in SPSS
 POLS 5377 Scope & Method of Political Science Week 15 Measure of Association - 2 Correlation within SPSS 2 Key Questions: How to compute and interpret the following measures in SPSS Ordinal Variable Gamma
SPSS Correlation/Regression
 SPSS Correlation/Regression Experimental Psychology Lab Session Week 6 10/02/13 (or 10/03/13) Due at the Start of Lab: Lab 3 Rationale for Today s Lab Session This tutorial is designed to ensure that you
A COMPARISON BETWEEN MULTIVARIATE AND BIVARIATE ANALYSIS USED IN MARKETING RESEARCH
 Bulletin of the Transilvania University of Braşov Vol. 5 (54) No. 1-2012 Series V: Economic Sciences A COMPARISON BETWEEN MULTIVARIATE AND BIVARIATE ANALYSIS USED IN MARKETING RESEARCH Cristinel CONSTANTIN
Validity. Ch. 5: Validity. Griggs v. Duke Power - 2. Griggs v. Duke Power (1971)
") Ch. 5: Validity Validity History Griggs v. Duke Power Ricci vs. DeStefano Defining Validity Aspects of Validity Face Validity Content Validity Criterion Validity Construct Validity Reliability vs. Validity
Ch. 5: Validity Validity History Griggs v. Duke Power Ricci vs. DeStefano Defining Validity Aspects of Validity Face Validity Content Validity Criterion Validity Construct Validity Reliability vs. Validity
CHAPTER 3 METHODOLOGY
 CHAPTER 3 METHODOLOGY The research will be conducted in several steps below: Figure 3.1 Research Frameworks 3.1 Literature Study Involve conceptual literature from book related to Integrated Marketing
Selecting and Designing Instruments: Item Development, Reliability, and Validity John D. Hathcoat, PhD & Courtney B. Sanders, MS, Nikole Gregg, BA
 Selecting and Designing Instruments: Item Development, Reliability, and Validity John D. Hathcoat, PhD & Courtney B. Sanders, MS, Nikole Gregg, BA This document consists of an introduction to the selection
HPS301 Exam Notes- Contents
 HPS301 Exam Notes- Contents Week 1 Research Design: What characterises different approaches 1 Experimental Design 1 Key Features 1 Criteria for establishing causality 2 Validity Internal Validity 2 Threats
Types of variables. Introduction
 Types of variables Introduction When carrying out a research, a researcher is supposed to understand everything about variables and be able to talk about them. A variable can be defined as any unit which
DIFFERENTIATE: ACCURACY AND PRECISION
 DIFFERENTIATE: ACCURACY AND PRECISION Can you hit the bull's-eye? Three targets with three arrows each to shoot. How do they compare? Both accurate and precise Precise but not accurate Neither accurate
Before we get started:
 Before we get started: http://arievaluation.org/projects-3/ AEA 2018 R-Commander 1 Antonio Olmos Kai Schramm Priyalathta Govindasamy Antonio.Olmos@du.edu AntonioOlmos@aumhc.org AEA 2018 R-Commander 2 Plan
commentary Time is a jailer: what do alpha and its alternatives tell us about reliability?
 commentary Time is a jailer: what do alpha and its alternatives tell us about reliability? Rik Psychologists do not have it easy, but the article by Peters Maastricht University (2014) paves the way for
A Study on the Impact of Extrovert Personality Traits on the It Working Professionals Stock Investment Decision
 A Study on the Impact of Extrovert Personality Traits on the It Working Professionals Stock Investment Decision Mr. R. Gowri Shankar Research Scholar Bharathiar University Coimabatore. Dr. Tomy K. Kallarakal.
A Good Safety Culture Correlates with Increased Positive and Decreased Negative Outcomes: A Questionnaire Based Study at Finnish Defense Forces
 Proceedings of the Human Factors and Ergonomics Society 2016 Annual Meeting 1627 A Good Safety Culture Correlates with Increased Positive and Decreased Negative Outcomes: A Questionnaire Based Study at
Asian American Midlife Women s Sleep Related Symptoms and Physical Activity
 Asian American Midlife Women s Sleep Related Symptoms and Physical Activity A Secondary Analysis Yaelim Lee, PhD, MSN, RN 1 ; Helen Teng, MSN, CRNP 2 ; Ok Kyung Ham, PhD, MCHES, RN 3 ; Youjeong Kang, PhD,
What are Indexes and Scales
 ISSUES Exam results are on the web No student handbook, will have discussion questions soon Next exam will be easier but want everyone to study hard Biggest problem was question on Research Design Next
MULTIPLE LINEAR REGRESSION 24.1 INTRODUCTION AND OBJECTIVES OBJECTIVES
 24 MULTIPLE LINEAR REGRESSION 24.1 INTRODUCTION AND OBJECTIVES In the previous chapter, simple linear regression was used when you have one independent variable and one dependent variable. This chapter
RESULTS. Chapter INTRODUCTION
 8.1 Chapter 8 RESULTS 8.1 INTRODUCTION The previous chapter provided a theoretical discussion of the research and statistical methodology. This chapter focuses on the interpretation and discussion of the
MEASUREMENT, SCALING AND SAMPLING. Variables
 MEASUREMENT, SCALING AND SAMPLING Variables Variables can be explained in different ways: Variable simply denotes a characteristic, item, or the dimensions of the concept that increases or decreases over
1. Below is the output of a 2 (gender) x 3(music type) completely between subjects factorial ANOVA on stress ratings
 x 3(music type) completely between subjects factorial ANOVA on stress ratings") SPSS 3 Practice Interpretation questions A researcher is interested in the effects of music on stress levels, and how stress levels might be related to anxiety and life satisfaction. 1. Below is the output
SPSS 3 Practice Interpretation questions A researcher is interested in the effects of music on stress levels, and how stress levels might be related to anxiety and life satisfaction. 1. Below is the output
Section 6: Analysing Relationships Between Variables
 6. 1 Analysing Relationships Between Variables Section 6: Analysing Relationships Between Variables Choosing a Technique The Crosstabs Procedure The Chi Square Test The Means Procedure The Correlations
Reliability and Validity checks S-005
 Reliability and Validity checks S-005 Checking on reliability of the data we collect Compare over time (test-retest) Item analysis Internal consistency Inter-rater agreement Compare over time Test-Retest
International Journal of Scientific & Engineering Research, Volume 4, Issue 12, December ISSN
 International Journal of Scientific & Engineering Research, Volume 4, Issue 12, December-2013 86 Spiritual Maturity and Leadership: A study on leaders of different age bars. -Mr. Amit Kumar 1 Asst. Prof.
Survey research (Lecture 1)
") Summary & Conclusion Lecture 10 Survey Research & Design in Psychology James Neill, 2015 Creative Commons Attribution 4.0 Overview 1. Survey research 2. Survey design 3. Descriptives & graphing 4. Correlation
Summary & Conclusion Lecture 10 Survey Research & Design in Psychology James Neill, 2015 Creative Commons Attribution 4.0 Overview 1. Survey research 2. Survey design 3. Descriptives & graphing 4. Correlation