Ordinary Least Squares Regression
|
|
|
- Junior Russell
- 5 years ago
- Views:
Transcription


1 Ordinary Least Squares Regression March 2013 Nancy Burns - University of Michigan
2 From description to cause Group Sample Size Mean Health Status Standard Error Hospital 7, No Hospital 90, Source: Angrist and Pischke, 2009.
3 How would we interpret this comparison of means? Is this a description? Is a hospital stay a cause of health status? What are the problems with thinking about hospital stay as a cause?
4 Selection Bias When is a treatment not a cause? When is a treatment a cause? When are we in between these two?
5 Thought exercise about selection bias Working in groups, design a study to investigate the effects of primary school class size on student achievement. What are the things you have to do and to take into account for the results of your study to provide information about whether class size affects student achievement? What are the mistakes one could make?
6 Ordinary Least Squares (OLS) Regression Dependent variable, Y, what we re explaining. Explanatory variable or independent variable or treatment, X. This is the variable we d like to think of as a cause, the variable we are using to explain Y. When X goes up by a certain amount, on average, what happens to Y? Does it go up, go down, or not change, and by how much? And how certain are we about this effect?

7 What does this look like? When X goes up, what happens to Y? Source: Shively, 2005
8 Source: Berry and Sanders, Scatterplots
9 We want a way to describe this relationship. When we use Ordinary least squares, we are describing the relationship this way: The predicted value of Y = a + bx
10 The Regression Line The predicted value of Y = intercept + slope * X Y is the dependent variable X is the explanatory variable

11 The Regression Line Source: Wonnacott and Wonnacott, 1990.

12 Source: Shively, The Regression Line

13 Source: Scheaffer. Group exercise
14 Some questions for the group exercise When x goes up by one unit, for which of these slides does y go down? If you were drawing a line to describe the points for the graphs where y goes down when x goes up, which would have the steeper slope? For which one would y go down more as x goes up? Three of these have exactly the same coefficient on x. Which three? The three have different correlations between x and y; which is higher, and which is lower?
15 How do we calculate a and b, the intercept (or constant) and the slope? Minimize the sum of squared residuals. Would use calculus and calculate partial derivatives with respect to a and b.
16 Residual A residual is the difference between our observation, y, and the predicted value of y from our model. We want the difference to be small.

17 Minimizing the Sum of Squared Residuals Source: Shively, 2005.
18 Source: Berry and Sanders, Minimizing the vertical distance
19 We could do the math and calculate the coefficients, but we wouldn t yet have the tools to draw inferences to data we don t have. Without one more tool, all we have is a way to describe our data. Without one more tool, we do not have a way to say how certain we are about that description.
20 Inference Our challenge is that we are not describing a full population. Instead, we are drawing an inference from a sample to describe a population. We need assumptions and tools from probability to allow us to draw these inferences.
21 Inference from Samples The tools from probability and the assumptions we will make allow us to say how certain we are about the estimates we calculate with our sample.
22 We ll estimate the standard errors of our regression coefficients. These standard errors are our measures of the variability of b and a. They are a function of the variability of y and x and of the sample size. For example, when there s little variance in x, we have little certainty about b, and our estimates of the variability of b will be quite large. When our samples are small, our estimate of the variability of our coefficients will be larger.
23 The Value of Small Standard Errors These standard errors describe our estimate of the sampling distribution of b and a. They give us the ability to describe certainty around b. They let us say how certain we are about the estimates we ve calculated from our sample.
24 When the absolute value of t for our coefficient is greater than or equal to the critical value of t at a particular level of confidence, we have a measure of how certain we are about the coefficient at hand. Conventionally, we use a 95% confidence interval, or a.05 level of statistical significance. Often, we also report the level of statistical significance.
25 Scatterplot of height and earnings Source: Gelman and Nolan, 2002.
26 Drawing Inferences Predicting Earnings, Ordinary Least Squares Variable Coefficient S.E. t Height Constant N = 1379 R-squared =.09 Source: Gelman and Nolan 2002.
27 Questions to ask On what scales are our variables measured? Are our coefficients statistically significant? Are our coefficients substantively significant? Are there omitted variables that will affect our estimates of the coefficients at hand? Is height a treatment, a cause?
28 A Multivariate Model Predicting Earnings in US Dollars, Ordinary Least Squares Variable Coefficient S.E. t p-value Height in inches Woman Constant N = 1379 R-squared =.13 Source; Gelman and Nolan, 2002.
29 Control variables Bad controls might just as well be the dependent variable. Good controls things we can think of as fixed by the time the value of the dependent variable came to be. Is gender in this model a bad control or a good control? What are strategies for turning a bad control into a good control?
30 Group Exercise Another Multivariate Model Predicting Hours Working, Ordinary Least Squares Regression Women Men Education 4.26*** 1.92*** (.60) (.47) Marriage -0.53* 1.17*** (.25) (.24) Pre-school Children -2.25*** 1.54*** (.33) (.32) School-aged Children *** (.29) (.28) N Adjusted R-Squared Source: Burns, Schlozman, and Verba, * p<.05; ** p<.01; *** p <.001. Controlling for other variables.
31 Group Exercise Working in groups, develop an interpretation of the following table. Use these questions as your guide: On what scales are our variables measured? Are our coefficients statistically significant? Are our coefficients substantively significant? Are there omitted variables alternative explanations -- that will affect our estimates of the coefficients at hand? Are the controls good controls? Are these explanatory variables treatments? Describe your conclusions and your certainty about your conclusions. What do you wish were on this table that isn t here?
32 Predicting Free Time Women Men Marriage -0.86*** -.32*** Pre-school -2.29*** -.53*** Children School-aged -0.88*** -.53*** Children Source: Burns, Schlozman, and Verba Controlling for education, activity in high school, race or ethnicity, age, hours on the job, job level, and citizenship *Coefficient significant at <.05. **Coefficient significant at <.01. ***Coefficient significant at <.001.
33 Predicting Level of Education (US, from GSS data) Parents Education.379*.415* (.028) (.015) Rural -.029* -.029* (.013) (.013) Age * (.019) (.011) Age * (.015) (.011) Age * (.018) (.011) Age *.042* (.019) (.012) Age 66 and older -.074*.058* (.020) (.010) Female (.010) (.007) R-squared N
34 Interpreting coefficients Ask the questions: Compared to what? Good control? Treatments? Alternative explanations?
35 Omitted Variables Number of hours of TV watching per day B (s.e.) t p value Education (.22) Age.14 (.21) Age over (.19) Adjusted R-squared.06 N 2494
36 Omitted variables Number of hours of TV watching per day B (s.e.) t p value Education (.21) Age -.15 (.20) Age over (.19) In the workforce (.11) Adjusted R-squared.13 N 2494
37 Know your data Know how it was collected. Know what the data look like. Know how the variables are distributed. Know what the residuals look like. Explore the difference between observations your model predicts well and cases your model doesn t predict well.
38 Aim for Resilience Push your model. Are there other reasonable specifications, reasonable sets of ways to implement your theoretical ideas? Do your results hold up when implemented in these other ways? Know the limits of your model which coefficients are sturdy, and which are not?

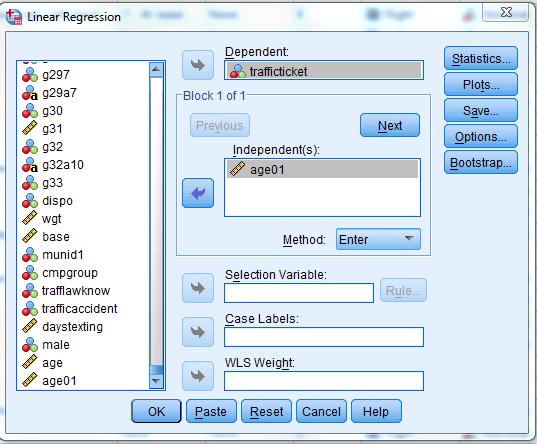
39 Performing a Regression in SPSS The OLS regression option is found under the Analyze / Regression / Linear menu.
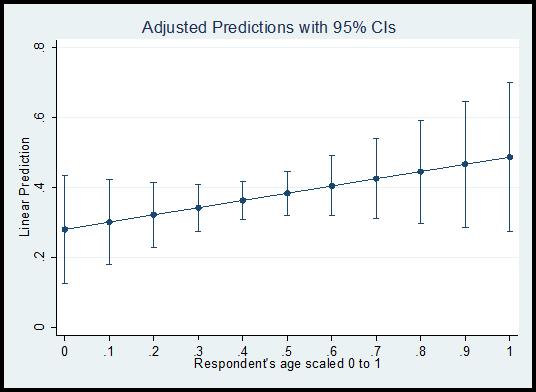
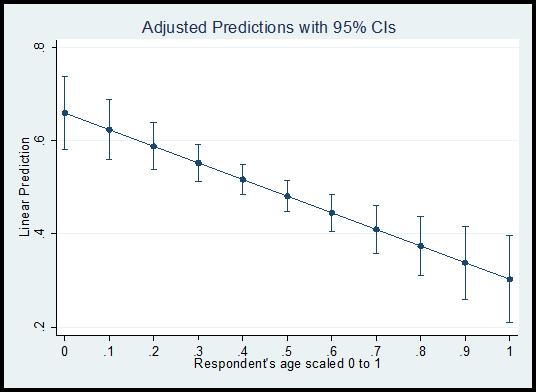
40 Exercise The 2011 Omnibus includes several items about traffic laws and driving in Qatar. One question asks whether respondents have received a traffic ticket in the past 12 months (variable name=trafficticket. This variable was recoded from variable b2a in your codebook). What factors might explain whether someone received a traffic ticket in the past 12 months? One possibility is the age of the individual. What hypothesis can we generate regarding the relationship between an individual s age and whether they received a traffic ticket? Run a regression to test this hypothesis.
41
42 Note: The age variable was created by subtracting respondents answer to question F14 in the codebook (what year were you born) from 2011 (the year the survey was conducted).
43
44
45 Other tools we have in Regression Analysis
46 Source: Hanushek and Jackson Intercept shifts
47 An example of an intercept shift Is gender a factor in receiving a traffic ticket in the past 12 months in Qatar? Are men more likely to receive a traffic ticket than women?
48 How would we do this? Our independent variable, male, has two values: 1 = Respondent is male 0 = Respondent is female
49 Our dependent variable, trafficticket: 0 = No 1= Yes
50 Comparing receiving a traffic ticket in the past 12 months by gender.

51 Regression Menu option: Analyze / Regression / Linear
52 What Is Going On Behind the Point- And-Click Commands?
53 SPSS Printouts from Regression Model
54 SPSS Printouts from Regression Model
55 SPSS Printouts from Regression Model
56 Predicting Receiving a Traffic Ticket (Ordinary Least Squares) Coefficient Male.131* (.032) Constant.366* (.028) Adjusted R-squared:.012, N=1234 * p<.05. Receiving a Traffic Ticket ranges from 0 (No) to 1 (Yes). Standard errors in parentheses. Source: SESRI Omnibus Survey, 2011.
57 Making sense of our results How do we interpret the coefficient? How is this an intercept shift? How do we interpret the other numbers on the table? Why do we include those? The n The adjusted R-squared The definition of the asterisk How can we improve this model?
58 Adding an interaction
59 Source: Hanushek and Jackson Slope Shifts

60 Interacting Age & Gender We have created a variable in your dataset called agemale. To construct it, we multiplied the age variable by the male variable. agemale = age01 * male.

61 Models with interaction terms should include the interaction term AND the original variables that were used to generate the interaction term. In the above SPSS dialogue, we are specifying a regression model where receiving a traffic ticket is our dependent variable, and gender, age, and the interaction term, agemale, are our independent variables.
62
63
64 Interpreting Interaction Terms How do we interpret the interaction terms? What does a slope shift mean? Do our data have enough information to carry the more elaborate specification? What are the hints?
65 Women Men
66 Receiving a Traffic Ticket in Qatar in the Past 12 months as a Function of Age and Gender (1) (2) (3) (4) Age -.231* -.261*.207 (.036) (.074) (.180) Male.131*.143*.380* (.032) (.032) (.089) Age*Male -.563* (.197) Constant.567*.366*.473*.280* (.036) (.028) (.041) (.079) Adjusted R-Squared N * p<.05 The dependent variable, receiving a traffic ticket, is coded as follows: 1=received ticket; 0=did not receive ticket. Source: SESRI 2011 Omnibus
67 Class Exercise
68
69
70 For further reading Wonnacott and Wonnacott Introductory Statistics for Business and Economics, 4 th edition. John Wiley and Sons. For those comfortable with more mathematics: William H. Greene Econometric Analysis, 6 th edition. Prentice-Hall.
Political Science 15, Winter 2014 Final Review
 Political Science 15, Winter 2014 Final Review The major topics covered in class are listed below. You should also take a look at the readings listed on the class website. Studying Politics Scientifically
Simple Linear Regression One Categorical Independent Variable with Several Categories
 Simple Linear Regression One Categorical Independent Variable with Several Categories Does ethnicity influence total GCSE score? We ve learned that variables with just two categories are called binary
3.2A Least-Squares Regression
 3.2A Least-Squares Regression Linear (straight-line) relationships between two quantitative variables are pretty common and easy to understand. Our instinct when looking at a scatterplot of data is to
MULTIPLE LINEAR REGRESSION 24.1 INTRODUCTION AND OBJECTIVES OBJECTIVES
 24 MULTIPLE LINEAR REGRESSION 24.1 INTRODUCTION AND OBJECTIVES In the previous chapter, simple linear regression was used when you have one independent variable and one dependent variable. This chapter
Chapter 1: Exploring Data
 Chapter 1: Exploring Data Key Vocabulary:! individual! variable! frequency table! relative frequency table! distribution! pie chart! bar graph! two-way table! marginal distributions! conditional distributions!
A NON-TECHNICAL INTRODUCTION TO REGRESSIONS. David Romer. University of California, Berkeley. January Copyright 2018 by David Romer
 A NON-TECHNICAL INTRODUCTION TO REGRESSIONS David Romer University of California, Berkeley January 2018 Copyright 2018 by David Romer CONTENTS Preface ii I Introduction 1 II Ordinary Least Squares Regression
MULTIPLE OLS REGRESSION RESEARCH QUESTION ONE:
 1 MULTIPLE OLS REGRESSION RESEARCH QUESTION ONE: Predicting State Rates of Robbery per 100K We know that robbery rates vary significantly from state-to-state in the United States. In any given state, we
IAPT: Regression. Regression analyses
 Regression analyses IAPT: Regression Regression is the rather strange name given to a set of methods for predicting one variable from another. The data shown in Table 1 and come from a student project
Chapter 3: Examining Relationships
 Name Date Per Key Vocabulary: response variable explanatory variable independent variable dependent variable scatterplot positive association negative association linear correlation r-value regression
MODEL I: DRINK REGRESSED ON GPA & MALE, WITHOUT CENTERING
 Interpreting Interaction Effects; Interaction Effects and Centering Richard Williams, University of Notre Dame, https://www3.nd.edu/~rwilliam/ Last revised February 20, 2015 Models with interaction effects
bivariate analysis: The statistical analysis of the relationship between two variables.
 bivariate analysis: The statistical analysis of the relationship between two variables. cell frequency: The number of cases in a cell of a cross-tabulation (contingency table). chi-square (χ 2 ) test for
AP Statistics Practice Test Ch. 3 and Previous
 AP Statistics Practice Test Ch. 3 and Previous Name Date Use the following to answer questions 1 and 2: A researcher measures the height (in feet) and volume of usable lumber (in cubic feet) of 32 cherry
Business Statistics Probability
 Business Statistics The following was provided by Dr. Suzanne Delaney, and is a comprehensive review of Business Statistics. The workshop instructor will provide relevant examples during the Skills Assessment
Chapter 3 CORRELATION AND REGRESSION
 CORRELATION AND REGRESSION TOPIC SLIDE Linear Regression Defined 2 Regression Equation 3 The Slope or b 4 The Y-Intercept or a 5 What Value of the Y-Variable Should be Predicted When r = 0? 7 The Regression
Describe what is meant by a placebo Contrast the double-blind procedure with the single-blind procedure Review the structure for organizing a memo
 Business Statistics The following was provided by Dr. Suzanne Delaney, and is a comprehensive review of Business Statistics. The workshop instructor will provide relevant examples during the Skills Assessment
Section 3.2 Least-Squares Regression
 Section 3.2 Least-Squares Regression Linear relationships between two quantitative variables are pretty common and easy to understand. Correlation measures the direction and strength of these relationships.
Multiple Regression. James H. Steiger. Department of Psychology and Human Development Vanderbilt University
 Multiple Regression James H. Steiger Department of Psychology and Human Development Vanderbilt University James H. Steiger (Vanderbilt University) Multiple Regression 1 / 19 Multiple Regression 1 The Multiple
Still important ideas
 Readings: OpenStax - Chapters 1 13 & Appendix D & E (online) Plous Chapters 17 & 18 - Chapter 17: Social Influences - Chapter 18: Group Judgments and Decisions Still important ideas Contrast the measurement
Carrying out an Empirical Project
 Carrying out an Empirical Project Empirical Analysis & Style Hint Special program: Pre-training 1 Carrying out an Empirical Project 1. Posing a Question 2. Literature Review 3. Data Collection 4. Econometric
CHAPTER ONE CORRELATION
 CHAPTER ONE CORRELATION 1.0 Introduction The first chapter focuses on the nature of statistical data of correlation. The aim of the series of exercises is to ensure the students are able to use SPSS to
2 Assumptions of simple linear regression
 Simple Linear Regression: Reliability of predictions Richard Buxton. 2008. 1 Introduction We often use regression models to make predictions. In Figure?? (a), we ve fitted a model relating a household
Lecture 12: more Chapter 5, Section 3 Relationships between Two Quantitative Variables; Regression
 Lecture 12: more Chapter 5, Section 3 Relationships between Two Quantitative Variables; Regression Equation of Regression Line; Residuals Effect of Explanatory/Response Roles Unusual Observations Sample
APPENDIX N. Summary Statistics: The "Big 5" Statistical Tools for School Counselors
 APPENDIX N Summary Statistics: The "Big 5" Statistical Tools for School Counselors This appendix describes five basic statistical tools school counselors may use in conducting results based evaluation.
Math 075 Activities and Worksheets Book 2:
 Math 075 Activities and Worksheets Book 2: Linear Regression Name: 1 Scatterplots Intro to Correlation Represent two numerical variables on a scatterplot and informally describe how the data points are
Choosing a Significance Test. Student Resource Sheet
 Choosing a Significance Test Student Resource Sheet Choosing Your Test Choosing an appropriate type of significance test is a very important consideration in analyzing data. If an inappropriate test is
Lecture 6B: more Chapter 5, Section 3 Relationships between Two Quantitative Variables; Regression
 Lecture 6B: more Chapter 5, Section 3 Relationships between Two Quantitative Variables; Regression! Equation of Regression Line; Residuals! Effect of Explanatory/Response Roles! Unusual Observations! Sample
WELCOME! Lecture 11 Thommy Perlinger
 Quantitative Methods II WELCOME! Lecture 11 Thommy Perlinger Regression based on violated assumptions If any of the assumptions are violated, potential inaccuracies may be present in the estimated regression
CRITERIA FOR USE. A GRAPHICAL EXPLANATION OF BI-VARIATE (2 VARIABLE) REGRESSION ANALYSISSys
 REGRESSION ANALYSISSys") Multiple Regression Analysis 1 CRITERIA FOR USE Multiple regression analysis is used to test the effects of n independent (predictor) variables on a single dependent (criterion) variable. Regression tests
Multiple Regression Analysis 1 CRITERIA FOR USE Multiple regression analysis is used to test the effects of n independent (predictor) variables on a single dependent (criterion) variable. Regression tests
Correlation and regression
 PG Dip in High Intensity Psychological Interventions Correlation and regression Martin Bland Professor of Health Statistics University of York http://martinbland.co.uk/ Correlation Example: Muscle strength
Chapter Eight: Multivariate Analysis
 Chapter Eight: Multivariate Analysis Up until now, we have covered univariate ( one variable ) analysis and bivariate ( two variables ) analysis. We can also measure the simultaneous effects of two or
A response variable is a variable that. An explanatory variable is a variable that.
 Name:!!!! Date: Scatterplots The most common way to display the relation between two quantitative variable is a scatterplot. Statistical studies often try to show through scatterplots, that changing one
3.2 Least- Squares Regression
 3.2 Least- Squares Regression Linear (straight- line) relationships between two quantitative variables are pretty common and easy to understand. Correlation measures the direction and strength of these
Marno Verbeek Erasmus University, the Netherlands. Cons. Pros
 Marno Verbeek Erasmus University, the Netherlands Using linear regression to establish empirical relationships Linear regression is a powerful tool for estimating the relationship between one variable
Unit 1 Exploring and Understanding Data
 Unit 1 Exploring and Understanding Data Area Principle Bar Chart Boxplot Conditional Distribution Dotplot Empirical Rule Five Number Summary Frequency Distribution Frequency Polygon Histogram Interquartile
STATISTICS 201. Survey: Provide this Info. How familiar are you with these? Survey, continued IMPORTANT NOTE. Regression and ANOVA 9/29/2013
 STATISTICS 201 Survey: Provide this Info Outline for today: Go over syllabus Provide requested information on survey (handed out in class) Brief introduction and hands-on activity Name Major/Program Year
Multiple Linear Regression (Dummy Variable Treatment) CIVL 7012/8012
 CIVL 7012/8012") Multiple Linear Regression (Dummy Variable Treatment) CIVL 7012/8012 2 In Today s Class Recap Single dummy variable Multiple dummy variables Ordinal dummy variables Dummy-dummy interaction Dummy-continuous/discrete
Multiple Linear Regression (Dummy Variable Treatment) CIVL 7012/8012 2 In Today s Class Recap Single dummy variable Multiple dummy variables Ordinal dummy variables Dummy-dummy interaction Dummy-continuous/discrete
Preliminary Report on Simple Statistical Tests (t-tests and bivariate correlations)
") Preliminary Report on Simple Statistical Tests (t-tests and bivariate correlations) After receiving my comments on the preliminary reports of your datasets, the next step for the groups is to complete
Preliminary Report on Simple Statistical Tests (t-tests and bivariate correlations) After receiving my comments on the preliminary reports of your datasets, the next step for the groups is to complete
Variability. After reading this chapter, you should be able to do the following:
 LEARIG OBJECTIVES C H A P T E R 3 Variability After reading this chapter, you should be able to do the following: Explain what the standard deviation measures Compute the variance and the standard deviation
Ec331: Research in Applied Economics Spring term, Panel Data: brief outlines
 Ec331: Research in Applied Economics Spring term, 2014 Panel Data: brief outlines Remaining structure Final Presentations (5%) Fridays, 9-10 in H3.45. 15 mins, 8 slides maximum Wk.6 Labour Supply - Wilfred
11/18/2013. Correlational Research. Correlational Designs. Why Use a Correlational Design? CORRELATIONAL RESEARCH STUDIES
 Correlational Research Correlational Designs Correlational research is used to describe the relationship between two or more naturally occurring variables. Is age related to political conservativism? Are
Readings: Textbook readings: OpenStax - Chapters 1 13 (emphasis on Chapter 12) Online readings: Appendix D, E & F
 Online readings: Appendix D, E & F") Readings: Textbook readings: OpenStax - Chapters 1 13 (emphasis on Chapter 12) Online readings: Appendix D, E & F Plous Chapters 17 & 18 Chapter 17: Social Influences Chapter 18: Group Judgments and Decisions
Readings: Textbook readings: OpenStax - Chapters 1 13 (emphasis on Chapter 12) Online readings: Appendix D, E & F Plous Chapters 17 & 18 Chapter 17: Social Influences Chapter 18: Group Judgments and Decisions
Midterm project due next Wednesday at 2 PM
 Course Business Midterm project due next Wednesday at 2 PM Please submit on CourseWeb Next week s class: Discuss current use of mixed-effects models in the literature Short lecture on effect size & statistical
Chapter Eight: Multivariate Analysis
 Chapter Eight: Multivariate Analysis Up until now, we have covered univariate ( one variable ) analysis and bivariate ( two variables ) analysis. We can also measure the simultaneous effects of two or
10/4/2007 MATH 171 Name: Dr. Lunsford Test Points Possible
 Pledge: 10/4/2007 MATH 171 Name: Dr. Lunsford Test 1 100 Points Possible I. Short Answer and Multiple Choice. (36 points total) 1. Circle all of the items below that are measures of center of a distribution:
NORTH SOUTH UNIVERSITY TUTORIAL 2
 NORTH SOUTH UNIVERSITY TUTORIAL 2 AHMED HOSSAIN,PhD Data Management and Analysis AHMED HOSSAIN,PhD - Data Management and Analysis 1 Correlation Analysis INTRODUCTION In correlation analysis, we estimate
CHAPTER TWO REGRESSION
 CHAPTER TWO REGRESSION 2.0 Introduction The second chapter, Regression analysis is an extension of correlation. The aim of the discussion of exercises is to enhance students capability to assess the effect
7 Statistical Issues that Researchers Shouldn t Worry (So Much) About
 About") 7 Statistical Issues that Researchers Shouldn t Worry (So Much) About By Karen Grace-Martin Founder & President About the Author Karen Grace-Martin is the founder and president of The Analysis Factor.
7 Statistical Issues that Researchers Shouldn t Worry (So Much) About By Karen Grace-Martin Founder & President About the Author Karen Grace-Martin is the founder and president of The Analysis Factor.
Technical Track Session IV Instrumental Variables
 Impact Evaluation Technical Track Session IV Instrumental Variables Christel Vermeersch Beijing, China, 2009 Human Development Human Network Development Network Middle East and North Africa Region World
Lab 4 (M13) Objective: This lab will give you more practice exploring the shape of data, and in particular in breaking the data into two groups.
 Objective: This lab will give you more practice exploring the shape of data, and in particular in breaking the data into two groups.") Lab 4 (M13) Objective: This lab will give you more practice exploring the shape of data, and in particular in breaking the data into two groups. Activity 1 Examining Data From Class Background Download
Lab 4 (M13) Objective: This lab will give you more practice exploring the shape of data, and in particular in breaking the data into two groups. Activity 1 Examining Data From Class Background Download
STAT 135 Introduction to Statistics via Modeling: Midterm II Thursday November 16th, Name:
 STAT 135 Introduction to Statistics via Modeling: Midterm II Thursday November 16th, 2017 Name: 1 1 Short Answer a) For each of these five regression scenarios, name an appropriate visualization (along
Clincial Biostatistics. Regression
 Regression analyses Clincial Biostatistics Regression Regression is the rather strange name given to a set of methods for predicting one variable from another. The data shown in Table 1 and come from a
Eating and Sleeping Habits of Different Countries
 9.2 Analyzing Scatter Plots Now that we know how to draw scatter plots, we need to know how to interpret them. A scatter plot graph can give us lots of important information about how data sets are related
Two-Way Independent ANOVA
 Two-Way Independent ANOVA Analysis of Variance (ANOVA) a common and robust statistical test that you can use to compare the mean scores collected from different conditions or groups in an experiment. There
Regression Equation. November 29, S10.3_3 Regression. Key Concept. Chapter 10 Correlation and Regression. Definitions
 MAT 155 Statistical Analysis Dr. Claude Moore Cape Fear Community College Chapter 10 Correlation and Regression 10 1 Review and Preview 10 2 Correlation 10 3 Regression 10 4 Variation and Prediction Intervals
5 To Invest or not to Invest? That is the Question.
 5 To Invest or not to Invest? That is the Question. Before starting this lab, you should be familiar with these terms: response y (or dependent) and explanatory x (or independent) variables; slope and
Measurement Error 2: Scale Construction (Very Brief Overview) Page 1
 Page 1") Measurement Error 2: Scale Construction (Very Brief Overview) Richard Williams, University of Notre Dame, https://www3.nd.edu/~rwilliam/ Last revised January 22, 2015 This handout draws heavily from Marija
Measurement Error 2: Scale Construction (Very Brief Overview) Richard Williams, University of Notre Dame, https://www3.nd.edu/~rwilliam/ Last revised January 22, 2015 This handout draws heavily from Marija
STATISTICS INFORMED DECISIONS USING DATA
 STATISTICS INFORMED DECISIONS USING DATA Fifth Edition Chapter 4 Describing the Relation between Two Variables 4.1 Scatter Diagrams and Correlation Learning Objectives 1. Draw and interpret scatter diagrams
Simple Linear Regression the model, estimation and testing
 Simple Linear Regression the model, estimation and testing Lecture No. 05 Example 1 A production manager has compared the dexterity test scores of five assembly-line employees with their hourly productivity.
Statistics for Psychology
 Statistics for Psychology SIXTH EDITION CHAPTER 12 Prediction Prediction a major practical application of statistical methods: making predictions make informed (and precise) guesses about such things as
Regression CHAPTER SIXTEEN NOTE TO INSTRUCTORS OUTLINE OF RESOURCES
 CHAPTER SIXTEEN Regression NOTE TO INSTRUCTORS This chapter includes a number of complex concepts that may seem intimidating to students. Encourage students to focus on the big picture through some of
Part 8 Logistic Regression
 1 Quantitative Methods for Health Research A Practical Interactive Guide to Epidemiology and Statistics Practical Course in Quantitative Data Handling SPSS (Statistical Package for the Social Sciences)
The Logic of Data Analysis Using Statistical Techniques M. E. Swisher, 2016
 The Logic of Data Analysis Using Statistical Techniques M. E. Swisher, 2016 This course does not cover how to perform statistical tests on SPSS or any other computer program. There are several courses
Homework #3. SHORT ANSWER. Write the word or phrase that best completes each statement or answers the question.
 Homework #3 Name Due Due on on February Tuesday, Due on February 17th, Sept Friday 28th 17th, Friday SHORT ANSWER. Write the word or phrase that best completes each statement or answers the question. Fill
Regression Analysis II
 Regression Analysis II Lee D. Walker University of South Carolina e-mail: walker23@gwm.sc.edu COURSE OVERVIEW This course focuses on the theory, practice, and application of linear regression. As Agresti
Further Mathematics 2018 CORE: Data analysis Chapter 3 Investigating associations between two variables
 Chapter 3: Investigating associations between two variables Further Mathematics 2018 CORE: Data analysis Chapter 3 Investigating associations between two variables Extract from Study Design Key knowledge
Chapter 7: Correlation
 Chapter 7: Correlation Smart Alex s Solutions Task 1 A student was interested in whether there was a positive relationship between the time spent doing an essay and the mark received. He got 45 of his
The Jumping Dog Quadratic Activity
 Standards: The Jumping Dog Quadratic Activity A2.4.1 Identify the family of function best suited for modeling a given real-world situation. A2.4.3 Using the adapted general symbolic form, draw reasonable
Chapter 3 Review. Name: Class: Date: Multiple Choice Identify the choice that best completes the statement or answers the question.
 Name: Class: Date: Chapter 3 Review Multiple Choice Identify the choice that best completes the statement or answers the question. Scenario 3-1 The height (in feet) and volume (in cubic feet) of usable
(2) In each graph above, calculate the velocity in feet per second that is represented.
 In each graph above, calculate the velocity in feet per second that is represented.") Calculus Week 1 CHALLENGE 1-Velocity Exercise 1: Examine the two graphs below and answer the questions. Suppose each graph represents the position of Abby, our art teacher. (1) For both graphs above, come
Calculus Week 1 CHALLENGE 1-Velocity Exercise 1: Examine the two graphs below and answer the questions. Suppose each graph represents the position of Abby, our art teacher. (1) For both graphs above, come
3 CONCEPTUAL FOUNDATIONS OF STATISTICS
 3 CONCEPTUAL FOUNDATIONS OF STATISTICS In this chapter, we examine the conceptual foundations of statistics. The goal is to give you an appreciation and conceptual understanding of some basic statistical
August 29, Introduction and Overview
 August 29, 2018 Introduction and Overview Why are we here? Haavelmo(1944): to become master of the happenings of real life. Theoretical models are necessary tools in our attempts to understand and explain
Relationships. Between Measurements Variables. Chapter 10. Copyright 2005 Brooks/Cole, a division of Thomson Learning, Inc.
 Relationships Chapter 10 Between Measurements Variables Copyright 2005 Brooks/Cole, a division of Thomson Learning, Inc. Thought topics Price of diamonds against weight Male vs female age for dating Animals
Addendum: Multiple Regression Analysis (DRAFT 8/2/07)
") Addendum: Multiple Regression Analysis (DRAFT 8/2/07) When conducting a rapid ethnographic assessment, program staff may: Want to assess the relative degree to which a number of possible predictive variables
Addendum: Multiple Regression Analysis (DRAFT 8/2/07) When conducting a rapid ethnographic assessment, program staff may: Want to assess the relative degree to which a number of possible predictive variables
STAT 201 Chapter 3. Association and Regression
 STAT 201 Chapter 3 Association and Regression 1 Association of Variables Two Categorical Variables Response Variable (dependent variable): the outcome variable whose variation is being studied Explanatory
Introduction to Econometrics
 Global edition Introduction to Econometrics Updated Third edition James H. Stock Mark W. Watson MyEconLab of Practice Provides the Power Optimize your study time with MyEconLab, the online assessment and
Score Tests of Normality in Bivariate Probit Models
 Score Tests of Normality in Bivariate Probit Models Anthony Murphy Nuffield College, Oxford OX1 1NF, UK Abstract: A relatively simple and convenient score test of normality in the bivariate probit model
Empirical Tools of Public Finance. 131 Undergraduate Public Economics Emmanuel Saez UC Berkeley
 Empirical Tools of Public Finance 131 Undergraduate Public Economics Emmanuel Saez UC Berkeley 1 DEFINITIONS Empirical public finance: The use of data and statistical methods to measure the impact of government
MEA DISCUSSION PAPERS
 Inference Problems under a Special Form of Heteroskedasticity Helmut Farbmacher, Heinrich Kögel 03-2015 MEA DISCUSSION PAPERS mea Amalienstr. 33_D-80799 Munich_Phone+49 89 38602-355_Fax +49 89 38602-390_www.mea.mpisoc.mpg.de
Chapter 11: Advanced Remedial Measures. Weighted Least Squares (WLS)
") Chapter : Advanced Remedial Measures Weighted Least Squares (WLS) When the error variance appears nonconstant, a transformation (of Y and/or X) is a quick remedy. But it may not solve the problem, or it
Chapter : Advanced Remedial Measures Weighted Least Squares (WLS) When the error variance appears nonconstant, a transformation (of Y and/or X) is a quick remedy. But it may not solve the problem, or it
2.75: 84% 2.5: 80% 2.25: 78% 2: 74% 1.75: 70% 1.5: 66% 1.25: 64% 1.0: 60% 0.5: 50% 0.25: 25% 0: 0%
 Capstone Test (will consist of FOUR quizzes and the FINAL test grade will be an average of the four quizzes). Capstone #1: Review of Chapters 1-3 Capstone #2: Review of Chapter 4 Capstone #3: Review of
Chapter 11 Multiple Regression
 Chapter 11 Multiple Regression PSY 295 Oswald Outline The problem An example Compensatory and Noncompensatory Models More examples Multiple correlation Chapter 11 Multiple Regression 2 Cont. Outline--cont.
Reminders/Comments. Thanks for the quick feedback I ll try to put HW up on Saturday and I ll you
 Reminders/Comments Thanks for the quick feedback I ll try to put HW up on Saturday and I ll email you Final project will be assigned in the last week of class You ll have that week to do it Participation
Regression Including the Interaction Between Quantitative Variables
 Regression Including the Interaction Between Quantitative Variables The purpose of the study was to examine the inter-relationships among social skills, the complexity of the social situation, and performance
Correlation and Regression
 Dublin Institute of Technology ARROW@DIT Books/Book Chapters School of Management 2012-10 Correlation and Regression Donal O'Brien Dublin Institute of Technology, donal.obrien@dit.ie Pamela Sharkey Scott
Simple Linear Regression
 Simple Linear Regression Assoc. Prof Dr Sarimah Abdullah Unit of Biostatistics & Research Methodology School of Medical Sciences, Health Campus Universiti Sains Malaysia Regression Regression analysis
Results & Statistics: Description and Correlation. I. Scales of Measurement A Review
 Results & Statistics: Description and Correlation The description and presentation of results involves a number of topics. These include scales of measurement, descriptive statistics used to summarize
Multiple Regression Analysis
 Multiple Regression Analysis Basic Concept: Extend the simple regression model to include additional explanatory variables: Y = β 0 + β1x1 + β2x2 +... + βp-1xp + ε p = (number of independent variables
What is the Scientific Method?
 Scientific Method What is the Scientific Method? It s a way to solve/explain a problem or natural phenomenon, while removing human bias and opinion. It is a critical procedure that allows validity and
Problem Set 3 ECN Econometrics Professor Oscar Jorda. Name. ESSAY. Write your answer in the space provided.
 Problem Set 3 ECN 140 - Econometrics Professor Oscar Jorda Name ESSAY. Write your answer in the space provided. 1) Sir Francis Galton, a cousin of James Darwin, examined the relationship between the height
UNEQUAL CELL SIZES DO MATTER
 1 of 7 1/12/2010 11:26 AM UNEQUAL CELL SIZES DO MATTER David C. Howell Most textbooks dealing with factorial analysis of variance will tell you that unequal cell sizes alter the analysis in some way. I
Introduction to regression
 Introduction to regression Regression describes how one variable (response) depends on another variable (explanatory variable). Response variable: variable of interest, measures the outcome of a study
Find the slope of the line that goes through the given points. 1) (-9, -68) and (8, 51) 1)
 (-9, -68) and (8, 51) 1)") Math 125 Semester Review Problems Name Find the slope of the line that goes through the given points. 1) (-9, -68) and (8, 51) 1) Solve the inequality. Graph the solution set, and state the solution set
Math 125 Semester Review Problems Name Find the slope of the line that goes through the given points. 1) (-9, -68) and (8, 51) 1) Solve the inequality. Graph the solution set, and state the solution set
Study Guide #2: MULTIPLE REGRESSION in education
 Study Guide #2: MULTIPLE REGRESSION in education What is Multiple Regression? When using Multiple Regression in education, researchers use the term independent variables to identify those variables that
Statistical Reasoning in Public Health 2009 Biostatistics 612, Homework #2
 Statistical Reasoning in Public Health 2009 Biostatistics 612, Homework #2 1. Suppose it is the year 1985 and you are doing research on the differences in wages earned by men and women in the U.S. workforce.
Applied Quantitative Methods II
 Applied Quantitative Methods II Lecture 7: Endogeneity and IVs Klára Kaĺıšková Klára Kaĺıšková AQM II - Lecture 7 VŠE, SS 2016/17 1 / 36 Outline 1 OLS and the treatment effect 2 OLS and endogeneity 3 Dealing
Bangor University Laboratory Exercise 1, June 2008
 Laboratory Exercise, June 2008 Classroom Exercise A forest land owner measures the outside bark diameters at.30 m above ground (called diameter at breast height or dbh) and total tree height from ground
Elementary Statistics:
 1. How many full chapters of reading in the text were assigned for this lecture? 1. 1. 3. 3 4. 4 5. None of the above SOC497 @ CSUN w/ Ellis Godard 1 SOC497 @ CSUN w/ Ellis Godard 5 SOC497/L: SOCIOLOGY
[En français] For a pdf of the transcript click here.
![[En français] For a pdf of the transcript click here.](/thumbs/96/127713667.jpg "[En français] For a pdf of the transcript click here.") [En français] For a pdf of the transcript click here. Go back to the podcast on endogeneity: http://www.youtube.com/watch?v=dlutjoymfxs [00:05] Hello, my name is John Antonakis. I am a professor of Organisational
[En français] For a pdf of the transcript click here. Go back to the podcast on endogeneity: http://www.youtube.com/watch?v=dlutjoymfxs [00:05] Hello, my name is John Antonakis. I am a professor of Organisational
about Eat Stop Eat is that there is the equivalent of two days a week where you don t have to worry about what you eat.
 Brad Pilon 1 2 3 ! For many people, the best thing about Eat Stop Eat is that there is the equivalent of two days a week where you don t have to worry about what you eat.! However, this still means there