Small Group Presentations
|
|
|
- Claire Stafford
- 6 years ago
- Views:
Transcription
1 Admin Assignment 1 due next Tuesday at 3pm in the Psychology course centre. Matrix Quiz during the first hour of next lecture. Assignment 2 due 13 May at 10am. I will upload and distribute these at the end of this lecture. 1
2 Small Group Presentations This is the second of the small group presentations. These presentations are to take about three to five minutes and no more than five minutes. The discussion of the topics will be general and be illustrated from the analysis of the T&F large sample example. The topics you should cover are: 1. Overall statistical significance of the relationship. Number of statistically significant discriminant functions and importance of the discriminant functions. 2. Mean differences between the groups on the discriminant variables. Univariate F-ratios and F-to-REMOVE statistics. 3. Importance of variables: Standardised Discriminant function coefficients, Structure coefficients, Relative weights. 4. Centroid Plots; Pairwise F ratios; Classification Table. You will present in your tutorials. Tutors will arrange the schedule for the presentations. 2
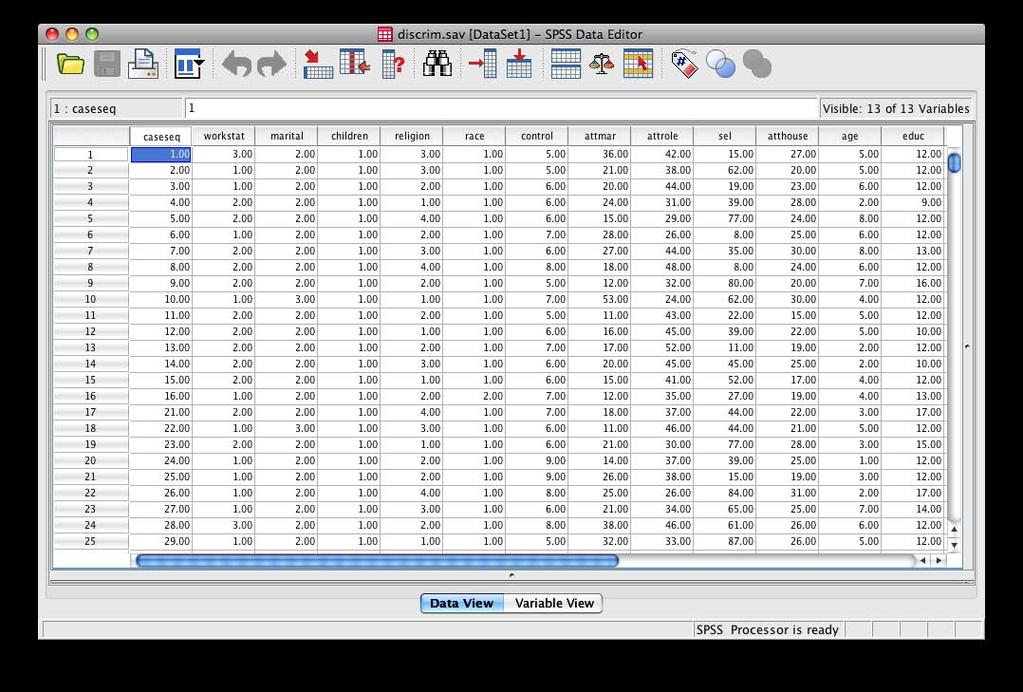
3 T&F Complete Example Explores one 3-group categorical variable: WORKSTAT - Group 1: Women in paid jobs (WORKING) - Group 2: Happy housewives (HAPHOUSE) - Group 3: Unhappy housewives (UNHOUSE) How do these three groups of women differ in attitudes? Predictors are four discriminant variables: - Variable 1: Measure of control ideology - internal vs external (CONTROL) - Variable 2: Satisfaction with current marital status (ATTMAR) - Variable 3: Measure of conservative or liberal attitudes toward the role of women (ATTROLE) - Variable 4: Frequency of experiencing various favourable and unfavourable attitudes toward housework (ATTHOUSE) Y 1, Y 2,... Y p p continuous variables X categorical k levels 3
4 Research Questions Is the overall relationship statistically significant and how strong is the relationship? What is the number of significant discriminant functions? What variables are individually important in separating (discriminating) between the groups? CONTROL ATTMAR ATTROLE ATTHOUSE p = 4 continuous variables WORKSTAT categorical k = 3 levels 4
5 Assumptions of Discriminant Analysis True Categorical Grouping Variable - Discriminant Analysis assumes that the grouping variable is a true categorical variable. The groups must also be mutually exclusive. Sample sizes - It!s acceptable to have unequal sample (group) sizes in Discriminant Analysis. With respect to sample sizes, there are 2 general rules of thumb: 1. the sample size of the smallest group should exceed the number of predictors. 2. the sample size of the smallest group should be at least 20 for 4 or more predictors. Homoscedasticity - Homoscedasticity is the assumption of homogeneity of variances of scores on the response variables within each group formed by the grouping variable. Each group should also have similar co-variances to the other groups for the response variables. 5
6 Assumptions of Discriminant Analysis Homoscedasticity (con!t) - A violation of this assumption may indicate the presence of outliers in one or more groups. Discriminant Analysis is very sensitive to outliers. Box!s M tests the assumption of homogeneity of variances/co-variances and a significant Box!s M indicates that this assumption has been violated. Tabachnick and Fidell state that when sample sizes are large or equal, Discriminant Analysis is robust to the violation of this assumption. Outliers - Discriminant Analysis is very sensitive to both univariate and multivariate outliers. Data can be screened similar to the screening of data in Regression Diagnostics. Multicollinearity, Singularity, and Redundant Variables - Due to the need for matrix inversion in Discriminant Analysis, variables that are highly related (multicollinearity), perfectly related (singularity) or completely unrelated (redundant) need to be accounted for. Checking the Tolerance value of the response variables can check for the above. 6
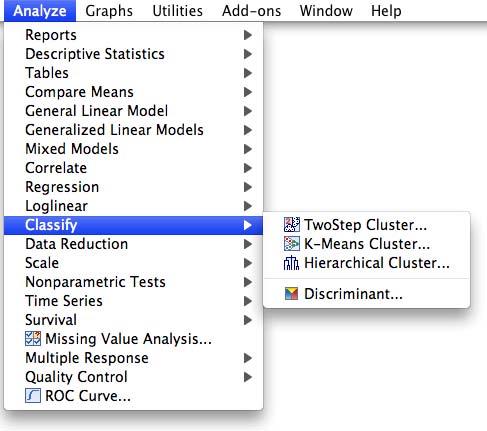
7 SPSS commands for discriminant analysis We need to convince SPSS to yield ALL the information we need to address the research questions. e.g., F-To-Remove values. This means going beyond just the simple menu options in SPSS. Data Diagnostics - still important. Strategy as per multiple regression. Diagnostics done by groups. 7
8 8
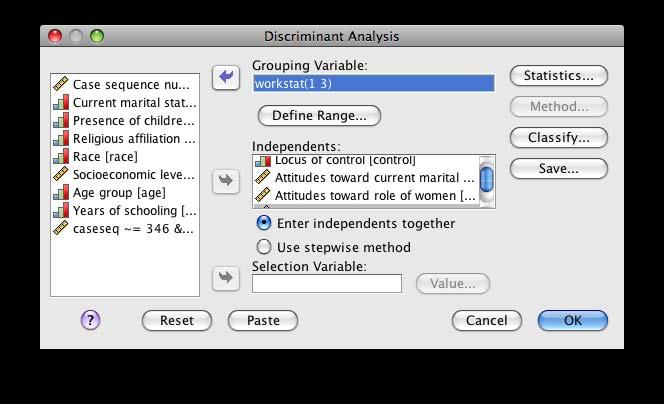
9 To be consistent with Tabachnick and Fidell!s reported analyses, we will analyse the data with the changes they recommend. Of course, the analysis should be run with all the data and a check whether the substantive interpretation changes, (i.e., regression diagnostics strategy and policy). As recommended by Tabachnick and Fidell (2007) diagnostic checks were performed by groups. These indicated two multivariate outliers, cases 346 and 407. The select if command is used to select all cases not equal to the case sequence numbers using the variable "caseseq!. 9
10 10
11 11
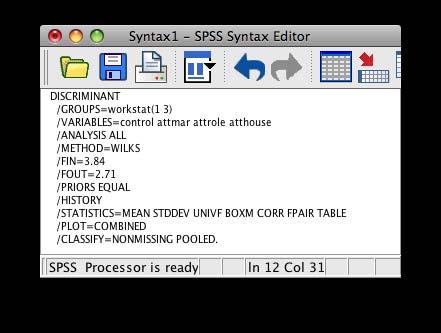
12 DISCRIMINANT /GROUPS=workstat(1 3) /VARIABLES=control attmar attrole atthouse /ANALYSIS ALL (2) /METHOD=WILKS /FIN=3.84 /FOUT=2.71 /PRIORS EQUAL /HISTORY This seems rather mystical and cryptic it is This tells SPSS to force entry of every discriminant variable. This will give us give us F-TO-REMOVE values. /STATISTICS=MEAN STDDEV UNIVF BOXM CORR FPAIR TABLE /PLOT=COMBINED /CLASSIFY=NONMISSING POOLED. /GROUPS specifies the grouping variable and the range of values to be used in the analysis. /VARIABLES lists all the variables to be used as discriminating (predictor, independent) variables. 12
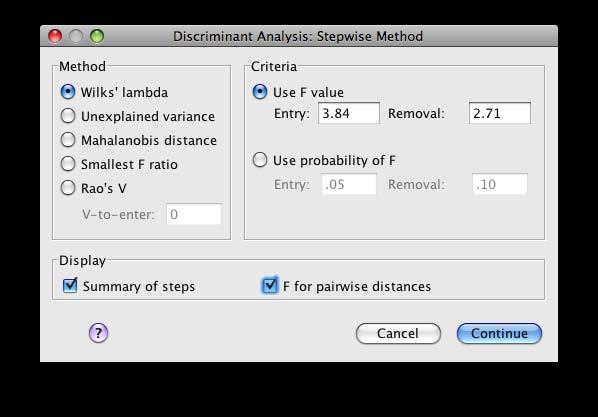
13 /ANALYSIS and /METHOD : The default method of analysis performed by the DISCRIMINANT procedure is the direct method. However the direct method doesn!t calculate the F-TO-REMOVE values which are needed for the interpretation. They are available by specifying a stepwise method, Wilks, when all the variables are forced to enter the analysis. The analysis subcommand specifies the variables to be used in the analysis and the (2) specifies the inclusion number for the variables. This particular value is even numbered and forces the variables entered together. The result of these two subcommands is to achieve the same results as for the direct method but allows the calculation of the F-TO-REMOVE values. 13
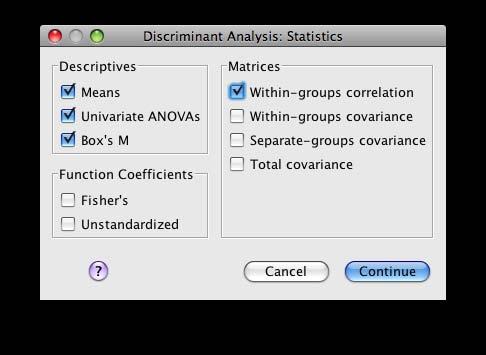
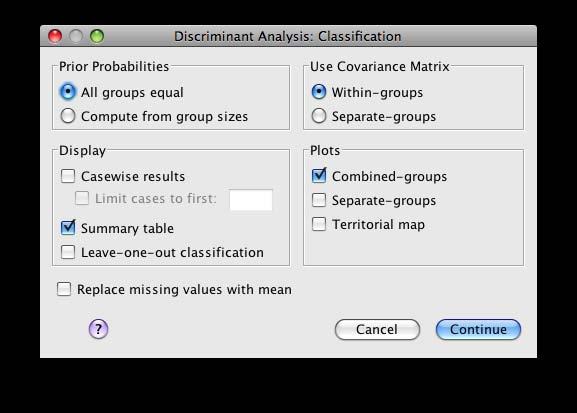
14 /PLOT produces a scatterplot of the discriminant scores (the linear composite) which also shows the group centroids. COMBINED provides a plot with all the cases. In the /STATISTICS subcommand: MEAN and STDDEV give the means and standard deviations for each group and discriminating variable. CORR gives the pooled within groups correlation matrix. UNIVF produces the F tests for the differences between the groups on each variable. BOXM tests the equality of the group covariance matrices. TABLE produces a classification table. FPAIR produces a matrix of pairwise F ratios for the groups based on Mahalanobis distance between groups. 14


15 Interpretation of discriminant analysis Overall relationship - overall strength & statistical significance - number of significant functions - importance of each function Importance of each variable - overall importance - importance on each function Group separation 15
16 Test for Homogeneity Box!s M Test Results Box's M F Approx. df1 df Tests null hypothesis of equal population covariance matrices. A significant Box!s M indicates a violation of the assumption of homogeneity of variances/co-variances. T&F state that when group sample sizes are equal or large, discriminant analysis is robust to violations of this assumption. They give further advice when sample sizes are small and/or unequal. Essentially the levels for the overall significance test of Wilk!s are not correct and care is needed with the interpretation of the overall significance test (i.e. be somewhat conservative). However, although inferential (descriptive) Discriminant Analysis is usually robust to violation of this assumption, when the purpose of the Discriminant Analysis is classification (predictive discriminant analysis), it is not. 16
 1.")
 1 - This is similar to the reciprocal of an F value: F - The bigger the")
17 Overall statistical significance Wilk!s Lambda W Λ = = W T W + B = r j= λ j = r j=1 ( 1 R 2 Cj ) 1. In terms of within and between group variance. ( ) 1 - This is similar to the reciprocal of an F value: F - The bigger the effects of differences between groups the smaller the value of Λ. Recall from last lecture... 17
18 Overall statistical significance Wilk!s Lambda Wilk!s Lambda is used to test the overall statistical significance of the discriminant model. Wilk!s Lambda varies between 0 and 1, with 0 meaning that the groups differ and 1 meaning that the groups are the same. However, Bartlett!s V, a transformation of Wilk!s Lamba that approximates a Chi-square distribution, is what is actually tested. Wilks' Lambda Test of Function(s) 1 through 2 2 Wilks' Lambda Chi-square df In the first step (1 through 2 in our example in the table; 1 through k-1 in general), both (all) functions are being tested. This is the overall test. If this is not significant then our discriminant variables are not able to distinguish between our groups. 18
19 Number of significant discriminant functions Wilk!s Lambda again Wilk!s Lambda is used to test the overall statistical significance of the discriminant model. Wilk!s Lambda varies between 0 and 1, with 0 meaning that the groups differ and 1 meaning that the groups are the same. However, Bartlett!s V, a transformation of Wilk!s Lamba that approximates a Chi-square distribution, is what is actually tested. Wilks' Lambda Test of Function(s) 1 through 2 2 Wilks' Lambda Chi-square df There are 2 possible discriminant functions With both functions in, there is a statistically significant effect. For the second function there are still significant differences between groups. So two functions needed to describe the between group differences. 19
20 Importance of the discriminant functions Canonical correlations squared The square of canonical correlation coefficient reported for each discriminant function estimates the amount of between group variability accounted for by each discriminant function. Eigenvalues Function 1 2 Eigenvalue % of Variance Cumulative % Canonical Correlation.077 a a a. First 2 canonical discriminant functions were used in the analysis. R 2 1 = =.071 = 7.1% of the between group variability that is explained by the first discriminant function. R 2 2 = =.034 = 3.4% of the between group variability that is explained by the second discriminant function. 20
21 Importance of the discriminant functions Canonical correlations squared The square of canonical correlation coefficient reported for each discriminant function estimates the amount of between group variability accounted for by each discriminant function. Eigenvalues Function 1 2 Eigenvalue % of Variance Cumulative % Canonical Correlation.077 a a a. First 2 canonical discriminant functions were used in the analysis. Note: This is different to the "% of Variance! reported in the table. "% of Variance! looks at the contribution of that discriminant function relative to all other functions. From the table we can see that the 7.1% of between group variability explained by the first discriminant function makes up 68.6% (% of Variance column) of the amount of between group variance that the two modelled functions are together able to explain. 21
22 Canonical Correlations Interpretation Be sure not to confuse reported in SPSS. R 2 Cj R 2 Cj with the "% variance! % variance λ j (1 + λ j ) λ j ( λ j ) How much of the between groups variability is accounted for by that function. How well one discriminant function discriminates between groups in comparison to the all other discriminant functions in the analysis 22
23 Importance of the discriminant functions Overall multivariate effect size Pillai!s measure η 2 R 2 1 = =.071 = 7.1% R 2 2 = =.034 = 3.4% Eigenvalues Function 1 2 Eigenvalue % of Variance Cumulative % Canonical Correlation.077 a a a. First 2 canonical discriminant functions were used in the analysis. A measure of overall multivariate effect size is given by the average of the Rj 2. This is Pillai!s measure and is called η 2. In general it should be calculated from all discriminant functions. In this example: η 2 = =.0525 = 5.3% That is, on average, the discriminant functions each explain 5.3% of the between group variability. This effect is not overly strong but this will depend on the field of research. 23
24 Pooled Within-groups Correlation Matrix Pooled Within-Groups Matrices Correlation Locus of control current marital status role of women housework Locus of control Attitudes toward current marital status Attitudes toward role of women Attitudes toward housework The pooled within-group correlation matrix provides estimates of the correlations between variables with the effects of the grouping variable removed. In effect, this is as if the variables were correlated separately for each of the groups and these correlations were averaged. This shows the correlation between the variables and shows the need to take any shared variance into account. 24
25 Relative importance of variables Like multiple regression this is not an easy question to answer because there are many different statistics suggested. In this course we will consider five of them: Overall importance of each variable - Each variable is considered separately 1. Univariate F-ratio 2. F-TO-REMOVE statistics and pr 2 Importance of each variable for each function - Variables are considered in combination 3. Structure Coefficients 4. Standardised discriminant function coefficients 5. Relative Weights 25
26 Relative importance of variables Univariate F-ratio Tests of Equality of Group Means Locus of control current marital status role of women housework Wilks' Lambda F df1 df Three variables show statistically significant differences univariately (p<.001). The way in which the groups differ on specific variables is found by looking at the means for each group. The univariate F ratios test for the difference between these means. These are simply a series of ANOVA!s for each discriminant variable. These statistics don!t take into account the interrelationships between the variables or the effect on the familywise error rate with multiple tests. The degrees of freedom are [k-1, N-k]. 26
27 Relative importance of variables F-TO-REMOVE statistics for each variable Provide similar information to squared semi-partial correlations. measure how much the variable adds to the discrimination between groups after the other variables are in the equation. Obtained from SPSS sneakily by specifying a stepwise analysis but forcing all the variables into the analysis. Values are taken from the FINAL step in stepwise analysis. 27

28 Relative importance of variables F-TO-REMOVE statistics for each variable Variables in the Analysis Step 1 Locus of control Tolerance F to Remove Wilks' Lambda 2 Locus of control current marital status Locus of control current marital status role of women Locus of control Final Step current marital status role of women housework
29 Relative importance of variables F-TO-REMOVE statistics for each variable 4 of women Locus of control current marital status role of women housework From Tables: the critical value of F for =.05 for testing F-TO-REMOVE is F(2,450) = The degrees of freedom are [k-1, N - k - p + 1]. No Bonferonni adjustment. Three variables are statistically significant using this critical value and contribute uniquely to the separation of the groups in addition to the other variables. 29
30 Relative importance of variables 4 of women Locus of control current marital status role of women housework partial ( ) η 2 pr 2 % We can use the F-TO-REMOVE values to calculate an estimate of the effect size for the difference between groups for a variable controlling for the other variables. It!s equivalent to pr 2, the squared partial-correlation coefficient. For the ith variable controlling for the other variables: pri 2 = SS B i for the ith variable. SS Ti This is the proportion of total variance for a variable that is accounted for by the grouping variable controlling for the other variables. The formula for calculating this from the F- TO-REMOVE values is, where Ftri = F-TO-REMOVE for the ith variable, pr 2 i = (k 1)F tri (N k p+1) ( ) (k 1)Ftri (N k p+1)
31 Relative importance of variables Structure Matrix Structure Coefficients (s) These are the pooled within group correlations between the discriminant functions and the discriminating variables. That is, they are the correlations between the four discriminant variables and each of the two discriminant functions, (Composite 1 and Composite 2). The correlations are calculated within each group and then pooled. Function current marital status housework role of women Locus of control * * * * Forget the * in SPSS Pooled within-groups correlations between discriminating variables and standardized canonical discriminant functions Variables ordered by absolute size of correlation within function. *. Largest absolute correlation between each variable and any discriminant function An advantage of structure coefficients is that they have a range from 1 to 1.The "meaning! of the variables can be used to place a meaning or an interpretation on the discriminant function. The definition of a high value for these correlations is problematic. T&F employ a variety of criteria, e.g. structure coefficients greater than.50, or.30. There is no agreed value for the cutoff and there are no parametric tests of significance. 31
32 Relative importance of variables Standardised Discriminant Function Coefficients (d) Standardized Canonical Discriminant Function Coe!cients Function Locus of control current marital status role of women housework These are similar to beta weights in multiple regression. These represent the unique contribution of each variable to the discriminant functions, taking into account any shared variance between variables. T&F state that using the magnitude of these coefficients can be misleading. This is because their theoretical range is from minus to plus infinity. 32
33 Relative importance of variables Relative Weights (d x s) Structure Matrix Standardized Canonical Discriminant Function Coe!cients current marital status housework role of women Locus of control Function * * * * Pooled within-groups correlations between discriminating variables and standardized canonical discriminant functions Variables ordered by absolute size of correlation within function. *. Largest absolute correlation between each variable and any discriminant function Locus of control current marital status role of women housework Function Function 1 2 current marital status 40.24% 6.18% housework 24.15% 16.09% role of women 31.81% 63.08% Locus of control 3.80% 14.65% They indicate for each function the proportion of between group variability accounted for by a variable. Like RW in multiple regression they could also be expressed as percentages. Total 100% 100% 33
34 Relative importance of variables 1. Univariate F-ratio 2. F-TO-REMOVE statistics and pr 2 3. Structure Coefficients 4. Standardised discriminant function coefficients 5. Relative Weights The process of deciding what variables are important takes into account the pattern of results across the above five statistics. This is because no single statistic tells the "full! story; they each view the group differences from different angles. 34
35 Group separation Centroid Plots in reduced discriminant space How are the groups separated? This is answered by plotting the group centroids (looking at the combined-groups plot or plotting them yourselves from the table) and by labelling the discriminant functions with the names of the important variables. This shows the use of discriminant analysis as a data reduction method. Canonical Discriminant Functions 4 2 Work Status WORKING HAPHOUSE UNHOUSE Group Centroid Note the considerable overlap of the groups! Function 2 0 HAPHOUSE UNHOUSE WORKING Function 1 35
36 Group separation Centroid Plots in reduced discriminant space The group centroids are the means for each group on each discriminant function. Since the group centroids are a linear combination of the means for each variable, there may be some discrepancies in an interpretation based on the group centroids and the means for each variable. Which is used depends on the focus of the interpretation; whether each variable separately or the combination of the variables is of interest. Functions at Group Centroids Function Work Status WORKING HAPHOUSE UNHOUSE E Unstandardized canonical discriminant functions evaluated at group means Another approach, is to superimpose a plot of the variables in the discriminant function space. 36
37 UNHOUSE Function HAPHOUSE WORKING Function 1 37
38 UNHOUSE Function HAPHOUSE WORKING Function 1 38
39 ATTROLE (conservative) UNHOUSE ATTHOUSE (hate housework) ATTMAR (unsatisfied) Function HAPHOUSE WORKING -0.4 ATTMAR (satisfied) ATTHOUSE (like housework) ATTROLE (liberal) Function 1 39
40 Group separation Group Centroid Plot with variables as bipolar vectors Structure Matrix 1.0 Function Function ATTROLE (conservative) (-.639,.722) (-.718,-.323) HAPHOUSE ATTMAR (satisfied) ATTHOUSE (like housework) (-.679,-.333) UNHOUSE WORKING (.679,.333) ATTHOUSE (hate housework) ATTMAR (unsatisfied) (.718,.323) current marital status housework role of women Locus of control * * * * Pooled within-groups correlations between discriminating variables and standardized canonical discriminant functions Variables ordered by absolute size of correlation within function. *. Largest absolute correlation between each variable and any discriminant function To map each SIGNIFICANT variable onto the functions, use the structure coefficient as coordinates for each variable and then reflecting the line through the origin to make it a bipolar vector ATTROLE (liberal) (.639,-.722) Function 1 40

41 Group separation Matrix of pairwise F values and Group means Pairwise Group Comparisons a,b,c,d Final Step Step Work Status WORKING HAPHOUSE UNHOUSE WORKING HAPHOUSE UNHOUSE WORKING HAPHOUSE UNHOUSE WORKING HAPHOUSE UNHOUSE F F F F F F F F F F F F a. 1, 453 degrees of freedom for step 1. b. 2, 452 degrees of freedom for step 2. c. 3, 451 degrees of freedom for step 3. d. 4, 450 degrees of freedom for step 4. WORKING HAPHOUSE UNHOUSE
42 1 2 3 Matrix 4 of pairwise F values and Group.000 means The matrix of pairwise F values between the groups tests which groups are different from one another over all the 3variables. WORKING This F can be useful when describing the differences between the groups in the groupcentroid plot Group separation HAPHOUSE F UNHOUSE F 4 WORKING Pairwise F Group Comparisons a,b,c,d Step Work Status WORKING HAPHOUSE UNHOUSE HAPHOUSE 1 WORKING F WORKING F UNHOUSE HAPHOUSE F HAPHOUSE F a. 1, 453 degrees of freedom for step UNHOUSE F b. 2, 452 UNHOUSE degrees of freedom F for step c. 3, 451 degrees of freedom for step WORKING F d. 1, 4, degrees of freedom for step HAPHOUSE F Summary of Canonical Discriminant Functions UNHOUSE HAPHOUSE UNHOUSE F F F
43 Group separation Discriminant variable mean differences at the group level Another aid to interpretation is the difference between the means for each of the "important! variables. This breaks down the group centroids into group means for each discriminant variable. The focus of interpretation should be on means for variables earlier determined to be an important part of a discriminant function. Group Statistics Work Status WORKING Locus of control Mean Std. Valid N (listwise) Deviation Unweighted Weighted current marital status role of women housework HAPHOUSE Locus of control current marital status UNHOUSE role of women housework Locus of control current marital status Editing this table, rearrange the columns and rows and delete other information to produce... role of women housework Total Locus of control current marital status role of women housework
44 Group separation Discriminant variable mean differences at the group level Another aid to interpretation is the difference between the means for each of the "important! variables. This breaks down the group centroids into group means for each discriminant variable. The focus of interpretation should be on means for variables earlier determined to be an important part of a discriminant function. WORKSTAT Work Status CONTROL Locus of control ATTMAR current marital status ATTROLE role of women ATTHOUSE housework WORKING HAPHOUSE UNHOUSE Total something like this. 44
45 ATTROLE (conservative) 0.6 Function HAPHOUSE ATTMAR (satisfied) ATTHOUSE (like housework) UNHOUSE WORKING ATTHOUSE (hate housework) ATTMAR (unsatisfied) You can clearly see by looking at one!s attitude toward housework (along the ATTHOUSE vector), that unhappy housewives are at one end, and happy housewives are at the other end. Those who are working fall in the middle. This is reflected in the difference in group means in the ATTHOUSE column. Use these means to help work out the direction ATTROLE (liberal) Function 1 WORKSTAT Work Status CONTROL Locus of control ATTMAR current marital status ATTROLE role of women ATTHOUSE housework WORKING HAPHOUSE UNHOUSE Total
46 Classification Prediction of group membership How well do the discriminant functions predict group membership? The classification table provides this information. Not only is the overall percent of correctly classified important, but also by looking at the miss-classifications, groups that overlap can be identified. Classification Results a Predicted Group Membership Original Count Work Status WORKING WORKING HAPHOUSE UNHOUSE Total HAPHOUSE UNHOUSE % WORKING HAPHOUSE UNHOUSE a. 45.8% of original grouped cases correctly classified. The accuracy of the classification is influenced by the decisions about the "prior probability! of group membership. Sometimes it might be plausible that each case has an equally likely chance of being in each group. Other times, the group size gives an estimate of the population proportions. Other times, the user may have theoretical reasons for specifying other prior probabilities of group membership. 46
47 Comparing Multiple Regression and Discriminant Analysis Multiple Regression Discriminant Analysis Overall significance of the relationship F test test or H 0 : R = 0 H 0 : (1 R 2 ) = 1 χ 2 H 0 : V = 0 or H 0 : (1 R i ) = 1 Importance of Relationship Number of dimensions Squared Multiple Correlation = R 2 Only one dimension Squared Canonical Correlation = R 2 ci Tested using a stepwise analysis 47
48 Comparing Multiple Regression and Discriminant Analysis Multiple Regression Discriminant Analysis Simple r yi Univariate F test for each variable sr 2 F-TO-REMOVE for each variable What variables are important in the relationship? beta weights matrix of standardised discriminant function coefficients (d i ) not used Relative Weights ) ( βryi R 2 matrix of structure coefficients (s i ) matrix of relative weights (d i s i ) 48
49 Comparing Multiple Regression and Discriminant Analysis Description of how the predictors explain differences in the criterion: - Multiple Regression # description of prediction equation (not often used in psychology) - Discriminant Analysis # description of group separation on the basis of group centroid plot, classification table, pairwise F-tests, mean differences on important predictors. Which parts of the results of a discriminant analysis are used for interpretation depends on the kind of research question addressed and whether the focus is on the multivariate nature of the variables or on variables considered individually. 49
50 Questions 1. Describe how the number of significant discriminant functions is determined. 2. How do outliers affect Discriminant Analysis? 3. Explain the distinctions between using Univariate F!s, F-TO-REMOVE statistics, structure coefficients, standardised discrimination function coefficients and relative weights for interpretation of discriminant analysis. 4. What issues need to be addressed if the purpose of Discriminant Analysis is classification? 50
Applications. DSC 410/510 Multivariate Statistical Methods. Discriminating Two Groups. What is Discriminant Analysis
 DSC 4/5 Multivariate Statistical Methods Applications DSC 4/5 Multivariate Statistical Methods Discriminant Analysis Identify the group to which an object or case (e.g. person, firm, product) belongs:
Overview of Lecture. Survey Methods & Design in Psychology. Correlational statistics vs tests of differences between groups
 Survey Methods & Design in Psychology Lecture 10 ANOVA (2007) Lecturer: James Neill Overview of Lecture Testing mean differences ANOVA models Interactions Follow-up tests Effect sizes Parametric Tests
Daniel Boduszek University of Huddersfield
 Daniel Boduszek University of Huddersfield d.boduszek@hud.ac.uk Introduction to Multiple Regression (MR) Types of MR Assumptions of MR SPSS procedure of MR Example based on prison data Interpretation of
Correlation and Regression
 Dublin Institute of Technology ARROW@DIT Books/Book Chapters School of Management 2012-10 Correlation and Regression Donal O'Brien Dublin Institute of Technology, donal.obrien@dit.ie Pamela Sharkey Scott
Daniel Boduszek University of Huddersfield
 Daniel Boduszek University of Huddersfield d.boduszek@hud.ac.uk Introduction to Logistic Regression SPSS procedure of LR Interpretation of SPSS output Presenting results from LR Logistic regression is
Tutorial 3: MANOVA. Pekka Malo 30E00500 Quantitative Empirical Research Spring 2016
 Tutorial 3: Pekka Malo 30E00500 Quantitative Empirical Research Spring 2016 Step 1: Research design Adequacy of sample size Choice of dependent variables Choice of independent variables (treatment effects)
WELCOME! Lecture 11 Thommy Perlinger
 Quantitative Methods II WELCOME! Lecture 11 Thommy Perlinger Regression based on violated assumptions If any of the assumptions are violated, potential inaccuracies may be present in the estimated regression
(C) Jamalludin Ab Rahman
 Jamalludin Ab Rahman") SPSS Note The GLM Multivariate procedure is based on the General Linear Model procedure, in which factors and covariates are assumed to have a linear relationship to the dependent variable. Factors. Categorical
SPSS Note The GLM Multivariate procedure is based on the General Linear Model procedure, in which factors and covariates are assumed to have a linear relationship to the dependent variable. Factors. Categorical
The SAGE Encyclopedia of Educational Research, Measurement, and Evaluation Multivariate Analysis of Variance
 The SAGE Encyclopedia of Educational Research, Measurement, Multivariate Analysis of Variance Contributors: David W. Stockburger Edited by: Bruce B. Frey Book Title: Chapter Title: "Multivariate Analysis
CHAPTER VI RESEARCH METHODOLOGY
 CHAPTER VI RESEARCH METHODOLOGY 6.1 Research Design Research is an organized, systematic, data based, critical, objective, scientific inquiry or investigation into a specific problem, undertaken with the
CHAPTER TWO REGRESSION
 CHAPTER TWO REGRESSION 2.0 Introduction The second chapter, Regression analysis is an extension of correlation. The aim of the discussion of exercises is to enhance students capability to assess the effect
isc ove ring i Statistics sing SPSS
 isc ove ring i Statistics sing SPSS S E C O N D! E D I T I O N (and sex, drugs and rock V roll) A N D Y F I E L D Publications London o Thousand Oaks New Delhi CONTENTS Preface How To Use This Book Acknowledgements
ANOVA in SPSS (Practical)
") ANOVA in SPSS (Practical) Analysis of Variance practical In this practical we will investigate how we model the influence of a categorical predictor on a continuous response. Centre for Multilevel Modelling
ANOVA in SPSS (Practical) Analysis of Variance practical In this practical we will investigate how we model the influence of a categorical predictor on a continuous response. Centre for Multilevel Modelling
Business Research Methods. Introduction to Data Analysis
 Business Research Methods Introduction to Data Analysis Data Analysis Process STAGES OF DATA ANALYSIS EDITING CODING DATA ENTRY ERROR CHECKING AND VERIFICATION DATA ANALYSIS Introduction Preparation of
11/24/2017. Do not imply a cause-and-effect relationship
 Correlational research is used to describe the relationship between two or more naturally occurring variables. Is age related to political conservativism? Are highly extraverted people less afraid of rejection
11/18/2013. Correlational Research. Correlational Designs. Why Use a Correlational Design? CORRELATIONAL RESEARCH STUDIES
 Correlational Research Correlational Designs Correlational research is used to describe the relationship between two or more naturally occurring variables. Is age related to political conservativism? Are
Reveal Relationships in Categorical Data
 SPSS Categories 15.0 Specifications Reveal Relationships in Categorical Data Unleash the full potential of your data through perceptual mapping, optimal scaling, preference scaling, and dimension reduction
Analysis of Variance: repeated measures
 Analysis of Variance: repeated measures Tests for comparing three or more groups or conditions: (a) Nonparametric tests: Independent measures: Kruskal-Wallis. Repeated measures: Friedman s. (b) Parametric
A STUDY ON SOCIAL IMPACT OF WOMEN SELF HELP GROUPS IN METTUR TALUK, SALEM DISTRICT, TAMILNADU
 A STUDY ON SOCIAL IMPACT OF WOMEN SELF HELP GROUPS IN METTUR TALUK, SALEM DISTRICT, TAMILNADU P.UMAMAHESWARI*; M.GURUSAMY**; DR. A. JAYAKUMAR*** *ASSISTANT PROFESSOR DEPARTMENT OF MANAGEMENT STUDIES PAAVAI
Inferential Statistics
 Inferential Statistics and t - tests ScWk 242 Session 9 Slides Inferential Statistics Ø Inferential statistics are used to test hypotheses about the relationship between the independent and the dependent
Stat Wk 9: Hypothesis Tests and Analysis
 Stat 342 - Wk 9: Hypothesis Tests and Analysis Crash course on ANOVA, proc glm Stat 342 Notes. Week 9 Page 1 / 57 Crash Course: ANOVA AnOVa stands for Analysis Of Variance. Sometimes it s called ANOVA,
Department of Allergy-Pneumonology, Penteli Children s Hospital, Palaia Penteli, Greece
 International Pediatrics Volume 2009, Article ID 952042, 6 pages doi:10.1155/2009/952042 Clinical Study Logistic Regression and Linear Discriminant Analyses in Evaluating Factors Associated with Asthma
One-Way Independent ANOVA
 One-Way Independent ANOVA Analysis of Variance (ANOVA) is a common and robust statistical test that you can use to compare the mean scores collected from different conditions or groups in an experiment.
HANDOUTS FOR BST 660 ARE AVAILABLE in ACROBAT PDF FORMAT AT:
 Applied Multivariate Analysis BST 660 T. Mark Beasley, Ph.D. Associate Professor, Department of Biostatistics RPHB 309-E E-Mail: mbeasley@uab.edu Voice:(205) 975-4957 Website: http://www.soph.uab.edu/statgenetics/people/beasley/tmbindex.html
Profile Analysis. Intro and Assumptions Psy 524 Andrew Ainsworth
 Profile Analysis Intro and Assumptions Psy 524 Andrew Ainsworth Profile Analysis Profile analysis is the repeated measures extension of MANOVA where a set of DVs are commensurate (on the same scale). Profile
bivariate analysis: The statistical analysis of the relationship between two variables.
 bivariate analysis: The statistical analysis of the relationship between two variables. cell frequency: The number of cases in a cell of a cross-tabulation (contingency table). chi-square (χ 2 ) test for
Readings Assumed knowledge
 3 N = 59 EDUCAT 59 TEACHG 59 CAMP US 59 SOCIAL Analysis of Variance 95% CI Lecture 9 Survey Research & Design in Psychology James Neill, 2012 Readings Assumed knowledge Howell (2010): Ch3 The Normal Distribution
CHILD HEALTH AND DEVELOPMENT STUDY
 CHILD HEALTH AND DEVELOPMENT STUDY 9. Diagnostics In this section various diagnostic tools will be used to evaluate the adequacy of the regression model with the five independent variables developed in
Repeated Measures ANOVA and Mixed Model ANOVA. Comparing more than two measurements of the same or matched participants
 Repeated Measures ANOVA and Mixed Model ANOVA Comparing more than two measurements of the same or matched participants Data files Fatigue.sav MentalRotation.sav AttachAndSleep.sav Attitude.sav Homework:
Business Statistics Probability
 Business Statistics The following was provided by Dr. Suzanne Delaney, and is a comprehensive review of Business Statistics. The workshop instructor will provide relevant examples during the Skills Assessment
Subescala D CULTURA ORGANIZACIONAL. Factor Analysis
 Subescala D CULTURA ORGANIZACIONAL Factor Analysis Descriptive Statistics Mean Std. Deviation Analysis N 1 3,44 1,244 224 2 3,43 1,258 224 3 4,50,989 224 4 4,38 1,118 224 5 4,30 1,151 224 6 4,27 1,205
Summary & Conclusion. Lecture 10 Survey Research & Design in Psychology James Neill, 2016 Creative Commons Attribution 4.0
 Summary & Conclusion Lecture 10 Survey Research & Design in Psychology James Neill, 2016 Creative Commons Attribution 4.0 Overview 1. Survey research and design 1. Survey research 2. Survey design 2. Univariate
Multiple Regression Analysis
 Multiple Regression Analysis Basic Concept: Extend the simple regression model to include additional explanatory variables: Y = β 0 + β1x1 + β2x2 +... + βp-1xp + ε p = (number of independent variables
Principal Components Factor Analysis in the Literature. Stage 1: Define the Research Problem
 Principal Components Factor Analysis in the Literature This problem is taken from the research article: Charles P. Flynn and Suzanne R. Kunkel, "Deprivation, Compensation, and Conceptions of an Afterlife."
Section 4.1. Chapter 4. Classification into Groups: Discriminant Analysis. Introduction: Canonical Discriminant Analysis.
 Chapter 4 Classification into Groups: Discriminant Analysis Section 4.1 Introduction: Canonical Discriminant Analysis Understand the goals of discriminant Identify similarities between discriminant analysis
A COMPARISON BETWEEN MULTIVARIATE AND BIVARIATE ANALYSIS USED IN MARKETING RESEARCH
 Bulletin of the Transilvania University of Braşov Vol. 5 (54) No. 1-2012 Series V: Economic Sciences A COMPARISON BETWEEN MULTIVARIATE AND BIVARIATE ANALYSIS USED IN MARKETING RESEARCH Cristinel CONSTANTIN
Two-Way Independent Samples ANOVA with SPSS
 Two-Way Independent Samples ANOVA with SPSS Obtain the file ANOVA.SAV from my SPSS Data page. The data are those that appear in Table 17-3 of Howell s Fundamental statistics for the behavioral sciences
SUMMER 2011 RE-EXAM PSYF11STAT - STATISTIK
 SUMMER 011 RE-EXAM PSYF11STAT - STATISTIK Full Name: Årskortnummer: Date: This exam is made up of three parts: Part 1 includes 30 multiple choice questions; Part includes 10 matching questions; and Part
Study Guide #2: MULTIPLE REGRESSION in education
 Study Guide #2: MULTIPLE REGRESSION in education What is Multiple Regression? When using Multiple Regression in education, researchers use the term independent variables to identify those variables that
Preliminary Report on Simple Statistical Tests (t-tests and bivariate correlations)
") Preliminary Report on Simple Statistical Tests (t-tests and bivariate correlations) After receiving my comments on the preliminary reports of your datasets, the next step for the groups is to complete
Preliminary Report on Simple Statistical Tests (t-tests and bivariate correlations) After receiving my comments on the preliminary reports of your datasets, the next step for the groups is to complete
Survey research (Lecture 1) Summary & Conclusion. Lecture 10 Survey Research & Design in Psychology James Neill, 2015 Creative Commons Attribution 4.
 Summary & Conclusion. Lecture 10 Survey Research & Design in Psychology James Neill, 2015 Creative Commons Attribution 4.") Summary & Conclusion Lecture 10 Survey Research & Design in Psychology James Neill, 2015 Creative Commons Attribution 4.0 Overview 1. Survey research 2. Survey design 3. Descriptives & graphing 4. Correlation
Summary & Conclusion Lecture 10 Survey Research & Design in Psychology James Neill, 2015 Creative Commons Attribution 4.0 Overview 1. Survey research 2. Survey design 3. Descriptives & graphing 4. Correlation
Survey research (Lecture 1)
") Summary & Conclusion Lecture 10 Survey Research & Design in Psychology James Neill, 2015 Creative Commons Attribution 4.0 Overview 1. Survey research 2. Survey design 3. Descriptives & graphing 4. Correlation
Summary & Conclusion Lecture 10 Survey Research & Design in Psychology James Neill, 2015 Creative Commons Attribution 4.0 Overview 1. Survey research 2. Survey design 3. Descriptives & graphing 4. Correlation
Application of Local Control Strategy in analyses of the effects of Radon on Lung Cancer Mortality for 2,881 US Counties
 Application of Local Control Strategy in analyses of the effects of Radon on Lung Cancer Mortality for 2,881 US Counties Bob Obenchain, Risk Benefit Statistics, August 2015 Our motivation for using a Cut-Point
Statistics as a Tool. A set of tools for collecting, organizing, presenting and analyzing numerical facts or observations.
 Statistics as a Tool A set of tools for collecting, organizing, presenting and analyzing numerical facts or observations. Descriptive Statistics Numerical facts or observations that are organized describe
Investigating the robustness of the nonparametric Levene test with more than two groups
 Psicológica (2014), 35, 361-383. Investigating the robustness of the nonparametric Levene test with more than two groups David W. Nordstokke * and S. Mitchell Colp University of Calgary, Canada Testing
CHAPTER ONE CORRELATION
 CHAPTER ONE CORRELATION 1.0 Introduction The first chapter focuses on the nature of statistical data of correlation. The aim of the series of exercises is to ensure the students are able to use SPSS to
Subescala B Compromisso com a organização escolar. Factor Analysis
 Subescala B Compromisso com a organização escolar Factor Analysis Descriptive Statistics Mean Std. Deviation Analysis N 1 4,42 1,108 233 2 4,41 1,001 233 3 4,99 1,261 233 4 4,37 1,055 233 5 4,48 1,018
Problem #1 Neurological signs and symptoms of ciguatera poisoning as the start of treatment and 2.5 hours after treatment with mannitol.
 Ho (null hypothesis) Ha (alternative hypothesis) Problem #1 Neurological signs and symptoms of ciguatera poisoning as the start of treatment and 2.5 hours after treatment with mannitol. Hypothesis: Ho:
Multivariate methods in rehabilitation
 Work 24 (2005) 205 212 205 IOS Press Speaking of Research Multivariate methods in rehabilitation Dimiter Dimitrov a, and Phillip D. Rumrill b a Graduate School of Education, George Mason University, 4400
CHAPTER 3 RESEARCH METHODOLOGY
 CHAPTER 3 RESEARCH METHODOLOGY 3.1 Introduction 3.1 Methodology 3.1.1 Research Design 3.1. Research Framework Design 3.1.3 Research Instrument 3.1.4 Validity of Questionnaire 3.1.5 Statistical Measurement
RESULTS. Chapter INTRODUCTION
 8.1 Chapter 8 RESULTS 8.1 INTRODUCTION The previous chapter provided a theoretical discussion of the research and statistical methodology. This chapter focuses on the interpretation and discussion of the
MMI 409 Spring 2009 Final Examination Gordon Bleil. 1. Is there a difference in depression as a function of group and drug?
 MMI 409 Spring 2009 Final Examination Gordon Bleil Table of Contents Research Scenario and General Assumptions Questions for Dataset (Questions are hyperlinked to detailed answers) 1. Is there a difference
POL 242Y Final Test (Take Home) Name
 Name") POL 242Y Final Test (Take Home) Name_ Due August 6, 2008 The take-home final test should be returned in the classroom (FE 36) by the end of the class on August 6. Students who fail to submit the final
POL 242Y Final Test (Take Home) Name_ Due August 6, 2008 The take-home final test should be returned in the classroom (FE 36) by the end of the class on August 6. Students who fail to submit the final
Regression Including the Interaction Between Quantitative Variables
 Regression Including the Interaction Between Quantitative Variables The purpose of the study was to examine the inter-relationships among social skills, the complexity of the social situation, and performance
Doing Quantitative Research 26E02900, 6 ECTS Lecture 6: Structural Equations Modeling. Olli-Pekka Kauppila Daria Kautto
 Doing Quantitative Research 26E02900, 6 ECTS Lecture 6: Structural Equations Modeling Olli-Pekka Kauppila Daria Kautto Session VI, September 20 2017 Learning objectives 1. Get familiar with the basic idea
To open a CMA file > Download and Save file Start CMA Open file from within CMA
 Example name Effect size Analysis type Level Tamiflu Hospitalized Risk ratio Basic Basic Synopsis The US government has spent 1.4 billion dollars to stockpile Tamiflu, in anticipation of a possible flu
Two-Way Independent ANOVA
 Two-Way Independent ANOVA Analysis of Variance (ANOVA) a common and robust statistical test that you can use to compare the mean scores collected from different conditions or groups in an experiment. There
Section 6: Analysing Relationships Between Variables
 6. 1 Analysing Relationships Between Variables Section 6: Analysing Relationships Between Variables Choosing a Technique The Crosstabs Procedure The Chi Square Test The Means Procedure The Correlations
CHAPTER - 6 STATISTICAL ANALYSIS. This chapter discusses inferential statistics, which use sample data to
 CHAPTER - 6 STATISTICAL ANALYSIS 6.1 Introduction This chapter discusses inferential statistics, which use sample data to make decisions or inferences about population. Populations are group of interest
Basic concepts and principles of classical test theory
 Basic concepts and principles of classical test theory Jan-Eric Gustafsson What is measurement? Assignment of numbers to aspects of individuals according to some rule. The aspect which is measured must
12/31/2016. PSY 512: Advanced Statistics for Psychological and Behavioral Research 2
 PSY 512: Advanced Statistics for Psychological and Behavioral Research 2 Introduce moderated multiple regression Continuous predictor continuous predictor Continuous predictor categorical predictor Understand
Day 11: Measures of Association and ANOVA
 Day 11: Measures of Association and ANOVA Daniel J. Mallinson School of Public Affairs Penn State Harrisburg mallinson@psu.edu PADM-HADM 503 Mallinson Day 11 November 2, 2017 1 / 45 Road map Measures of
Introduction to Quantitative Methods (SR8511) Project Report
 Project Report") Introduction to Quantitative Methods (SR8511) Project Report Exploring the variables related to and possibly affecting the consumption of alcohol by adults Student Registration number: 554561 Word counts
Introduction to Quantitative Methods (SR8511) Project Report Exploring the variables related to and possibly affecting the consumption of alcohol by adults Student Registration number: 554561 Word counts
MULTIPLE LINEAR REGRESSION 24.1 INTRODUCTION AND OBJECTIVES OBJECTIVES
 24 MULTIPLE LINEAR REGRESSION 24.1 INTRODUCTION AND OBJECTIVES In the previous chapter, simple linear regression was used when you have one independent variable and one dependent variable. This chapter
Describe what is meant by a placebo Contrast the double-blind procedure with the single-blind procedure Review the structure for organizing a memo
 Please note the page numbers listed for the Lind book may vary by a page or two depending on which version of the textbook you have. Readings: Lind 1 11 (with emphasis on chapters 10, 11) Please note chapter
Describe what is meant by a placebo Contrast the double-blind procedure with the single-blind procedure Review the structure for organizing a memo
 Business Statistics The following was provided by Dr. Suzanne Delaney, and is a comprehensive review of Business Statistics. The workshop instructor will provide relevant examples during the Skills Assessment
Analysis of Variance (ANOVA)
") Research Methods and Ethics in Psychology Week 4 Analysis of Variance (ANOVA) One Way Independent Groups ANOVA Brief revision of some important concepts To introduce the concept of familywise error rate.
Research Methods and Ethics in Psychology Week 4 Analysis of Variance (ANOVA) One Way Independent Groups ANOVA Brief revision of some important concepts To introduce the concept of familywise error rate.
THE UNIVERSITY OF SUSSEX. BSc Second Year Examination DISCOVERING STATISTICS SAMPLE PAPER INSTRUCTIONS
 C8552 THE UNIVERSITY OF SUSSEX BSc Second Year Examination DISCOVERING STATISTICS SAMPLE PAPER INSTRUCTIONS Do not, under any circumstances, remove the question paper, used or unused, from the examination
Hypothesis Testing. Richard S. Balkin, Ph.D., LPC-S, NCC
 Hypothesis Testing Richard S. Balkin, Ph.D., LPC-S, NCC Overview When we have questions about the effect of a treatment or intervention or wish to compare groups, we use hypothesis testing Parametric statistics
Unit 1 Exploring and Understanding Data
 Unit 1 Exploring and Understanding Data Area Principle Bar Chart Boxplot Conditional Distribution Dotplot Empirical Rule Five Number Summary Frequency Distribution Frequency Polygon Histogram Interquartile
APÊNDICE 6. Análise fatorial e análise de consistência interna
 APÊNDICE 6 Análise fatorial e análise de consistência interna Subescala A Missão, a Visão e os Valores A ação do diretor Factor Analysis Descriptive Statistics Mean Std. Deviation Analysis N 1 4,46 1,056
Still important ideas
 Readings: OpenStax - Chapters 1 13 & Appendix D & E (online) Plous Chapters 17 & 18 - Chapter 17: Social Influences - Chapter 18: Group Judgments and Decisions Still important ideas Contrast the measurement
Chapter 14: More Powerful Statistical Methods
 Chapter 14: More Powerful Statistical Methods Most questions will be on correlation and regression analysis, but I would like you to know just basically what cluster analysis, factor analysis, and conjoint
Statistical Techniques. Masoud Mansoury and Anas Abulfaraj
 Statistical Techniques Masoud Mansoury and Anas Abulfaraj What is Statistics? https://www.youtube.com/watch?v=lmmzj7599pw The definition of Statistics The practice or science of collecting and analyzing
THE STATSWHISPERER. Introduction to this Issue. Doing Your Data Analysis INSIDE THIS ISSUE
 Spring 20 11, Volume 1, Issue 1 THE STATSWHISPERER The StatsWhisperer Newsletter is published by staff at StatsWhisperer. Visit us at: www.statswhisperer.com Introduction to this Issue The current issue
CRITERIA FOR USE. A GRAPHICAL EXPLANATION OF BI-VARIATE (2 VARIABLE) REGRESSION ANALYSISSys
 REGRESSION ANALYSISSys") Multiple Regression Analysis 1 CRITERIA FOR USE Multiple regression analysis is used to test the effects of n independent (predictor) variables on a single dependent (criterion) variable. Regression tests
Multiple Regression Analysis 1 CRITERIA FOR USE Multiple regression analysis is used to test the effects of n independent (predictor) variables on a single dependent (criterion) variable. Regression tests
Still important ideas
 Readings: OpenStax - Chapters 1 11 + 13 & Appendix D & E (online) Plous - Chapters 2, 3, and 4 Chapter 2: Cognitive Dissonance, Chapter 3: Memory and Hindsight Bias, Chapter 4: Context Dependence Still
List of Figures. List of Tables. Preface to the Second Edition. Preface to the First Edition
 List of Figures List of Tables Preface to the Second Edition Preface to the First Edition xv xxv xxix xxxi 1 What Is R? 1 1.1 Introduction to R................................ 1 1.2 Downloading and Installing
Statistical analysis DIANA SAPLACAN 2017 * SLIDES ADAPTED BASED ON LECTURE NOTES BY ALMA LEORA CULEN
 Statistical analysis DIANA SAPLACAN 2017 * SLIDES ADAPTED BASED ON LECTURE NOTES BY ALMA LEORA CULEN Vs. 2 Background 3 There are different types of research methods to study behaviour: Descriptive: observations,
Lessons in biostatistics
 Lessons in biostatistics The test of independence Mary L. McHugh Department of Nursing, School of Health and Human Services, National University, Aero Court, San Diego, California, USA Corresponding author:
12/30/2017. PSY 5102: Advanced Statistics for Psychological and Behavioral Research 2
 PSY 5102: Advanced Statistics for Psychological and Behavioral Research 2 Selecting a statistical test Relationships among major statistical methods General Linear Model and multiple regression Special
MODULE S1 DESCRIPTIVE STATISTICS
 MODULE S1 DESCRIPTIVE STATISTICS All educators are involved in research and statistics to a degree. For this reason all educators should have a practical understanding of research design. Even if an educator
STA 3024 Spring 2013 EXAM 3 Test Form Code A UF ID #
 STA 3024 Spring 2013 Name EXAM 3 Test Form Code A UF ID # Instructions: This exam contains 34 Multiple Choice questions. Each question is worth 3 points, for a total of 102 points (there are TWO bonus
Intro to SPSS. Using SPSS through WebFAS
 Intro to SPSS Using SPSS through WebFAS http://www.yorku.ca/computing/students/labs/webfas/ Try it early (make sure it works from your computer) If you need help contact UIT Client Services Voice: 416-736-5800
Quantitative Methods in Computing Education Research (A brief overview tips and techniques)
") Quantitative Methods in Computing Education Research (A brief overview tips and techniques) Dr Judy Sheard Senior Lecturer Co-Director, Computing Education Research Group Monash University judy.sheard@monash.edu
Quantitative Methods in Computing Education Research (A brief overview tips and techniques) Dr Judy Sheard Senior Lecturer Co-Director, Computing Education Research Group Monash University judy.sheard@monash.edu
ANOVA. Thomas Elliott. January 29, 2013
 ANOVA Thomas Elliott January 29, 2013 ANOVA stands for analysis of variance and is one of the basic statistical tests we can use to find relationships between two or more variables. ANOVA compares the
Overview of Non-Parametric Statistics
 Overview of Non-Parametric Statistics LISA Short Course Series Mark Seiss, Dept. of Statistics April 7, 2009 Presentation Outline 1. Homework 2. Review of Parametric Statistics 3. Overview Non-Parametric
Research Analysis MICHAEL BERNSTEIN CS 376
 Research Analysis MICHAEL BERNSTEIN CS 376 Last time What is a statistical test? Chi-square t-test Paired t-test 2 Today ANOVA Posthoc tests Two-way ANOVA Repeated measures ANOVA 3 Recall: hypothesis testing
Basic Statistics and Data Analysis in Work psychology: Statistical Examples
 Basic Statistics and Data Analysis in Work psychology: Statistical Examples WORK PSYCHOLOGY INTRODUCTION In this chapter we examine a topic which is given too little coverage in most texts of this kind,
Comparing 3 Means- ANOVA
 Comparing 3 Means- ANOVA Evaluation Methods & Statistics- Lecture 7 Dr Benjamin Cowan Research Example- Theory of Planned Behaviour Ajzen & Fishbein (1981) One of the most prominent models of behaviour
Readings: Textbook readings: OpenStax - Chapters 1 11 Online readings: Appendix D, E & F Plous Chapters 10, 11, 12 and 14
 Readings: Textbook readings: OpenStax - Chapters 1 11 Online readings: Appendix D, E & F Plous Chapters 10, 11, 12 and 14 Still important ideas Contrast the measurement of observable actions (and/or characteristics)
Readings: Textbook readings: OpenStax - Chapters 1 13 (emphasis on Chapter 12) Online readings: Appendix D, E & F
 Online readings: Appendix D, E & F") Readings: Textbook readings: OpenStax - Chapters 1 13 (emphasis on Chapter 12) Online readings: Appendix D, E & F Plous Chapters 17 & 18 Chapter 17: Social Influences Chapter 18: Group Judgments and Decisions
Readings: Textbook readings: OpenStax - Chapters 1 13 (emphasis on Chapter 12) Online readings: Appendix D, E & F Plous Chapters 17 & 18 Chapter 17: Social Influences Chapter 18: Group Judgments and Decisions
Biology 345: Biometry Fall 2005 SONOMA STATE UNIVERSITY Lab Exercise 8 One Way ANOVA and comparisons among means Introduction
 Biology 345: Biometry Fall 2005 SONOMA STATE UNIVERSITY Lab Exercise 8 One Way ANOVA and comparisons among means Introduction In this exercise, we will conduct one-way analyses of variance using two different
Differential Item Functioning
 Differential Item Functioning Lecture #11 ICPSR Item Response Theory Workshop Lecture #11: 1of 62 Lecture Overview Detection of Differential Item Functioning (DIF) Distinguish Bias from DIF Test vs. Item
HPS301 Exam Notes- Contents
 HPS301 Exam Notes- Contents Week 1 Research Design: What characterises different approaches 1 Experimental Design 1 Key Features 1 Criteria for establishing causality 2 Validity Internal Validity 2 Threats
Reliability of Ordination Analyses
 Reliability of Ordination Analyses Objectives: Discuss Reliability Define Consistency and Accuracy Discuss Validation Methods Opening Thoughts Inference Space: What is it? Inference space can be defined
Clustering Autism Cases on Social Functioning
 Clustering Autism Cases on Social Functioning Nelson Ray and Praveen Bommannavar 1 Introduction Autism is a highly heterogeneous disorder with wide variability in social functioning. Many diagnostic and
Media, Discussion and Attitudes Technical Appendix. 6 October 2015 BBC Media Action Andrea Scavo and Hana Rohan
 Media, Discussion and Attitudes Technical Appendix 6 October 2015 BBC Media Action Andrea Scavo and Hana Rohan 1 Contents 1 BBC Media Action Programming and Conflict-Related Attitudes (Part 5a: Media and
Collecting & Making Sense of
 Collecting & Making Sense of Quantitative Data Deborah Eldredge, PhD, RN Director, Quality, Research & Magnet Recognition i Oregon Health & Science University Margo A. Halm, RN, PhD, ACNS-BC, FAHA Director,