Crossmodal classification of mu rhythm activity during. action observation and execution suggests specificity to. somatosensory features of actions.
|
|
|
- Laura Kelley
- 6 years ago
- Views:
Transcription
1 Mu rhythm crossmodal multivariate classification - 1 ABBREVIATED TITLE: Mu rhythm crossmodal multivariate classification Crossmodal classification of mu rhythm activity during action observation and execution suggests specificity to somatosensory features of actions. Michel-Pierre Coll* a,b, Clare Press c, Hannah Hobson b, Caroline Catmur d & Geoffrey Bird a,b a. Department of Experimental Psychology, University of Oxford, OX1 b. MRC Social, Genetic and Developmental Psychiatry Centre, Institute of Psychiatry, Psychology and Neuroscience, King s College London, University of London, SE5 8AF c. Department of Psychological Sciences, Birkbeck, University of London, WC1E 7HX. d Department of Psychology, Institute of Psychiatry, Psychology and Neuroscience, King s College London, University of London, SE5 8AF *Correspondance: Michel-Pierre Coll, PhD Department of Experimental Psychology, University of Oxford, 15 Parks Road, Oxford, OX1 Tel: Michel-pierre.coll@psy.ox.ac.uk Number of pages: 30 Number of figures: 6 Number of words: Abstract: 238 Introduction: 623 Discussion: 1288 Conflict of interest The authors declare no competing financial interests. Acknowledgements The authors would like to thank Chanroop Ghag for her assistance with data collection. M.P. Coll is funded by a postdoctoral fellowship from the Fonds de Recherche du Québec-Santé. 1
2 Mu rhythm crossmodal multivariate classification Abstract The alpha mu rhythm (8-13 Hz) has been considered to reflect mirror neuron activity due to the fact that it is attenuated by both action observation and action execution. The putative link between mirror neuron system activity and the mu rhythm has been used to study the involvement of the mirror system in a wide range of socio-cognitive processes and clinical disorders. However, previous research has failed to convincingly demonstrate the specificity of the mu rhythm, meaning that it is unclear whether the mu rhythm reflects mirror neuron activity. It also remains unclear if mu rhythm suppression during action observation reflects the processing of motor or tactile information. In an attempt to assess the validity of the mu rhythm as a measure of mirror neuron activity, we used crossmodal pattern classification to assess the specificity of EEG mu rhythm response to action varying in terms of action type (whole-hand or precision grip), concurrent tactile stimulation (stimulation or no stimulation), or object use (transitive or intransitive actions) in twenty human participants. The main results reveal that above-chance crossmodal classification of mu rhythm activity was obtained in the central channels for tactile stimulation and action transitivity but not for action type. Furthermore, traditional univariate analyses applied to the same data were insensitive to differences between conditions. By calling into question the relationship between mirror system activity and the mu rhythm, these results have important implications for the use and interpretation of mu rhythm activity. 2
3 Mu rhythm crossmodal multivariate classification Significance statement The central alpha mu rhythm oscillation is a widely used measure of the human mirror neuron system that has been used to make important claims concerning cognitive functioning in health and in disease. Here, we used a novel multivariate analytical approach to show that crossmodal EEG mu rhythm responses primarily index the somatosensory features of actions, suggesting that the mu rhythm is not a valid measure of mirror neuron activity. Results may lead to the revision of the conclusions of many previous studies using this measure, and to the transition towards a theory of mu rhythm function that is more consistent with current models of sensory processing in the self and in others. 3
4 Mu rhythm crossmodal multivariate classification Introduction Mirror neurons (MN), firing both during the observation and execution of actions (di Pellegrino et al., 1992), have been suggested to contribute to the understanding of others action by matching observed actions to one s own neural code to perform that action (Gallese et al., 1996). MN activity is notoriously difficult to measure non-invasively in humans given the limited spatial resolution of human neuroimaging techniques (Dinstein et al., 2008). Despite these methodological constraints, many have argued for the involvement of MN in a variety of phenomena using neuroimaging measures such as the EEG central alpha mu rhythm. The alpha mu rhythm (8-13 Hz, henceforth mu rhythm ) is an oscillation measured over sensorimotor areas that is attenuated both during the observation and execution of actions (see Fox et al., 2015). On the basis of this similar response during action observation and execution, the mu rhythm has been considered to index MN activity (Pineda, 2005; Fox et al., 2015). As a consequence, it has been used by many researchers to suggest the involvement of MN throughout development in processes such as empathy (Gallese, 2001; Cheng et al., 2008; Yang et al., 2009), theory of mind (Pineda and Hecht, 2009), speech perception (Moreno et al., 2013) and many other socio-cognitive processes (see Vanderwert et al., 2013 for a review). Furthermore, differences in mu rhythm response between clinical and typical samples have been used to suggest atypical MN response in conditions such as Autism Spectrum Disorder (Oberman et al., 2005, 2008; Bernier et al., 2007, 2013), schizophrenia (Singh et al., 2011; McCormick et al., 2012; Horan et al., 2014) and addiction (Pineda and Oberman, 2006). There are, however, two important issues with the claim that mu rhythm indexes MN activity. First, most studies do not provide a convincing demonstration of the specificity of mu rhythm response. For the mu rhythm to be considered a valid index of MN, it should show 4
5 Mu rhythm crossmodal multivariate classification crossmodal action specificity, that is that the response associated with one action should be similar whether it is observed or executed (crossmodality), but it should also be distinguishable for different actions (specificity; Kilner and Lemon, 2013; Oosterhof et al., 2013). Without demonstration of specificity, it is possible that the similarity of mu rhythm responses during action observation and execution reflects general effects of task engagement, attention, readiness to act or arousal-related activation involving non-mirror neuronal populations (Dinstein et al., 2008; Cook et al., 2014). Second, empirical evidence suggests that the mu rhythm might index sensory processing rather than motor activity (Cheyne et al., 2003; Ritter et al., 2009; Coll et al., 2015). Thus, the mu rhythm may index the observation and receipt of tactile stimulation rather than the observation and execution of actions. Given that the mu rhythm is often used to assert the involvement of MN in a variety of cognitive processes and clinical conditions, it is important to ensure its validity as an index of MN activity by verifying that it shows crossmodal specificity to observed and executed actions. Accordingly, we used crossmodal pattern classification to assess the specificity of the mu rhythm during action observation and action execution. Furthermore, the degree of tactile stimulation during action observation and execution was manipulated both by the application of a vibratory tactile stimulation to the hand and by action transitivity (whether actions were, or were not, object-directed - the former, but not the latter, generating cutaneous tactile stimulation). If the mu rhythm represents MN activity, then crossmodal classification of two different types of actions should be accurate at above-chance levels, and superior to the classification of tactile stimulation. In contrast, if the mu rhythm indexes tactile mirroring, classification accuracy should be above-chance when classifying the presence or absence of tactile stimulation, but at chance for action type. 5
6 Mu rhythm crossmodal multivariate classification Materials and methods Experimental Design The crossmodal specificity of the mu rhythm to two different actions (Action Type factor) was assessed while manipulating the amount of tactile stimulation involved in these actions in two different ways. The first manipulation related to the presence or absence of an external tactile stimulation (Vibration factor), and the second concerned whether the actions were directed towards an object or simply mimed (Transitivity factor). In order to assess the crossmodal specificity of the mu rhythm to action or stimulation type, and to maximise the number of trials that could be used for multivariate classification, we analysed the data using a fractional factorial design in which only the main effect of each condition was investigated. We therefore independently tested the effect of Action Type, Vibration and Transitivity while collapsing across the two other conditions. If the mu rhythm is specific to the action observed and executed, then the crossmodal classifier should be able to discriminate the two actions. If the mu rhythm is sensitive to differences in tactile stimulation, then the classifier should be able to discriminate between the presence and absence of the vibration and between transitive and intransitive actions. We predicted that crossmodal classification accuracy in central channels would increase with the strength of the difference in tactile stimulation in each condition and would thus follow a Vibration > Transitivity > Action Type pattern. We used three main approaches to test this crossmodal classification. First, to investigate the scalp distribution of the effects, we performed exploratory classification analyses on the time-frequency activity of the mu rhythm on each channel and its neighbours using a spatial searchlight approach (Kriegeskorte et al., 2006). Second, to visualise the neural sources contributing to the observed scalp effects, a spatial searchlight was also used on mu rhythm activity at the source level. Finally, to test the 6
7 Mu rhythm crossmodal multivariate classification claim that the central mu rhythm shows crossmodal specificity, region of interest (ROI) analyses were performed using a crossmodal classifier in a central cluster of channels selected according to the mu rhythm literature. To ensure that any crossmodal effect observed in this central cluster is specific to the central alpha mu rhythm and not confounded with the occipital alpha rhythm (Hobson and Bishop, 2016), these analyses were performed at both central and occipital scalp locations. We predicted that crossmodal classification would be observed only at the central location. Participants Twenty healthy right-handed adults (12 females) aged on average years (SD = 6.75, range = 19-49) were recruited through university-wide advertisements and gave written informed consent to take part in this study. Exclusion criteria included being over 50 years old or any reported history of neurological or psychiatric disorder. The study was approved by King s College London Psychiatry, Nursing and Midwifery Research Ethics Subcommittee and participants received an honorarium for their participation. EEG recordings EEG activity was acquired from a 61 channel (extended montage) DC-coupled recording system (Brain Products, Munich, Germany, RRID:SCR_009443). Three additional EOG electrodes were placed below the left eye and at 1 cm from the outer canthi. The sampling rate was 500 Hz, with reference at FCz and ground at AFz. Impedances were maintained below 10 kω
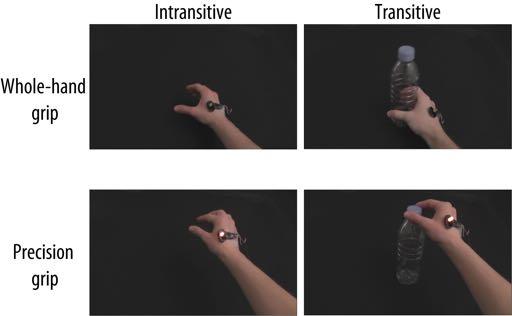
8 Mu rhythm crossmodal multivariate classification Vibration stimulator A custom-built stimulator was fixed on the back of the participant s right hand using medical tape. This stimulator consisted of two round cell phone micro vibration motors (10 x 2.7 mm) vibrating at approximately rotations per minute placed side by side on a piece of thin cardboard and sealed with black electrical tape. When the stimulator was turned on, it produced a continuous vibrating sensation on the back of the hand. A yellow LED light was placed on the top of the motors and was lit when the stimulator was turned on. The stimulator was wired into a USB relay switch and controlled by the stimuli presentation software (E-prime 2.0, Psychology Software Tools, Sharpsburg, PA, RRID:SCR:009567). The wire was fixed onto the participant s forearm with medical tape to ensure that it did not interfere with action execution during the experimental task. A second identical stimulator was placed near the participant s arm and turned on during trials in which the hand stimulator remained off in order to create a similar sound. Visual stimuli The visual stimuli consisted of 3000 ms video clips depicting a hand wearing the vibration stimulator executing one of the 6 types of actions varying according to Action Type (Precision grip, Whole-hand grip), Vibration (Vibration On, Vibration Off) and Transitivity (Transitive, Intransitive) filmed from a first-person point of view (Figure 1). During the Transitive trials, the hand was seen executing one of two actions on an empty plastic bottle placed on a black table. For the Intransitive trials, the bottle was absent from the screen and the same actions were mimed without the bottle. For Precision Grip trials, the hand started flat on the table at the right of the screen, picked up (or mimed picking up) the bottle using a thumb and index grip on the cap of the bottle and raised it approximately 15 cm before placing it back on 8
9 Mu rhythm crossmodal multivariate classification the table. For the Whole-hand Grip trials, the hand picked up (or mimed picking up) the bottle using a whole-hand grip on the body of the bottle. During Vibration On trials, the stimulator was turned on, and this was visible due to the vibration of the stimulator and the yellow LED light. During Vibration Off actions the stimulator was not turned on. All video clips were presented without sound. Two models (one female) were recorded while executing the actions to the beats of a metronome to ensure similar timing during all video clips. The models executed the actions twice for a total of 32 different stimuli (8 types x 2 models x 2 executions). The video clips were presented on a 17-inch monitor located at approximately 60 cm from the participant using the E- Prime 2.0 software (Psychology Software Tools, Sharpsburg, PA, RRID:SCR:009567) Figure 1 about here Procedure Participants sat in a dimly lit room. After giving informed consent, the EEG cap and the stimulator were installed and participants received verbatim instructions for the task. During the experimental task, participants were asked to either observe the video clips or to execute one of the six action types using the same plastic bottle as in the video clips. To ensure that the bottle did not fall during the experiment it was stabilised using a square piece of cardboard fixed at its base. A practice session was carried out during which each of the 6 action types was first observed in a video clip and then executed by the participants using the plastic bottle. During this practice session, participants experienced the vibro-tactile stimulation and observed the lighting of the LED. They were explicitly instructed that the hand in the video clips wore the same vibration stimulator, and that this hand received the same vibrating stimulation when the LED light was turned on. The practice session was repeated if necessary to ensure that all participants understood the instructions and executed the actions in a correct manner with appropriate timing. 9
10 Mu rhythm crossmodal multivariate classification After the practice session, an occlusion box was placed over the participant s arm to prevent the participant from observing his or her actions and the LED light during the experiment. Movements were monitored using a webcam placed inside this box and trials with incorrect action execution or with movement during observation were noted and removed from the analyses. All experimental conditions were blocked within mini-blocks of ten trials during which participants either executed or observed the same action type ten times. During Execution blocks, participants first saw the instructions indicating which action type should be executed (e.g. Execute, Fine OR Full Grip, With OR Without the object, With OR Without vibration) for 5000 ms followed by ten trials consisting of an 800 ms green fixation cross, a ms jittered white fixation cross and a 3000 ms green circle. Participants were instructed to blink during the instructions and the green fixation cross but to refrain from blinking for the rest of the task. Participants were told to begin executing the action as soon as they saw the green circle and to have their hand back on the table before the green circle disappeared. During Vibration On trials, the vibration stimulator was turned on during the presentation of the green circle. During Vibration Off trials, a second stimulator was turned on in order to produce a similar sound. During Observation blocks, participants received the instruction Please remain still and watch the video clips followed by ten trials consisting of the green and white fixation crosses presented for the same duration as the Execution blocks and a video clip. The stimulator was never turned on during the Observation blocks. Eight out of the 28 Observation blocks were catch blocks during which one of the ten video clips was presented with a red dot in the centre. At the end of all Observation blocks, participants saw a prompt asking them to indicate whether they saw a red dot in one of the video clips using their left hand placed on a keyboard. Catch blocks were not included in the EEG analyses. Finally, during Baseline blocks, participants were 10
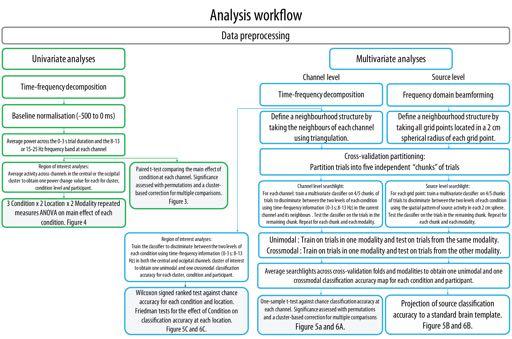
11 Mu rhythm crossmodal multivariate classification instructed to remain still and to wait for the next instruction and then observed a black screen for 21 s. Participants performed 32 execution or observation blocks of ten trials, two for each of the eight experimental condition [Vibration (On, Off) x Transitivity (Object, No Object) x Action Type (Precision, Whole-hand)]. This resulted in 160 observation and 160 execution trials that were used for analyses. Eight catch trial blocks were used to ensure continuous attention to the stimuli and were not included in the EEG analyses. Participants performed four experimental sessions in which four execution, four observation and two catch blocks were presented in a random order. Three baseline blocks were presented at the beginning, middle and end of the session. The duration of the task was approximately 60 minutes and participants were encouraged to take breaks between each session. Statistical Analyses All EEG analyses were performed with the FieldTrip (Oostenveld et al., 2011, RRID:SCR_004849) and CosMoMVPA (Oosterhof et al., 2016, RRID:SCR_014519) toolboxes within Matlab 2016a (The Mathworks Inc, Natick, MA, RRID:SCR_001622). The analyses workflow for both univariate and multivariate analyses is detailed in Figure 2. While the crossmodal specificity of the alpha band (8-13 Hz) was the main focus of this study, all analyses were also performed in the beta band (15-25 Hz) for completeness and in line with previous suggestions of a link between beta rhythm suppression and MN activity (e.g. Rossi et al., 2002)
12 Mu rhythm crossmodal multivariate classification Catch trial accuracy Responses to the prompts presented after each observation blocks were scored as 0 (miss or false alarm) or 1 (correct detection or correct rejection) and averaged in order to obtain a catch trial accuracy score for each participant. EEG preprocessing EEG data were first bandpass filtered between 1 and 50 Hz and an additional 50 Hz notch filter was used to reduce electrical noise. The data were then epoched to 3500 ms relative to the onset of the video clips or the execution cue. Epochs of the same length were also taken from the baseline periods. This led to a total of 160 observation and 160 execution trials. Independent component analyses were used to remove from the signal components that were associated with eye blinks, movements or other obvious artefacts. The data were then visually inspected and channels that were consistently bad throughout the experiment or trials with artefacts were removed from the analyses. Additionally, trials for which the participant performed the incorrect action or moved when they were not supposed to move were removed from the analyses. These procedures led to the removal of an average of 4.81% (SD =3.68, range = 2-15 %) of trials. After epoch rejection, removed channels were interpolated using the average activity of neighbouring channels. For analyses at the channel level, the time-frequency representation of the data was obtained by applying a Fourier transformation in Hanning-tapered sliding time windows with a fixed length of 500 ms and moving in steps of 50 ms. Power was calculated from 5 to 30 Hz in steps of 1 Hz. For analyses at the source level, sources were identified using Dynamic Imaging of Coherent Sources (DICS; Gross et al., 2001), a frequency domain beamforming technique. 12
13 Mu rhythm crossmodal multivariate classification Activity was source localised in a 250 to 2750 ms time window. A frequency of 10 Hz with a smoothing window of +/- 2 Hz was used for the alpha band and a frequency of 20 Hz with a smoothing window of +/- 5 Hz was used for the beta band. These time and frequency windows were selected following visual inspection of the univariate effects on the basis of those time and frequency windows which included the majority of the alpha and beta suppression. In brief, a volume conductor model was built for all participants using the boundary element method and a standard MNI template. A 10 mm-spaced dipole grid was wrapped onto the MNI brain template and a normalised lead field was calculated. DICS was performed for each trial using a common spatial filter computed from the combination of all trials and a 5% lambda regularisation parameter. This resulted in the estimation of the alpha activity at each grid point for each participant and trial. EEG analyses Univariate analyses: In order to compare the mu rhythm suppression in the current experiment to that obtained in previous studies, we first analysed our data using traditional univariate analyses. For these analyses, the average power in each condition was normalised relative to a -500 to 0 ms pre-stimulus baseline. Power was then averaged across frequency (alpha: 8-13 Hz, beta: Hz) and time ( ms). Exploratory analyses were first performed to investigate the scalp distribution of the main effect of each condition within each modality. To this end, a two-tailed paired sample t-test comparing the two levels of each condition was performed at each channel. The significance of this test was assessed using a nonparametric permutation approach in which this test was performed times on the same data with randomly permuted condition labels. P-values were obtained by taking the proportion of random tests with a test statistic equal or superior to 13
14 Mu rhythm crossmodal multivariate classification the original value and were corrected for multiple comparisons using cluster-based correction. Channel clusters were determined by including each channel s immediate neighbours using triangulation (on average 6.7 neighbours) and cluster statistics were obtained by summing the t- scores of neighbouring channels exceeding the critical value (p < 0.05; see Maris and Oostenveld (2007) for the detailed procedure). ROI analyses were performed to compare the observed effects to previous studies investigating the alpha mu rhythm suppression during action observation and execution. In line with these previous studies, ten central channels (C z, CP z) were selected for further analyses. An equivalent number of occipital channels (PO z, O1-2-z) were selected to serve as the control occipital site where no cross-modal effects were expected. The main effect of each experimental condition was calculated by taking the difference between the two levels of each of the conditions (Transitive-Intransitive, Vibration On-Vibration Off, Wholehand grip-precision grip). These differences were entered into a three-way repeated-measures ANOVA to investigate the effects of Modality (Execution, Observation), Location (Central, Occipital) and Condition (Transitivity, Vibration and Action) Figure 2 about here Multivariate pattern classification: A linear support vector machine classifier was used to perform a five-fold cross-validated classification on all trials. Subsets of trials were created for classifier input by dividing the data into five independent chunks for each modality (for a total of ten chunks) which were balanced to ensure an equal number of trials for each condition tested. A leave-one-chunk-out cross-validation was performed in which four chunks were used to train the classifier, which was then tested on an independent chunk. For each participant and 14
15 Mu rhythm crossmodal multivariate classification classification, activity within each trial was normalised across all trials in the training set using a z-score transformation and the same normalisation parameters were used to normalise trials of the testing set. Note that for each classification, all trials in one modality were included since all trials belonged to one of the two levels of each experimental condition. With this approach, at least 135 trials were used for classification (Mean = , SD = 6.32 range ) depending on the number of trials left after artefact rejection. There was no significant difference in the number of trials included in each condition as confirmed with a 2 (Execution, Observation) x 3 Condition (Vibration, Action Type, Transitivity) repeated measures ANOVA performed on the number of trials left after artefact rejection (all ps > 0.60). Classification was first performed within modality (unimodal classification), to ensure that the mu rhythm response for each condition was distinguishable within modality. For the unimodal classification analysis, the classifier was trained and tested on trials of the same modality (Execution or Observation). Then, for the crossmodal classification analysis, the classifier was trained on four chunks from one modality and tested on a chunk of trials of the opposite modality. This procedure was repeated five times for each modality, condition and location. The mean crossmodal classification accuracies for each modality as well as Friedman tests carried out on the classification accuracies in the clusters of interest suggested a similar pattern of results for both modalities. The accuracies obtained were thus averaged across modalities to obtain one classification accuracy for each participant, condition and location for both unimodal and crossmodal classifications. At the channel level, the classifier was trained to use the three dimensions of the data, that is time (0-3 s in bins of 50 ms; 61 time bins), frequency (8-13 Hz or Hz, in bins of 1 Hz; 6 or 11 frequency bins) and location (on average 6.7 channels in the neighbourhood structure 15
16 Mu rhythm crossmodal multivariate classification for searchlights or 10 channels in the clusters of interest for regions of interest analysis), to discriminate between the two levels of each main effect (Transitive vs Intransitive, Precision grip vs Whole-hand Grip, Vibration on vs Vibration off). For the whole-scalp spatial searchlight analysis, the same neighbourhood structure as used in the univariate analysis was used. Classification was thus performed at each channel using all time-frequency information from this channel and its neighbours (on average 6.7 neighbours; see Tucciarelli et al., 2015; Turella et al., 2016 for a similar approach but in time-frequency-sensor space using MEG). This resulted in classification accuracy maps showing classification accuracy at each channel for each condition and participant. Maps in each condition were submitted to a one-sample t-test against chance accuracy (50%) at the group level and the significance of this test was assessed using the same permutation procedure used for univariate whole-scalp analysis (see section Univariate analyses). For the ROI analyses at the channel level, the same time-frequency dimensions were used, but the classifier was applied separately on two clusters of ten central channels and ten occipital channels of interest. Classification accuracy in each condition and location was compared against chance using a Wilcoxon signed rank test contrasting classification performance with chance accuracy of 0.5 (Carlson et al., 2013; Ritchie et al., 2015). The main effect of Condition (Vibration, Action Type, Transitivity) was assessed separately at the central and occipital channels using the Friedman test of differences. At the source level, the classifier was trained to discriminate between the two levels of each main condition by using the spatial pattern of source activity. A spatial searchlight approach was used by building a neighbourhood structure using all grid points within a sphere with a radius of 2 cm from each grid point (on average 28.6 neighbours). Classification was then performed at each grid point and its neighbours. Classification accuracies in source space were 16
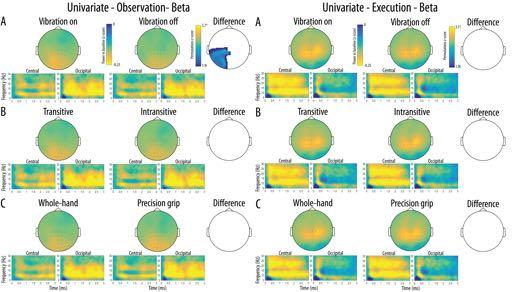
17 Mu rhythm crossmodal multivariate classification projected to a standard MNI template for visualisation. Source accuracy maps in each condition were submitted to a one-sample t-test against chance accuracy (50%) at the group level and the significance of this test was assessed using the same permutation procedure used for univariate whole-scalp analysis (see section Univariate analyses). Results Catch trials accuracy The average detection accuracy was % (SD = 3.18%, range = %) indicating that participants correctly identified the presence of the catch trial cue on the majority of presentations. Univariate analyses Scalp distribution of the mu rhythm suppression in the alpha band as well as a timefrequency representation of this suppression in each cluster of interest are shown in Figure 3. The whole-scalp analyses of the alpha mu rhythm suppression performed in the observation modality revealed significant main effects of Transitivity at a central left cluster of channels indicating stronger mu suppression for the observation of transitive movements relative to the observation of intransitive movements. No significant main effects of Vibration and Action Type were found during observation. The same analyses performed in the execution modality showed significant main effects of Vibration and Transitivity. These effects indicated significantly stronger suppression for vibration on trials relative to vibration off trials in a large frontal-right cluster of channels as well as significantly stronger suppression for executed intransitive trials relative to transitive trials in a cluster of left central and parieto-occipital channels. No significant main effect of Action Type was found during execution Figure 3 and 4 about here
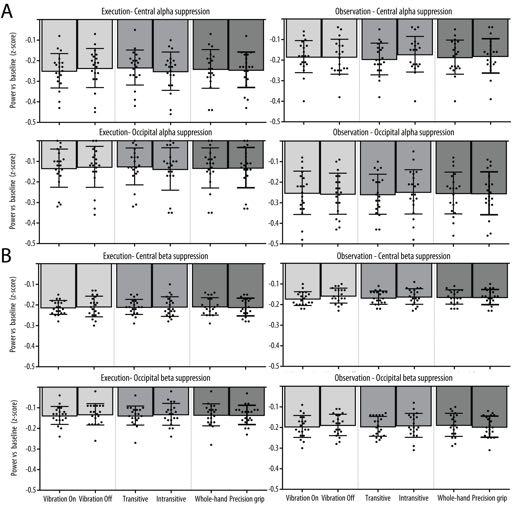
18 Mu rhythm crossmodal multivariate classification Mu rhythm suppression at each level of the three main experimental conditions at the central and occipital clusters of interest are shown in Figure 5A. The three-way repeated measures ANOVA revealed a significant Modality x Location interaction [F(1, 19) = 5.03, p = 0.037, η 2 p = 0.21] indicating that the overall effect of the experimental conditions was stronger at the central relative to the occipital location in the observation modality but not in the execution modality. There was also a significant Modality x Type interaction [F(2, 38) = 5.70, p = 0.012, η 2 p = 0.23] due to the fact that in the Transitive condition, transitive trials led to a stronger mu suppression relative to intransitive trials during observation, but the opposite effect was present during execution. There was no significant main effects of Modality, Location or Type and no other interaction reached significance (all ps > 0.05). Scalp distribution of the mu-rhythm suppression in the beta band as well as a timefrequency representation of this suppression in each cluster of interest are shown in Figure 4. The whole-scalp analyses of the beta rhythm suppression performed in the observation modality revealed significant main effects of Vibration in a large cluster of channels over the posterior left hemisphere, indicating stronger beta suppression for the observation of movements with a concurrent vibration compared to the observation of movements without concurrent vibration. The same analyses performed in the execution modality did not show any univariate difference between the conditions. Mu-rhythm suppression in the beta band at each level of the three main experimental conditions at the central and occipital clusters of interest are shown in Figure 5B. The three-way repeated measures ANOVA revealed a significant Modality x Location interaction [F(1, 19) = , p = 0.027, η p = 0.23] indicating that the overall effect of the experimental conditions on beta suppression was stronger for the execution modality relative to observation at the central 18
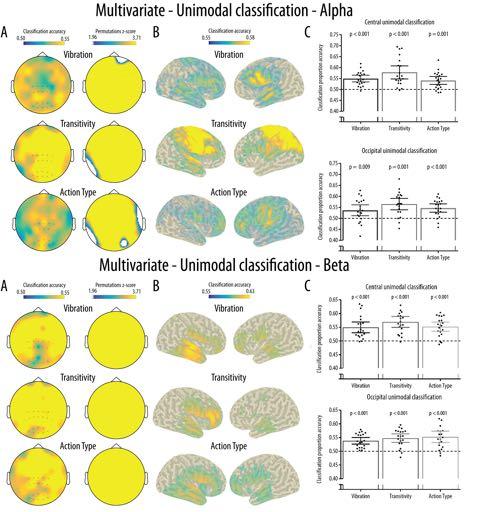
19 Mu rhythm crossmodal multivariate classification location, while the opposite effect of modality was observed at the occipital location. There was no significant main effects of Modality, Location or Type and no other interaction reached significance (all ps > 0.05) Figure 5 about here Multivariate pattern classification Unimodal classification: As shown in Figure 5A, the spatial searchlight analysis performed at the channel level revealed widespread above-chance unimodal classification accuracy across all channels for the three experimental conditions in both the alpha and beta band. As shown in Figure 5B, classification at the source level for the alpha band suggested that widespread sources mainly located in the frontal and parietal areas were responsible for the unimodal classification in all three conditions. Permutation analyses indicated that all these sources showed significantly above chance classification. This was reflected in the ROI analyses in which Wilcoxon signed-rank tests revealed significantly above-chance classification accuracy for all conditions at both the central and occipital electrode clusters (see Figure 6C for p-values). Friedman tests indicated that there was a significant effect of Condition at the central cluster [χ 2 (2) = 6.40, p = 0.041] due to a significantly higher unimodal classification accuracy in the Transitivity compared to the Action Type manipulation (p = 0.037). There was no significant effect of Condition at the occipital cluster [χ 2 (2) = 2.45, p = 0.293]. For the beta band, sources mainly located in the frontal and temporal areas showed significantly above chance classification and were responsible for the unimodal classification in all three conditions. ROI analyses using Wilcoxon signed-rank tests revealed significantly above-chance classification accuracy for all conditions at both the central and occipital electrode clusters (see Figure 6C for p-values). 19
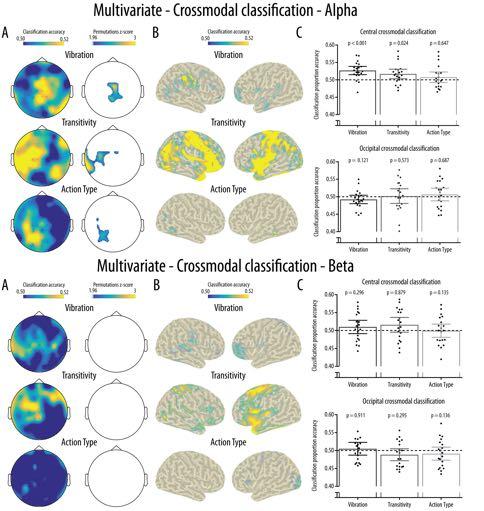
20 Mu rhythm crossmodal multivariate classification Friedman tests indicated that there was no significant effect of Condition at the central [ χ2(2) = 1.80, p = 0.091] or occipital cluster [χ2(2) = 1.30, p = 0.522] Figure 5 about here Crossmodal classification: For the alpha band, the spatial searchlight analysis performed at the channel level revealed clusters of channels showing above-chance crossmodal classification accuracy for the three experimental conditions (Figure 7A). For the Vibration condition, this cluster covered mainly central channels, for the Transitivity the significant cluster covered left central and temporal channels while a cluster of left parieto-occipital channels showed above-chance classification in the Action Type condition. The crossmodal classification accuracy at the source level is shown in Figure 7B for visualisation purposes it should be noted that the permutation analyses indicated that classification was not significantly above chance at the source level. Regardless of significance, source level analyses suggested that for the Vibration condition a right parietal cluster partly covering the somatosensory cortex contributed most to the crossmodal classification. In the Transitivity condition, sources generating the crossmodal classification were widely distributed mainly over fronto-parietal areas. Finally, for the Action Type condition, small clusters located over temporal and occipital areas showed above-chance cross-modal classification. As shown in Figure 7C, the ROI analyses revealed that significantly above-chance crossmodal classification accuracy was reached only in the Vibration and Transitivity conditions and only at the central cluster. This was confirmed by Friedman tests showing a significant main effect of Condition at the central cluster [ χ 2 (2) = 9.10, p = 0.011] but not at the occipital cluster [ χ 2 (2) = 0.90, p = 0.638]. At the central cluster, this effect was due to 20
21 Mu rhythm crossmodal multivariate classification significantly higher classification in the Vibration condition compared to the Action Type condition (p = 0.025) while there was no other pairwise difference between the conditions (all ps > 0.18). The crossmodal classification performed in the beta band did not indicate any significantly above-chance classification in the searchlight analysis performed at the channel level (Figure 7A), at the source level (Figure 7B) or in the ROI analyses (Figure 7C) Figure 7 about here Discussion The present study examined the validity of the claim that the EEG mu rhythm is a valid index of MN activity by testing for the presence of crossmodal specificity in response to observed and executed actions. Moreover, it assessed the alternative prediction that the mu rhythm demonstrates crossmodal and specific responses to the observation and receipt of tactile stimulation. This was achieved using a multivariate crossmodal classification approach to test whether the central mu rhythm contains sufficient crossmodal information to discriminate between two different types of actions, between the presence or absence of tactile stimulation, and between transitive and intransitive actions. Results from the crossmodal classification of mu rhythm response at the channel level were as predicted by the tactile stimulation account, and support the idea that the central mu rhythm shows crossmodal specificity primarily for the somatosensory features of observed and executed action. While exploratory searchlight analyses indicated significant crossmodal classification for all conditions, central channels contributed mostly to the classification of 21
22 Mu rhythm crossmodal multivariate classification conditions showing strong variation in tactile features. Crossmodal classification of action type was achieved for alpha-band activity that is not central, and not likely to be reflective of mirror neuron system activity. Mu suppression experiments investigating mirror neuron processes commonly consider changes in activity at the central sites to be reflective of mirror neuron system activity. The results from the ROI analyses in the current study strongly suggest that responsivity at these sites is not in keeping with mirror neuron accounts of central mu suppression. This was supported by a priori region of interest analyses performed at a cluster of central channels which revealed above-chance crossmodal classification only for the tactile stimulation and transitivity conditions, and significantly higher classification accuracy for the presence of tactile stimulation relative to the type of action. The same analysis performed at the control occipital channels did not indicate any significant classification. The crossmodal specificity of the mu rhythm to somatosensory features of actions suggests that the central mu rhythm response to action observation and execution observed in the current and previous studies might be better explained by sensory processing rather than motor mirroring (Dinstein et al., 2008; Cook et al., 2014; Coll et al., 2015). It should be noted however, that the preceding studies reported the results of univariate analyses, rather than multivariate analyses. While this is, as far as we are aware, the first study to investigate the crossmodal specificity of mu rhythm responses using multivariate classification, it is not the first to suggest that the crossmodal mu rhythm response indexes somatosensory features of action rather than action type (Coll et al., 2015). The association of the mu rhythm with sensory processing has also been demonstrated by several previous studies. The central alpha mu rhythm is known to be modulated by somatosensory attention (Jones et al., 2010; Anderson and Ding, 2011), and prestimulation mu rhythm activity can reliably predict the detection of a somatosensory stimulus 22
23 Mu rhythm crossmodal multivariate classification (Linkenkaer-Hansen and Nikulin, 2004). Previous studies using fmri or source localisation also indicate that the mu rhythm can be associated with the activity of the somatosensory cortices (Hari et al., 1998; Cheyne et al., 2003; Ritter et al., 2009; Arnstein et al., 2011) and is responsive to the observation of tactile stimulation (Muthukumaraswamy and Johnson, 2004; Coll et al., 2015). In line with this previous research, we found above-chance crossmodal classification accuracy when the classifier was used to discriminate between the presence or absence of tactile stimulation in the self or in the other in central channels, and this accuracy was significantly higher than for classification of action types. The source analyses performed in the current experiment did not reveal any significantly above-chance crossmodal classification at the source level. This should be interpreted with caution given that the relatively sparse EEG montage used and the lack of individual anatomical information make these statistical analyses highly conservative. The visualisation of crossmodal classification accuracy at the source level nevertheless suggests that crossmodal classification of the mu rhythm response to tactile stimulation and transitivity was driven by fronto-parietal sources including somatosensory areas. The unimodal classification results obtained in the current study suggest that the unimodal mu rhythm response shows little specificity. Indeed, classifiers trained and tested on trials of the same modality showed widespread above-chance classification at both channel and source levels. Indirect evidence for the lack of spatial and functional specificity of the mu rhythm response is also present in a recent meta-analysis of mu rhythm suppression studies. Fox and collaborators analysed 85 studies and found that, across these studies, mu rhythm suppression did not show many of the properties of MN activity, such as preference for object-directed movement or biological motion. In addition, the effect size of alpha suppression compared to baseline during action observation was not found to be greater at central electrodes compared to 23
24 Mu rhythm crossmodal multivariate classification occipital electrodes, suggesting that the contribution of the occipital alpha rhythm might explain many of the effects reported in the literature (Fox et al., 2015; Hobson and Bishop, 2016). To compare the results obtained from the multivariate pattern classification to the results obtained in previous studies, we also performed a univariate analysis of mu rhythm suppression relative to baseline for the same experimental conditions by averaging activity over all timefrequency bins. When comparing the average mu rhythm suppression relative to baseline, we found similar suppression effects in terms of effect size and location compared to previous studies (see Fox et al., 2015 for a meta-analysis). However, this analysis showed that alpha rhythm suppression was not specific to the central electrodes and was relatively insensitive to differences between conditions. These results suggest that the analytical approach used in previous research is inadequate to detect the specificity of crossmodal mu rhythm responses and is insensitive to subtle differences between conditions. This was to be expected considering that, by averaging over all features of the data, this approach does not take into account differences in multivariate patterns that can differ between conditions and participants. This is also in line with a recent high-powered preregistered report indicating that mu rhythm suppression effects found using this analytical approach are weak and unreliable (Hobson and Bishop, 2016). While not the primary focus of the study, activity in the beta band was submitted to the same analyses as the alpha mu rhythm. Beta activity has also been previously associated with MN activity although less frequently than the alpha mu rhythm (Muthukumaraswamy and Singh, 2008; Rossi et al., 2002). Here, beta activity was shown to contain unimodal information on the different experimental conditions. This is in line with previous studies using a similar analytical approach showing that beta activity can be used to classify observed (Tucciarelli et al., 2015) or executed actions (Turella et al., 2016). However, the crossmodal classification of beta activity 24
25 Mu rhythm crossmodal multivariate classification was at chance level in all conditions. The current results therefore suggest that beta rhythm suppression during action observation and action execution does not show crossmodal action specificity. Limitations to this study need to be acknowledged. First, it should be noted that the crossmodal classification approach used in the current study could be quite conservative, and that it might therefore lack the sensitivity to detect central crossmodal mu rhythm responses to the motor features of the observed actions. It should also be noted that EEG activity represents a superposition of the activity of large neuronal populations and channel level analyses might lack the spatial specificity to demonstrate crossmodal classification of weaker effects. Therefore, even though crossmodal classification at the central channels was clearly higher for sensory features of actions, the absence of crossmodal classification for action types cannot be interpreted as the absence of crossmodal specificity for observed and executed actions in the mu rhythm response. In conclusion, we have shown that the central alpha mu rhythm shows crossmodal specificity primarily for the observation and receipt of a tactile stimulation and that multivariate pattern classification is more sensitive to subtle differences between conditions than univariate analyses. This is to our knowledge the first study to use multivariate pattern classification to assess the crossmodal specificity of EEG responses. Combined with other sources of evidence, they question the appropriateness of mu rhythm suppression as a measure of MN activity and suggest that multivariate crossmodal analyses are needed to adequately study this relationship in the future. This study, and others, support the idea that a new framework is needed to explain the significance of the central mu rhythm for social perception in health and in disease, and that the search for this new framework should be directed away from a simplistic matching between mu 25
26 Mu rhythm crossmodal multivariate classification rhythm suppression and MN activity and employ methodologies that are able to take into account the multivariate nature of EEG data. 26
27 Mu rhythm crossmodal multivariate classification References Anderson KL, Ding M (2011) Attentional modulation of the somatosensory mu rhythm. Neuroscience 180: Arnstein D, Cui F, Keysers C, Maurits NM, Gazzola V (2011) -Suppression during Action Observation and Execution Correlates with BOLD in Dorsal Premotor, Inferior Parietal, and SI Cortices. J Neurosci 31: Bernier R, Aaronson B, McPartland J (2013) The role of imitation in the observed heterogeneity in EEG mu rhythm in autism and typical development. Brain Cognition 82: Bernier R, Dawson G, Webb S, Murias M (2007) EEG mu rhythm and imitation impairments in individuals with autism spectrum disorder. Brain Cognition 64: Carlson T, Tovar D, Alink A, Kriegeskorte N (2013) Representational dynamics of object vision: The first 1000 ms. J Vis 13:1 19. Cheng Y, Lee PL, Yang CY, Lin CP, Hung D, Decety J (2008) Gender differences in the mu rhythm of the human mirror-neuron system. PLoS One 3:1 7. Cheyne D, Gaetz W, Garnero L, Lachaux JP, Ducorps A, Schwartz D, Varela FJ (2003) Neuromagnetic imaging of cortical oscillations accompanying tactile stimulation. Cog Brain Res 17: Coll M-P, Bird G, Catmur C, Press C (2015) Cross-modal repetition effects in the mu rhythm indicate tactile mirroring during action observation. Cortex 63: Cook R, Bird G, Catmur C, Press C, Heyes C (2014) Mirror neurons: from origin to function. Behav Brain Sci 37: Dinstein I, Thomas C, Behrmann M, Heeger DJ (2008) A mirror up to nature. Curr Biol 18:
28 Mu rhythm crossmodal multivariate classification Fox NA, Bakermans-Kranenburg MJ, Yoo KH, Bowman LC, Cannon EN, Vanderwert RE, Ferrari PF, van IJzendoorn MH (2015) Assessing Human Mirror Activity With EEG Mu Rhythm: A Meta-Analysis. Psychol Bull 142: Gallese V (2001) The shared manifold'hypothesis. From mirror neurons to empathy. Journal of consciousness studies 8: Gross J, Kujala J, Hamalainen M, Timmermann L, Schnitzler A, Salmelin R (2001) Dynamic imaging of coherent sources: Studying neural interactions in the human brain. Proc Natl Acad Sci U S A 98: Gallese V, Fadiga L, Fogassi L, Rizzolatti G (1996) Action recognition in the premotor cortex. Brain 119: Hari R, Forss N, Avikainen S, Kirveskari E, Salenius S, Rizzolatti G (1998) Activation of human primary motor cortex during action observation: a neuromagnetic study. P Natl Acad Sci USA 95: Hobson HM, Bishop DVM (2016) Mu suppression a good measure of the human mirror neuron system? Cortex 82: Horan WP, Pineda J a., Wynn JK, Iacoboni M, Green MF (2014) Some markers of mirroring appear intact in schizophrenia: evidence from mu suppression. Cogn Affect Behav Neurosci 14: Jones SR, Kerr CE, Wan Q, Pritchett DL, Hämäläinen M, Moore CI (2010) Cued spatial attention drives functionally relevant modulation of the mu rhythm in primary somatosensory cortex. J Neurosci 30: Kilner JM, Lemon RN (2013) What we know currently about mirror neurons. Curr Biol 23:R1057-R
29 Mu rhythm crossmodal multivariate classification Kriegeskorte N, Goebel R, Bandettini P (2006) Information-based functional brain mapping. Proc Natl Acad Sci USA 103: Linkenkaer-Hansen K, Nikulin VV (2004) Prestimulus oscillations enhance psychophysical performance in humans. J Neurosci 24: Maris E, Oostenveld R (2007) Nonparametric statistical testing of EEG- and MEG-data. J Neurosci Methods 164: McCormick LM, Brumm MC, Beadle JN (2012) Mirror neuron function, psychosis, and empathy in schizophrenia. Psychiat Res: Neuroim 201: Moreno I, de Vega M, León I (2013) Understanding action language modulates oscillatory mu and beta rhythms in the same way as observing actions. Brain Cogn 82: Muthukumaraswamy SD, Johnson BW (2004) Changes in rolandic mu rhythm during observation of a precision grip. Psychophysiology 41: Muthukumaraswamy SD, Singh KD (2008) Modulation of the human mirror neuron system during cognitive activity. Psychophysiology 45: Oberman LM, Hubbard EM, McCleery JP, Altschuler EL, Ramachandran VS, Pineda J a. (2005) EEG evidence for mirror neuron dysfunction in autism spectrum disorders. Cog Brain Res 24: Oberman LM, Ramachandran VS, Pineda JA (2008) Modulation of mu suppression in children with autism spectrum disorders in response to familiar or unfamiliar stimuli: the mirror neuron hypothesis. Neuropsychologia 46: Oostenveld R, Fries P, Maris E, Schoffelen JM (2011) FieldTrip: Open source software for advanced analysis of MEG, EEG, and invasive electrophysiological data. Comput Intell Neurosci 2011 Available at: 29
30 Mu rhythm crossmodal multivariate classification Oosterhof NN, Connolly AC, Haxby JV (2016) CoSMoMVPA : multi-modal multivariate pattern analysis of neuroimaging data in Matlab / GNU Octave. biorxiv Available at: Oosterhof NN, Tipper SP, Downing PE (2013) Crossmodal and action-specific: Neuroimaging the human mirror neuron system. Trends Cogn Sci 17: Pineda JA. (2005) The functional significance of mu rhythms: Translating seeing and hearing into doing. Brain Res Rev 50: Pineda JA., Oberman LM (2006) What goads cigarette smokers to smoke? Neural adaptation and the mirror neuron system. Brain Res 1121: Pineda JA, Hecht E (2009) Mirroring and mu rhythm involvement in social cognition: Are there dissociable subcomponents of theory of mind? Biol Psychol 80: Ritchie JB, Tovar DA, Carlson TA (2015) Emerging Object Representations in the Visual System Predict Reaction Times for Categorization. PLoS Comput Biol 11:1 18. Ritter P, Moosmann M, Villringer A (2009) Rolandic alpha and beta EEG rhythms strengths are inversely related to fmri-bold signal in primary somatosensory and motor cortex. Hum Brain Mapp 30: Rossi S, Tecchio F, Pasqualetti P, Ulivelli M, Pizzella V, Romani GL, Passero S, Battistini N, Rossini PM (2002) Somatosensory processing during movement observation in humans. Clin Neurophysiol 113: Singh F, Pineda J, Cadenhead KS (2011) Association of impaired EEG mu wave suppression, negative symptoms and social functioning in biological motion processing in first episode of psychosis. Schizophr Res 130: Tucciarelli R, Turella L, Oosterhof NN, Weisz N, Lingnau A (2015) MEG Multivariate Analysis 30
31 Mu rhythm crossmodal multivariate classification Reveals Early Abstract Action Representations in the Lateral Occipitotemporal Cortex. Journal of Neuroscience 35: Turella L, Tucciarelli R, Oosterhof NN, Weisz N, Rumiati R, Lingnau A (2016) Beta band modulations underlie action representations for movement planning. Neuroimage 136: Vanderwert RE, Fox NA, Ferrari PF (2013) The mirror mechanism and mu rhythm in social development. Neurosci Lett 540: Yang CY, Decety J, Lee S, Chen C, Cheng Y (2009) Gender differences in the mu rhythm during empathy for pain: An electroencephalographic study. Brain Res 1251:
32 Mu rhythm crossmodal multivariate classification Legends Figure 1. Frames from the visual stimuli illustrating the different types of action observed or executed by the participants. Participants either performed a Transitive (right column) or an Intransitive (left column) Whole-hand grip (top row) or Precision grip (bottom row). These actions were observed and performed with the Vibration device on (bottom row) or the Vibration device off (top row). Figure 2. Schematic illustration of the analysis workflow for the univariate analyses (green borders) and the multivariate analyses (blue borders) performed at the channel and source levels. White boxes indicate analyses performed at the subject level while grayed out boxes indicate analyses performed at the group level Figure 3. Scalp distribution of the alpha mu rhythm suppression relative to baseline for the two levels of each Condition (A- Vibration, B-Transitivity, C-Action type) as a function of Modality (Execution; Left; Observation; Right). The difference maps show clusters of channels with significant main effects surviving correction for multiple comparisons for each Condition and Modality. Time-frequency plots show the time course of frequency activity at the central and occipital clusters of interest. Channels included in these clusters are marked on the scalp maps Figure 4. Scalp distribution of the beta suppression relative to baseline for the two levels of each Condition (A- Vibration, B-Transitivity, C-Action type) as a function of Modality (Execution; Left; Observation; Right). The difference map show clusters of channels with significant main effects surviving correction for multiple comparisons for each Condition and Modality. Timefrequency plots show the time course of frequency activity at the central and occipital clusters of interest. Channels included in these clusters are marked on the scalp maps. 32
33 Mu rhythm crossmodal multivariate classification Figure 5. Mean (A) alpha and (B) beta suppression relative to baseline for the two levels of each Condition (Vibration, Transitivity, Action type) as a function of Modality (Execution; Left, Observation; Right) and Location (Central; left column, Occipital; right column). Error bars 95 % confidence interval and the black dots show the mean suppression for each subject. 33
34 Mu rhythm crossmodal multivariate classification Figure 6. Results for the multivariate unimodal classification for the alpha (top) and beta (bottom) bands. (A) Results from the searchlight analyses at the channel level and maps showing cluster of channels with classification accuracy significantly above-chance (0.50) and surviving correction for multiple comparisons. (B) Classification accuracy for the searchlight analyses performed at the source level. Only grid points with accuracy above the 95% of the maximum accuracy were projected to the scalp for visualisation purposes. All grid points projected show significantly above-chance accuracy. (C) Mean and distribution of classification accuracy as a function of Condition and Location for the classification performed in the central and occipital clusters of interest. The dotted line illustrates chance classification accuracy (0.5), the error bars show the 95% confidence interval and the black dots show the mean classification accuracy for each participant Figure 7. Results for the multivariate unimodal classification for the alpha (top) and beta (bottom) bands. (A) Results from the searchlight analyses at the channel level and maps showing clusters of channels with classification accuracy significantly above-chance (0.50) and surviving correction for multiple comparisons. (B) Classification accuracy for the searchlight analyses performed at the source level. Only grid points with accuracy above the 95% of the maximum accuracy were projected to the scalp for visualisation purposes. Crossmodal classification at the source level is illustrated for visualisation purposes only as no grid points projected showed significantly above-chance accuracy. (C) Mean and distribution of classification accuracy as a function of Condition and Location for the classification performed in the central and occipital clusters of interest. The dotted line illustrates chance classification accuracy (0.5), the error bars show the 95% confidence interval and the black dots show the mean classification accuracy for 686 each participant. 34
35
36
37
38
39
40
41
Title of Thesis. Study on Audiovisual Integration in Young and Elderly Adults by Event-Related Potential
 Title of Thesis Study on Audiovisual Integration in Young and Elderly Adults by Event-Related Potential 2014 September Yang Weiping The Graduate School of Natural Science and Technology (Doctor s Course)
Mirror Neurons in Primates, Humans, and Implications for Neuropsychiatric Disorders
 Mirror Neurons in Primates, Humans, and Implications for Neuropsychiatric Disorders Fiza Singh, M.D. H.S. Assistant Clinical Professor of Psychiatry UCSD School of Medicine VA San Diego Healthcare System
Supplementary material
 Supplementary material S1. Event-related potentials Event-related potentials (ERPs) were calculated for stimuli for each visual field (mean of low, medium and high spatial frequency stimuli). For each
Supporting Information
 Supporting Information ten Oever and Sack 10.1073/pnas.1517519112 SI Materials and Methods Experiment 1. Participants. A total of 20 participants (9 male; age range 18 32 y; mean age 25 y) participated
Supplementary materials for: Executive control processes underlying multi- item working memory
 Supplementary materials for: Executive control processes underlying multi- item working memory Antonio H. Lara & Jonathan D. Wallis Supplementary Figure 1 Supplementary Figure 1. Behavioral measures of
Brain Computer Interface. Mina Mikhail
 Brain Computer Interface Mina Mikhail minamohebn@gmail.com Introduction Ways for controlling computers Keyboard Mouse Voice Gestures Ways for communicating with people Talking Writing Gestures Problem
Oscillations: From Neuron to MEG
 Oscillations: From Neuron to MEG Educational Symposium, MEG UK 2014, Nottingham, Jan 8th 2014 Krish Singh CUBRIC, School of Psychology Cardiff University What are we trying to achieve? Bridge the gap from
Interference with spatial working memory: An eye movement is more than a shift of attention
 Psychonomic Bulletin & Review 2004, 11 (3), 488-494 Interference with spatial working memory: An eye movement is more than a shift of attention BONNIE M. LAWRENCE Washington University School of Medicine,
Neural Correlates of Human Cognitive Function:
 Neural Correlates of Human Cognitive Function: A Comparison of Electrophysiological and Other Neuroimaging Approaches Leun J. Otten Institute of Cognitive Neuroscience & Department of Psychology University
Towards natural human computer interaction in BCI
 Towards natural human computer interaction in BCI Ian Daly 1 (Student) and Slawomir J Nasuto 1 and Kevin Warwick 1 Abstract. BCI systems require correct classification of signals interpreted from the brain
Social Cognition and the Mirror Neuron System of the Brain
 Motivating Questions Social Cognition and the Mirror Neuron System of the Brain Jaime A. Pineda, Ph.D. Cognitive Neuroscience Laboratory COGS1 class How do our brains perceive the mental states of others
The role of amplitude, phase, and rhythmicity of neural oscillations in top-down control of cognition
 The role of amplitude, phase, and rhythmicity of neural oscillations in top-down control of cognition Chair: Jason Samaha, University of Wisconsin-Madison Co-Chair: Ali Mazaheri, University of Birmingham
SUPPLEMENTARY INFORMATION. Table 1 Patient characteristics Preoperative. language testing
 Categorical Speech Representation in the Human Superior Temporal Gyrus Edward F. Chang, Jochem W. Rieger, Keith D. Johnson, Mitchel S. Berger, Nicholas M. Barbaro, Robert T. Knight SUPPLEMENTARY INFORMATION
Outline of Talk. Introduction to EEG and Event Related Potentials. Key points. My path to EEG
 Outline of Talk Introduction to EEG and Event Related Potentials Shafali Spurling Jeste Assistant Professor in Psychiatry and Neurology UCLA Center for Autism Research and Treatment Basic definitions and
Description of the Spectro-temporal unfolding of temporal orienting of attention.
 Description of the Spectro-temporal unfolding of temporal orienting of attention. All behaviors unfold over time; therefore, our ability to perceive and adapt our behavior according to the temporal constraints
NeuroSky s esense Meters and Detection of Mental State
 NeuroSky s esense Meters and Detection of Mental State The Attention and Meditation esense meters output by NeuroSky s MindSet are comprised of a complex combination of artifact rejection and data classification
DATA MANAGEMENT & TYPES OF ANALYSES OFTEN USED. Dennis L. Molfese University of Nebraska - Lincoln
 DATA MANAGEMENT & TYPES OF ANALYSES OFTEN USED Dennis L. Molfese University of Nebraska - Lincoln 1 DATA MANAGEMENT Backups Storage Identification Analyses 2 Data Analysis Pre-processing Statistical Analysis
CS/NEUR125 Brains, Minds, and Machines. Due: Friday, April 14
 CS/NEUR125 Brains, Minds, and Machines Assignment 5: Neural mechanisms of object-based attention Due: Friday, April 14 This Assignment is a guided reading of the 2014 paper, Neural Mechanisms of Object-Based
The EEG Analysis of Auditory Emotional Stimuli Perception in TBI Patients with Different SCG Score
 Open Journal of Modern Neurosurgery, 2014, 4, 81-96 Published Online April 2014 in SciRes. http://www.scirp.org/journal/ojmn http://dx.doi.org/10.4236/ojmn.2014.42017 The EEG Analysis of Auditory Emotional
Early posterior ERP components do not reflect the control of attentional shifts toward expected peripheral events
 Psychophysiology, 40 (2003), 827 831. Blackwell Publishing Inc. Printed in the USA. Copyright r 2003 Society for Psychophysiological Research BRIEF REPT Early posterior ERP components do not reflect the
EEG Analysis on Brain.fm (Focus)
") EEG Analysis on Brain.fm (Focus) Introduction 17 subjects were tested to measure effects of a Brain.fm focus session on cognition. With 4 additional subjects, we recorded EEG data during baseline and while
EEG Analysis on Brain.fm (Focus) Introduction 17 subjects were tested to measure effects of a Brain.fm focus session on cognition. With 4 additional subjects, we recorded EEG data during baseline and while
The impact of numeration on visual attention during a psychophysical task; An ERP study
 The impact of numeration on visual attention during a psychophysical task; An ERP study Armita Faghani Jadidi, Raheleh Davoodi, Mohammad Hassan Moradi Department of Biomedical Engineering Amirkabir University
Working with EEG/ERP data. Sara Bögels Max Planck Institute for Psycholinguistics
 Working with EEG/ERP data Sara Bögels Max Planck Institute for Psycholinguistics Overview Methods Stimuli (cross-splicing) Task Electrode configuration Artifacts avoidance Pre-processing Filtering Time-locking
Studying the time course of sensory substitution mechanisms (CSAIL, 2014)
") Studying the time course of sensory substitution mechanisms (CSAIL, 2014) Christian Graulty, Orestis Papaioannou, Phoebe Bauer, Michael Pitts & Enriqueta Canseco-Gonzalez, Reed College. Funded by the Murdoch
Studying the time course of sensory substitution mechanisms (CSAIL, 2014) Christian Graulty, Orestis Papaioannou, Phoebe Bauer, Michael Pitts & Enriqueta Canseco-Gonzalez, Reed College. Funded by the Murdoch
A Brain Computer Interface System For Auto Piloting Wheelchair
 A Brain Computer Interface System For Auto Piloting Wheelchair Reshmi G, N. Kumaravel & M. Sasikala Centre for Medical Electronics, Dept. of Electronics and Communication Engineering, College of Engineering,
The neurolinguistic toolbox Jonathan R. Brennan. Introduction to Neurolinguistics, LSA2017 1
 The neurolinguistic toolbox Jonathan R. Brennan Introduction to Neurolinguistics, LSA2017 1 Psycholinguistics / Neurolinguistics Happy Hour!!! Tuesdays 7/11, 7/18, 7/25 5:30-6:30 PM @ the Boone Center
Mirror neurons. Romana Umrianova
 Mirror neurons Romana Umrianova The functional role of the parieto-frontal mirror circuit: interpretations and misinterpretations Giacomo Rizzolatti and Corrado Sinigaglia Mechanism that unifies action
Beyond Blind Averaging: Analyzing Event-Related Brain Dynamics. Scott Makeig. sccn.ucsd.edu
 Beyond Blind Averaging: Analyzing Event-Related Brain Dynamics Scott Makeig Institute for Neural Computation University of California San Diego La Jolla CA sccn.ucsd.edu Talk given at the EEG/MEG course
Vision and Action. 10/3/12 Percep,on Ac,on 1
 Vision and Action Our ability to move thru our environment is closely tied to visual perception. Simple examples include standing one one foot. It is easier to maintain balance with the eyes open than
Classification of EEG signals in an Object Recognition task
 Classification of EEG signals in an Object Recognition task Iacob D. Rus, Paul Marc, Mihaela Dinsoreanu, Rodica Potolea Technical University of Cluj-Napoca Cluj-Napoca, Romania 1 rus_iacob23@yahoo.com,
Introduction to Computational Neuroscience
 Introduction to Computational Neuroscience Lecture 10: Brain-Computer Interfaces Ilya Kuzovkin So Far Stimulus So Far So Far Stimulus What are the neuroimaging techniques you know about? Stimulus So Far
Power-Based Connectivity. JL Sanguinetti
 Power-Based Connectivity JL Sanguinetti Power-based connectivity Correlating time-frequency power between two electrodes across time or over trials Gives you flexibility for analysis: Test specific hypotheses
The attentional selection of spatial and non-spatial attributes in touch: ERP evidence for parallel and independent processes
 Biological Psychology 66 (2004) 1 20 The attentional selection of spatial and non-spatial attributes in touch: ERP evidence for parallel and independent processes Bettina Forster, Martin Eimer School of
(Visual) Attention. October 3, PSY Visual Attention 1
 Attention. October 3, PSY Visual Attention 1") (Visual) Attention Perception and awareness of a visual object seems to involve attending to the object. Do we have to attend to an object to perceive it? Some tasks seem to proceed with little or no attention
(Visual) Attention Perception and awareness of a visual object seems to involve attending to the object. Do we have to attend to an object to perceive it? Some tasks seem to proceed with little or no attention
MANIPULATION OF HAND MOVEMENT OBSERVATION AND EXECUTION ON MU SUPPRESSION MEASURED BY ELECTROENCEPHALOGRAPHY. By Adrian Andelin.
 MANIPULATION OF HAND MOVEMENT OBSERVATION AND EXECUTION ON MU SUPPRESSION MEASURED BY ELECTROENCEPHALOGRAPHY By Adrian Andelin A Thesis Submitted in Partial Fulfillment of the Requirements for the Degree
Functional Connectivity and the Neurophysics of EEG. Ramesh Srinivasan Department of Cognitive Sciences University of California, Irvine
 Functional Connectivity and the Neurophysics of EEG Ramesh Srinivasan Department of Cognitive Sciences University of California, Irvine Outline Introduce the use of EEG coherence to assess functional connectivity
Supporting Information
 Supporting Information Forsyth et al. 10.1073/pnas.1509262112 SI Methods Inclusion Criteria. Participants were eligible for the study if they were between 18 and 30 y of age; were comfortable reading in
Introduction to Computational Neuroscience
 Introduction to Computational Neuroscience Lecture 5: Data analysis II Lesson Title 1 Introduction 2 Structure and Function of the NS 3 Windows to the Brain 4 Data analysis 5 Data analysis II 6 Single
Dissociable neural correlates for familiarity and recollection during the encoding and retrieval of pictures
 Cognitive Brain Research 18 (2004) 255 272 Research report Dissociable neural correlates for familiarity and recollection during the encoding and retrieval of pictures Audrey Duarte a, *, Charan Ranganath
HST 583 fmri DATA ANALYSIS AND ACQUISITION
 HST 583 fmri DATA ANALYSIS AND ACQUISITION Neural Signal Processing for Functional Neuroimaging Neuroscience Statistics Research Laboratory Massachusetts General Hospital Harvard Medical School/MIT Division
Attention Response Functions: Characterizing Brain Areas Using fmri Activation during Parametric Variations of Attentional Load
 Attention Response Functions: Characterizing Brain Areas Using fmri Activation during Parametric Variations of Attentional Load Intro Examine attention response functions Compare an attention-demanding
Running head: EMPATHY, MIRROR NEURONS, and HEART RATE
 Relationship Between Empathy 1 Running head: EMPATHY, MIRROR NEURONS, and HEART RATE Relationship Between Empathy, Mirror Neuron Activity, and Heart Rate Matt Novakovic, Eric Miller, Timothy Robinson Gustavus
TITLE:&The"organisation"of"working"memory"networks"is"shaped"by"early"sensory"experience"
 TITLE:&Theorganisationofworkingmemorynetworksisshapedbyearlysensoryexperience VeliaCardin 1,2,3,MaryRudner 1,RitaFDeOliveira 4,JosefineAndin 1,MerinaSu 5,LilliBeese 2,Bencie Woll 2 andjerkerrönnberg 1
Word Length Processing via Region-to-Region Connectivity
 Word Length Processing via Region-to-Region Connectivity Mariya Toneva Machine Learning Department, Neural Computation Carnegie Mellon University Data Analysis Project DAP committee: Tom Mitchell, Robert
Abstract. Introduction. European Journal of Neuroscience, pp. 1 12, doi: /ejn USA 2 Washington State University, Pullman, WA, USA
 European Journal of Neuroscience, pp. 1 12, 2016 doi:10.1111/ejn.13389 Mirror neuron activation as a function of explicit learning: changes in mu-event-related power after learning novel responses to ideomotor
The Central Nervous System
 The Central Nervous System Cellular Basis. Neural Communication. Major Structures. Principles & Methods. Principles of Neural Organization Big Question #1: Representation. How is the external world coded
Toward the neural causes of human visual perception and behavior
 Toward the neural causes of human visual perception and behavior Kaoru Amano Center for Information and Neural Networks (CiNet) National Institute of Information and Communications Technology (NICT) Graduate
What matters in the cued task-switching paradigm: Tasks or cues?
 Journal Psychonomic Bulletin & Review 2006,?? 13 (?), (5),???-??? 794-799 What matters in the cued task-switching paradigm: Tasks or cues? ULRICH MAYR University of Oregon, Eugene, Oregon Schneider and
the body and the front interior of a sedan. It features a projected LCD instrument cluster controlled
 Supplementary Material Driving Simulator and Environment Specifications The driving simulator was manufactured by DriveSafety and included the front three quarters of the body and the front interior of
Effects of Light Stimulus Frequency on Phase Characteristics of Brain Waves
 SICE Annual Conference 27 Sept. 17-2, 27, Kagawa University, Japan Effects of Light Stimulus Frequency on Phase Characteristics of Brain Waves Seiji Nishifuji 1, Kentaro Fujisaki 1 and Shogo Tanaka 1 1
Neural correlates of short-term perceptual learning in orientation discrimination indexed by event-related potentials
 Chinese Science Bulletin 2007 Science in China Press Springer-Verlag Neural correlates of short-term perceptual learning in orientation discrimination indexed by event-related potentials SONG Yan 1, PENG
What Matters in the Cued Task-Switching Paradigm: Tasks or Cues? Ulrich Mayr. University of Oregon
 What Matters in the Cued Task-Switching Paradigm: Tasks or Cues? Ulrich Mayr University of Oregon Running head: Cue-specific versus task-specific switch costs Ulrich Mayr Department of Psychology University
Top-Down versus Bottom-up Processing in the Human Brain: Distinct Directional Influences Revealed by Integrating SOBI and Granger Causality
 Top-Down versus Bottom-up Processing in the Human Brain: Distinct Directional Influences Revealed by Integrating SOBI and Granger Causality Akaysha C. Tang 1, Matthew T. Sutherland 1, Peng Sun 2, Yan Zhang
CHAPTER 6 INTERFERENCE CANCELLATION IN EEG SIGNAL
 116 CHAPTER 6 INTERFERENCE CANCELLATION IN EEG SIGNAL 6.1 INTRODUCTION Electrical impulses generated by nerve firings in the brain pass through the head and represent the electroencephalogram (EEG). Electrical
Transcranial direct current stimulation modulates shifts in global/local attention
 University of New Mexico UNM Digital Repository Psychology ETDs Electronic Theses and Dissertations 2-9-2010 Transcranial direct current stimulation modulates shifts in global/local attention David B.
Oriental Painting and Cortical Motor Activation: An EEG Oscillation Study
 1 Oriental Painting and Cortical Motor Activation: An EEG Oscillation Study Joung A Eom 1,3, Sung-Eun Lee 2,3* Department of Aesthetics, College of Humanities, Seoul National University, Seoul, Korea 1
EEG History. Where and why is EEG used? 8/2/2010
 EEG History Hans Berger 1873-1941 Edgar Douglas Adrian, an English physician, was one of the first scientists to record a single nerve fiber potential Although Adrian is credited with the discovery of
Classification and Statistical Analysis of Auditory FMRI Data Using Linear Discriminative Analysis and Quadratic Discriminative Analysis
 International Journal of Innovative Research in Computer Science & Technology (IJIRCST) ISSN: 2347-5552, Volume-2, Issue-6, November-2014 Classification and Statistical Analysis of Auditory FMRI Data Using
Observational Learning of New Movement Sequences Is Reflected in Fronto-Parietal Coherence
 of New Movement Sequences Is Reflected in Fronto-Parietal Coherence Jurjen van der Helden 1,2 *., Hein T. van Schie 3., Christiaan Rombouts 2 1 Donders Institute for Brain, Cognition and Behaviour, Radboud
ISSN: (Online) Volume 3, Issue 7, July 2015 International Journal of Advance Research in Computer Science and Management Studies
 Volume 3, Issue 7, July 2015 International Journal of Advance Research in Computer Science and Management Studies") ISSN: 2321-7782 (Online) Volume 3, Issue 7, July 2015 International Journal of Advance Research in Computer Science and Management Studies Research Article / Survey Paper / Case Study Available online
ISSN: 2321-7782 (Online) Volume 3, Issue 7, July 2015 International Journal of Advance Research in Computer Science and Management Studies Research Article / Survey Paper / Case Study Available online
Altered Dynamic of EEG Oscillations in Fibromyalgia Patients at Rest
 Altered Dynamic of EEG Oscillations in Fibromyalgia Patients at Rest Ana M. González-Roldán, PhD Ignacio Cifre, PhD Carolina Sitges, PhDPedro Montoya, PhD Pain Medicine, Volume 17, Issue 6, 1 June 2016,
1 Decoding attentional orientation from EEG spectra. Ramesh Srinivasan, Samuel Thorpe, Siyi Deng, Tom Lappas & Michael D'Zmura
 1 Ramesh Srinivasan, Samuel Thorpe, Siyi Deng, Tom Lappas & Michael D'Zmura Department of Cognitive Sciences, UC Irvine, SSPA 3151, Irvine, CA 92697 5100 {r.srinivasan,sthorpe,sdeng,tlappas,mdzmura}@uci.edu
Event Related Potentials: Significant Lobe Areas and Wave Forms for Picture Visual Stimulus
 Available Online at www.ijcsmc.com International Journal of Computer Science and Mobile Computing A Monthly Journal of Computer Science and Information Technology ISSN 2320 088X IMPACT FACTOR: 6.017 IJCSMC,
Action Preparation Helps and Hinders Perception of Action
 Action Preparation Helps and Hinders Perception of Action Clare Press 1,2, Elena Gherri 1, Cecilia Heyes 3, and Martin Eimer 1 Abstract Several theories of the mechanisms linking perception and action
The Change of Mu Rhythm during Action Observation in People with Stroke. Tae-won Yun, PT, MSc, Moon-Kyu Lee, PT, PhD
 1) 동작관찰시뇌졸중환자의뮤리듬변화 The Change of Mu Rhythm during Action Observation in People with Stroke Tae-won Yun PT MSc Moon-Kyu Lee PT PhD Department of Rehab Center Gwangju City Rehabilitation Hospital
How do individuals with congenital blindness form a conscious representation of a world they have never seen? brain. deprived of sight?
 How do individuals with congenital blindness form a conscious representation of a world they have never seen? What happens to visual-devoted brain structure in individuals who are born deprived of sight?
CONSCIOUSNESS. Phil/Psych 256. Chris Eliasmith
 CONSCIOUSNESS Phil/Psych 256 Chris Eliasmith The C Word One main difficulty with consciousness is defining what we are talking about: Do we mean awareness (e.g., awake vs. asleep)? Qualia (what-it-is-like)?
This presentation is the intellectual property of the author. Contact them for permission to reprint and/or distribute.
 Modified Combinatorial Nomenclature Montage, Review, and Analysis of High Density EEG Terrence D. Lagerlund, M.D., Ph.D. CP1208045-16 Disclosure Relevant financial relationships None Off-label/investigational
Figure 1. Source localization results for the No Go N2 component. (a) Dipole modeling
 Dipole modeling") Supplementary materials 1 Figure 1. Source localization results for the No Go N2 component. (a) Dipole modeling analyses placed the source of the No Go N2 component in the dorsal ACC, near the ACC source
Supplementary materials 1 Figure 1. Source localization results for the No Go N2 component. (a) Dipole modeling analyses placed the source of the No Go N2 component in the dorsal ACC, near the ACC source
Supplemental Material
 1 Supplemental Material Golomb, J.D, and Kanwisher, N. (2012). Higher-level visual cortex represents retinotopic, not spatiotopic, object location. Cerebral Cortex. Contents: - Supplemental Figures S1-S3
Visual Selection and Attention
 Visual Selection and Attention Retrieve Information Select what to observe No time to focus on every object Overt Selections Performed by eye movements Covert Selections Performed by visual attention 2
Cerebral Cortex. Edmund T. Rolls. Principles of Operation. Presubiculum. Subiculum F S D. Neocortex. PHG & Perirhinal. CA1 Fornix CA3 S D
 Cerebral Cortex Principles of Operation Edmund T. Rolls F S D Neocortex S D PHG & Perirhinal 2 3 5 pp Ento rhinal DG Subiculum Presubiculum mf CA3 CA1 Fornix Appendix 4 Simulation software for neuronal
Do women with fragile X syndrome have problems in switching attention: Preliminary findings from ERP and fmri
 Brain and Cognition 54 (2004) 235 239 www.elsevier.com/locate/b&c Do women with fragile X syndrome have problems in switching attention: Preliminary findings from ERP and fmri Kim Cornish, a,b, * Rachel
Supplementary Figure 1. Example of an amygdala neuron whose activity reflects value during the visual stimulus interval. This cell responded more
 1 Supplementary Figure 1. Example of an amygdala neuron whose activity reflects value during the visual stimulus interval. This cell responded more strongly when an image was negative than when the same
Novel single trial movement classification based on temporal dynamics of EEG
 Novel single trial movement classification based on temporal dynamics of EEG Conference or Workshop Item Accepted Version Wairagkar, M., Daly, I., Hayashi, Y. and Nasuto, S. (2014) Novel single trial movement
The Simon Effect as a Function of Temporal Overlap between Relevant and Irrelevant
 University of North Florida UNF Digital Commons All Volumes (2001-2008) The Osprey Journal of Ideas and Inquiry 2008 The Simon Effect as a Function of Temporal Overlap between Relevant and Irrelevant Leslie
Introduction to Computational Neuroscience
 Introduction to Computational Neuroscience Lecture 11: Attention & Decision making Lesson Title 1 Introduction 2 Structure and Function of the NS 3 Windows to the Brain 4 Data analysis 5 Data analysis
Sum of Neurally Distinct Stimulus- and Task-Related Components.
 SUPPLEMENTARY MATERIAL for Cardoso et al. 22 The Neuroimaging Signal is a Linear Sum of Neurally Distinct Stimulus- and Task-Related Components. : Appendix: Homogeneous Linear ( Null ) and Modified Linear
Visual Context Dan O Shea Prof. Fei Fei Li, COS 598B
 Visual Context Dan O Shea Prof. Fei Fei Li, COS 598B Cortical Analysis of Visual Context Moshe Bar, Elissa Aminoff. 2003. Neuron, Volume 38, Issue 2, Pages 347 358. Visual objects in context Moshe Bar.
Normal EEG of wakeful resting adults of years of age. Alpha rhythm. Alpha rhythm. Alpha rhythm. Normal EEG of the wakeful adult at rest
 Normal EEG of wakeful resting adults of 20-60 years of age Suthida Yenjun, M.D. Normal EEG of the wakeful adult at rest Alpha rhythm Beta rhythm Mu rhythm Vertex sharp transients Intermittent posterior
Biomedical Research 2013; 24 (3): ISSN X
: ISSN X") Biomedical Research 2013; 24 (3): 359-364 ISSN 0970-938X http://www.biomedres.info Investigating relative strengths and positions of electrical activity in the left and right hemispheres of the human brain
Biomedical Research 2013; 24 (3): 359-364 ISSN 0970-938X http://www.biomedres.info Investigating relative strengths and positions of electrical activity in the left and right hemispheres of the human brain
Precise Spike Timing and Reliability in Neural Encoding of Low-Level Sensory Stimuli and Sequences
 Precise Spike Timing and Reliability in Neural Encoding of Low-Level Sensory Stimuli and Sequences Temporal Structure In the World Representation in the Brain Project 1.1.2 Feldman and Harris Labs Temporal
Rajeev Raizada: Statement of research interests
 Rajeev Raizada: Statement of research interests Overall goal: explore how the structure of neural representations gives rise to behavioural abilities and disabilities There tends to be a split in the field
Elekta Neuromag TRIUX State-of-the-art Magnetoencephalography. The next level in functional mapping
 Elekta Neuromag TRIUX State-of-the-art Magnetoencephalography The next level in functional mapping The Path to the Future of MEG Starts Here As the leader in MEG technology, Elekta is pleased to introduce
TMS Disruption of Time Encoding in Human Primary Visual Cortex Molly Bryan Beauchamp Lab
 TMS Disruption of Time Encoding in Human Primary Visual Cortex Molly Bryan Beauchamp Lab This report details my summer research project for the REU Theoretical and Computational Neuroscience program as
Nov versus Fam. Fam 1 versus. Fam 2. Supplementary figure 1
 a Environment map similarity score (mean r ).5..3.2.1 Fam 1 versus Fam 2 Nov versus Fam b Environment cofiring similarity score (mean r ).7.6.5..3.2.1 Nov versus Fam Fam 1 versus Fam 2 First half versus
Trevor Brown PhD Candidate Behavioural and Cognitive Social Sciences (University of New England) Supervisor: Dr Graham Jamieson
 Supervisor: Dr Graham Jamieson") Quantitative Electroencephalogram, Event-Related Potential and eloreta Source Localisation Identify EEG Biomarkers of Visuo-Spatial Processing and Motor-Preparation in Elite Table Tennis Players Trevor
Quantitative Electroencephalogram, Event-Related Potential and eloreta Source Localisation Identify EEG Biomarkers of Visuo-Spatial Processing and Motor-Preparation in Elite Table Tennis Players Trevor
fmri Acquisition: Temporal Effects
 Functional MRI Data Acquisition: Temporal fmri Acquisition: Temporal Effects Session length Repetition time Fixed vs. distributed temporal sampling Sparse temporal sampling Noise source recording Prospective
Neuroimaging. BIE601 Advanced Biological Engineering Dr. Boonserm Kaewkamnerdpong Biological Engineering Program, KMUTT. Human Brain Mapping
 11/8/2013 Neuroimaging N i i BIE601 Advanced Biological Engineering Dr. Boonserm Kaewkamnerdpong Biological Engineering Program, KMUTT 2 Human Brain Mapping H Human m n brain br in m mapping ppin can nb
Est-ce que l'eeg a toujours sa place en 2019?
 Est-ce que l'eeg a toujours sa place en 2019? Thomas Bast Epilepsy Center Kork, Germany Does EEG still play a role in 2019? What a question 7T-MRI, fmri, DTI, MEG, SISCOM, Of ieeg course! /HFO, Genetics
An Overview of a MEG Study
 An Overview of a MEG Study The Research Cycle Formulating a research Question Planning an investigation of the research question Devising the experimental and technical resources needed Selecting an experimental
Supplementary Information on TMS/hd-EEG recordings: acquisition and preprocessing
 Supplementary Information on TMS/hd-EEG recordings: acquisition and preprocessing Stability of the coil position was assured by using a software aiming device allowing the stimulation only when the deviation
Independence of Visual Awareness from the Scope of Attention: an Electrophysiological Study
 Cerebral Cortex March 2006;16:415-424 doi:10.1093/cercor/bhi121 Advance Access publication June 15, 2005 Independence of Visual Awareness from the Scope of Attention: an Electrophysiological Study Mika
Framework for Comparative Research on Relational Information Displays
 Framework for Comparative Research on Relational Information Displays Sung Park and Richard Catrambone 2 School of Psychology & Graphics, Visualization, and Usability Center (GVU) Georgia Institute of
EEG reveals divergent paths for speech envelopes during selective attention
 EEG reveals divergent paths for speech envelopes during selective attention Cort Horton a, Michael D Zmura a, and Ramesh Srinivasan a,b a Dept. of Cognitive Sciences, University of California, Irvine,
FINAL PROGRESS REPORT
 (1) Foreword (optional) (2) Table of Contents (if report is more than 10 pages) (3) List of Appendixes, Illustrations and Tables (if applicable) (4) Statement of the problem studied FINAL PROGRESS REPORT
Decoding the future from past experience: learning shapes predictions in early visual cortex
 J Neurophysiol 113: 3159 3171, 2015. First published March 5, 2015; doi:10.1152/jn.00753.2014. Decoding the future from past experience: learning shapes predictions in early visual cortex Caroline D. B.
Music-induced Emotions and Musical Regulation and Emotion Improvement Based on EEG Technology
 Music-induced Emotions and Musical Regulation and Emotion Improvement Based on EEG Technology Xiaoling Wu 1*, Guodong Sun 2 ABSTRACT Musical stimulation can induce emotions as well as adjust and improve
Myers Psychology for AP*
 Myers Psychology for AP* David G. Myers PowerPoint Presentation Slides by Kent Korek Germantown High School Worth Publishers, 2010 *AP is a trademark registered and/or owned by the College Board, which