Tutorial 3: MANOVA. Pekka Malo 30E00500 Quantitative Empirical Research Spring 2016
|
|
|
- Bernard Welch
- 6 years ago
- Views:
Transcription
1 Tutorial 3: Pekka Malo 30E00500 Quantitative Empirical Research Spring 2016
2 Step 1: Research design Adequacy of sample size Choice of dependent variables Choice of independent variables (treatment effects) Optional: Use of covariates (MANCOVA) 2
3 Choice of dependent variables Don t try to include too many, use only as many variables as necessary Single badly chosen variable can distort the entire result Use only variables with a strong theoretical support 3
4 Choice of independent variables (factors or treatments ) Often researcher is interested in examining effects of several independent variables rather than using only a single variable à factorial design Sometimes researchers are for compelled to add more independent variables to control for characteristic that affect the dependent variables but is not part of the study design (e.g. geographic location, gender) à blocking factors Remember sample size limitations 4
5 Use of covariates (MANCOVA) Sometimes the research also has to control for effects of metric variables à covariates Objective of covariates is to 1. Eliminate any effects that influence only a portion of the respondents or 2. Effects that vary among the respondents Key benefits: 1. Helps to eliminate systematic error outside the control of the researcher (effects which could bias results) 2. Accounts for differences in responses due to unique characteristics of respondents Note: Number of covariates should not exceed the following thumbrule: 0.1 x sample size (number of groups -1) 5
6 Sample size Need to use larger samples than in ANOVA Minimum sample in each group must be greater than the number of dependent variables Recommended minimum number per group is 20 observations The higher the number of dependent variables, the greater the sample size needed to maintain statistical power 6
7 Sample size with power at
8 Step 2: Check assumptions Independence of observations Homogeneity of variance/covariance matrices Levene s univariate tests (similar process as in ANOVA) Box s M-test for covariance matrices Normality Check histograms and Kolmogorov-Smirnov tests Multicollinearity of dependent variables Sensitivity to outliers 8
9 Normality and independence Multivariate normality: All dependent variables should be normally distributed Any linear combination of the dependent variables should be also normally distributed Luckily is robust test and survives departures from multivariate normality When multivariate normality not satisfied, lesser power to detect main or interaction effects Independence of observations must not be violated! 9

10 Explore by variable Analyze > Descriptive statistics > Explore (plots) 10
11 Equality of covariance matrices For k multivariate populations, the hypothesis of equality of covariance matrices is Commonly tested using Box s M-test: Sensitive to the size of covariance matrices and the number of groups in the analysis Highly sensitive to departures from normality: always check univariate normality of measures before performing the test However, violation of the assumption doesn t generally have severe impact when groups are of approximately equal size 11
12 Equality of covariance matrices (2) What if group sizes differ more and Box s M-test is not within acceptable levels (alpha <.001)? Apply one of the many variance-stabilizing transformations on variables Use adjusted tests which do not assume equal variances: E.g. Games-Howell 12
")
13 Box s M-test in SPSS The test is obtained at the estimation step as part of GLM routine (see Step 3) 13
14 Step 3: Estimation and significance testing Choice of criteria for significance testing Assessment of statistical power Effects of dependent variable multicollinearity 14
15 Estimation with the General Linear Model (GLM) Classical techniques established more than 70 years ago, but nowadays models are commonly fitted using GLM can be viewed as a multivariate multiple regression model Reasons for using GLM: Single estimation procedure can be used to handle wide range of specifications Available in most statistical packages (e.g. SPSS, SAS) 15

16 Multivariate GLM in SPSS 16
: Pillai s criterion and Hotelling s T 2 Often")
 are met")


17 Multivariate Tests () Wilks lambda (or U-statistic): Roy s greatest characteristic root (GCR): Pillai s criterion and Hotelling s T 2 Often referred to as the multivariate F-test Preferred when basic requirements (sample size, no violations, approximately equal sized groups) are met Advantages in power and specificity Most appropriate when dependent variables are strongly interrelated on one dimension Strongly affected by violations of assumptions Similar to Wilks lambda More robust and preferred when sample size decreases, unequal groups, or homogeneity of covariances is violated 17
18 18
19 Step 4: Interpretation of Results Interpret the effects of covariates, if employed Assess which dependent variable(s) exhibited differences across the groups of each treatment Identify whether the groups differ on a single dependent variable or the entire dependent variate 19
20 Interpreting Covariates If covariates are involved, they need to be interpreted first, since they act as controls on the dependent variate Assessment of overall impact: Evaluate impacts with and without covariates in the model Effective covariates should improve statistical power and reduce within-group variance Interpretation of covariates: Similar to regression analysis If their overall impact is significant, it is of interest to examine the strength of their predictive relationship with dependent variables 20
21 Main Effects of Treatments Main effect is typically described by the difference between groups on the dependent variables in the analysis Example: if gender has a significant main effect, we could look to the difference in means as a way of describing the impact (e.g. 7.5 for women vs. 6.0 for men) When treatment or factor has more than two levels, significant main effect does not guarantee that all groups are significantly different (at least one pair of groups is) 21
22 Identifying differences between individual groups Once you are confident that there are differences between groups, it is possible to perform a variety of tests to understand which groups differ Contrasts (~a priori tests): Planned comparisons based on scientific goals Post-hoc tests (~ decide after experiment): Performed for each dependent variable separately Used for situations where you can decide which comparisons you want to make after looking at the data 22
23 Impact of Interactions Any time more than one treatment or factor is used, there are interaction effects Interaction terms represent the joint effect of 2 or more factors No interaction: The effect of one factor is the same for each level of the other factor; allows direct interpretation of main effects independently Ordinal interaction Effects differ across the levels of another factor, but the group differences are always in the same direction Disordinal interaction Factors don t represent any consistent effect 23
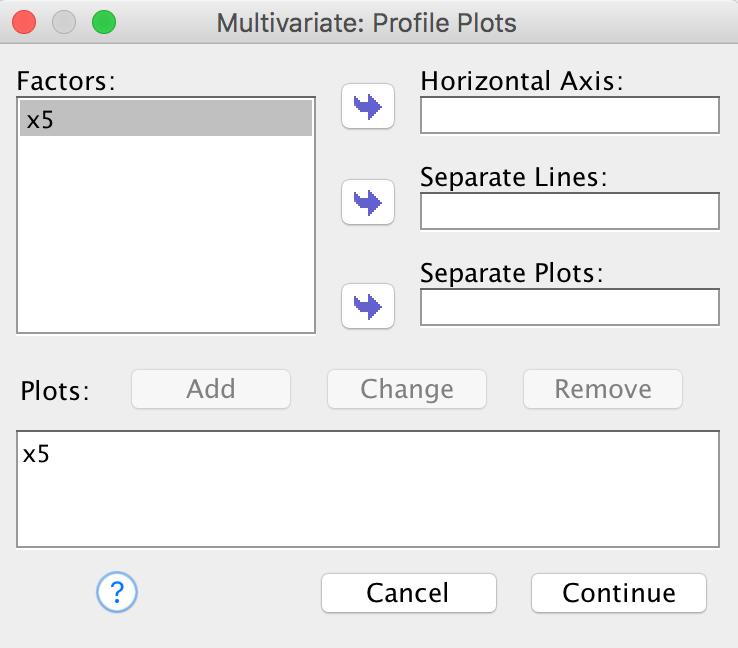
24 Profile plots Profile plots (interaction plots) are useful for comparing marginal means in your model. A profile plot is a line plot in which each point indicates the estimated marginal mean of a dependent variable (adjusted for any covariates) at one level of a factor. If you have more than 1 independent variable: The levels of a second factor can be used to make separate lines. Each level in a third factor can be used to create a separate plot. 24
25 25
 Source: bestofbritish.")
26 Example: Cereal evaluation Shape (ball, cube, star) Vs. Color (red, blue, green) Source: bestofbritish.ca 26
27 No interaction effect 27
28 Ordinal interaction 28
29 Disordinal interaction 29
30 Identifying differences between individual groups Once you are confident that there are differences between groups, it is possible to perform a variety of tests to understand which groups differ Contrasts (~a priori tests): Planned comparisons based on scientific goals Post-hoc tests (~ decide after experiment): Performed for each dependent variable separately Used for situations where you can decide which comparisons you want to make after looking at the data 30
31 Post-hoc Multiple Comparisons Commonly used tests for multiple comparisons: Bonferroni s test: based on Student s t-test, adjusts the significance level for multiple comparisons Tukey s honestly significant difference test: uses Studentized range statistic to make all pairwise comparisons between groups Choose a test based on the number of pairwise comparisons: Use Tukey for large number of pairs: More powerful than Bonferroni when several pairs of means considered Use Bonferroni for small number of pairs 31
(C) Jamalludin Ab Rahman
 Jamalludin Ab Rahman") SPSS Note The GLM Multivariate procedure is based on the General Linear Model procedure, in which factors and covariates are assumed to have a linear relationship to the dependent variable. Factors. Categorical
SPSS Note The GLM Multivariate procedure is based on the General Linear Model procedure, in which factors and covariates are assumed to have a linear relationship to the dependent variable. Factors. Categorical
Profile Analysis. Intro and Assumptions Psy 524 Andrew Ainsworth
 Profile Analysis Intro and Assumptions Psy 524 Andrew Ainsworth Profile Analysis Profile analysis is the repeated measures extension of MANOVA where a set of DVs are commensurate (on the same scale). Profile
One-Way Independent ANOVA
 One-Way Independent ANOVA Analysis of Variance (ANOVA) is a common and robust statistical test that you can use to compare the mean scores collected from different conditions or groups in an experiment.
1. You want to find out what factors predict achievement in English. Develop a model that
 Questions and answers for Chapter 10 1. You want to find out what factors predict achievement in English. Develop a model that you think can explain this. As usual many alternative predictors are possible
Repeated Measures ANOVA and Mixed Model ANOVA. Comparing more than two measurements of the same or matched participants
 Repeated Measures ANOVA and Mixed Model ANOVA Comparing more than two measurements of the same or matched participants Data files Fatigue.sav MentalRotation.sav AttachAndSleep.sav Attitude.sav Homework:
The SAGE Encyclopedia of Educational Research, Measurement, and Evaluation Multivariate Analysis of Variance
 The SAGE Encyclopedia of Educational Research, Measurement, Multivariate Analysis of Variance Contributors: David W. Stockburger Edited by: Bruce B. Frey Book Title: Chapter Title: "Multivariate Analysis
Small Group Presentations
 Admin Assignment 1 due next Tuesday at 3pm in the Psychology course centre. Matrix Quiz during the first hour of next lecture. Assignment 2 due 13 May at 10am. I will upload and distribute these at the
isc ove ring i Statistics sing SPSS
 isc ove ring i Statistics sing SPSS S E C O N D! E D I T I O N (and sex, drugs and rock V roll) A N D Y F I E L D Publications London o Thousand Oaks New Delhi CONTENTS Preface How To Use This Book Acknowledgements
Overview of Lecture. Survey Methods & Design in Psychology. Correlational statistics vs tests of differences between groups
 Survey Methods & Design in Psychology Lecture 10 ANOVA (2007) Lecturer: James Neill Overview of Lecture Testing mean differences ANOVA models Interactions Follow-up tests Effect sizes Parametric Tests
Before we get started:
 Before we get started: http://arievaluation.org/projects-3/ AEA 2018 R-Commander 1 Antonio Olmos Kai Schramm Priyalathta Govindasamy Antonio.Olmos@du.edu AntonioOlmos@aumhc.org AEA 2018 R-Commander 2 Plan
CHAPTER VI RESEARCH METHODOLOGY
 CHAPTER VI RESEARCH METHODOLOGY 6.1 Research Design Research is an organized, systematic, data based, critical, objective, scientific inquiry or investigation into a specific problem, undertaken with the
ANOVA in SPSS (Practical)
") ANOVA in SPSS (Practical) Analysis of Variance practical In this practical we will investigate how we model the influence of a categorical predictor on a continuous response. Centre for Multilevel Modelling
ANOVA in SPSS (Practical) Analysis of Variance practical In this practical we will investigate how we model the influence of a categorical predictor on a continuous response. Centre for Multilevel Modelling
Applications. DSC 410/510 Multivariate Statistical Methods. Discriminating Two Groups. What is Discriminant Analysis
 DSC 4/5 Multivariate Statistical Methods Applications DSC 4/5 Multivariate Statistical Methods Discriminant Analysis Identify the group to which an object or case (e.g. person, firm, product) belongs:
Readings Assumed knowledge
 3 N = 59 EDUCAT 59 TEACHG 59 CAMP US 59 SOCIAL Analysis of Variance 95% CI Lecture 9 Survey Research & Design in Psychology James Neill, 2012 Readings Assumed knowledge Howell (2010): Ch3 The Normal Distribution
Examining differences between two sets of scores
 6 Examining differences between two sets of scores In this chapter you will learn about tests which tell us if there is a statistically significant difference between two sets of scores. In so doing you
Comparing 3 Means- ANOVA
 Comparing 3 Means- ANOVA Evaluation Methods & Statistics- Lecture 7 Dr Benjamin Cowan Research Example- Theory of Planned Behaviour Ajzen & Fishbein (1981) One of the most prominent models of behaviour
List of Figures. List of Tables. Preface to the Second Edition. Preface to the First Edition
 List of Figures List of Tables Preface to the Second Edition Preface to the First Edition xv xxv xxix xxxi 1 What Is R? 1 1.1 Introduction to R................................ 1 1.2 Downloading and Installing
EPS 625 INTERMEDIATE STATISTICS TWO-WAY ANOVA IN-CLASS EXAMPLE (FLEXIBILITY)
") EPS 625 INTERMEDIATE STATISTICS TO-AY ANOVA IN-CLASS EXAMPLE (FLEXIBILITY) A researcher conducts a study to evaluate the effects of the length of an exercise program on the flexibility of female and male
EPS 625 INTERMEDIATE STATISTICS TO-AY ANOVA IN-CLASS EXAMPLE (FLEXIBILITY) A researcher conducts a study to evaluate the effects of the length of an exercise program on the flexibility of female and male
Analysis and Interpretation of Data Part 1
 Analysis and Interpretation of Data Part 1 DATA ANALYSIS: PRELIMINARY STEPS 1. Editing Field Edit Completeness Legibility Comprehensibility Consistency Uniformity Central Office Edit 2. Coding Specifying
Supplementary Materials Are taboo words simply more arousing?
 Supplementary Materials Are taboo words simply more arousing? Our study was not designed to compare potential differences on memory other than arousal between negative and taboo words. Thus, our data cannot
Daniel Boduszek University of Huddersfield
 Daniel Boduszek University of Huddersfield d.boduszek@hud.ac.uk Introduction to Multiple Regression (MR) Types of MR Assumptions of MR SPSS procedure of MR Example based on prison data Interpretation of
Business Research Methods. Introduction to Data Analysis
 Business Research Methods Introduction to Data Analysis Data Analysis Process STAGES OF DATA ANALYSIS EDITING CODING DATA ENTRY ERROR CHECKING AND VERIFICATION DATA ANALYSIS Introduction Preparation of
MMI 409 Spring 2009 Final Examination Gordon Bleil. 1. Is there a difference in depression as a function of group and drug?
 MMI 409 Spring 2009 Final Examination Gordon Bleil Table of Contents Research Scenario and General Assumptions Questions for Dataset (Questions are hyperlinked to detailed answers) 1. Is there a difference
Introduction to SPSS. Katie Handwerger Why n How February 19, 2009
 Introduction to SPSS Katie Handwerger Why n How February 19, 2009 Overview Setting up a data file Frequencies/Descriptives One-sample T-test Paired-samples T-test Independent-samples T-test One-way ANOVA
Day 11: Measures of Association and ANOVA
 Day 11: Measures of Association and ANOVA Daniel J. Mallinson School of Public Affairs Penn State Harrisburg mallinson@psu.edu PADM-HADM 503 Mallinson Day 11 November 2, 2017 1 / 45 Road map Measures of
Two-Way Independent ANOVA
 Two-Way Independent ANOVA Analysis of Variance (ANOVA) a common and robust statistical test that you can use to compare the mean scores collected from different conditions or groups in an experiment. There
f WILEY ANOVA and ANCOVA A GLM Approach Second Edition ANDREW RUTHERFORD Staffordshire, United Kingdom Keele University School of Psychology
 ANOVA and ANCOVA A GLM Approach Second Edition ANDREW RUTHERFORD Keele University School of Psychology Staffordshire, United Kingdom f WILEY A JOHN WILEY & SONS, INC., PUBLICATION Contents Acknowledgments
Advanced ANOVA Procedures
 Advanced ANOVA Procedures Session Lecture Outline:. An example. An example. Two-way ANOVA. An example. Two-way Repeated Measures ANOVA. MANOVA. ANalysis of Co-Variance (): an ANOVA procedure whereby the
Choosing a Significance Test. Student Resource Sheet
 Choosing a Significance Test Student Resource Sheet Choosing Your Test Choosing an appropriate type of significance test is a very important consideration in analyzing data. If an inappropriate test is
Intro to SPSS. Using SPSS through WebFAS
 Intro to SPSS Using SPSS through WebFAS http://www.yorku.ca/computing/students/labs/webfas/ Try it early (make sure it works from your computer) If you need help contact UIT Client Services Voice: 416-736-5800
Basic Features of Statistical Analysis and the General Linear Model
 01-Foster-3327(ch-01).qxd 9/5/2005 5:48 PM Page 1 1 Basic Features of Statistical Analysis and the General Linear Model INTRODUCTION The aim of this book is to describe some of the statistical techniques
HANDOUTS FOR BST 660 ARE AVAILABLE in ACROBAT PDF FORMAT AT:
 Applied Multivariate Analysis BST 660 T. Mark Beasley, Ph.D. Associate Professor, Department of Biostatistics RPHB 309-E E-Mail: mbeasley@uab.edu Voice:(205) 975-4957 Website: http://www.soph.uab.edu/statgenetics/people/beasley/tmbindex.html
Stat Wk 9: Hypothesis Tests and Analysis
 Stat 342 - Wk 9: Hypothesis Tests and Analysis Crash course on ANOVA, proc glm Stat 342 Notes. Week 9 Page 1 / 57 Crash Course: ANOVA AnOVa stands for Analysis Of Variance. Sometimes it s called ANOVA,
Basic Biostatistics. Chapter 1. Content
 Chapter 1 Basic Biostatistics Jamalludin Ab Rahman MD MPH Department of Community Medicine Kulliyyah of Medicine Content 2 Basic premises variables, level of measurements, probability distribution Descriptive
8/28/2017. If the experiment is successful, then the model will explain more variance than it can t SS M will be greater than SS R
 PSY 5101: Advanced Statistics for Psychological and Behavioral Research 1 If the ANOVA is significant, then it means that there is some difference, somewhere but it does not tell you which means are different
Two-Way Independent Samples ANOVA with SPSS
 Two-Way Independent Samples ANOVA with SPSS Obtain the file ANOVA.SAV from my SPSS Data page. The data are those that appear in Table 17-3 of Howell s Fundamental statistics for the behavioral sciences
Ecological Statistics
 A Primer of Ecological Statistics Second Edition Nicholas J. Gotelli University of Vermont Aaron M. Ellison Harvard Forest Sinauer Associates, Inc. Publishers Sunderland, Massachusetts U.S.A. Brief Contents
Reading Time [min.] Group
![Reading Time [min.] Group](/thumbs/93/111332220.jpg "Reading Time [min.] Group") The exam set contains 8 questions. The questions may contain sub-questions. Make sure to indicate which question you are answering. The questions are weighted according to the percentage in brackets. Please
The exam set contains 8 questions. The questions may contain sub-questions. Make sure to indicate which question you are answering. The questions are weighted according to the percentage in brackets. Please
PSY 216: Elementary Statistics Exam 4
 Name: PSY 16: Elementary Statistics Exam 4 This exam consists of multiple-choice questions and essay / problem questions. For each multiple-choice question, circle the one letter that corresponds to the
MULTIPLE LINEAR REGRESSION 24.1 INTRODUCTION AND OBJECTIVES OBJECTIVES
 24 MULTIPLE LINEAR REGRESSION 24.1 INTRODUCTION AND OBJECTIVES In the previous chapter, simple linear regression was used when you have one independent variable and one dependent variable. This chapter
Chapter 11: Comparing several means
 Chapter 11: Comparing several means Smart Alex s Solutions Task 1 To test how different teaching methods affected students knowledge I took three statistics courses where I taught the same material. For
Chapter 11. Experimental Design: One-Way Independent Samples Design
 11-1 Chapter 11. Experimental Design: One-Way Independent Samples Design Advantages and Limitations Comparing Two Groups Comparing t Test to ANOVA Independent Samples t Test Independent Samples ANOVA Comparing
Quantitative Methods in Computing Education Research (A brief overview tips and techniques)
") Quantitative Methods in Computing Education Research (A brief overview tips and techniques) Dr Judy Sheard Senior Lecturer Co-Director, Computing Education Research Group Monash University judy.sheard@monash.edu
Quantitative Methods in Computing Education Research (A brief overview tips and techniques) Dr Judy Sheard Senior Lecturer Co-Director, Computing Education Research Group Monash University judy.sheard@monash.edu
Mantel-Haenszel Procedures for Detecting Differential Item Functioning
 A Comparison of Logistic Regression and Mantel-Haenszel Procedures for Detecting Differential Item Functioning H. Jane Rogers, Teachers College, Columbia University Hariharan Swaminathan, University of
Investigating the robustness of the nonparametric Levene test with more than two groups
 Psicológica (2014), 35, 361-383. Investigating the robustness of the nonparametric Levene test with more than two groups David W. Nordstokke * and S. Mitchell Colp University of Calgary, Canada Testing
Analysis of Covariance (ANCOVA)
") Analysis of Covariance (ANCOVA) Some background ANOVA can be extended to include one or more continuous variables that predict the outcome (or dependent variable). Continuous variables such as these, that
Analysis of Covariance (ANCOVA) Some background ANOVA can be extended to include one or more continuous variables that predict the outcome (or dependent variable). Continuous variables such as these, that
Previously, when making inferences about the population mean,, we were assuming the following simple conditions:
 Chapter 17 Inference about a Population Mean Conditions for inference Previously, when making inferences about the population mean,, we were assuming the following simple conditions: (1) Our data (observations)
Principal Components Factor Analysis in the Literature. Stage 1: Define the Research Problem
 Principal Components Factor Analysis in the Literature This problem is taken from the research article: Charles P. Flynn and Suzanne R. Kunkel, "Deprivation, Compensation, and Conceptions of an Afterlife."
Chapter 25. Paired Samples and Blocks. Copyright 2010 Pearson Education, Inc.
 Chapter 25 Paired Samples and Blocks Copyright 2010 Pearson Education, Inc. Paired Data Data are paired when the observations are collected in pairs or the observations in one group are naturally related
Levene Statistic df1 df2 Sig
 Activity #: Follow-up ests (Bonferroni method) ection 1. Resources: handicap.sav he U.. Vocational Rehabilitation Act of 19 prohibited discrimination against people with physical disabilities. he act defined
Statistics 2. RCBD Review. Agriculture Innovation Program
 Statistics 2. RCBD Review 2014. Prepared by Lauren Pincus With input from Mark Bell and Richard Plant Agriculture Innovation Program 1 Table of Contents Questions for review... 3 Answers... 3 Materials
Midterm Exam MMI 409 Spring 2009 Gordon Bleil
 Midterm Exam MMI 409 Spring 2009 Gordon Bleil Table of contents: (Hyperlinked to problem sections) Problem 1 Hypothesis Tests Results Inferences Problem 2 Hypothesis Tests Results Inferences Problem 3
Unit 1 Exploring and Understanding Data
 Unit 1 Exploring and Understanding Data Area Principle Bar Chart Boxplot Conditional Distribution Dotplot Empirical Rule Five Number Summary Frequency Distribution Frequency Polygon Histogram Interquartile
Analysis of Variance (ANOVA)
") Research Methods and Ethics in Psychology Week 4 Analysis of Variance (ANOVA) One Way Independent Groups ANOVA Brief revision of some important concepts To introduce the concept of familywise error rate.
Research Methods and Ethics in Psychology Week 4 Analysis of Variance (ANOVA) One Way Independent Groups ANOVA Brief revision of some important concepts To introduce the concept of familywise error rate.
USER INSTITUTIONS OF OFFICE WORKERS IN GHANA: INVESTIGATING THE DIFFERENCES ABSTRACT
 USER INSTITUTIONS OF OFFICE WORKERS IN GHANA: INVESTIGATING THE DIFFERENCES Adu, G. Department of Interior Architecture & Furniture Production, Kumasi Polytechnic Kumasi GHANA Adu, S. Department of Wood
C.3 Repeated Measures ANOVA
 C. Repeated Measures ANOVA A study was conducted to find the effect of yoga on lowering the total serum cholesterol level in newly diagnosed patients of hypercholesterolemia. Thirty patients were selected
1. What is the relationship between item response indecision and SDS summary code permutations?
 The Influence of Item Response Indecision on Self-Directed Search (SDS) Scores Item Response Indecision on the SDS 1 The idea for this research began with a question from a client during an interpretation
7 Statistical Issues that Researchers Shouldn t Worry (So Much) About
 About") 7 Statistical Issues that Researchers Shouldn t Worry (So Much) About By Karen Grace-Martin Founder & President About the Author Karen Grace-Martin is the founder and president of The Analysis Factor.
7 Statistical Issues that Researchers Shouldn t Worry (So Much) About By Karen Grace-Martin Founder & President About the Author Karen Grace-Martin is the founder and president of The Analysis Factor.
SUMMER 2011 RE-EXAM PSYF11STAT - STATISTIK
 SUMMER 011 RE-EXAM PSYF11STAT - STATISTIK Full Name: Årskortnummer: Date: This exam is made up of three parts: Part 1 includes 30 multiple choice questions; Part includes 10 matching questions; and Part
Chapter 14: More Powerful Statistical Methods
 Chapter 14: More Powerful Statistical Methods Most questions will be on correlation and regression analysis, but I would like you to know just basically what cluster analysis, factor analysis, and conjoint
RESULTS. Chapter INTRODUCTION
 8.1 Chapter 8 RESULTS 8.1 INTRODUCTION The previous chapter provided a theoretical discussion of the research and statistical methodology. This chapter focuses on the interpretation and discussion of the
Bangor University Laboratory Exercise 1, June 2008
 Laboratory Exercise, June 2008 Classroom Exercise A forest land owner measures the outside bark diameters at.30 m above ground (called diameter at breast height or dbh) and total tree height from ground
Statistics as a Tool. A set of tools for collecting, organizing, presenting and analyzing numerical facts or observations.
 Statistics as a Tool A set of tools for collecting, organizing, presenting and analyzing numerical facts or observations. Descriptive Statistics Numerical facts or observations that are organized describe
Regression Discontinuity Analysis
 Regression Discontinuity Analysis A researcher wants to determine whether tutoring underachieving middle school students improves their math grades. Another wonders whether providing financial aid to low-income
10. LINEAR REGRESSION AND CORRELATION
 1 10. LINEAR REGRESSION AND CORRELATION The contingency table describes an association between two nominal (categorical) variables (e.g., use of supplemental oxygen and mountaineer survival ). We have
Statistics Guide. Prepared by: Amanda J. Rockinson- Szapkiw, Ed.D.
 This guide contains a summary of the statistical terms and procedures. This guide can be used as a reference for course work and the dissertation process. However, it is recommended that you refer to statistical
ANCOVA with Regression Homogeneity
 ANCOVA with Regression Homogeneity The purpose of the study was to compare the effectiveness of two different treatments in two populations. Both treatments have been repeatedly shown to work better than
Dr. Kelly Bradley Final Exam Summer {2 points} Name
 {2 points} Name You MUST work alone no tutors; no help from classmates. Email me or see me with questions. You will receive a score of 0 if this rule is violated. This exam is being scored out of 00 points.
Developing and Testing Hypotheses Kuba Glazek, Ph.D. Methodology Expert National Center for Academic and Dissertation Excellence Los Angeles
 Developing and Testing Hypotheses Kuba Glazek, Ph.D. Methodology Expert National Center for Academic and Dissertation Excellence Los Angeles NATIONAL CENTER FOR ACADEMIC & DISSERTATION EXCELLENCE Overview
Overview of Non-Parametric Statistics
 Overview of Non-Parametric Statistics LISA Short Course Series Mark Seiss, Dept. of Statistics April 7, 2009 Presentation Outline 1. Homework 2. Review of Parametric Statistics 3. Overview Non-Parametric
Biology 345: Biometry Fall 2005 SONOMA STATE UNIVERSITY Lab Exercise 8 One Way ANOVA and comparisons among means Introduction
 Biology 345: Biometry Fall 2005 SONOMA STATE UNIVERSITY Lab Exercise 8 One Way ANOVA and comparisons among means Introduction In this exercise, we will conduct one-way analyses of variance using two different
Introduction to Multilevel Models for Longitudinal and Repeated Measures Data
 Introduction to Multilevel Models for Longitudinal and Repeated Measures Data Today s Class: Features of longitudinal data Features of longitudinal models What can MLM do for you? What to expect in this
investigate. educate. inform.
 investigate. educate. inform. Research Design What drives your research design? The battle between Qualitative and Quantitative is over Think before you leap What SHOULD drive your research design. Advanced
Cultural Intelligence: A Predictor of Ethnic Minority College Students Psychological Wellbeing
 From the SelectedWorks of Teresa A. Smith March 29, 2012 Cultural Intelligence: A Predictor of Ethnic Minority College Students Psychological Wellbeing Teresa A. Smith Available at: https://works.bepress.com/teresa_a_smith/2/
WDHS Curriculum Map Probability and Statistics. What is Statistics and how does it relate to you?
 WDHS Curriculum Map Probability and Statistics Time Interval/ Unit 1: Introduction to Statistics 1.1-1.3 2 weeks S-IC-1: Understand statistics as a process for making inferences about population parameters
Sample Exam Paper Answer Guide
 Sample Exam Paper Answer Guide Notes This handout provides perfect answers to the sample exam paper. I would not expect you to be able to produce such perfect answers in an exam. So, use this document
A Brief (very brief) Overview of Biostatistics. Jody Kreiman, PhD Bureau of Glottal Affairs
 Overview of Biostatistics. Jody Kreiman, PhD Bureau of Glottal Affairs") A Brief (very brief) Overview of Biostatistics Jody Kreiman, PhD Bureau of Glottal Affairs What We ll Cover Fundamentals of measurement Parametric versus nonparametric tests Descriptive versus inferential
A Brief (very brief) Overview of Biostatistics Jody Kreiman, PhD Bureau of Glottal Affairs What We ll Cover Fundamentals of measurement Parametric versus nonparametric tests Descriptive versus inferential
Problem #1 Neurological signs and symptoms of ciguatera poisoning as the start of treatment and 2.5 hours after treatment with mannitol.
 Ho (null hypothesis) Ha (alternative hypothesis) Problem #1 Neurological signs and symptoms of ciguatera poisoning as the start of treatment and 2.5 hours after treatment with mannitol. Hypothesis: Ho:
Stepwise method Modern Model Selection Methods Quantile-Quantile plot and tests for normality
 Week 9 Hour 3 Stepwise method Modern Model Selection Methods Quantile-Quantile plot and tests for normality Stat 302 Notes. Week 9, Hour 3, Page 1 / 39 Stepwise Now that we've introduced interactions,
Validity, Reliability and Classical Assumptions
 , Reliability and Classical Assumptions Presented by Mahendra AN Sources: www-psych.stanford.edu/~bigopp/.ppt http://ets.mnsu.edu/darbok/ethn402-502/reliability.ppt http://5martconsultingbandung.blogspot.com/2011/01/uji-asumsi-klasik.html
Doing Quantitative Research 26E02900, 6 ECTS Lecture 6: Structural Equations Modeling. Olli-Pekka Kauppila Daria Kautto
 Doing Quantitative Research 26E02900, 6 ECTS Lecture 6: Structural Equations Modeling Olli-Pekka Kauppila Daria Kautto Session VI, September 20 2017 Learning objectives 1. Get familiar with the basic idea
Understandable Statistics
 Understandable Statistics correlated to the Advanced Placement Program Course Description for Statistics Prepared for Alabama CC2 6/2003 2003 Understandable Statistics 2003 correlated to the Advanced Placement
12/30/2017. PSY 5102: Advanced Statistics for Psychological and Behavioral Research 2
 PSY 5102: Advanced Statistics for Psychological and Behavioral Research 2 Selecting a statistical test Relationships among major statistical methods General Linear Model and multiple regression Special
PSYCHOLOGY 320L Problem Set #4: Estimating Sample Size, Post Hoc Tests, and Two-Factor ANOVA
 PSYCHOLOGY 320L Problem Set #4: Estimating Sample Size, Post Hoc Tests, and Two-Factor ANOVA Name: Score: 1. Suppose you are planning an experiment for a class project with a group of students and you
Multivariate methods in rehabilitation
 Work 24 (2005) 205 212 205 IOS Press Speaking of Research Multivariate methods in rehabilitation Dimiter Dimitrov a, and Phillip D. Rumrill b a Graduate School of Education, George Mason University, 4400
Research Methods in Forest Sciences: Learning Diary. Yoko Lu December Research process
 Research Methods in Forest Sciences: Learning Diary Yoko Lu 285122 9 December 2016 1. Research process It is important to pursue and apply knowledge and understand the world under both natural and social
Chapter 13: Factorial ANOVA
 Chapter 13: Factorial ANOVA Smart Alex s Solutions Task 1 People s musical tastes tend to change as they get older. My parents, for example, after years of listening to relatively cool music when I was
Reveal Relationships in Categorical Data
 SPSS Categories 15.0 Specifications Reveal Relationships in Categorical Data Unleash the full potential of your data through perceptual mapping, optimal scaling, preference scaling, and dimension reduction
BIOL 458 BIOMETRY Lab 7 Multi-Factor ANOVA
 BIOL 458 BIOMETRY Lab 7 Multi-Factor ANOVA PART 1: Introduction to Factorial ANOVA ingle factor or One - Way Analysis of Variance can be used to test the null hypothesis that k or more treatment or group
ANALYSIS OF VARIANCE (ANOVA): TESTING DIFFERENCES INVOLVING THREE OR MORE MEANS
: TESTING DIFFERENCES INVOLVING THREE OR MORE MEANS") ANALYSIS OF VARIANCE (ANOVA): TESTING DIFFERENCES INVOLVING THREE OR MORE MEANS REVIEW Testing hypothesis using the difference between two means: One-sample t-test Independent-samples t-test Dependent/Paired-samples
ANALYSIS OF VARIANCE (ANOVA): TESTING DIFFERENCES INVOLVING THREE OR MORE MEANS REVIEW Testing hypothesis using the difference between two means: One-sample t-test Independent-samples t-test Dependent/Paired-samples
Research Analysis MICHAEL BERNSTEIN CS 376
 Research Analysis MICHAEL BERNSTEIN CS 376 Last time What is a statistical test? Chi-square t-test Paired t-test 2 Today ANOVA Posthoc tests Two-way ANOVA Repeated measures ANOVA 3 Recall: hypothesis testing
Nature Neuroscience: doi: /nn Supplementary Figure 1. Task timeline for Solo and Info trials.
 Supplementary Figure 1 Task timeline for Solo and Info trials. Each trial started with a New Round screen. Participants made a series of choices between two gambles, one of which was objectively riskier
Bonferroni Adjustments in Tests for Regression Coefficients Daniel J. Mundfrom Jamis J. Perrett Jay Schaffer
 Bonferroni Adjustments Bonferroni Adjustments in Tests for Regression Coefficients Daniel J. Mundfrom Jamis J. Perrett Jay Schaffer Adam Piccone Michelle Roozeboom University of Northern Colorado A common
STATISTICS AND RESEARCH DESIGN
 Statistics 1 STATISTICS AND RESEARCH DESIGN These are subjects that are frequently confused. Both subjects often evoke student anxiety and avoidance. To further complicate matters, both areas appear have
Daniel Boduszek University of Huddersfield
 Daniel Boduszek University of Huddersfield d.boduszek@hud.ac.uk Introduction to Correlation SPSS procedure for Pearson r Interpretation of SPSS output Presenting results Partial Correlation Correlation
Reliability of Ordination Analyses
 Reliability of Ordination Analyses Objectives: Discuss Reliability Define Consistency and Accuracy Discuss Validation Methods Opening Thoughts Inference Space: What is it? Inference space can be defined
Analysis of Variance (ANOVA) Program Transcript
 Program Transcript") Analysis of Variance (ANOVA) Program Transcript DR. JENNIFER ANN MORROW: Welcome to Analysis of Variance. My name is Dr. Jennifer Ann Morrow. In today's demonstration, I'll review with you the definition
Analysis of Variance (ANOVA) Program Transcript DR. JENNIFER ANN MORROW: Welcome to Analysis of Variance. My name is Dr. Jennifer Ann Morrow. In today's demonstration, I'll review with you the definition
Correlation and Regression
 Dublin Institute of Technology ARROW@DIT Books/Book Chapters School of Management 2012-10 Correlation and Regression Donal O'Brien Dublin Institute of Technology, donal.obrien@dit.ie Pamela Sharkey Scott
Experimental Studies. Statistical techniques for Experimental Data. Experimental Designs can be grouped. Experimental Designs can be grouped
 Experimental Studies Statistical techniques for Experimental Data Require appropriate manipulations and controls Many different designs Consider an overview of the designs Examples of some of the analyses