Chapter 1: Introduction to Statistics
|
|
|
- Georgiana Holt
- 6 years ago
- Views:
Transcription
1 Chapter 1: Introduction to Statistics
2 Variables A variable is a characteristic or condition that can change or take on different values. Most research begins with a general question about the relationship between two variables for a specific group of individuals.
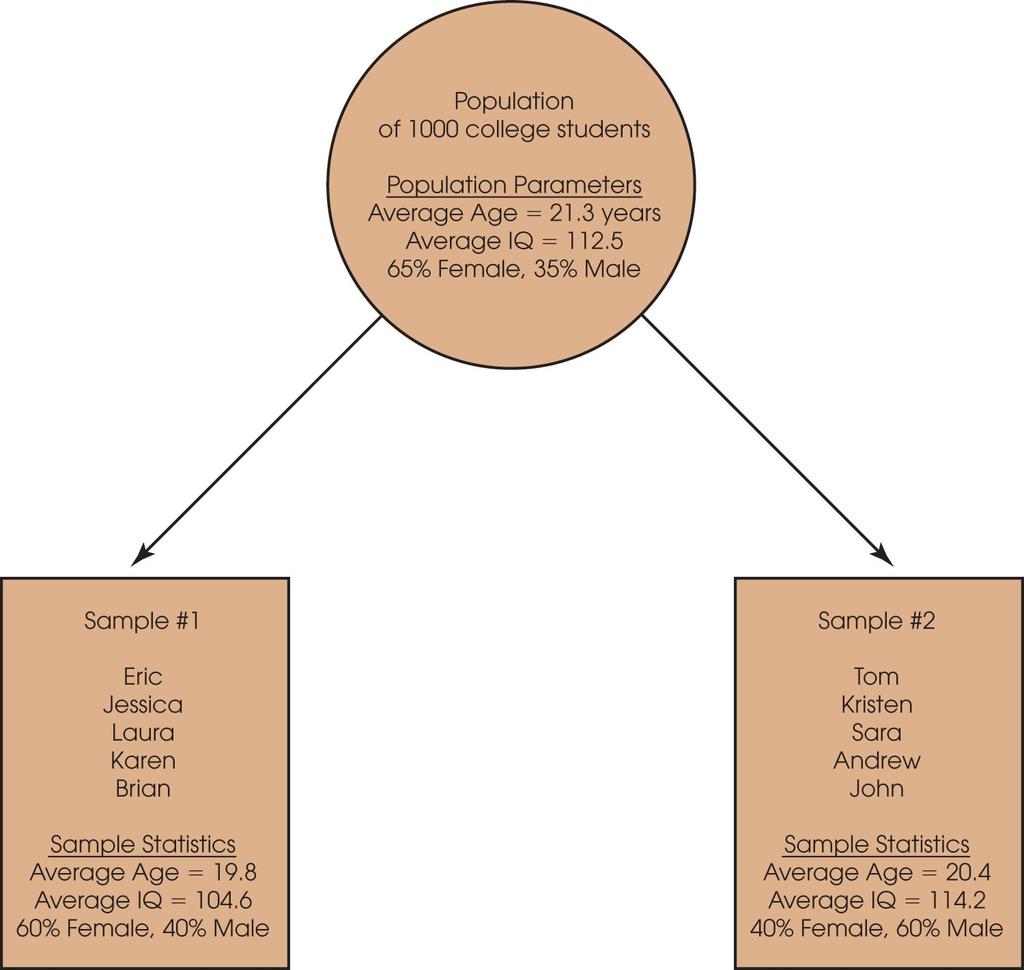
3 Population The entire group of individuals is called the population. For example, a researcher may be interested in the relation between class size (variable 1) and academic performance (variable 2) for the population of third-grade children.
4 Sample Usually populations are so large that a researcher cannot examine the entire group. Therefore, a sample is selected to represent the population in a research study. The goal is to use the results obtained from the sample to help answer questions about the population.
5
6 Descriptive Statistics Descriptive statistics are methods for organizing and summarizing data. For example, tables or graphs are used to organize data, and descriptive values such as the average score are used to summarize data. A descriptive value for a population is called a parameter and a descriptive value for a sample is called a statistic.
7 Inferential Statistics Inferential statistics are methods for using sample data to make general conclusions (inferences) about populations. Because a sample is typically only a part of the whole population, sample data provide only limited information about the population. As a result, sample statistics are generally imperfect representatives of the corresponding population parameters.
8 Sampling Error The discrepancy between a sample statistic and its population parameter is called sampling error. Defining and measuring sampling error is a large part of inferential statistics.
9
10 Data The measurements obtained in a research study are called the data. The goal of statistics is to help researchers organize and interpret the data.
11 Types of Variables Variables can be classified as discrete or continuous. Discrete variables (such as class size) consist of indivisible categories, and continuous variables (such as time or weight) are infinitely divisible into whatever units a researcher may choose. For example, time can be measured to the nearest minute, second, half-second, etc.
12 Real Limits To define the units for a continuous variable, a researcher must use real limits which are boundaries located exactly half-way between adjacent categories.
13 Measuring Variables To establish relationships between variables, researchers must observe the variables and record their observations. This requires that the variables be measured. The process of measuring a variable requires a set of categories called a scale of measurement and a process that classifies each individual into one category.
14 Four Types of Measurement Scales 1. A nominal scale is an unordered set of categories identified only by name. Nominal measurements only permit you to determine whether two individuals are the same or different. 2. An ordinal scale is an ordered set of categories. Ordinal measurements tell you the direction of difference between two individuals.
15 Four Types of Measurement Scales (cont d.) 3. An interval scale is an ordered series of equalsized categories. Interval measurements identify the direction and magnitude of a difference. The zero point is located arbitrarily on an interval scale. 4. A ratio scale is an interval scale where a value of zero indicates none of the variable. Ratio measurements identify the direction and magnitude of differences and allow ratio comparisons of measurements.
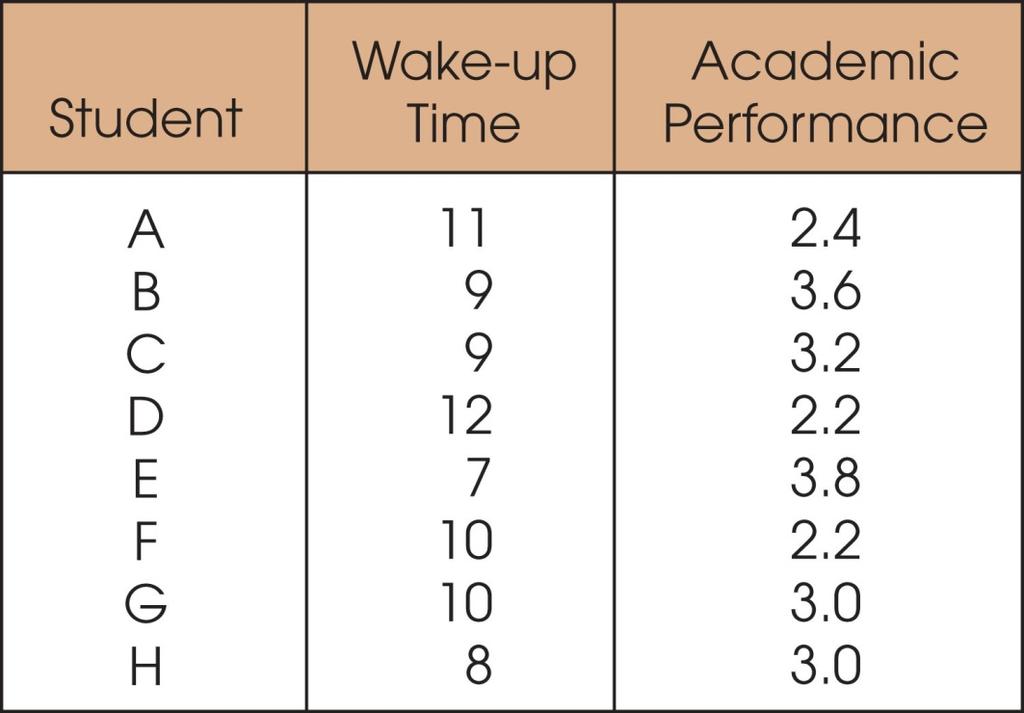
16 Correlational Studies The goal of a correlational study is to determine whether there is a relationship between two variables and to describe the relationship. A correlational study simply observes the two variables as they exist naturally.
17
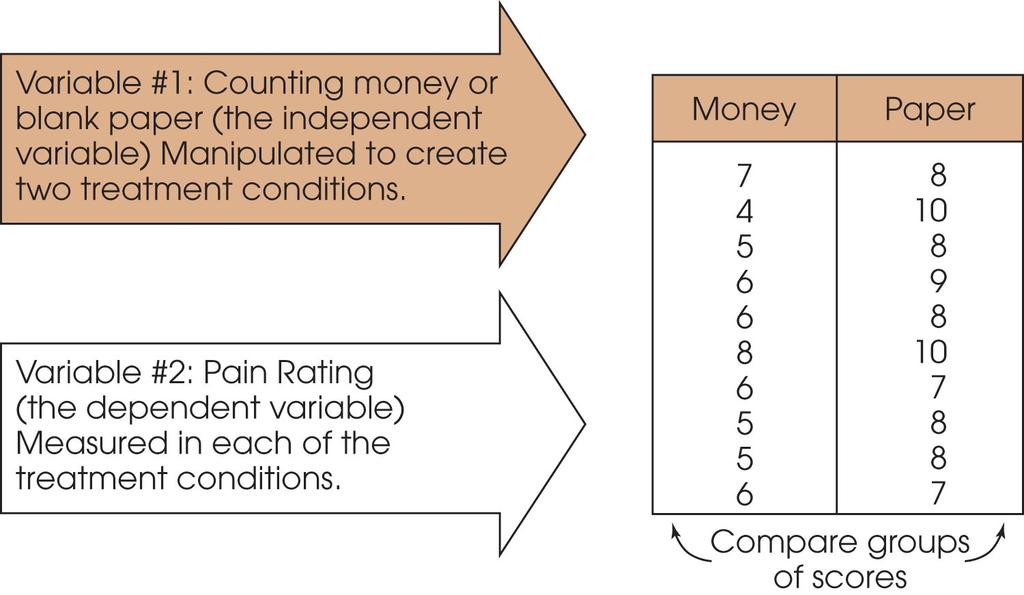
18 Experiments The goal of an experiment is to demonstrate a cause-and-effect relationship between two variables; that is, to show that changing the value of one variable causes changes to occur in a second variable.
19 Experiments (cont'd.) In an experiment, one variable is manipulated to create treatment conditions. A second variable is observed and measured to obtain scores for a group of individuals in each of the treatment conditions. The measurements are then compared to see if there are differences between treatment conditions. All other variables are controlled to prevent them from influencing the results. The manipulated variable is called the independent variable and the observed variable is the dependent variable.
20
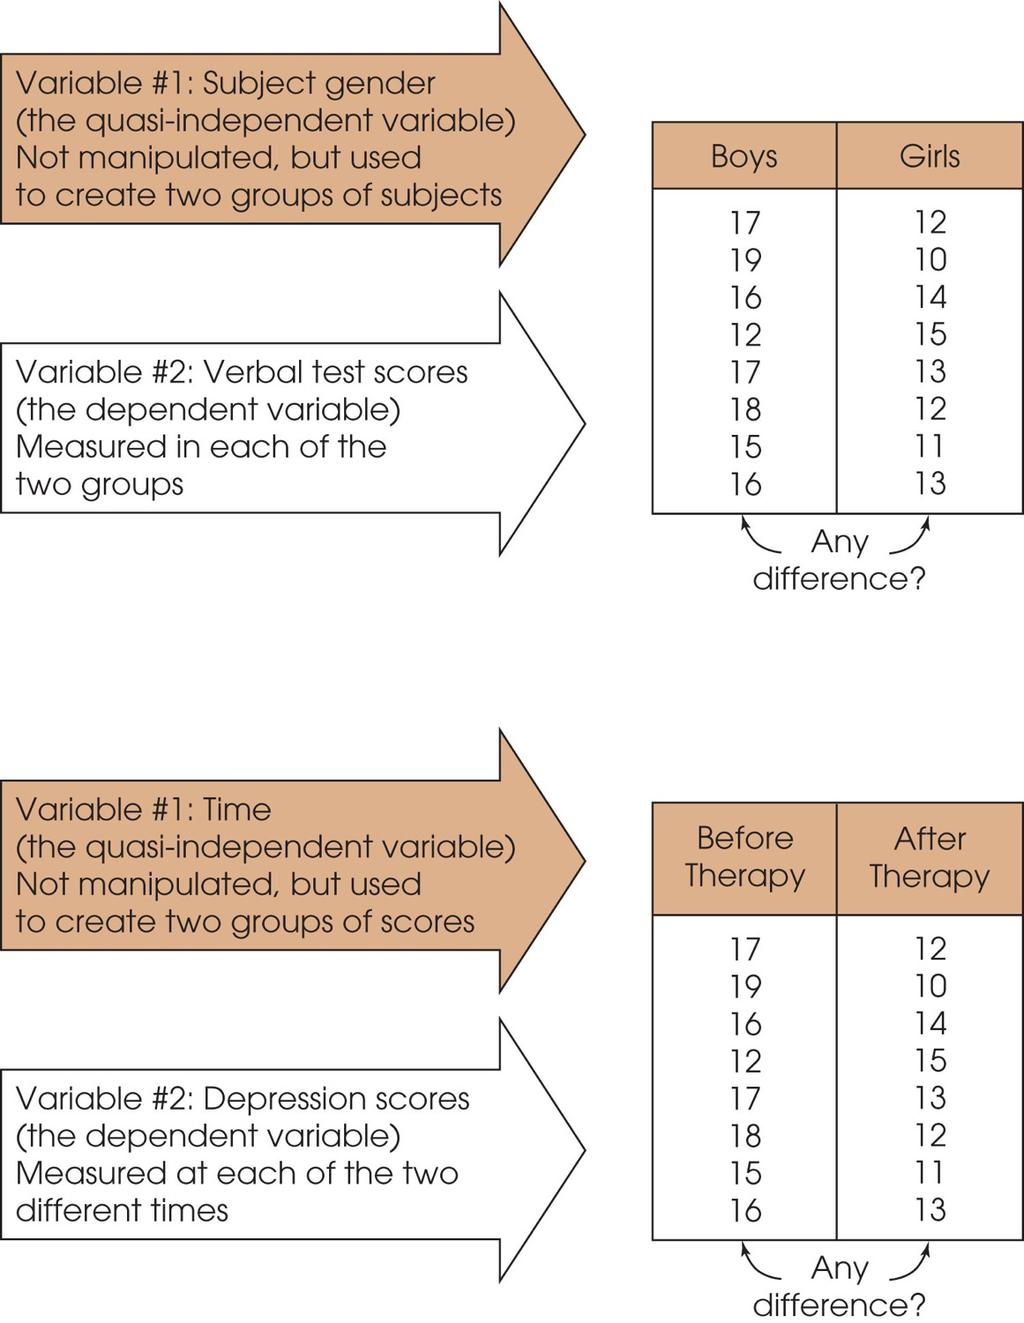
21 Other Types of Studies Other types of research studies, know as nonexperimental or quasi-experimental, are similar to experiments because they also compare groups of scores. These studies do not use a manipulated variable to differentiate the groups. Instead, the variable that differentiates the groups is usually a preexisting participant variable (such as male/female) or a time variable (such as before/after).
22 Other Types of Studies (cont'd.) Because these studies do not use the manipulation and control of true experiments, they cannot demonstrate cause and effect relationships. As a result, they are similar to correlational research because they simply demonstrate and describe relationships.
23
24 Statistical Notation The individual measurements or scores obtained for a research participant will be identified by the letter X (or X and Y if there are multiple scores for each individual). The number of scores in a data set will be identified by N for a population or n for a sample. Summing a set of values is a common operation in statistics and has its own notation. The Greek letter sigma, Σ, will be used to stand for "the sum of." For example, ΣX identifies the sum of the scores.
25 Order of Operations 1. All calculations within parentheses are done first. 2. Squaring or raising to other exponents is done second. 3. Multiplying, and dividing are done third, and should be completed in order from left to right. 4. Summation with the Σ notation is done next. 5. Any additional adding and subtracting is done last and should be completed in order from left to right.
26 Chapter 2: Frequency Distributions
27 Frequency Distributions After collecting data, the first task for a researcher is to organize and simplify the data so that it is possible to get a general overview of the results. This is the goal of descriptive statistical techniques. One method for simplifying and organizing data is to construct a frequency distribution.
28 Frequency Distributions (cont'd.) A frequency distribution is an organized tabulation showing exactly how many individuals are located in each category on the scale of measurement. A frequency distribution presents an organized picture of the entire set of scores, and it shows where each individual is located relative to others in the distribution.
29 Frequency Distribution Tables A frequency distribution table consists of at least two columns - one listing categories on the scale of measurement (X) and another for frequency (f). In the X column, values are listed from the highest to lowest, without skipping any. For the frequency column, tallies are determined for each value (how often each X value occurs in the data set). These tallies are the frequencies for each X value. The sum of the frequencies should equal N.
30 Frequency Distribution Tables (cont'd.) A third column can be used for the proportion (p) for each category: p = f/n. The sum of the p column should equal A fourth column can display the percentage of the distribution corresponding to each X value. The percentage is found by multiplying p by 100. The sum of the percentage column is 100%.
31 Regular Frequency Distribution When a frequency distribution table lists all of the individual categories (X values) it is called a regular frequency distribution.
32 Grouped Frequency Distribution Sometimes, however, a set of scores covers a wide range of values. In these situations, a list of all the X values would be quite long - too long to be a simple presentation of the data. To remedy this situation, a grouped frequency distribution table is used.
33 Grouped Frequency Distribution (cont'd.) In a grouped table, the X column lists groups of scores, called class intervals, rather than individual values. These intervals all have the same width, usually a simple number such as 2, 5, 10, and so on. Each interval begins with a value that is a multiple of the interval width. The interval width is selected so that the table will have approximately ten intervals.
34 Frequency Distribution Graphs In a frequency distribution graph, the score categories (X values) are listed on the X axis and the frequencies are listed on the Y axis. When the score categories consist of numerical scores from an interval or ratio scale, the graph should be either a histogram or a polygon.
35 Histograms In a histogram, a bar is centered above each score (or class interval) so that the height of the bar corresponds to the frequency and the width extends to the real limits, so that adjacent bars touch.
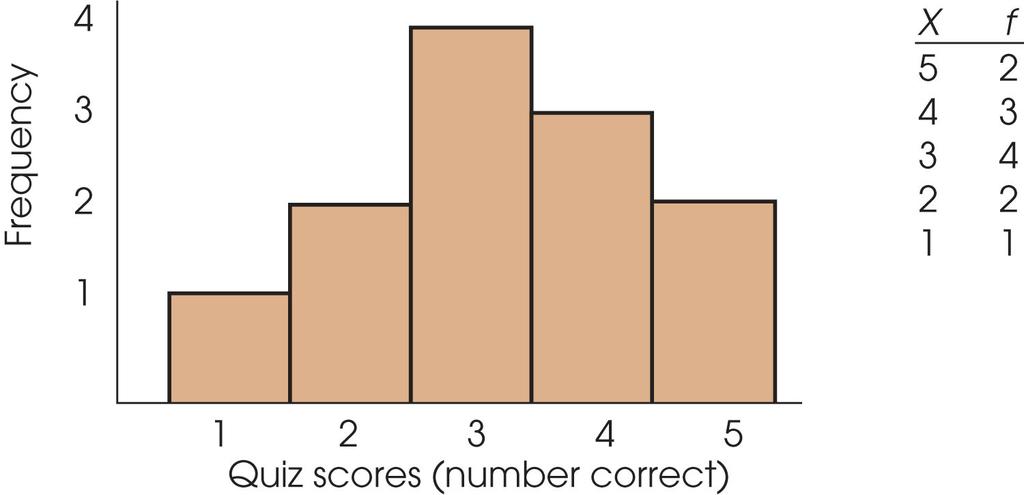
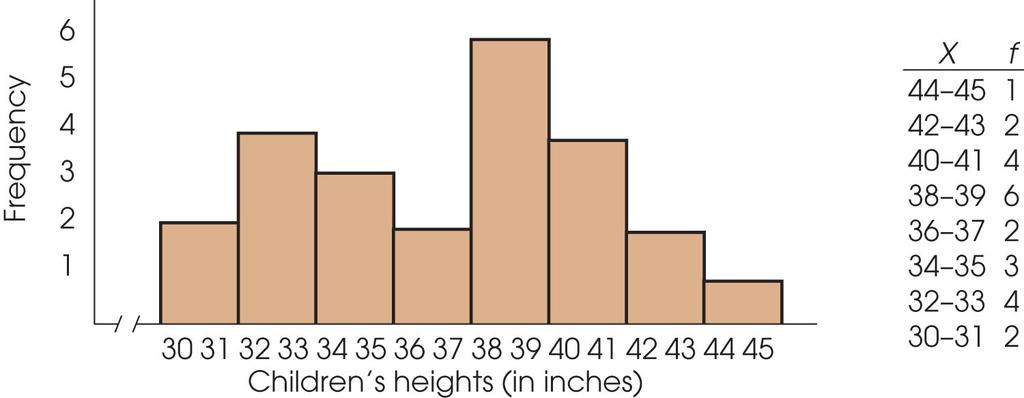
36
37 Polygons In a polygon, a dot is centered above each score so that the height of the dot corresponds to the frequency. The dots are then connected by straight lines. An additional line is drawn at each end to bring the graph back to a zero frequency.
38
39 Bar Graphs When the score categories (X values) are measurements from a nominal or an ordinal scale, the graph should be a bar graph. A bar graph is just like a histogram except that gaps or spaces are left between adjacent bars.
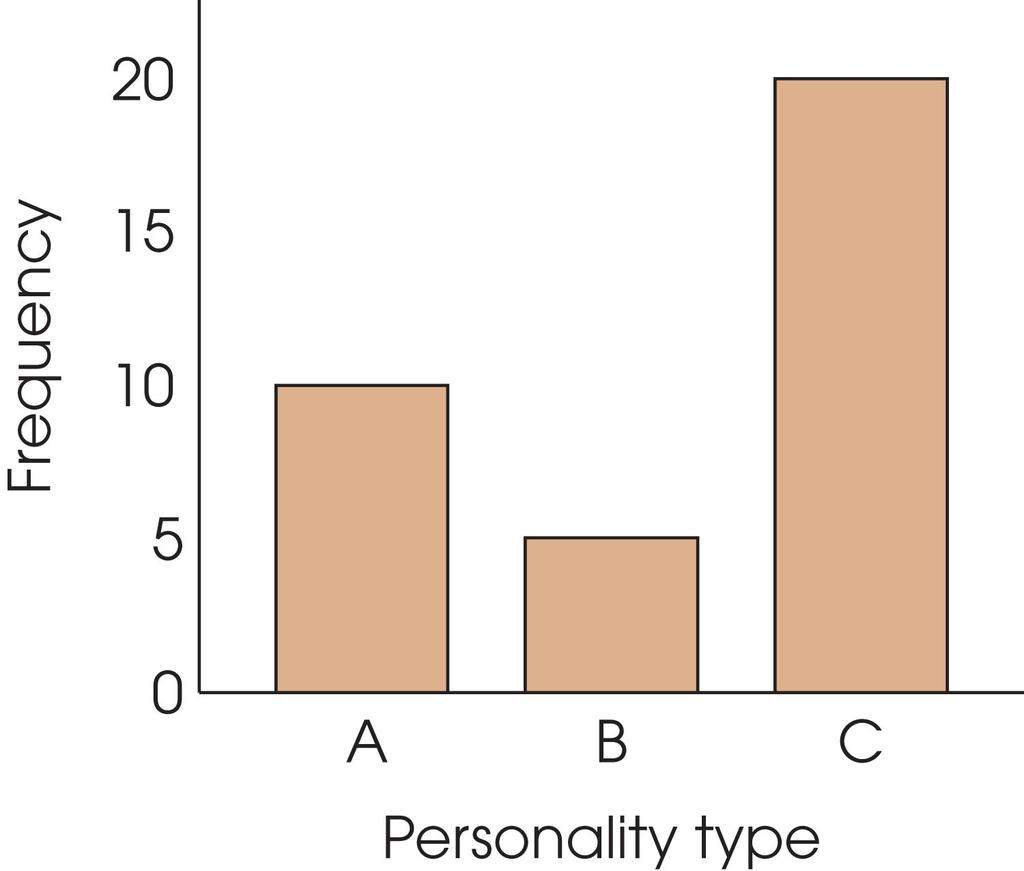
40
41 Relative Frequency Many populations are so large that it is impossible to know the exact number of individuals (frequency) for any specific category. In these situations, population distributions can be shown using relative frequency instead of the absolute number of individuals for each category.
42
43 Smooth Curve If the scores in the population are measured on an interval or ratio scale, it is customary to present the distribution as a smooth curve rather than a jagged histogram or polygon. The smooth curve emphasizes the fact that the distribution is not showing the exact frequency for each category.
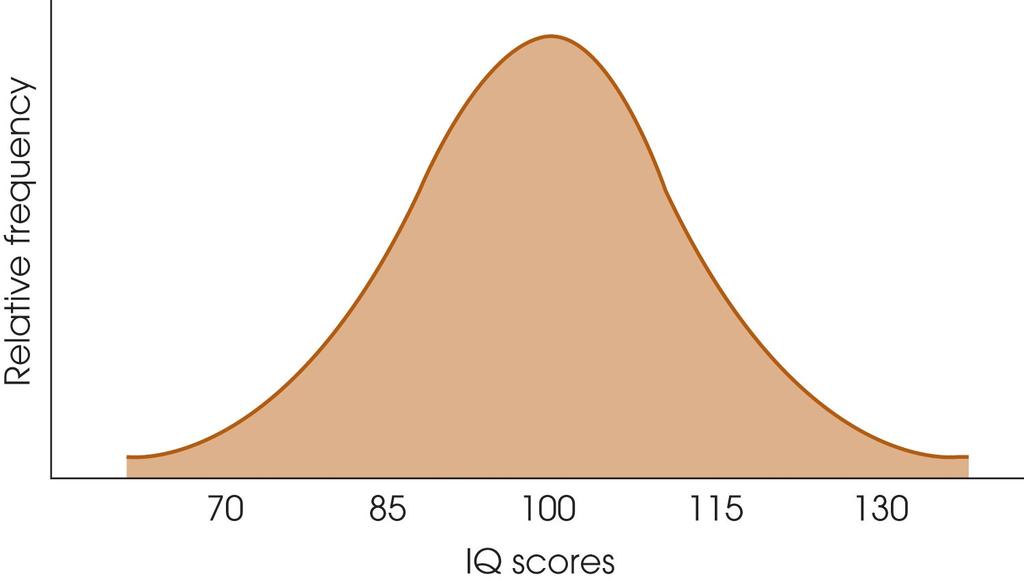
44
45 Frequency Distribution Graphs Frequency distribution graphs are useful because they show the entire set of scores. At a glance, you can determine the highest score, the lowest score, and where the scores are centered. The graph also shows whether the scores are clustered together or scattered over a wide range.
46 Shape A graph shows the shape of the distribution. A distribution is symmetrical if the left side of the graph is (roughly) a mirror image of the right side. One example of a symmetrical distribution is the bell-shaped normal distribution. On the other hand, distributions are skewed when scores pile up on one side of the distribution, leaving a "tail" of a few extreme values on the other side.
47 Positively and Negatively Skewed Distributions In a positively skewed distribution, the scores tend to pile up on the left side of the distribution with the tail tapering off to the right. In a negatively skewed distribution, the scores tend to pile up on the right side and the tail points to the left.
48
49 Percentiles, Percentile Ranks, and Interpolation The relative location of individual scores within a distribution can be described by percentiles and percentile ranks. The percentile rank for a particular X value is the percentage of individuals with scores equal to or less than that X value. When an X value is described by its rank, it is called a percentile.
50 Percentiles, Percentile Ranks, and Interpolation (cont'd.) To find percentiles and percentile ranks, two new columns are placed in the frequency distribution table: One is for cumulative frequency (cf) and the other is for cumulative percentage (c%). Each cumulative percentage identifies the percentile rank for the upper real limit of the corresponding score or class interval.
51 Interpolation When scores or percentages do not correspond to upper real limits or cumulative percentages, you must use interpolation to determine the corresponding ranks and percentiles. Interpolation is a mathematical process based on the assumption that the scores and the percentages change in a regular, linear fashion as you move through an interval from one end to the other.
52
53 Stem-and-Leaf Displays A stem-and-leaf display provides an efficient method for obtaining and displaying a frequency distribution. Each score is divided into a stem consisting of the first digit or digits, and a leaf consisting of the final digit. Then, go through the list of scores, one at a time, and write the leaf for each score beside its stem.
54 Stem-and-Leaf Displays (cont d.) The resulting display provides an organized picture of the entire distribution. The number of leaves beside each stem corresponds to the frequency, and the individual leaves identify the individual scores.
55
Chapter 1: Introduction to Statistics
 Chapter 1: Introduction to Statistics Statistics, Science, and Observations Definition: The term statistics refers to a set of mathematical procedures for organizing, summarizing, and interpreting information.
Basic Statistical Concepts, Research Design, & Notation
 , Research Design, & Notation Variables, Scores, & Data A variable is a characteristic or condition that can change or take on different values. Most research begins with a general question about the relationship
Chapter 1: Introduction to Statistics
 Chapter 1: Introduction o to Statistics Statistics, ti ti Science, and Observations Definition: The term statistics refers to a set of mathematical procedures for organizing, summarizing, and interpreting
CHAPTER 1. YAKUP ARI,Ph.D.(C)
") CHAPTER 1 YAKUP ARI,Ph.D.(C) math.stat.yeditepe@gmail.com DEFINITION OF STATISTICS The term STATISTICS refers to a set of mathematical procedures for organizing, summarizing, and interpreing information.
CHAPTER 1 YAKUP ARI,Ph.D.(C) math.stat.yeditepe@gmail.com DEFINITION OF STATISTICS The term STATISTICS refers to a set of mathematical procedures for organizing, summarizing, and interpreing information.
Chapter 2--Norms and Basic Statistics for Testing
 Chapter 2--Norms and Basic Statistics for Testing Student: 1. Statistical procedures that summarize and describe a series of observations are called A. inferential statistics. B. descriptive statistics.
STATISTICS AND RESEARCH DESIGN
 Statistics 1 STATISTICS AND RESEARCH DESIGN These are subjects that are frequently confused. Both subjects often evoke student anxiety and avoidance. To further complicate matters, both areas appear have
Chapter 2 Norms and Basic Statistics for Testing MULTIPLE CHOICE
 Chapter 2 Norms and Basic Statistics for Testing MULTIPLE CHOICE 1. When you assert that it is improbable that the mean intelligence test score of a particular group is 100, you are using. a. descriptive
Undertaking statistical analysis of
 Descriptive statistics: Simply telling a story Laura Delaney introduces the principles of descriptive statistical analysis and presents an overview of the various ways in which data can be presented by
Chapter 1: Exploring Data
 Chapter 1: Exploring Data Key Vocabulary:! individual! variable! frequency table! relative frequency table! distribution! pie chart! bar graph! two-way table! marginal distributions! conditional distributions!
Unit 1 Exploring and Understanding Data
 Unit 1 Exploring and Understanding Data Area Principle Bar Chart Boxplot Conditional Distribution Dotplot Empirical Rule Five Number Summary Frequency Distribution Frequency Polygon Histogram Interquartile
Appendix B Statistical Methods
 Appendix B Statistical Methods Figure B. Graphing data. (a) The raw data are tallied into a frequency distribution. (b) The same data are portrayed in a bar graph called a histogram. (c) A frequency polygon
Introduction to Statistical Data Analysis I
 Introduction to Statistical Data Analysis I JULY 2011 Afsaneh Yazdani Preface What is Statistics? Preface What is Statistics? Science of: designing studies or experiments, collecting data Summarizing/modeling/analyzing
CHAPTER 3 DATA ANALYSIS: DESCRIBING DATA
 Data Analysis: Describing Data CHAPTER 3 DATA ANALYSIS: DESCRIBING DATA In the analysis process, the researcher tries to evaluate the data collected both from written documents and from other sources such
Still important ideas
 Readings: OpenStax - Chapters 1 13 & Appendix D & E (online) Plous Chapters 17 & 18 - Chapter 17: Social Influences - Chapter 18: Group Judgments and Decisions Still important ideas Contrast the measurement
Statistics. Nur Hidayanto PSP English Education Dept. SStatistics/Nur Hidayanto PSP/PBI
 Statistics Nur Hidayanto PSP English Education Dept. RESEARCH STATISTICS WHAT S THE RELATIONSHIP? RESEARCH RESEARCH positivistic Prepositivistic Postpositivistic Data Initial Observation (research Question)
Describe what is meant by a placebo Contrast the double-blind procedure with the single-blind procedure Review the structure for organizing a memo
 Business Statistics The following was provided by Dr. Suzanne Delaney, and is a comprehensive review of Business Statistics. The workshop instructor will provide relevant examples during the Skills Assessment
SPRING GROVE AREA SCHOOL DISTRICT. Course Description. Instructional Strategies, Learning Practices, Activities, and Experiences.
 SPRING GROVE AREA SCHOOL DISTRICT PLANNED COURSE OVERVIEW Course Title: Basic Introductory Statistics Grade Level(s): 11-12 Units of Credit: 1 Classification: Elective Length of Course: 30 cycles Periods
Biostatistics. Donna Kritz-Silverstein, Ph.D. Professor Department of Family & Preventive Medicine University of California, San Diego
 Biostatistics Donna Kritz-Silverstein, Ph.D. Professor Department of Family & Preventive Medicine University of California, San Diego (858) 534-1818 dsilverstein@ucsd.edu Introduction Overview of statistical
Statistics is a broad mathematical discipline dealing with
 Statistical Primer for Cardiovascular Research Descriptive Statistics and Graphical Displays Martin G. Larson, SD Statistics is a broad mathematical discipline dealing with techniques for the collection,
This is Descriptive Statistics, chapter 12 from the book Psychology Research Methods: Core Skills and Concepts (index.html) (v. 1.0).
 (v. 1.0).") This is Descriptive Statistics, chapter 12 from the book Psychology Research Methods: Core Skills and Concepts (index.html) (v. 1.0). This book is licensed under a Creative Commons by-nc-sa 3.0 (http://creativecommons.org/licenses/by-nc-sa/
This is Descriptive Statistics, chapter 12 from the book Psychology Research Methods: Core Skills and Concepts (index.html) (v. 1.0). This book is licensed under a Creative Commons by-nc-sa 3.0 (http://creativecommons.org/licenses/by-nc-sa/
Business Statistics Probability
 Business Statistics The following was provided by Dr. Suzanne Delaney, and is a comprehensive review of Business Statistics. The workshop instructor will provide relevant examples during the Skills Assessment
Probability and Statistics. Chapter 1
 Probability and Statistics Chapter 1 Individuals and Variables Individuals and Variables Individuals are objects described by data. Individuals and Variables Individuals are objects described by data.
Statistics is the science of collecting, organizing, presenting, analyzing, and interpreting data to assist in making effective decisions
 Readings: OpenStax Textbook - Chapters 1 5 (online) Appendix D & E (online) Plous - Chapters 1, 5, 6, 13 (online) Introductory comments Describe how familiarity with statistical methods can - be associated
Readings: Textbook readings: OpenStax - Chapters 1 13 (emphasis on Chapter 12) Online readings: Appendix D, E & F
 Online readings: Appendix D, E & F") Readings: Textbook readings: OpenStax - Chapters 1 13 (emphasis on Chapter 12) Online readings: Appendix D, E & F Plous Chapters 17 & 18 Chapter 17: Social Influences Chapter 18: Group Judgments and Decisions
Readings: Textbook readings: OpenStax - Chapters 1 13 (emphasis on Chapter 12) Online readings: Appendix D, E & F Plous Chapters 17 & 18 Chapter 17: Social Influences Chapter 18: Group Judgments and Decisions
Describe what is meant by a placebo Contrast the double-blind procedure with the single-blind procedure Review the structure for organizing a memo
 Please note the page numbers listed for the Lind book may vary by a page or two depending on which version of the textbook you have. Readings: Lind 1 11 (with emphasis on chapters 10, 11) Please note chapter
Medical Statistics 1. Basic Concepts Farhad Pishgar. Defining the data. Alive after 6 months?
 Medical Statistics 1 Basic Concepts Farhad Pishgar Defining the data Population and samples Except when a full census is taken, we collect data on a sample from a much larger group called the population.
Content Scope & Sequence
 Content Scope & Sequence GRADE 2 scottforesman.com (800) 552-2259 Copyright Pearson Education, Inc. 0606443 1 Counting, Coins, and Combinations Counting, Coins, and Combinations (Addition, Subtraction,
Descriptive Statistics Lecture
 Definitions: Lecture Psychology 280 Orange Coast College 2/1/2006 Statistics have been defined as a collection of methods for planning experiments, obtaining data, and then analyzing, interpreting and
Statistics for Psychology
 Statistics for Psychology SIXTH EDITION CHAPTER 3 Some Key Ingredients for Inferential Statistics Some Key Ingredients for Inferential Statistics Psychologists conduct research to test a theoretical principle
MBA 605 Business Analytics Don Conant, PhD. GETTING TO THE STANDARD NORMAL DISTRIBUTION
 MBA 605 Business Analytics Don Conant, PhD. GETTING TO THE STANDARD NORMAL DISTRIBUTION Variables In the social sciences data are the observed and/or measured characteristics of individuals and groups
Student name: SOCI 420 Advanced Methods of Social Research Fall 2017
 SOCI 420 Advanced Methods of Social Research Fall 2017 EXAM 1 RUBRIC Instructor: Ernesto F. L. Amaral, Assistant Professor, Department of Sociology Date: October 12, 2017 (Thursday) Section 903: 9:35 10:50am
Statistics is the science of collecting, organizing, presenting, analyzing, and interpreting data to assist in making effective decisions
 Readings: OpenStax Textbook - Chapters 1 5 (online) Appendix D & E (online) Plous - Chapters 1, 5, 6, 13 (online) Introductory comments Describe how familiarity with statistical methods can - be associated
Still important ideas
 Readings: OpenStax - Chapters 1 11 + 13 & Appendix D & E (online) Plous - Chapters 2, 3, and 4 Chapter 2: Cognitive Dissonance, Chapter 3: Memory and Hindsight Bias, Chapter 4: Context Dependence Still
Displaying the Order in a Group of Numbers Using Tables and Graphs
 SIXTH EDITION 1 Displaying the Order in a Group of Numbers Using Tables and Graphs Statistics (stats) is a branch of mathematics that focuses on the organization, analysis, and interpretation of a group
Quantitative Methods in Computing Education Research (A brief overview tips and techniques)
") Quantitative Methods in Computing Education Research (A brief overview tips and techniques) Dr Judy Sheard Senior Lecturer Co-Director, Computing Education Research Group Monash University judy.sheard@monash.edu
Quantitative Methods in Computing Education Research (A brief overview tips and techniques) Dr Judy Sheard Senior Lecturer Co-Director, Computing Education Research Group Monash University judy.sheard@monash.edu
Stats 95. Statistical analysis without compelling presentation is annoying at best and catastrophic at worst. From raw numbers to meaningful pictures
 Stats 95 Statistical analysis without compelling presentation is annoying at best and catastrophic at worst. From raw numbers to meaningful pictures Stats 95 Why Stats? 200 countries over 200 years http://www.youtube.com/watch?v=jbksrlysojo
AP Psych - Stat 1 Name Period Date. MULTIPLE CHOICE. Choose the one alternative that best completes the statement or answers the question.
 AP Psych - Stat 1 Name Period Date MULTIPLE CHOICE. Choose the one alternative that best completes the statement or answers the question. 1) In a set of incomes in which most people are in the $15,000
Chapter 1: Explaining Behavior
 Chapter 1: Explaining Behavior GOAL OF SCIENCE is to generate explanations for various puzzling natural phenomenon. - Generate general laws of behavior (psychology) RESEARCH: principle method for acquiring
q2_2 MULTIPLE CHOICE. Choose the one alternative that best completes the statement or answers the question.
 q2_2 MULTIPLE CHOICE. Choose the one alternative that best completes the statement or answers the question. A sporting goods retailer conducted a customer survey to determine its customers primary reason
Readings: Textbook readings: OpenStax - Chapters 1 4 Online readings: Appendix D, E & F Online readings: Plous - Chapters 1, 5, 6, 13
 Readings: Textbook readings: OpenStax - Chapters 1 4 Online readings: Appendix D, E & F Online readings: Plous - Chapters 1, 5, 6, 13 Introductory comments Describe how familiarity with statistical methods
Population. Sample. AP Statistics Notes for Chapter 1 Section 1.0 Making Sense of Data. Statistics: Data Analysis:
 Section 1.0 Making Sense of Data Statistics: Data Analysis: Individuals objects described by a set of data Variable any characteristic of an individual Categorical Variable places an individual into one
Theory. = an explanation using an integrated set of principles that organizes observations and predicts behaviors or events.
 Definition Slides Hindsight Bias = the tendency to believe, after learning an outcome, that one would have foreseen it. Also known as the I knew it all along phenomenon. Critical Thinking = thinking that
WDHS Curriculum Map Probability and Statistics. What is Statistics and how does it relate to you?
 WDHS Curriculum Map Probability and Statistics Time Interval/ Unit 1: Introduction to Statistics 1.1-1.3 2 weeks S-IC-1: Understand statistics as a process for making inferences about population parameters
9 research designs likely for PSYC 2100
 9 research designs likely for PSYC 2100 1) 1 factor, 2 levels, 1 group (one group gets both treatment levels) related samples t-test (compare means of 2 levels only) 2) 1 factor, 2 levels, 2 groups (one
Chapter 20: Test Administration and Interpretation
 Chapter 20: Test Administration and Interpretation Thought Questions Why should a needs analysis consider both the individual and the demands of the sport? Should test scores be shared with a team, or
DOWNLOAD PDF SUMMARIZING AND INTERPRETING DATA : USING STATISTICS
 Chapter 1 : Summarizing Numerical Data Sets Worksheets Stem and Leaf Activity Sheets with Answers. Students first create the stem and leaf plot. Then they use it to answer questions. This is a great way
STP226 Brief Class Notes Instructor: Ela Jackiewicz
 CHAPTER 2 Organizing Data Statistics=science of analyzing data. Information collected (data) is gathered in terms of variables (characteristics of a subject that can be assigned a numerical value or nonnumerical
Results & Statistics: Description and Correlation. I. Scales of Measurement A Review
 Results & Statistics: Description and Correlation The description and presentation of results involves a number of topics. These include scales of measurement, descriptive statistics used to summarize
Lecture Outline. Biost 517 Applied Biostatistics I. Purpose of Descriptive Statistics. Purpose of Descriptive Statistics
 Biost 517 Applied Biostatistics I Scott S. Emerson, M.D., Ph.D. Professor of Biostatistics University of Washington Lecture 3: Overview of Descriptive Statistics October 3, 2005 Lecture Outline Purpose
Chapter 1. Picturing Distributions with Graphs
 Chapter 1 Picturing Distributions with Graphs Statistics Statistics is a science that involves the extraction of information from numerical data obtained during an experiment or from a sample. It involves
Describe what is meant by a placebo Contrast the double-blind procedure with the single-blind procedure Review the structure for organizing a memo
 Please note the page numbers listed for the Lind book may vary by a page or two depending on which version of the textbook you have. Readings: Lind 1 11 (with emphasis on chapters 5, 6, 7, 8, 9 10 & 11)
AP Psych - Stat 2 Name Period Date. MULTIPLE CHOICE. Choose the one alternative that best completes the statement or answers the question.
 AP Psych - Stat 2 Name Period Date MULTIPLE CHOICE. Choose the one alternative that best completes the statement or answers the question. 1) In a set of incomes in which most people are in the $15,000
Organizing Data. Types of Distributions. Uniform distribution All ranges or categories have nearly the same value a.k.a. rectangular distribution
 Organizing Data Frequency How many of the data are in a category or range Just count up how many there are Notation x = number in one category n = total number in sample (all categories combined) Relative
The Nature of Probability and Statistics
 Chapter 1 The Nature of Probability and Statistics Chapter 1 Overview Introduction 1-1 Descriptive and Inferential Statistics 1-2 Variables and Types of Data 1-3 Data Collection & Sampling Techniques 1-4
On the purpose of testing:
 Why Evaluation & Assessment is Important Feedback to students Feedback to teachers Information to parents Information for selection and certification Information for accountability Incentives to increase
Data, frequencies, and distributions. Martin Bland. Types of data. Types of data. Clinical Biostatistics
 Clinical Biostatistics Data, frequencies, and distributions Martin Bland Professor of Health Statistics University of York http://martinbland.co.uk/ Types of data Qualitative data arise when individuals
PRINCIPLES OF STATISTICS
 PRINCIPLES OF STATISTICS STA-201-TE This TECEP is an introduction to descriptive and inferential statistics. Topics include: measures of central tendency, variability, correlation, regression, hypothesis
PRINTABLE VERSION. Quiz 1. True or False: The amount of rainfall in your state last month is an example of continuous data.
 Question 1 PRINTABLE VERSION Quiz 1 True or False: The amount of rainfall in your state last month is an example of continuous data. a) True b) False Question 2 True or False: The standard deviation is
Variability. After reading this chapter, you should be able to do the following:
 LEARIG OBJECTIVES C H A P T E R 3 Variability After reading this chapter, you should be able to do the following: Explain what the standard deviation measures Compute the variance and the standard deviation
Math Workshop On-Line Tutorial Judi Manola Paul Catalano
 Math Workshop On-Line Tutorial Judi Manola Paul Catalano 1 Session 1 Kinds of Numbers and Data, Fractions, Negative Numbers, Rounding, Averaging, Properties of Real Numbers, Exponents and Square Roots,
Statistical Methods and Reasoning for the Clinical Sciences
 Statistical Methods and Reasoning for the Clinical Sciences Evidence-Based Practice Eiki B. Satake, PhD Contents Preface Introduction to Evidence-Based Statistics: Philosophical Foundation and Preliminaries
Understandable Statistics
 Understandable Statistics correlated to the Advanced Placement Program Course Description for Statistics Prepared for Alabama CC2 6/2003 2003 Understandable Statistics 2003 correlated to the Advanced Placement
Chapter 7: Descriptive Statistics
 Chapter Overview Chapter 7 provides an introduction to basic strategies for describing groups statistically. Statistical concepts around normal distributions are discussed. The statistical procedures of
Readings: Textbook readings: OpenStax - Chapters 1 11 Online readings: Appendix D, E & F Plous Chapters 10, 11, 12 and 14
 Readings: Textbook readings: OpenStax - Chapters 1 11 Online readings: Appendix D, E & F Plous Chapters 10, 11, 12 and 14 Still important ideas Contrast the measurement of observable actions (and/or characteristics)
UNIT V: Analysis of Non-numerical and Numerical Data SWK 330 Kimberly Baker-Abrams. In qualitative research: Grounded Theory
 UNIT V: Analysis of Non-numerical and Numerical Data SWK 330 Kimberly Baker-Abrams In qualitative research: analysis is on going (occurs as data is gathered) must be careful not to draw conclusions before
2.4.1 STA-O Assessment 2
 2.4.1 STA-O Assessment 2 Work all the problems and determine the correct answers. When you have completed the assessment, open the Assessment 2 activity and input your responses into the online grading
STA Module 9 Confidence Intervals for One Population Mean
 STA 2023 Module 9 Confidence Intervals for One Population Mean Learning Objectives Upon completing this module, you should be able to: 1. Obtain a point estimate for a population mean. 2. Find and interpret
Chapter 2: The Organization and Graphic Presentation of Data Test Bank
 Essentials of Social Statistics for a Diverse Society 3rd Edition Leon Guerrero Test Bank Full Download: https://testbanklive.com/download/essentials-of-social-statistics-for-a-diverse-society-3rd-edition-leon-guerrero-tes
Section 1.2 Displaying Quantitative Data with Graphs. Dotplots
 Section 1.2 Displaying Quantitative Data with Graphs Dotplots One of the simplest graphs to construct and interpret is a dotplot. Each data value is shown as a dot above its location on a number line.
CCM6+7+ Unit 12 Data Collection and Analysis
 Page 1 CCM6+7+ Unit 12 Packet: Statistics and Data Analysis CCM6+7+ Unit 12 Data Collection and Analysis Big Ideas Page(s) What is data/statistics? 2-4 Measures of Reliability and Variability: Sampling,
What you should know before you collect data. BAE 815 (Fall 2017) Dr. Zifei Liu
 Dr. Zifei Liu") What you should know before you collect data BAE 815 (Fall 2017) Dr. Zifei Liu Zifeiliu@ksu.edu Types and levels of study Descriptive statistics Inferential statistics How to choose a statistical test
What you should know before you collect data BAE 815 (Fall 2017) Dr. Zifei Liu Zifeiliu@ksu.edu Types and levels of study Descriptive statistics Inferential statistics How to choose a statistical test
Math Workshop On-Line Tutorial Judi Manola Paul Catalano. Slide 1. Slide 3
 Kinds of Numbers and Data First we re going to think about the kinds of numbers you will use in the problems you will encounter in your studies. Then we will expand a bit and think about kinds of data.
1.4 - Linear Regression and MS Excel
 1.4 - Linear Regression and MS Excel Regression is an analytic technique for determining the relationship between a dependent variable and an independent variable. When the two variables have a linear
3 CONCEPTUAL FOUNDATIONS OF STATISTICS
 3 CONCEPTUAL FOUNDATIONS OF STATISTICS In this chapter, we examine the conceptual foundations of statistics. The goal is to give you an appreciation and conceptual understanding of some basic statistical
bivariate analysis: The statistical analysis of the relationship between two variables.
 bivariate analysis: The statistical analysis of the relationship between two variables. cell frequency: The number of cases in a cell of a cross-tabulation (contingency table). chi-square (χ 2 ) test for
Statistical Techniques. Masoud Mansoury and Anas Abulfaraj
 Statistical Techniques Masoud Mansoury and Anas Abulfaraj What is Statistics? https://www.youtube.com/watch?v=lmmzj7599pw The definition of Statistics The practice or science of collecting and analyzing
Unit 7 Comparisons and Relationships
 Unit 7 Comparisons and Relationships Objectives: To understand the distinction between making a comparison and describing a relationship To select appropriate graphical displays for making comparisons
Research Designs and Potential Interpretation of Data: Introduction to Statistics. Let s Take it Step by Step... Confused by Statistics?
 Research Designs and Potential Interpretation of Data: Introduction to Statistics Karen H. Hagglund, M.S. Medical Education St. John Hospital & Medical Center Karen.Hagglund@ascension.org Let s Take it
Chapter 23. Inference About Means. Copyright 2010 Pearson Education, Inc.
 Chapter 23 Inference About Means Copyright 2010 Pearson Education, Inc. Getting Started Now that we know how to create confidence intervals and test hypotheses about proportions, it d be nice to be able
Example The median earnings of the 28 male students is the average of the 14th and 15th, or 3+3
 Lecture 3 Nancy Pfenning Stats 1000 We learned last time how to construct a stemplot to display a single quantitative variable. A back-to-back stemplot is a useful display tool when we are interested in
Lesson 9 Presentation and Display of Quantitative Data
 Lesson 9 Presentation and Display of Quantitative Data Learning Objectives All students will identify and present data using appropriate graphs, charts and tables. All students should be able to justify
Analysis and Interpretation of Data Part 1
 Analysis and Interpretation of Data Part 1 DATA ANALYSIS: PRELIMINARY STEPS 1. Editing Field Edit Completeness Legibility Comprehensibility Consistency Uniformity Central Office Edit 2. Coding Specifying
Publisher: Pearson Education, Inc. publishing as Prentice Hall
 Section I. Correlation with the Mathematics 2009 SOL and Curriculum Framework Rating 6.1 6.2 6.3 6.4 6.5 6.6 6.7 6.8 6.9 6.10 6.11 6.12 6.13 6.14 6.15 6.16 6.17 6.18 6.19 6.20 Section II. Additional Criteria:
Types of Statistics. Censored data. Files for today (June 27) Lecture and Homework INTRODUCTION TO BIOSTATISTICS. Today s Outline
 Lecture and Homework INTRODUCTION TO BIOSTATISTICS. Today s Outline") INTRODUCTION TO BIOSTATISTICS FOR GRADUATE AND MEDICAL STUDENTS Files for today (June 27) Lecture and Homework Descriptive Statistics and Graphically Visualizing Data Lecture #2 (1 file) PPT presentation
INTRODUCTION TO BIOSTATISTICS FOR GRADUATE AND MEDICAL STUDENTS Files for today (June 27) Lecture and Homework Descriptive Statistics and Graphically Visualizing Data Lecture #2 (1 file) PPT presentation
Examining differences between two sets of scores
 6 Examining differences between two sets of scores In this chapter you will learn about tests which tell us if there is a statistically significant difference between two sets of scores. In so doing you
MEASUREMENT OF SKILLED PERFORMANCE
 MEASUREMENT OF SKILLED PERFORMANCE Name: Score: Part I: Introduction The most common tasks used for evaluating performance in motor behavior may be placed into three categories: time, response magnitude,
Six Sigma Glossary Lean 6 Society
 Six Sigma Glossary Lean 6 Society ABSCISSA ACCEPTANCE REGION ALPHA RISK ALTERNATIVE HYPOTHESIS ASSIGNABLE CAUSE ASSIGNABLE VARIATIONS The horizontal axis of a graph The region of values for which the null
AP Statistics TOPIC A - Unit 2 MULTIPLE CHOICE
 AP Statistics TOPIC A - Unit 2 MULTIPLE CHOICE Name Date 1) True or False: In a normal distribution, the mean, median and mode all have the same value and the graph of the distribution is symmetric. 2)
Homework Exercises for PSYC 3330: Statistics for the Behavioral Sciences
 Homework Exercises for PSYC 3330: Statistics for the Behavioral Sciences compiled and edited by Thomas J. Faulkenberry, Ph.D. Department of Psychological Sciences Tarleton State University Version: July
HW 1 - Bus Stat. Student:
 HW 1 - Bus Stat Student: 1. An identification of police officers by rank would represent a(n) level of measurement. A. Nominative C. Interval D. Ratio 2. A(n) variable is a qualitative variable such that
CHAPTER 2. MEASURING AND DESCRIBING VARIABLES
 4 Chapter 2 CHAPTER 2. MEASURING AND DESCRIBING VARIABLES 1. A. Age: name/interval; military dictatorship: value/nominal; strongly oppose: value/ ordinal; election year: name/interval; 62 percent: value/interval;
Making Inferences from Experiments
 11.6 Making Inferences from Experiments Essential Question How can you test a hypothesis about an experiment? Resampling Data Yield (kilograms) Control Group Treatment Group 1. 1.1 1.2 1. 1.5 1.4.9 1.2
Unit 2: Probability and distributions Lecture 3: Normal distribution
 Unit 2: Probability and distributions Lecture 3: Normal distribution Statistics 101 Thomas Leininger May 23, 2013 Announcements 1 Announcements 2 Normal distribution Normal distribution model 68-95-99.7
Knowledge discovery tools 381
 Knowledge discovery tools 381 hours, and prime time is prime time precisely because more people tend to watch television at that time.. Compare histograms from di erent periods of time. Changes in histogram
CHAPTER - 6 STATISTICAL ANALYSIS. This chapter discusses inferential statistics, which use sample data to
 CHAPTER - 6 STATISTICAL ANALYSIS 6.1 Introduction This chapter discusses inferential statistics, which use sample data to make decisions or inferences about population. Populations are group of interest
UNIVERSITY OF TORONTO SCARBOROUGH Department of Computer and Mathematical Sciences Midterm Test February 2016
 UNIVERSITY OF TORONTO SCARBOROUGH Department of Computer and Mathematical Sciences Midterm Test February 2016 STAB22H3 Statistics I, LEC 01 and LEC 02 Duration: 1 hour and 45 minutes Last Name: First Name:
Frequency Distributions
 Frequency Distributions In this section, we look at ways to organize data in order to make it user friendly. We begin by presenting two data sets, from which, because of how the data is presented, it is
Statistics: Making Sense of the Numbers
 Statistics: Making Sense of the Numbers Chapter 9 This multimedia product and its contents are protected under copyright law. The following are prohibited by law: any public performance or display, including