MATH 1040 Skittles Data Project
|
|
|
- Abner Simmons
- 6 years ago
- Views:
Transcription
1 Laura Boren MATH 1040 Data Project For our project in MATH 1040 everyone in the class was asked to buy a 2.17 individual sized bag of skittles and count the number of each color of candy in the bag. The class data was compiled and we used it for a number of different exercises involving a different aspect of statistics. For the first part of the project, we determined the proportion of each color of candy and created a Pareto chart and a pie chart for the total number of each color of candies in the entire class. We compared the class data to our own personal data and noted any similarities or differences. For part 2 of the project we used the skittles data to create statistics summaries of the mean, standard deviation and 5-number summary. We made a frequency histogram of the total number of candies as well as a box plot. Individually, I also wrote a paragraph about the significance of different qualitative and quantitative methods of analysis. The last part of the project involved confidence intervals. We found 3 different confidence intervals for the population proportion, mean, and standard deviation and wrote an analysis about what each confidence interval meant.

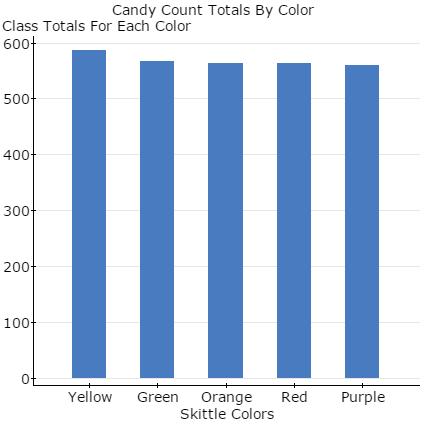
2 Laura Boren, Melissa Oneal, Justin Peck, Nathan Schafer Math 1040 Class Proportions Color Count Proportion of Total Red Orange Green Purple Yellow Total Number of in the class MATH 1040 Data
3 Laura Boren, Melissa Oneal, Justin Peck, Nathan Schafer Does the Class data represent a random sample? Yes, the class data does represent a random sample. Although each student was asked to buy their own bag of skittles and not every bag of skittles in the region had an equal chance of being selected, the distribution of skittles from the central plant/warehouse was most likely random. The skittles company most likely does not count colors as they load the bags and simply loads by weight, and assuming students did not make any biased decisions about which bag to grab off the shelf every bag produced had an equal chance of being shipped to any location in the country and being selected at random by a student in the class. What would the population be? In this study, the sample is the class data. Since not everyone in the class is currently living in the same state, the population would be all 2.17 ounce skittles bags in the United States. There are currently different manufacturing plants operating overseas, therefore the population can only reasonably be expanded to include the United States distribution circuit.
4
5 Laura Boren Red Yellow Orange Green Purple Total Math 1040 Data Color Class Total Proportion My Total Proportion My skittles bag differed quite a bit from the class data. My bag had significantly more red and green skittles than the class total, but like the class data had the fewest purple skittles. I had always assumed that red was the most common skittles color, but that may just be due to the vibrancy of the color red and it being noticed more. In my skittles bag it was the most common, but that was not supported by the class data. I was surprised to see yellow skittles being the most common in the class.
6 1. Using the total number of candies in each bag in our class sample, compute the following measures for the variable Total candies in each bag : (a) mean number of candies per bag The mean number of candies per bag is 59.1 candies. (b) standard deviation of the number of candies per bag The standard deviation per bag is 6.4 candies. (c) 5-number summary for the number of candies per bag The 5-number summary is Report these summary statistics rounded to one decimal place, if needed.
7 Math 1040 Skittle Data 2015
8 Laura Boren Data Part 3 1. From these graphs we can conclude that the Frequency Histogram is skewed to the left, although our boxplot appeared rather symmetrical, likely due to not having smaller value increments on the number line. This distribution and skew is expected because the median number of candies per bag is 60 but the mean is only One of the main causes of the negative skew is that several of the skittles bags only had candies in them, which is almost half as much as the median number of skittles per bag. Those bags represent outliers, and pull the data towards the left. My data agrees with the data collected by the whole class because the highest frequency of candies per bag was between candies per bag. My bag had 62 candies, which falls right in that class. 2. Categorical variables are also known as qualitative variables. These variables can be put into different categories, such as a model of car, color, gender, etc. Quantitative data is data that can be ordered and measured. The number of candies in a bag of skittles is quantitative, whereas the color of the candy is categorical. Graphing quantitative data is best done with histograms, stem leaf plots, dot plots, bar graphs, and box plots. All of these types of graphs can be used to measure the quantity of a certain variable. Categorical data is best graphed using a method that lets you compare the groups to one another. A bar graph can work for both quantitative and categorical data, but a pie chart doesn t make sense for quantitative data because it is comparing categories to the whole. A pie chart would effectively show the percentage of each color of skittles in a bag (categorical data), but cannot effectively be used to show the number of skittles in a bag (quantitative data). When it comes to calculations, mean and median only make sense for quantitative data. The mean is the average quantity of something in an entire sample, therefore it is a more meaningful calculation when applied to quantitative data. The median represents the middle value of the data and once again makes the most sense only when applied to quantitative data. The best central tendency to apply to categorical data is the mode. When looking at the colors of candy in a skittles bag, you may not able to find the average color or the median color, but you can establish which color occurs the most often. Likewise, when looking at the number of candies in a skittles bag, the best values for probability distributions are going to be the average and median number of skittles.
9 Laura Boren, Nathan Schafer, Justin Peck, Melissa Oneal 99% Confidence Interval estimate for the population proportion of yellow candies X= 586 n= 2839 Z-value for 95% CI = p= 586/2839 = / * ( ) / % Confidence Interval Estimate: (0.186, 0.226) Confidence Intervals estimated from a population proportion are used to determine, with the specified degree of confidence, the proportion of a characteristic found within a population. In relation to the skittles, we are 99% confident that the proportion of yellow skittles in any bag of skittles falls between and % Confidence Interval estimate for the population mean number of skittles per bag n= 49 Sx = 6.38 Sample mean= Standard error of the mean = To find the t-value, a t-table was consulted using a degree of freedom of 50. The t-value is / t*(0.9114) = = % Confidence Interval Estimate: (57.32, 60.98) Confidence Interval estimates of the population mean use sample date to extrapolate an interval with the specified degree of confidence that the mean characteristic of a population should fall within. In this case, we are 95% confident that the mean number of skittles in any bag is between and
10 Laura Boren, Nathan Schafer, Justin Peck, Melissa Oneal 98% confidence interval estimate for the population standard deviation of the number of candies per bag n=49 s=6.378 S 2 = χ 2 1-a/2 = 0.99 χ 2 a/2 = 0.01 On the Chi square distribution chart, 50 degrees of freedom was used. The value for χ 2 1-a/2 was For χ 2 a/2 it was [ s 2 (df)/chi value] Lower bound: 5.06 Upper bound: 8.11 Confidence Interval estimates from the population standard deviation use the sample standard deviation in order to generate an interval that the population standard deviation of the number of candies should fall within, with the specified level of confidence. In this case, we are 98% confident that the population standard deviation is within 5.06 and 8.11 candies. The problem with confidence interval estimates taken from the sample standard deviation is that the sample standard deviation may be quite different from the actual population standard deviation.
11 Laura Boren The purpose of taking sample data and calculating statistics from them is to apply those statistics to a larger population. Since a population is larger than a sample, how well a sample statistic can be used to estimate a population parameter is an issue. A confidence interval helps to solve that issue by allowing us to provide a range of values that the population parameter is likely to fall within. The intervals are constructed with a certain level of confidence, reflected as a percentage such as 95%, 98% or 99%. This means that if the same population were to be examined on multiple occasions and a parameter interval calculated each time, the intervals would contain the true parameter in X% of cases.
12 Laura Boren Skittle Project Reflection When I first started the project, I was intimidated by the process of using statistical concepts to interpret real-life data. As the project went on I became much more comfortable with concepts such as confidence intervals and creating Pareto charts and frequency histograms. In my volunteer work as a lactation educator and also as a nursing student I sometimes find myself reading and interpreting peer-reviewed clinical research. Understanding what things like confidence intervals are and what makes data significant or unusual is very helpful in interpreting such studies and thinking critically about what the data actually means. There are even some aspects of statistics that I used before taking this class. In Human Physiology we were required to calculate the mean, median, and standard deviation of lung inspiratory volume as part of our laboratory unit on the respiratory system. Taking calculus really helped me to understand real-world math applications and statistics only supported what I already knew about the practicality of math. Statistics is a very fundamental part of scientific literacy and has numerous applications in the world of business and economics. By completing the skittles project it helped me to understand how businesses and corporations might need to use statistics, particularly standard deviations, in order to produce accurate and consistent products. Statistics can also be used to calculate demand and determine shipping and distribution needs, and evaluate product quality and customer satisfaction. In our skittles project we determined the average proportion of each color of skittles candy that came in a bag as well as a confidence interval of that population proportion. This could be helpful in evaluating customer candy preferences and overall satisfaction based on flavor preference. A company might use similar statistics in real life to ensure product standardization.
Probability and Statistics. Chapter 1
 Probability and Statistics Chapter 1 Individuals and Variables Individuals and Variables Individuals are objects described by data. Individuals and Variables Individuals are objects described by data.
WDHS Curriculum Map Probability and Statistics. What is Statistics and how does it relate to you?
 WDHS Curriculum Map Probability and Statistics Time Interval/ Unit 1: Introduction to Statistics 1.1-1.3 2 weeks S-IC-1: Understand statistics as a process for making inferences about population parameters
2.4.1 STA-O Assessment 2
 2.4.1 STA-O Assessment 2 Work all the problems and determine the correct answers. When you have completed the assessment, open the Assessment 2 activity and input your responses into the online grading
Unit 7 Comparisons and Relationships
 Unit 7 Comparisons and Relationships Objectives: To understand the distinction between making a comparison and describing a relationship To select appropriate graphical displays for making comparisons
Unit 1 Exploring and Understanding Data
 Unit 1 Exploring and Understanding Data Area Principle Bar Chart Boxplot Conditional Distribution Dotplot Empirical Rule Five Number Summary Frequency Distribution Frequency Polygon Histogram Interquartile
Statistical Methods Exam I Review
 Statistical Methods Exam I Review Professor: Dr. Kathleen Suchora SI Leader: Camila M. DISCLAIMER: I have created this review sheet to supplement your studies for your first exam. I am a student here at
q2_2 MULTIPLE CHOICE. Choose the one alternative that best completes the statement or answers the question.
 q2_2 MULTIPLE CHOICE. Choose the one alternative that best completes the statement or answers the question. A sporting goods retailer conducted a customer survey to determine its customers primary reason
10/4/2007 MATH 171 Name: Dr. Lunsford Test Points Possible
 Pledge: 10/4/2007 MATH 171 Name: Dr. Lunsford Test 1 100 Points Possible I. Short Answer and Multiple Choice. (36 points total) 1. Circle all of the items below that are measures of center of a distribution:
Statistics is the science of collecting, organizing, presenting, analyzing, and interpreting data to assist in making effective decisions
 Readings: OpenStax Textbook - Chapters 1 5 (online) Appendix D & E (online) Plous - Chapters 1, 5, 6, 13 (online) Introductory comments Describe how familiarity with statistical methods can - be associated
MULTIPLE CHOICE. Choose the one alternative that best completes the statement or answers the question.
 Statistics Final Review Semeter I Name MULTIPLE CHOICE. Choose the one alternative that best completes the statement or answers the question. Provide an appropriate response. 1) The Centers for Disease
M 140 Test 1 A Name (1 point) SHOW YOUR WORK FOR FULL CREDIT! Problem Max. Points Your Points Total 75
 SHOW YOUR WORK FOR FULL CREDIT! Problem Max. Points Your Points Total 75") M 140 est 1 A Name (1 point) SHOW YOUR WORK FOR FULL CREDI! Problem Max. Points Your Points 1-10 10 11 10 12 3 13 4 14 18 15 8 16 7 17 14 otal 75 Multiple choice questions (1 point each) For questions
M 140 est 1 A Name (1 point) SHOW YOUR WORK FOR FULL CREDI! Problem Max. Points Your Points 1-10 10 11 10 12 3 13 4 14 18 15 8 16 7 17 14 otal 75 Multiple choice questions (1 point each) For questions
Undertaking statistical analysis of
 Descriptive statistics: Simply telling a story Laura Delaney introduces the principles of descriptive statistical analysis and presents an overview of the various ways in which data can be presented by
PRINTABLE VERSION. Quiz 1. True or False: The amount of rainfall in your state last month is an example of continuous data.
 Question 1 PRINTABLE VERSION Quiz 1 True or False: The amount of rainfall in your state last month is an example of continuous data. a) True b) False Question 2 True or False: The standard deviation is
Introduction to Statistical Data Analysis I
 Introduction to Statistical Data Analysis I JULY 2011 Afsaneh Yazdani Preface What is Statistics? Preface What is Statistics? Science of: designing studies or experiments, collecting data Summarizing/modeling/analyzing
Understandable Statistics
 Understandable Statistics correlated to the Advanced Placement Program Course Description for Statistics Prepared for Alabama CC2 6/2003 2003 Understandable Statistics 2003 correlated to the Advanced Placement
Medical Statistics 1. Basic Concepts Farhad Pishgar. Defining the data. Alive after 6 months?
 Medical Statistics 1 Basic Concepts Farhad Pishgar Defining the data Population and samples Except when a full census is taken, we collect data on a sample from a much larger group called the population.
UF#Stats#Club#STA#2023#Exam#1#Review#Packet# #Fall#2013#
 UF#Stats#Club#STA##Exam##Review#Packet# #Fall## The following data consists of the scores the Gators basketball team scored during the 8 games played in the - season. 84 74 66 58 79 8 7 64 8 6 78 79 77
Still important ideas
 Readings: OpenStax - Chapters 1 13 & Appendix D & E (online) Plous Chapters 17 & 18 - Chapter 17: Social Influences - Chapter 18: Group Judgments and Decisions Still important ideas Contrast the measurement
Still important ideas
 Readings: OpenStax - Chapters 1 11 + 13 & Appendix D & E (online) Plous - Chapters 2, 3, and 4 Chapter 2: Cognitive Dissonance, Chapter 3: Memory and Hindsight Bias, Chapter 4: Context Dependence Still
M 140 Test 1 A Name SHOW YOUR WORK FOR FULL CREDIT! Problem Max. Points Your Points Total 60
 M 140 Test 1 A Name SHOW YOUR WORK FOR FULL CREDIT! Problem Max. Points Your Points 1-10 10 11 3 12 4 13 3 14 10 15 14 16 10 17 7 18 4 19 4 Total 60 Multiple choice questions (1 point each) For questions
Making Inferences from Experiments
 11.6 Making Inferences from Experiments Essential Question How can you test a hypothesis about an experiment? Resampling Data Yield (kilograms) Control Group Treatment Group 1. 1.1 1.2 1. 1.5 1.4.9 1.2
Statistics is the science of collecting, organizing, presenting, analyzing, and interpreting data to assist in making effective decisions
 Readings: OpenStax Textbook - Chapters 1 5 (online) Appendix D & E (online) Plous - Chapters 1, 5, 6, 13 (online) Introductory comments Describe how familiarity with statistical methods can - be associated
Population. Sample. AP Statistics Notes for Chapter 1 Section 1.0 Making Sense of Data. Statistics: Data Analysis:
 Section 1.0 Making Sense of Data Statistics: Data Analysis: Individuals objects described by a set of data Variable any characteristic of an individual Categorical Variable places an individual into one
Key: 18 5 = 1.85 cm. 5 a Stem Leaf. Key: 2 0 = 20 points. b Stem Leaf Key: 2 0 = 20 cm. 6 a Stem Leaf. c Stem Leaf
 Answers EXERCISE. D D C B Numerical: a, b, c Categorical: c, d, e, f, g Discrete: c Continuous: a, b C 9 C Categorical B A Categorical and ordinal Discrete Ordinal D EXERCISE. Stem Leaf 9 9 9 Key: = Stem
MINUTE TO WIN IT: NAMING THE PRESIDENTS OF THE UNITED STATES
 MINUTE TO WIN IT: NAMING THE PRESIDENTS OF THE UNITED STATES THE PRESIDENTS OF THE UNITED STATES Project: Focus on the Presidents of the United States Objective: See how many Presidents of the United States
SPRING GROVE AREA SCHOOL DISTRICT. Course Description. Instructional Strategies, Learning Practices, Activities, and Experiences.
 SPRING GROVE AREA SCHOOL DISTRICT PLANNED COURSE OVERVIEW Course Title: Basic Introductory Statistics Grade Level(s): 11-12 Units of Credit: 1 Classification: Elective Length of Course: 30 cycles Periods
NORTH SOUTH UNIVERSITY TUTORIAL 1
 NORTH SOUTH UNIVERSITY TUTORIAL 1 REVIEW FROM BIOSTATISTICS I AHMED HOSSAIN,PhD Data Management and Analysis AHMED HOSSAIN,PhD - Data Management and Analysis 1 DATA TYPES/ MEASUREMENT SCALES Categorical:
Section I: Multiple Choice Select the best answer for each question.
 Chapter 1 AP Statistics Practice Test (TPS- 4 p78) Section I: Multiple Choice Select the best answer for each question. 1. You record the age, marital status, and earned income of a sample of 1463 women.
AP Psych - Stat 1 Name Period Date. MULTIPLE CHOICE. Choose the one alternative that best completes the statement or answers the question.
 AP Psych - Stat 1 Name Period Date MULTIPLE CHOICE. Choose the one alternative that best completes the statement or answers the question. 1) In a set of incomes in which most people are in the $15,000
Standard Deviation and Standard Error Tutorial. This is significantly important. Get your AP Equations and Formulas sheet
 Standard Deviation and Standard Error Tutorial This is significantly important. Get your AP Equations and Formulas sheet The Basics Let s start with a review of the basics of statistics. Mean: What most
Designing Psychology Experiments: Data Analysis and Presentation
 Data Analysis and Presentation Review of Chapter 4: Designing Experiments Develop Hypothesis (or Hypotheses) from Theory Independent Variable(s) and Dependent Variable(s) Operational Definitions of each
Here are the various choices. All of them are found in the Analyze menu in SPSS, under the sub-menu for Descriptive Statistics :
 Descriptive Statistics in SPSS When first looking at a dataset, it is wise to use descriptive statistics to get some idea of what your data look like. Here is a simple dataset, showing three different
C-1: Variables which are measured on a continuous scale are described in terms of three key characteristics central tendency, variability, and shape.
 MODULE 02: DESCRIBING DT SECTION C: KEY POINTS C-1: Variables which are measured on a continuous scale are described in terms of three key characteristics central tendency, variability, and shape. C-2:
Business Statistics Probability
 Business Statistics The following was provided by Dr. Suzanne Delaney, and is a comprehensive review of Business Statistics. The workshop instructor will provide relevant examples during the Skills Assessment
Chapter 7: Descriptive Statistics
 Chapter Overview Chapter 7 provides an introduction to basic strategies for describing groups statistically. Statistical concepts around normal distributions are discussed. The statistical procedures of
International Statistical Literacy Competition of the ISLP Training package 3
 International Statistical Literacy Competition of the ISLP http://www.stat.auckland.ac.nz/~iase/islp/competition Training package 3 1.- Drinking Soda and bone Health http://figurethis.org/ 1 2 2.- Comparing
APPENDIX N. Summary Statistics: The "Big 5" Statistical Tools for School Counselors
 APPENDIX N Summary Statistics: The "Big 5" Statistical Tools for School Counselors This appendix describes five basic statistical tools school counselors may use in conducting results based evaluation.
Stats 95. Statistical analysis without compelling presentation is annoying at best and catastrophic at worst. From raw numbers to meaningful pictures
 Stats 95 Statistical analysis without compelling presentation is annoying at best and catastrophic at worst. From raw numbers to meaningful pictures Stats 95 Why Stats? 200 countries over 200 years http://www.youtube.com/watch?v=jbksrlysojo
Chapter 1: Exploring Data
 Chapter 1: Exploring Data Key Vocabulary:! individual! variable! frequency table! relative frequency table! distribution! pie chart! bar graph! two-way table! marginal distributions! conditional distributions!
Lesson 9 Presentation and Display of Quantitative Data
 Lesson 9 Presentation and Display of Quantitative Data Learning Objectives All students will identify and present data using appropriate graphs, charts and tables. All students should be able to justify
Readings: Textbook readings: OpenStax - Chapters 1 4 Online readings: Appendix D, E & F Online readings: Plous - Chapters 1, 5, 6, 13
 Readings: Textbook readings: OpenStax - Chapters 1 4 Online readings: Appendix D, E & F Online readings: Plous - Chapters 1, 5, 6, 13 Introductory comments Describe how familiarity with statistical methods
Describe what is meant by a placebo Contrast the double-blind procedure with the single-blind procedure Review the structure for organizing a memo
 Business Statistics The following was provided by Dr. Suzanne Delaney, and is a comprehensive review of Business Statistics. The workshop instructor will provide relevant examples during the Skills Assessment
Psychology Research Process
 Psychology Research Process Logical Processes Induction Observation/Association/Using Correlation Trying to assess, through observation of a large group/sample, what is associated with what? Examples:
Designing Psychology Experiments: Data Analysis and Presentation
 Data Analysis and Presentation Review of Chapter 4: Designing Experiments Develop Hypothesis (or Hypotheses) from Theory Independent Variable(s) and Dependent Variable(s) Operational Definitions of each
HW 1 - Bus Stat. Student:
 HW 1 - Bus Stat Student: 1. An identification of police officers by rank would represent a(n) level of measurement. A. Nominative C. Interval D. Ratio 2. A(n) variable is a qualitative variable such that
Measuring the User Experience
 Measuring the User Experience Collecting, Analyzing, and Presenting Usability Metrics Chapter 2 Background Tom Tullis and Bill Albert Morgan Kaufmann, 2008 ISBN 978-0123735584 Introduction Purpose Provide
Six Sigma Glossary Lean 6 Society
 Six Sigma Glossary Lean 6 Society ABSCISSA ACCEPTANCE REGION ALPHA RISK ALTERNATIVE HYPOTHESIS ASSIGNABLE CAUSE ASSIGNABLE VARIATIONS The horizontal axis of a graph The region of values for which the null
What Is the Fat Intake of a Typical Middle School Student?
 What Is the Fat Intake of a Typical Middle School Student? Health professionals believe that the average American diet contains too much fat. Although there is no Recommended Daily Allowance for fat, it
Data and Statistics 101: Key Concepts in the Collection, Analysis, and Application of Child Welfare Data
 TECHNICAL REPORT Data and Statistics 101: Key Concepts in the Collection, Analysis, and Application of Child Welfare Data CONTENTS Executive Summary...1 Introduction...2 Overview of Data Analysis Concepts...2
Math 2200 First Mid-Term Exam September 22, 2010
 Math 2200 First Mid-Term Exam September 22, 2010 This exam has 25 questions of 4 points each. All answers have been rounded-off so if your calculated answer differs from the given options slightly, choose
What you should know before you collect data. BAE 815 (Fall 2017) Dr. Zifei Liu
 Dr. Zifei Liu") What you should know before you collect data BAE 815 (Fall 2017) Dr. Zifei Liu Zifeiliu@ksu.edu Types and levels of study Descriptive statistics Inferential statistics How to choose a statistical test
What you should know before you collect data BAE 815 (Fall 2017) Dr. Zifei Liu Zifeiliu@ksu.edu Types and levels of study Descriptive statistics Inferential statistics How to choose a statistical test
Part I: Alcohol Metabolization Explore and Explain
 Name Date Part I: Alcohol Metabolization Explore and Explain Just like any other type of food or beverage, alcohol is digested and then metabolized by the body. When a substance is metabolized by the body,
STOR 155 Section 2 Midterm Exam 1 (9/29/09)
") STOR 155 Section 2 Midterm Exam 1 (9/29/09) Name: PID: Instructions: Both the exam and the bubble sheet will be collected. On the bubble sheet, print your name and ID number, sign the honor pledge, also
STOR 155 Section 2 Midterm Exam 1 (9/29/09) Name: PID: Instructions: Both the exam and the bubble sheet will be collected. On the bubble sheet, print your name and ID number, sign the honor pledge, also
Student Performance Q&A:
 Student Performance Q&A: 2009 AP Statistics Free-Response Questions The following comments on the 2009 free-response questions for AP Statistics were written by the Chief Reader, Christine Franklin of
AP Psych - Stat 2 Name Period Date. MULTIPLE CHOICE. Choose the one alternative that best completes the statement or answers the question.
 AP Psych - Stat 2 Name Period Date MULTIPLE CHOICE. Choose the one alternative that best completes the statement or answers the question. 1) In a set of incomes in which most people are in the $15,000
YSU Students. STATS 3743 Dr. Huang-Hwa Andy Chang Term Project 2 May 2002
 YSU Students STATS 3743 Dr. Huang-Hwa Andy Chang Term Project May 00 Anthony Koulianos, Chemical Engineer Kyle Unger, Chemical Engineer Vasilia Vamvakis, Chemical Engineer I. Executive Summary It is common
Table of Contents. Plots. Essential Statistics for Nursing Research 1/12/2017
 Essential Statistics for Nursing Research Kristen Carlin, MPH Seattle Nursing Research Workshop January 30, 2017 Table of Contents Plots Descriptive statistics Sample size/power Correlations Hypothesis
Readings: Textbook readings: OpenStax - Chapters 1 11 Online readings: Appendix D, E & F Plous Chapters 10, 11, 12 and 14
 Readings: Textbook readings: OpenStax - Chapters 1 11 Online readings: Appendix D, E & F Plous Chapters 10, 11, 12 and 14 Still important ideas Contrast the measurement of observable actions (and/or characteristics)
Unit 1 Outline Science Practices. Part 1 - The Scientific Method. Screencasts found at: sciencepeek.com. 1. List the steps of the scientific method.
 Screencasts found at: sciencepeek.com Part 1 - The Scientific Method 1. List the steps of the scientific method. 2. What is an observation? Give an example. Quantitative or Qualitative Data? 35 grams?
Chapter 1. Picturing Distributions with Graphs
 Chapter 1 Picturing Distributions with Graphs Statistics Statistics is a science that involves the extraction of information from numerical data obtained during an experiment or from a sample. It involves
Describe what is meant by a placebo Contrast the double-blind procedure with the single-blind procedure Review the structure for organizing a memo
 Please note the page numbers listed for the Lind book may vary by a page or two depending on which version of the textbook you have. Readings: Lind 1 11 (with emphasis on chapters 10, 11) Please note chapter
AP Stats Review for Midterm
 AP Stats Review for Midterm NAME: Format: 10% of final grade. There will be 20 multiple-choice questions and 3 free response questions. The multiple-choice questions will be worth 2 points each and the
How to interpret scientific & statistical graphs
 How to interpret scientific & statistical graphs Theresa A Scott, MS Department of Biostatistics theresa.scott@vanderbilt.edu http://biostat.mc.vanderbilt.edu/theresascott 1 A brief introduction Graphics:
VIEW AS Fit Page! PRESS PgDn to advance slides!
 VIEW AS Fit Page! PRESS PgDn to advance slides! UNDERSTAND REALIZE CHANGE WHY??? CHANGE THE PROCESSES OF YOUR BUSINESS CONNECTING the DOTS Customer Focus (W s) Customer Focused Metrics Customer Focused
PRINCIPLES OF STATISTICS
 PRINCIPLES OF STATISTICS STA-201-TE This TECEP is an introduction to descriptive and inferential statistics. Topics include: measures of central tendency, variability, correlation, regression, hypothesis
Biostatistics. Donna Kritz-Silverstein, Ph.D. Professor Department of Family & Preventive Medicine University of California, San Diego
 Biostatistics Donna Kritz-Silverstein, Ph.D. Professor Department of Family & Preventive Medicine University of California, San Diego (858) 534-1818 dsilverstein@ucsd.edu Introduction Overview of statistical
Observational studies; descriptive statistics
 Observational studies; descriptive statistics Patrick Breheny August 30 Patrick Breheny University of Iowa Biostatistical Methods I (BIOS 5710) 1 / 38 Observational studies Association versus causation
Statistics: Interpreting Data and Making Predictions. Interpreting Data 1/50
 Statistics: Interpreting Data and Making Predictions Interpreting Data 1/50 Last Time Last time we discussed central tendency; that is, notions of the middle of data. More specifically we discussed the
Examining differences between two sets of scores
 6 Examining differences between two sets of scores In this chapter you will learn about tests which tell us if there is a statistically significant difference between two sets of scores. In so doing you
Section 3.2 Least-Squares Regression
 Section 3.2 Least-Squares Regression Linear relationships between two quantitative variables are pretty common and easy to understand. Correlation measures the direction and strength of these relationships.
Practice First Midterm Exam
 Practice First Midterm Exam Statistics 200 (Pfenning) This is a closed book exam worth 150 points. You are allowed to use a calculator and a two-sided sheet of notes. There are 9 problems, with point values
LOTS of NEW stuff right away 2. The book has calculator commands 3. About 90% of technology by week 5
 1.1 1. LOTS of NEW stuff right away 2. The book has calculator commands 3. About 90% of technology by week 5 1 Three adventurers are in a hot air balloon. Soon, they find themselves lost in a canyon in
STP226 Brief Class Notes Instructor: Ela Jackiewicz
 CHAPTER 2 Organizing Data Statistics=science of analyzing data. Information collected (data) is gathered in terms of variables (characteristics of a subject that can be assigned a numerical value or nonnumerical
V. Gathering and Exploring Data
 V. Gathering and Exploring Data With the language of probability in our vocabulary, we re now ready to talk about sampling and analyzing data. Data Analysis We can divide statistical methods into roughly
9 research designs likely for PSYC 2100
 9 research designs likely for PSYC 2100 1) 1 factor, 2 levels, 1 group (one group gets both treatment levels) related samples t-test (compare means of 2 levels only) 2) 1 factor, 2 levels, 2 groups (one
Chapter 1: Explaining Behavior
 Chapter 1: Explaining Behavior GOAL OF SCIENCE is to generate explanations for various puzzling natural phenomenon. - Generate general laws of behavior (psychology) RESEARCH: principle method for acquiring
Describe what is meant by a placebo Contrast the double-blind procedure with the single-blind procedure Review the structure for organizing a memo
 Please note the page numbers listed for the Lind book may vary by a page or two depending on which version of the textbook you have. Readings: Lind 1 11 (with emphasis on chapters 5, 6, 7, 8, 9 10 & 11)
SCATTER PLOTS AND TREND LINES
 1 SCATTER PLOTS AND TREND LINES LEARNING MAP INFORMATION STANDARDS 8.SP.1 Construct and interpret scatter s for measurement to investigate patterns of between two quantities. Describe patterns such as
Chapter 23. Inference About Means. Copyright 2010 Pearson Education, Inc.
 Chapter 23 Inference About Means Copyright 2010 Pearson Education, Inc. Getting Started Now that we know how to create confidence intervals and test hypotheses about proportions, it d be nice to be able
Statistics. Nur Hidayanto PSP English Education Dept. SStatistics/Nur Hidayanto PSP/PBI
 Statistics Nur Hidayanto PSP English Education Dept. RESEARCH STATISTICS WHAT S THE RELATIONSHIP? RESEARCH RESEARCH positivistic Prepositivistic Postpositivistic Data Initial Observation (research Question)
Introduction. Lecture 1. What is Statistics?
 Lecture 1 Introduction What is Statistics? Statistics is the science of collecting, organizing and interpreting data. The goal of statistics is to gain information and understanding from data. A statistic
Standard Scores. Richard S. Balkin, Ph.D., LPC-S, NCC
 Standard Scores Richard S. Balkin, Ph.D., LPC-S, NCC 1 Normal Distributions While Best and Kahn (2003) indicated that the normal curve does not actually exist, measures of populations tend to demonstrate
Part 1. For each of the following questions fill-in the blanks. Each question is worth 2 points.
 Part 1. For each of the following questions fill-in the blanks. Each question is worth 2 points. 1. The bell-shaped frequency curve is so common that if a population has this shape, the measurements are
Organizing Data. Types of Distributions. Uniform distribution All ranges or categories have nearly the same value a.k.a. rectangular distribution
 Organizing Data Frequency How many of the data are in a category or range Just count up how many there are Notation x = number in one category n = total number in sample (all categories combined) Relative
Results & Statistics: Description and Correlation. I. Scales of Measurement A Review
 Results & Statistics: Description and Correlation The description and presentation of results involves a number of topics. These include scales of measurement, descriptive statistics used to summarize
Data, frequencies, and distributions. Martin Bland. Types of data. Types of data. Clinical Biostatistics
 Clinical Biostatistics Data, frequencies, and distributions Martin Bland Professor of Health Statistics University of York http://martinbland.co.uk/ Types of data Qualitative data arise when individuals
Number of grams of fat x 9 calories per gram = Total number of calories from fat
 Health professionals believe that the average American diet contains too much fat. Although there is no Recommended Daily Allowance for fat, it is recommended that fat intake be limited to 30% of the total
Theory. = an explanation using an integrated set of principles that organizes observations and predicts behaviors or events.
 Definition Slides Hindsight Bias = the tendency to believe, after learning an outcome, that one would have foreseen it. Also known as the I knew it all along phenomenon. Critical Thinking = thinking that
Statistics Coursework Free Sample. Statistics Coursework
 Statistics Coursework For my initial investigation I am going to compare results on the following hypothesis, to see if people s intelligence affects their height and their ability to memorise a certain
bivariate analysis: The statistical analysis of the relationship between two variables.
 bivariate analysis: The statistical analysis of the relationship between two variables. cell frequency: The number of cases in a cell of a cross-tabulation (contingency table). chi-square (χ 2 ) test for
Read the next two selections. Then choose the best answer to each question. A Book for Jonah
 Read the next two selections. Then choose the best answer to each question. A Book for Jonah 1 A six-year-old boy named Dylan Siegel wanted to help his friend Jonah, who has a rare liver disease. Jonah
1.4 - Linear Regression and MS Excel
 1.4 - Linear Regression and MS Excel Regression is an analytic technique for determining the relationship between a dependent variable and an independent variable. When the two variables have a linear
Confidence Intervals and Sampling Design. Lecture Notes VI
 Confidence Intervals and Sampling Design Lecture Notes VI Statistics 112, Fall 2002 Announcements For homework question 3(b), assume that the true is expected to be about in calculating the sample size
Previously, when making inferences about the population mean,, we were assuming the following simple conditions:
 Chapter 17 Inference about a Population Mean Conditions for inference Previously, when making inferences about the population mean,, we were assuming the following simple conditions: (1) Our data (observations)
Choosing the correct statistical test in research
 Leading Article Choosing the correct statistical test in research Nalika Gunawardena 1 Sri Lanka Journal of Child Health, 2011; 40: 149-153 (Key words: Statistical test; research) Gone are the days where
Variable Measurement, Norms & Differences
 Variable Measurement, Norms & Differences 1 Expectations Begins with hypothesis (general concept) or question Create specific, testable prediction Prediction can specify relation or group differences Different
Readings: Textbook readings: OpenStax - Chapters 1 13 (emphasis on Chapter 12) Online readings: Appendix D, E & F
 Online readings: Appendix D, E & F") Readings: Textbook readings: OpenStax - Chapters 1 13 (emphasis on Chapter 12) Online readings: Appendix D, E & F Plous Chapters 17 & 18 Chapter 17: Social Influences Chapter 18: Group Judgments and Decisions
Readings: Textbook readings: OpenStax - Chapters 1 13 (emphasis on Chapter 12) Online readings: Appendix D, E & F Plous Chapters 17 & 18 Chapter 17: Social Influences Chapter 18: Group Judgments and Decisions
Distributions and Samples. Clicker Question. Review
 Distributions and Samples Clicker Question The major difference between an observational study and an experiment is that A. An experiment manipulates features of the situation B. An experiment does not
Number of grams of fat x 9 calories per gram = Total number of calories from fat
 Health professionals believe that the average American diet contains too much fat. Although there is no recommended daily allowance for fat, it is recommended that fat intake be limited to 30% of the total
Test 1 Version A STAT 3090 Spring 2018
 Multiple Choice: (Questions 1 20) Answer the following questions on the scantron provided using a #2 pencil. Bubble the response that best answers the question. Each multiple choice correct response is