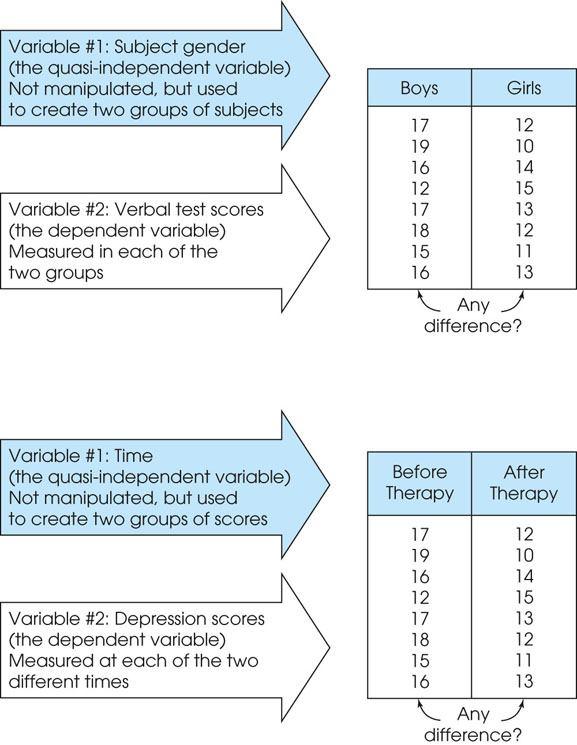
Variables and Scale Measurement (Revisited) Lulu Eva Rakhmilla, dr., M.KM Epidemiology and Biostatistics 2013
|
|
|
- Domenic Willis
- 6 years ago
- Views:
Transcription
1 Variables and Scale Measurement (Revisited) Lulu Eva Rakhmilla, dr., M.KM Epidemiology and Biostatistics 2013
2 The Research Process Selecting research area Report writing Formulating research questions / hypotheses Analysing the data Selecting a research strategy Collecting data
3 How are variables meaningful? Hypothesis Testing Data Presentation Sample Size Research Problems Variables
4 Quantitative Research Problems Variables A variable is a label of name that represents a concept or characteristic that varies (e.g., gender, weight, achievement, attitudes toward inclusion, etc.) Conceptual and operational definitions of variables
5 Conceptual and operational definitions of variables Conceptual (i.e., constitutive) definition: the use of words or concepts to define a variable Operational definition: an indication of the meaning of a variable through the specification of the manner by which it is measured, categorized, or controlled

6
7 Example 1 For each of the following hypotheses, identify the independent and dependent variable. Then give an example of how you would operationalize each variable. People who are nervous perform poorly Reading speed decreases as word length increases Attractive people are more influential in debates People sleep better if they read before going to bed Alcohol impairs judgment
8 Independent and dependent (i.e., cause and effect) Independent variables act as the cause in that they precede, influence, and predict the dependent variable Dependent variables act as the effect in that they change as a result of being influenced by an independent variable Examples The effect of two instructional approaches (independent variable) on student achievement (dependent variable) The use of SAT scores (independent variable) to predict freshman grade point averages (dependent variable)
9
10 Example 2 A researcher was interested in the following hypothesis: people are less likely to help others when they are preoccupied. To test this prediction Dr. Batson asked students to rehearse a speech as they walked across campus to deliver a lecture, while other students were simply asked to walk across campus for the second part of a study. On the route to the other building a man was laying on the ground in need of help. Observers then recorded whether the passing student stopped to assist the fallen man. What is the conceptual independent variable? What is the conceptual dependent variable? What is the IV operationalization? What is the DV operationalization?
11 Extraneous and confounding variables Extraneous variables are those that affect the dependent variable but are not controlled adequately by the researcher Confounding variables are those that vary systematically with the independent variable and exert influence of the dependent variable
12 Quantitative Research Problems Continuous and categorical variables Continuous variables are measured on a scale that theoretically can take on an infinite number of values Test scores range from a low of 0 to a high of 100 Attitude scales that range from very negative at 0 to very positive at 5 Students ages
13 Continuous and categorical variables Categorical variables are measured and assigned to groups on the basis of specific characteristics Examples Gender: male and female Socio-economic status: low middle, and high The term level is used to discuss the groups or categories Gender has two levels - male and female Socio-economic status has three levels - low, middle, and high
14 Continuous variables can be converted to categorical variables, but categorical variables cannot be converted to continuous variables IQ is a continuous variable, but the researcher can choose to group students into three levels based on IQ scores - low is below a score of 84, middle is between 85 and 115, and high is above 116 Test scores are continuous, but teachers typically assign letter grades on a ten point scale (i.e., at or below 59 is an F, 60 to 69 is a D, 70 to 79 is a C, is a B, and 90 to 100 is an A
15 Hypotheses Hypotheses are tentative statements of the expected relationships between two or more variables There is a significant positive relationship between self-concept and math achievement The class using math manipulatives will show significantly higher levels of math achievement than the class using a traditional algorithm approach
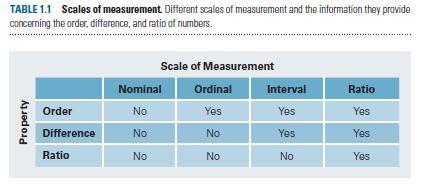
16 Level of mesurement Variables can be defined into types according to the level of mathematical scaling that can be carried out on the data. There are four types of variable: 1. Nominal 2. Ordinal 3. Interval 4. Ratio
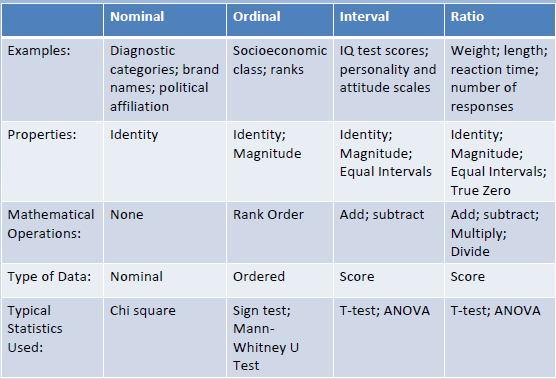
17 Nominal variables Nominal or categorical: variable measured using categories that cannot be rank ordered. No order in categories so no judgement possible about the relative size or distance from one category to another. What does this mean? No mathematical operations can be performed on the variables relative to each other. Nominal variables reflect qualitative differences rather than quantitative ones.
18 Nominal variables Examples: What is your gender? (please tick) Did you enjoy the film? (please tick) Male Female Yes No
19 Ordinal variables Ordinal : variables that comprises of categories that can be rank ordered. Distance between each category cannot be calculated but the categories can be ranked above or below each other. What does this mean? Can make statistical judgements and perform limited maths.
20 Ordinal variables Example: How satisfied are you with the level of service you have received? (please tick) Very satisfied Somewhat satisfied Neutral Somewhat dissatisfied Very dissatisfied
21 Interval and ratio variables Both interval and ratio data are examples of scale variables. Scale variables: numeric format (Rp.500, Rp.1.000,, Rp , ) can be measured on a continuous scale distance between each can be observed and as a result measured can be placed in rank order.
22 Interval variables Measured on a continuous scale and has no true zero point. Examples: Time moves along a continuous measure or seconds, minutes and so on and is without a zero point of time. Temperature moves along a continuous measure of degrees and is without a true zero.
23 Ratio variables Measured on a continuous scale and does have a true zero point. Examples: Age Weight Height
24 Hierarchical variable order These levels of measurement can be placed in hierarchical order. Ratio Interval Ordinal Nominal
25 Characteristics of Different Levels of Scale Measurement Type of Scale Data Characteristics Numerical Operation Descriptive Statistics Examples Nominal Classification but no order, distance, or origin Counting Frequency in each category Percent in each category Mode Gender (1=Male, 2=Female) Ordinal Classification and order but no distance or unique origin Rank ordering Median Range Percentile ranking Academic status (1=Freshman, 2=Sophomore, 3=Junior, 4=Senior) Interval Classification, order, and distance but no unique origin Arithmetic operations that preserve order and magnitude Mean Standard deviation Variance Temperature in degrees Satisfaction on semantic differential scale Ratio Classification, order, distance and unique origin Arithmetic operations on actual quantities Geometric mean Coefficient of variation Age in years Income in Saudi riyals Note: All statistics appropriate for lower-order scales (nominal being lowest) are appropriate for higher-order scales (ratio being the highest)
26
27
28 Example 3 Nancy thinks that drivers would be more likely to allow a member of the opposite sex to cross the street. She sets up an experiment at an intersection using a male and female friend as pedestrians. For every odd car (i.e., cars 1, 3, 5, etc.) that comes by she has a member of the same sex attempt to cross the street. For every even car (i.e., cars 2, 4, 6, etc.) that comes by, a member of the opposite sex attempts to cross. Nancy counts the number of times that pedestrian is allowed to cross the street. What is the independent variable (IV) in this experiment? What are the levels of the IV? What is the dependent variable?
29 Examples 4 Riley wants to know if it is possible for people to show signs of alcohol intoxication even when they haven t ingested any alcohol. She randomly assigns one group of subjects to drink 4 beers with alcohol while another group of subjects is given 4 nonalcoholic beers. Subjects are given one and a half hours to drink the beers. A control group of subjects is given an equivalent amount of water to drink over the same time span. After each group has consumed their drinks, Riley has each subject perform a paper and pencil maze task and measures the time it takes to complete the maze.
30 Examples 5 Bob is interested in whether his students perform better with only a mid-term and final during a course or with several tests given throughout the semester. To test this, he administers a mid-term and final to Section-1 and six exams to Section-2. At the end of the semester he compares final grades for each section.
31 Sample Size

32
33 Data Presentation

34
35 How are variables measured? The investigator seeks to examine if diabetes is associated with an increased risk of TB in an urban setting in Indonesia using unmatched case-control study. Research Problems Are there any association between diabetes and an increasing risk of TB in an urban setting in Indonesia Hypothesis Testing Diabetes is associated with an increased risk of TB in an urban setting in Indonesia Sample Size Qualitative, nominal, dichotomous Data Presentation Bar chart
36 How are variables measured? The investigator wants to perform clinical trial to compare total blood cholesterol level (mg/dl) among patients receiving new drug X and patients receiving standard therapy, using cross-over design. Research Problems Are there any mean differences of to total blood cholesterol level new drug X compare than standard therapy Hypothesis Testing New drug X had mean differences of total blood cholesterol level compared than standard therapy Sample Size Quantitative, continuous Data Presentation Box plots

37 Let s discuss the first journal
38
39 Variables Sex (male/female) Age classification Income Overcrowding ( 2 vs 2) History of TB contact (Yes/No) Body mass index (kg/m 2 ) Type and scale of measurement Qualitative/categorical, ordinal Qualitative/categorical, ordinal Quantitative/numerical
40
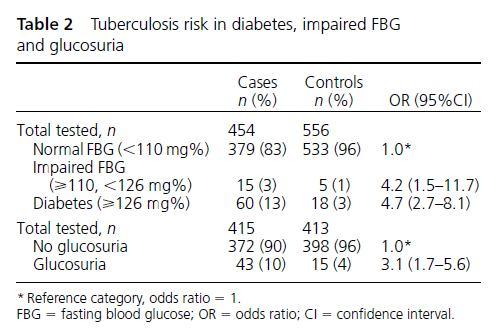
41 Variables FBG results -Normal -Impaired -Diabetes Glucosuria -Yes -No Type and scale of measurement Qualitative/categorical, ordinal

42 Let s discuss the second journal

43
44
45 Variables Sex (male/female) Age (years) History of TB contac (Yes/No) Previous treatment for TB (Yes/No) Type and scale of measurement Quantitative/numerical
46 Variables Duration (week) Cough (Yes/No) Hemopthysis (Yes/No) Dyspnea (Yes/No) Fever (Yes/No) Night sweats (Yes/No) Weight loss (Yes/No) Symptom score >4 ( 4 vs 4) BMI (kg/m 2 ) BCG scar present (Yes/No) Type and scale of measurement Quantitative/numerical Quantitative/numerical
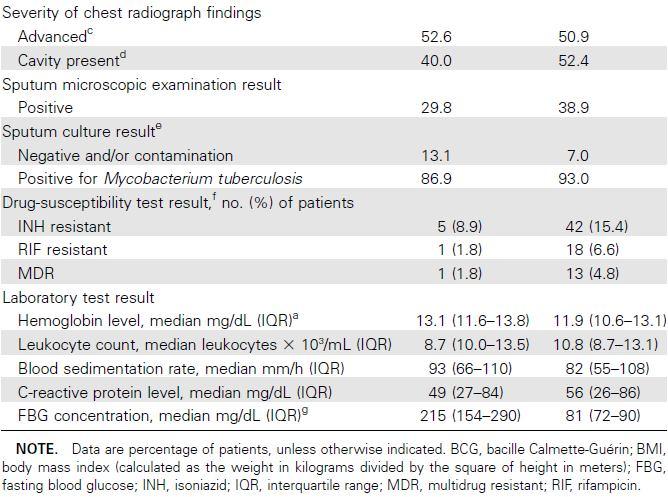
47 Variables Severity of chest radiograph findings -Advanced (Yes/No) -Cavity present (Yes/No) Sputum microscopic examination result -Positive (Yes/No) Sputum culture result -Negative and/or contamination -Positive INH resistant (Yes/No) RIF resistant (Yes/No) MDR (Yes/No) Laboratory Test Results (all) Type and scale of measurement Quantitative/numerical
48
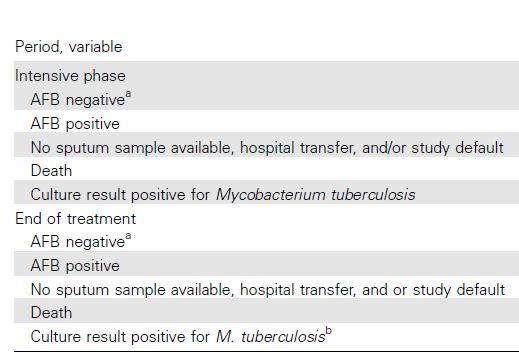
49 Variables AFB negative (Yes/No) AFB positive (Yes/No) No sputum available, hospital transfer, and/or study default (Yes/No) Death (Yes/No) Culture result positive (Yes/No) Type and scale of measurement
50
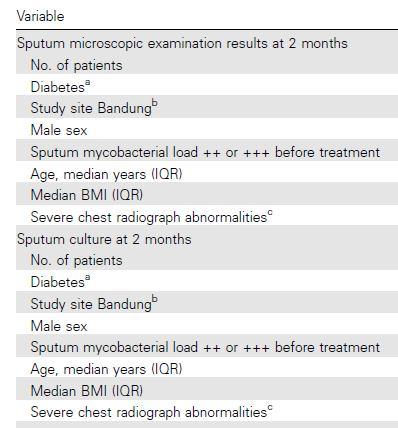
51 Variables Diabetes (FBG >126 mg/dl) Study site Bandung (Yes/No) Sex (male/female) Age (years) BMI (kg/m 2 ) Severe chest radiograph abnormalities (mild or moderate vs severe) Non-conversion at week 8 (Yes/No) Type and scale of measurement Quantitative/numerical Quantitative/numerical
52 Adjustment rate material See Modern Epidemiology, page 262; Greenland and the attachment pdf. file standardization

53
Level of Measurements
 Level of Measurements Mohammed TA, Omar, Ph.D. PT, CLT, PGDCR Rehabilitation Health Science Department CAMS-KSU, Momarar@ksu.edu.sa Dr.taher_m@yahoo.com 0542115404 Objectives Identify types of variables
Introduction to biostatistics & Levels of measurement
 Introduction to biostatistics & Levels of measurement Objectives: Definition of statistics and biostatistics To understand different Levels of measurements To understand different Types of data To use
Introduction to Quantitative Methods Prentice Hall SPSS for Doctors Dr. MOHAMAD ALKHEDR
 Introduction to Quantitative Methods 2007 Prentice Hall SPSS for Doctors Dr. MOHAMAD ALKHEDR 2-1 Meaning of Variable A characteristic, number, or quantity that increases or decreases over time, or takes
On the purpose of testing:
 Why Evaluation & Assessment is Important Feedback to students Feedback to teachers Information to parents Information for selection and certification Information for accountability Incentives to increase
Statistics. Nur Hidayanto PSP English Education Dept. SStatistics/Nur Hidayanto PSP/PBI
 Statistics Nur Hidayanto PSP English Education Dept. RESEARCH STATISTICS WHAT S THE RELATIONSHIP? RESEARCH RESEARCH positivistic Prepositivistic Postpositivistic Data Initial Observation (research Question)
MBA 605 Business Analytics Don Conant, PhD. GETTING TO THE STANDARD NORMAL DISTRIBUTION
 MBA 605 Business Analytics Don Conant, PhD. GETTING TO THE STANDARD NORMAL DISTRIBUTION Variables In the social sciences data are the observed and/or measured characteristics of individuals and groups
NORTH SOUTH UNIVERSITY TUTORIAL 1
 NORTH SOUTH UNIVERSITY TUTORIAL 1 REVIEW FROM BIOSTATISTICS I AHMED HOSSAIN,PhD Data Management and Analysis AHMED HOSSAIN,PhD - Data Management and Analysis 1 DATA TYPES/ MEASUREMENT SCALES Categorical:
Basic Statistical Concepts, Research Design, & Notation
 , Research Design, & Notation Variables, Scores, & Data A variable is a characteristic or condition that can change or take on different values. Most research begins with a general question about the relationship
Choosing the correct statistical test in research
 Leading Article Choosing the correct statistical test in research Nalika Gunawardena 1 Sri Lanka Journal of Child Health, 2011; 40: 149-153 (Key words: Statistical test; research) Gone are the days where
Designing Psychology Experiments: Data Analysis and Presentation
 Data Analysis and Presentation Review of Chapter 4: Designing Experiments Develop Hypothesis (or Hypotheses) from Theory Independent Variable(s) and Dependent Variable(s) Operational Definitions of each
CHAPTER 3 DATA ANALYSIS: DESCRIBING DATA
 Data Analysis: Describing Data CHAPTER 3 DATA ANALYSIS: DESCRIBING DATA In the analysis process, the researcher tries to evaluate the data collected both from written documents and from other sources such
3 CONCEPTUAL FOUNDATIONS OF STATISTICS
 3 CONCEPTUAL FOUNDATIONS OF STATISTICS In this chapter, we examine the conceptual foundations of statistics. The goal is to give you an appreciation and conceptual understanding of some basic statistical
VARIABLES AND MEASUREMENT
 ARTHUR SYC 204 (EXERIMENTAL SYCHOLOGY) 16A LECTURE NOTES [01/29/16] VARIABLES AND MEASUREMENT AGE 1 Topic #3 VARIABLES AND MEASUREMENT VARIABLES Some definitions of variables include the following: 1.
Nature of measurement
 Nature of measurement Lecturer: Dr. Emmanuel Adjei; Department of Information Studies Contact Information: eadjei@ug.edu.gh College of Education School of Continuing and Distance Education 2014/2015 2016/2017
Descriptive Statistics Lecture
 Definitions: Lecture Psychology 280 Orange Coast College 2/1/2006 Statistics have been defined as a collection of methods for planning experiments, obtaining data, and then analyzing, interpreting and
9.63 Laboratory in Cognitive Science
 9.63 Laboratory in Cognitive Science Fall 2005 Course 2b Variables, Controls Aude Oliva Ben Balas, Charles Kemp Science is: Scientific Thinking 1. Empirical Based on observations 2. Objective Observations
Basic SPSS for Postgraduate
 Basic SPSS for Postgraduate Dr. Shamshuritawati Sharif School of Quantitative Science Email : shamshurita@uum.edu.my Office : +6049286336 Mobile :+60194248001 In the process of carrying out the research,
9 research designs likely for PSYC 2100
 9 research designs likely for PSYC 2100 1) 1 factor, 2 levels, 1 group (one group gets both treatment levels) related samples t-test (compare means of 2 levels only) 2) 1 factor, 2 levels, 2 groups (one
Designing Psychology Experiments: Data Analysis and Presentation
 Data Analysis and Presentation Review of Chapter 4: Designing Experiments Develop Hypothesis (or Hypotheses) from Theory Independent Variable(s) and Dependent Variable(s) Operational Definitions of each
STA630 Research Methods Solved MCQs By
 STA630 Research Methods Solved MCQs By http://vustudents.ning.com 31-07-2010 Quiz # 1: Question # 1 of 10: A one tailed hypothesis predicts----------- The future The lottery result The frequency of the
Chapter 7. Basic Marketing Research Using Microsoft Excel Data Analysis Canadian Edition. Burns, Bush & Nash
 Chapter 7 Basic Marketing Research Using Microsoft Excel Data Analysis Canadian Edition Burns, Bush & Nash 7-1 1. Examine question response formats commonly used in marketing research. 2. Distinguish among
Statistics Lecture 4. Lecture objectives - Definitions of statistics. -Types of statistics -Nature of data -Levels of measurement
 Statistics Lecture 4 Introduction of statistics By Dr.Chelli Lecture objectives - Definitions of statistics -Types of statistics -Nature of data -Levels of measurement - Introduction The study of statistics
11/18/2013. Correlational Research. Correlational Designs. Why Use a Correlational Design? CORRELATIONAL RESEARCH STUDIES
 Correlational Research Correlational Designs Correlational research is used to describe the relationship between two or more naturally occurring variables. Is age related to political conservativism? Are
2.4.1 STA-O Assessment 2
 2.4.1 STA-O Assessment 2 Work all the problems and determine the correct answers. When you have completed the assessment, open the Assessment 2 activity and input your responses into the online grading
Psychology Research Process
 Psychology Research Process Logical Processes Induction Observation/Association/Using Correlation Trying to assess, through observation of a large group/sample, what is associated with what? Examples:
AP Psych - Stat 2 Name Period Date. MULTIPLE CHOICE. Choose the one alternative that best completes the statement or answers the question.
 AP Psych - Stat 2 Name Period Date MULTIPLE CHOICE. Choose the one alternative that best completes the statement or answers the question. 1) In a set of incomes in which most people are in the $15,000
Chapter 1: Data Collection Pearson Prentice Hall. All rights reserved
 Chapter 1: Data Collection 2010 Pearson Prentice Hall. All rights reserved 1-1 Statistics is the science of collecting, organizing, summarizing, and analyzing information to draw conclusions or answer
MBA SEMESTER III. MB0050 Research Methodology- 4 Credits. (Book ID: B1206 ) Assignment Set- 1 (60 Marks)
 Assignment Set- 1 (60 Marks)") MBA SEMESTER III MB0050 Research Methodology- 4 Credits (Book ID: B1206 ) Assignment Set- 1 (60 Marks) Note: Each question carries 10 Marks. Answer all the questions Q1. a. Differentiate between nominal,
MBA SEMESTER III MB0050 Research Methodology- 4 Credits (Book ID: B1206 ) Assignment Set- 1 (60 Marks) Note: Each question carries 10 Marks. Answer all the questions Q1. a. Differentiate between nominal,
Lecture Outline. Biost 517 Applied Biostatistics I. Purpose of Descriptive Statistics. Purpose of Descriptive Statistics
 Biost 517 Applied Biostatistics I Scott S. Emerson, M.D., Ph.D. Professor of Biostatistics University of Washington Lecture 3: Overview of Descriptive Statistics October 3, 2005 Lecture Outline Purpose
Introduction: Statistics, Data and Statistical Thinking Part II
 Introduction: Statistics, Data and Statistical Thinking Part II FREC/STAT 608 Dr. Tom Ilvento Department of Food and Resource Economics Let s Continue with our introduction We need terms and definitions
Analysis and Interpretation of Data Part 1
 Analysis and Interpretation of Data Part 1 DATA ANALYSIS: PRELIMINARY STEPS 1. Editing Field Edit Completeness Legibility Comprehensibility Consistency Uniformity Central Office Edit 2. Coding Specifying
Variables and Data. Gbenga Ogunfowokan Lead, Nigerian Regional Faculty The Global Health Network 19 th May 2017
 Variables and Data Gbenga Ogunfowokan Lead, Nigerian Regional The Global Health Network 19 th May 2017 Objectives At the end of this presentation you should be able to 1) Define a variable 2) Classify
Chapter 7: Descriptive Statistics
 Chapter Overview Chapter 7 provides an introduction to basic strategies for describing groups statistically. Statistical concepts around normal distributions are discussed. The statistical procedures of
Results & Statistics: Description and Correlation. I. Scales of Measurement A Review
 Results & Statistics: Description and Correlation The description and presentation of results involves a number of topics. These include scales of measurement, descriptive statistics used to summarize
Two Branches Of Statistics
 Stats 95 Two Branches Of Statistics Descriptive Organize Summarize Communicate a body of observed data Describe a Population or a Sample Inferential Using sample data to make estimates of the rest of the
UNIVERSITY OF THE FREE STATE DEPARTMENT OF COMPUTER SCIENCE AND INFORMATICS CSIS6813 MODULE TEST 2
 UNIVERSITY OF THE FREE STATE DEPARTMENT OF COMPUTER SCIENCE AND INFORMATICS CSIS6813 MODULE TEST 2 DATE: 3 May 2017 MARKS: 75 ASSESSOR: Prof PJ Blignaut MODERATOR: Prof C de Villiers (UP) TIME: 2 hours
AP Psych - Stat 1 Name Period Date. MULTIPLE CHOICE. Choose the one alternative that best completes the statement or answers the question.
 AP Psych - Stat 1 Name Period Date MULTIPLE CHOICE. Choose the one alternative that best completes the statement or answers the question. 1) In a set of incomes in which most people are in the $15,000
AP Psychology -- Chapter 02 Review Research Methods in Psychology
 AP Psychology -- Chapter 02 Review Research Methods in Psychology 1. In the opening vignette, to what was Alicia's condition linked? The death of her parents and only brother 2. What did Pennebaker s study
Choosing an Approach for a Quantitative Dissertation: Strategies for Various Variable Types
 Choosing an Approach for a Quantitative Dissertation: Strategies for Various Variable Types Kuba Glazek, Ph.D. Methodology Expert National Center for Academic and Dissertation Excellence Outline Thesis
MULTIPLE CHOICE. Choose the one alternative that best completes the statement or answers the question.
 381 Exam #2 E Name MULTIPLE CHOICE. Choose the one alternative that best completes the statement or answers the question. 1) An approach to qualitative research that focuses on building theories is known
Choosing the Correct Statistical Test
 Choosing the Correct Statistical Test T racie O. Afifi, PhD Departments of Community Health Sciences & Psychiatry University of Manitoba Department of Community Health Sciences COLLEGE OF MEDICINE, FACULTY
Measurement. 500 Research Methods Mike Kroelinger
 Measurement 500 Research Methods Mike Kroelinger Levels of Measurement Nominal Lowest level -- used to classify variables into two or more categories. Cases placed in the same category must be equivalent.
Chapter 1: Explaining Behavior
 Chapter 1: Explaining Behavior GOAL OF SCIENCE is to generate explanations for various puzzling natural phenomenon. - Generate general laws of behavior (psychology) RESEARCH: principle method for acquiring
CALIFORNIA STATE UNIVERSITY STANISLAUS DEPARTMENT OF SOCIOLOGY ASSESSMENT MODEL
 CALIFORNIA STATE UNIVERSITY STANISLAUS DEPARTMENT OF SOCIOLOGY ASSESSMENT MODEL Introduction The purpose of assessment in education is to create a model that can quantify the degree of program success
Application of Medical Statistics. E.M.S. Bandara Dep. of Medical Lab. Sciences
 Application of Medical Statistics E.M.S. Bandara Dep. of Medical Lab. Sciences What is Statistics? The discipline concerned with the treatment of numerical data derived from groups of individuals (P. Armitage).
Homework Exercises for PSYC 3330: Statistics for the Behavioral Sciences
 Homework Exercises for PSYC 3330: Statistics for the Behavioral Sciences compiled and edited by Thomas J. Faulkenberry, Ph.D. Department of Psychological Sciences Tarleton State University Version: July
Introduction to Statistics and Research Design. Arlo Clark-Foos
 Introduction to Statistics and Research Design Arlo Clark-Foos Dr. John Snow and Cholera 1854.London Two Branches of Statistics Descriptive Statistics Organize, summarize, & communicate Reduce large amounts
Statistics is a broad mathematical discipline dealing with
 Statistical Primer for Cardiovascular Research Descriptive Statistics and Graphical Displays Martin G. Larson, SD Statistics is a broad mathematical discipline dealing with techniques for the collection,
11/24/2017. Do not imply a cause-and-effect relationship
 Correlational research is used to describe the relationship between two or more naturally occurring variables. Is age related to political conservativism? Are highly extraverted people less afraid of rejection
Introduction to Statistics
 Introduction to Statistics Parameter: measurable characteristic of a population. Population: all members of a definable group. For statistical purposes a population must have definable characteristics
Describe what is meant by a placebo Contrast the double-blind procedure with the single-blind procedure Review the structure for organizing a memo
 Please note the page numbers listed for the Lind book may vary by a page or two depending on which version of the textbook you have. Readings: Lind 1 11 (with emphasis on chapters 10, 11) Please note chapter
Biostatistics. Donna Kritz-Silverstein, Ph.D. Professor Department of Family & Preventive Medicine University of California, San Diego
 Biostatistics Donna Kritz-Silverstein, Ph.D. Professor Department of Family & Preventive Medicine University of California, San Diego (858) 534-1818 dsilverstein@ucsd.edu Introduction Overview of statistical
Choosing a Significance Test. Student Resource Sheet
 Choosing a Significance Test Student Resource Sheet Choosing Your Test Choosing an appropriate type of significance test is a very important consideration in analyzing data. If an inappropriate test is
Biostatistics for Med Students. Lecture 1
 Biostatistics for Med Students Lecture 1 John J. Chen, Ph.D. Professor & Director of Biostatistics Core UH JABSOM JABSOM MD7 February 14, 2018 Lecture note: http://biostat.jabsom.hawaii.edu/education/training.html
Chapter 2 Norms and Basic Statistics for Testing MULTIPLE CHOICE
 Chapter 2 Norms and Basic Statistics for Testing MULTIPLE CHOICE 1. When you assert that it is improbable that the mean intelligence test score of a particular group is 100, you are using. a. descriptive
Lesson 9 Presentation and Display of Quantitative Data
 Lesson 9 Presentation and Display of Quantitative Data Learning Objectives All students will identify and present data using appropriate graphs, charts and tables. All students should be able to justify
Statistical analysis DIANA SAPLACAN 2017 * SLIDES ADAPTED BASED ON LECTURE NOTES BY ALMA LEORA CULEN
 Statistical analysis DIANA SAPLACAN 2017 * SLIDES ADAPTED BASED ON LECTURE NOTES BY ALMA LEORA CULEN Vs. 2 Background 3 There are different types of research methods to study behaviour: Descriptive: observations,
Section 1: Exploring Data
 Section 1: Exploring Data The following maps the videos in this section to the Texas Essential Knowledge and Skills for Mathematics TAC 111.47(c). 1.01 Introduction to Statistics 1.02 Statistics and Parameters
ISC- GRADE XI HUMANITIES ( ) PSYCHOLOGY. Chapter 2- Methods of Psychology
 PSYCHOLOGY. Chapter 2- Methods of Psychology") ISC- GRADE XI HUMANITIES (2018-19) PSYCHOLOGY Chapter 2- Methods of Psychology OUTLINE OF THE CHAPTER (i) Scientific Methods in Psychology -observation, case study, surveys, psychological tests, experimentation
ISC- GRADE XI HUMANITIES (2018-19) PSYCHOLOGY Chapter 2- Methods of Psychology OUTLINE OF THE CHAPTER (i) Scientific Methods in Psychology -observation, case study, surveys, psychological tests, experimentation
Empirical Knowledge: based on observations. Answer questions why, whom, how, and when.
 INTRO TO RESEARCH METHODS: Empirical Knowledge: based on observations. Answer questions why, whom, how, and when. Experimental research: treatments are given for the purpose of research. Experimental group
Unit 1 Exploring and Understanding Data
 Unit 1 Exploring and Understanding Data Area Principle Bar Chart Boxplot Conditional Distribution Dotplot Empirical Rule Five Number Summary Frequency Distribution Frequency Polygon Histogram Interquartile
1.1 Goals and Learning Objectives. 1.2 Basic Principles. 1.3 Criteria for Good Measurement. Goals and Learning Objectives
 1 1.1 Goals and Learning Objectives Goals and Learning Objectives Goals of this chapter: Be aware of potential sources for bias in survey research Identify survey questions & variables needed to answer
Data and Statistics 101: Key Concepts in the Collection, Analysis, and Application of Child Welfare Data
 TECHNICAL REPORT Data and Statistics 101: Key Concepts in the Collection, Analysis, and Application of Child Welfare Data CONTENTS Executive Summary...1 Introduction...2 Overview of Data Analysis Concepts...2
Probability and Statistics. Chapter 1
 Probability and Statistics Chapter 1 Individuals and Variables Individuals and Variables Individuals are objects described by data. Individuals and Variables Individuals are objects described by data.
Chapter 1 Overview. Created by Tom Wegleitner, Centreville, Virginia. Copyright 2007 Pearson Education, Inc Publishing as Pearson Addison-Wesley.
 Chapter 1 Overview Created by Tom Wegleitner, Centreville, Virginia Slide 1 11 Statistics Overview Slide 2 A. Statistics is the science of conducting studies to: Collect Organize Summarize Analyze Draw
Still important ideas
 Readings: OpenStax - Chapters 1 11 + 13 & Appendix D & E (online) Plous - Chapters 2, 3, and 4 Chapter 2: Cognitive Dissonance, Chapter 3: Memory and Hindsight Bias, Chapter 4: Context Dependence Still
Statistics Guide. Prepared by: Amanda J. Rockinson- Szapkiw, Ed.D.
 This guide contains a summary of the statistical terms and procedures. This guide can be used as a reference for course work and the dissertation process. However, it is recommended that you refer to statistical
Six Sigma Glossary Lean 6 Society
 Six Sigma Glossary Lean 6 Society ABSCISSA ACCEPTANCE REGION ALPHA RISK ALTERNATIVE HYPOTHESIS ASSIGNABLE CAUSE ASSIGNABLE VARIATIONS The horizontal axis of a graph The region of values for which the null
CHAPTER 4 THE QUESTIONNAIRE DESIGN /SOLUTION DESIGN. This chapter contains explanations that become a basic knowledge to create a good
 CHAPTER 4 THE QUESTIONNAIRE DESIGN /SOLUTION DESIGN This chapter contains explanations that become a basic knowledge to create a good questionnaire which is able to meet its objective. Just like the thesis
Prepared by: DR. ROZIAH MOHD RASDI Faculty of Educational Studies Universiti Putra Malaysia
 Prepared by: DR. ROZIAH MOHD RASDI Faculty of Educational Studies Universiti Putra Malaysia roziah_m@upm.edu.my Topic 5 Important Terms in Research, Development of Objectives and Hypothesis How Research
What you should know before you collect data. BAE 815 (Fall 2017) Dr. Zifei Liu
 Dr. Zifei Liu") What you should know before you collect data BAE 815 (Fall 2017) Dr. Zifei Liu Zifeiliu@ksu.edu Types and levels of study Descriptive statistics Inferential statistics How to choose a statistical test
What you should know before you collect data BAE 815 (Fall 2017) Dr. Zifei Liu Zifeiliu@ksu.edu Types and levels of study Descriptive statistics Inferential statistics How to choose a statistical test
Introduction to statistics Dr Alvin Vista, ACER Bangkok, 14-18, Sept. 2015
 Analysing and Understanding Learning Assessment for Evidence-based Policy Making Introduction to statistics Dr Alvin Vista, ACER Bangkok, 14-18, Sept. 2015 Australian Council for Educational Research Structure
Variable Measurement, Norms & Differences
 Variable Measurement, Norms & Differences 1 Expectations Begins with hypothesis (general concept) or question Create specific, testable prediction Prediction can specify relation or group differences Different
Chapter 2--Norms and Basic Statistics for Testing
 Chapter 2--Norms and Basic Statistics for Testing Student: 1. Statistical procedures that summarize and describe a series of observations are called A. inferential statistics. B. descriptive statistics.
Lunchtime Seminar. Risper Awuor, Ph.D. Department of Graduate Educational and Leadership. January 30, 2013
 Lunchtime Seminar Risper Awuor, Ph.D. Department of Graduate Educational and Leadership January 30, 2013 Scales of Measurement Nominal Ordinal Interval Ratio Scales of Measurement Nominal names assigned
Statistical Methods and Reasoning for the Clinical Sciences
 Statistical Methods and Reasoning for the Clinical Sciences Evidence-Based Practice Eiki B. Satake, PhD Contents Preface Introduction to Evidence-Based Statistics: Philosophical Foundation and Preliminaries
Lecturer: Rob van der Willigen 11/9/08
 Auditory Perception - Detection versus Discrimination - Localization versus Discrimination - - Electrophysiological Measurements Psychophysical Measurements Three Approaches to Researching Audition physiology
Displaying the Order in a Group of Numbers Using Tables and Graphs
 SIXTH EDITION 1 Displaying the Order in a Group of Numbers Using Tables and Graphs Statistics (stats) is a branch of mathematics that focuses on the organization, analysis, and interpretation of a group
Prepared by: Assoc. Prof. Dr Bahaman Abu Samah Department of Professional Development and Continuing Education Faculty of Educational Studies
 Prepared by: Assoc. Prof. Dr Bahaman Abu Samah Department of Professional Development and Continuing Education Faculty of Educational Studies Universiti Putra Malaysia Serdang At the end of this session,
Measurement. Different terminology. Marketing managers work with abstractions. Different terminology. Different terminology.
 Different terminology Managerial view Marketing managers work with abstractions Concepts A generalized idea about a class of objects, attributes, occurrences or processes Propositions A set of concepts
Chapter 11 Nonexperimental Quantitative Research Steps in Nonexperimental Research
 Chapter 11 Nonexperimental Quantitative Research (Reminder: Don t forget to utilize the concept maps and study questions as you study this and the other chapters.) Nonexperimental research is needed because
Lecturer: Rob van der Willigen 11/9/08
 Auditory Perception - Detection versus Discrimination - Localization versus Discrimination - Electrophysiological Measurements - Psychophysical Measurements 1 Three Approaches to Researching Audition physiology
Describe what is meant by a placebo Contrast the double-blind procedure with the single-blind procedure Review the structure for organizing a memo
 Please note the page numbers listed for the Lind book may vary by a page or two depending on which version of the textbook you have. Readings: Lind 1 11 (with emphasis on chapters 5, 6, 7, 8, 9 10 & 11)
Data, frequencies, and distributions. Martin Bland. Types of data. Types of data. Clinical Biostatistics
 Clinical Biostatistics Data, frequencies, and distributions Martin Bland Professor of Health Statistics University of York http://martinbland.co.uk/ Types of data Qualitative data arise when individuals
Sta 309 (Statistics And Probability for Engineers)
") Instructor: Prof. Mike Nasab Sta 309 (Statistics And Probability for Engineers) Chapter (1) 1. Statistics: The science of collecting, organizing, summarizing, analyzing numerical information called data
Instructor: Prof. Mike Nasab Sta 309 (Statistics And Probability for Engineers) Chapter (1) 1. Statistics: The science of collecting, organizing, summarizing, analyzing numerical information called data
STT 200 Test 1 Green Give your answer in the scantron provided. Each question is worth 2 points.
 STT 200 Test 1 Green Give your answer in the scantron provided. Each question is worth 2 points. For Questions 1 & 2: It is known that the distribution of starting salaries for MSU Education majors has
Group Assignment #1: Concept Explication. For each concept, ask and answer the questions before your literature search.
 Group Assignment #1: Concept Explication 1. Preliminary identification of the concept. Identify and name each concept your group is interested in examining. Questions to asked and answered: Is each concept
Report on the Alcohol and Social Life Surveys (updated 5/1/14)
") Report on the Alcohol and Social Life Surveys (updated 5/1/14) The Alcohol and Social Life () Surveys were administered as part of Cornell University s work with the National College Health Improvement
Report on the Alcohol and Social Life Surveys (updated 5/1/14) The Alcohol and Social Life () Surveys were administered as part of Cornell University s work with the National College Health Improvement
Math 2200 First Mid-Term Exam September 22, 2010
 Math 2200 First Mid-Term Exam September 22, 2010 This exam has 25 questions of 4 points each. All answers have been rounded-off so if your calculated answer differs from the given options slightly, choose
Test Bank for Privitera, Statistics for the Behavioral Sciences
 1. The use of tables and graphs to summarize data is an example of A) inferential statistics B) interpretation C) descriptive statistics D) generalization 2. Statistical analysis allows researchers to
Variability. After reading this chapter, you should be able to do the following:
 LEARIG OBJECTIVES C H A P T E R 3 Variability After reading this chapter, you should be able to do the following: Explain what the standard deviation measures Compute the variance and the standard deviation
Lesson 11 Correlations
 Lesson 11 Correlations Lesson Objectives All students will define key terms and explain the difference between correlations and experiments. All students should be able to analyse scattergrams using knowledge
Types of questions. You need to know. Short question. Short question. Measurement Scale: Ordinal Scale
 You need to know Materials in the slides Materials in the 5 coglab presented in class Textbooks chapters Information/explanation given in class you can have all these documents with you + your notes during
Chapter 4: Defining and Measuring Variables
 Chapter 4: Defining and Measuring Variables A. LEARNING OUTCOMES. After studying this chapter students should be able to: Distinguish between qualitative and quantitative, discrete and continuous, and
Ch. 11 Measurement. Paul I-Hai Lin, Professor A Core Course for M.S. Technology Purdue University Fort Wayne Campus
 TECH 646 Analysis of Research in Industry and Technology PART III The Sources and Collection of data: Measurement, Measurement Scales, Questionnaires & Instruments, Sampling Ch. 11 Measurement Lecture
C-1: Variables which are measured on a continuous scale are described in terms of three key characteristics central tendency, variability, and shape.
 MODULE 02: DESCRIBING DT SECTION C: KEY POINTS C-1: Variables which are measured on a continuous scale are described in terms of three key characteristics central tendency, variability, and shape. C-2:
Slide 1 - Introduction to Statistics Tutorial: An Overview Slide notes
 Slide 1 - Introduction to Statistics Tutorial: An Overview Introduction to Statistics Tutorial: An Overview. This tutorial is the first in a series of several tutorials that introduce probability and statistics.
Review Questions Part 2 (MP 4 and 5) College Statistics. 1. Identify each of the following variables as qualitative or quantitative:
 College Statistics. 1. Identify each of the following variables as qualitative or quantitative:") Review Questions Part 2 (MP 4 and 5) College Statistics Name: 1. Identify each of the following variables as qualitative or quantitative: (a) number of pets in family (b) County of residence (c) Choice
Review Questions Part 2 (MP 4 and 5) College Statistics Name: 1. Identify each of the following variables as qualitative or quantitative: (a) number of pets in family (b) County of residence (c) Choice
POST GRADUATE DIPLOMA IN BIOETHICS (PGDBE) Term-End Examination June, 2016 MHS-014 : RESEARCH METHODOLOGY
 Term-End Examination June, 2016 MHS-014 : RESEARCH METHODOLOGY") No. of Printed Pages : 12 MHS-014 POST GRADUATE DIPLOMA IN BIOETHICS (PGDBE) Term-End Examination June, 2016 MHS-014 : RESEARCH METHODOLOGY Time : 2 hours Maximum Marks : 70 PART A Attempt all questions.
No. of Printed Pages : 12 MHS-014 POST GRADUATE DIPLOMA IN BIOETHICS (PGDBE) Term-End Examination June, 2016 MHS-014 : RESEARCH METHODOLOGY Time : 2 hours Maximum Marks : 70 PART A Attempt all questions.