Michael Hallquist, Thomas M. Olino, Paul A. Pilkonis University of Pittsburgh
|
|
|
- Maria Owens
- 6 years ago
- Views:
Transcription
1 Comparing the evidence for categorical versus dimensional representations of psychiatric disorders in the presence of noisy observations: a Monte Carlo study of the Bayesian Information Criterion and Akaike Information Criterion in latent variable models. Michael Hallquist, Thomas M. Olino, & Paul A. Pilkonis University of Pittsburgh
2 Introduction Considerable debate has centered on whether psychopathology is best represented by continuous dimensions or categorical subtypes (First, 2005; Kramer, Noda, & O Hara, 2004). Prior statistical research has focused on the ability of model selection criteria (e.g., the Bayesian Information Criterion) to adjudicate the latent structure of psychometric indicators.
3 Introduction Psychological Methods 2006, Vol. 11, No. 3, Copyright 2006 by the American Psychological Association X/06/$12.00 DOI: / X Information-Theoretic Latent Distribution Modeling: Distinguishing Discrete and Continuous Latent Variable Models Kristian E. Markon and Robert F. Krueger University of Minnesota, Twin Cities Campus Distinguishing between discrete and continuous latent variable distributions has become Markon & Krueger (2006): selection increasingly important in numerous domains of behavioral science. Here, the authors explore an information-theoretic approach to latent distribution modeling, in which the ability of latent distribution models to represent statistical information in observed data is emphasized. criteria (esp. BIC) can be used to probe The authors conclude that loss of statistical information with a decrease in the number of latent values provides an attractive basis for comparing discrete and continuous latent variable models. Theoretical considerations as well as the results of 2 Monte Carlo simulations indicate that information theory provides a sound basis modeling latent distributions and distinguishing between discrete and continuous latent variable models particular. the loss of statistical information resulting Keywords: information theory, latent class, latent trait, model selection from discretizing an underlying dimension. Methods for distinguishing between discrete and continvariable models. The approach has a number of benefits, including explicit formulation and comparison of competing e.g., if latent structure models, is quantification dimensional, of model fit, and situation within a larger latent variable modeling framework. We first review relationships between discrete and continuous latent distribution models and theory regarding in- estimating a few points along a latent formation-theoretic comparison of latent distribution models more generally. may Using be simulations, less we explore the distribution (oligovalued) behavior of information-theoretic criteria in comparisons between discrete and continuous latent distribution models, informative than a parametric under conditions in which the models are correctly and Here, we explore a novel approach to distinguishing be- incorrectly specified. We conclude that information-theoretic approaches provide approximating the dimension (e.g., an attractive basis normal). for comparisons uous latent distributions have become increasingly important in a variety of areas of behavioral science. For example, interest in these methods has grown greatly in clinical psychology, because of the importance of distinguishing between discrete versus continuous phenomena in etiology, assessment, and treatment of psychological disorders (e.g., Cole, 2004). Such methods have also become increasingly important in other areas of psychology and are being applied in other fields of behavioral science as well, such as in the study of language impairment (e.g., Dollaghan, 2004). tween discrete and continuous latent structure. This approach is based on information-theoretic comparison of discrete and continuous latent distribution models within a logistic latent variable model framework. We make a dis- between latent distribution models, including comparisons between discrete and continuous latent distribution models.
4 Introduction Factor mixture models that combine categorical and dimensional structure can often be resolved by model selection criteria (Lubke & Neale, 2005). Resolution of dimensional, categorical, and hybrid latent structure is clearest when 1. indicators are well separated across latent classes 2. there are more indicators 3. there is little unmodeled within-class residual association among indicators
5 Introduction Yet simulation studies have only tested multivariate normal (or skew-normal) data with little attention to the influence of scatter/outliers on latent structure decisions. There has been recent interest in the robustness of clustering methods to data that include scatter (Maitra & Ramler, 2008). In the case of empirical studies of mental disorders, data are rarely normal and heterogeneity sometimes manifests as indicators that are difficult to cluster.
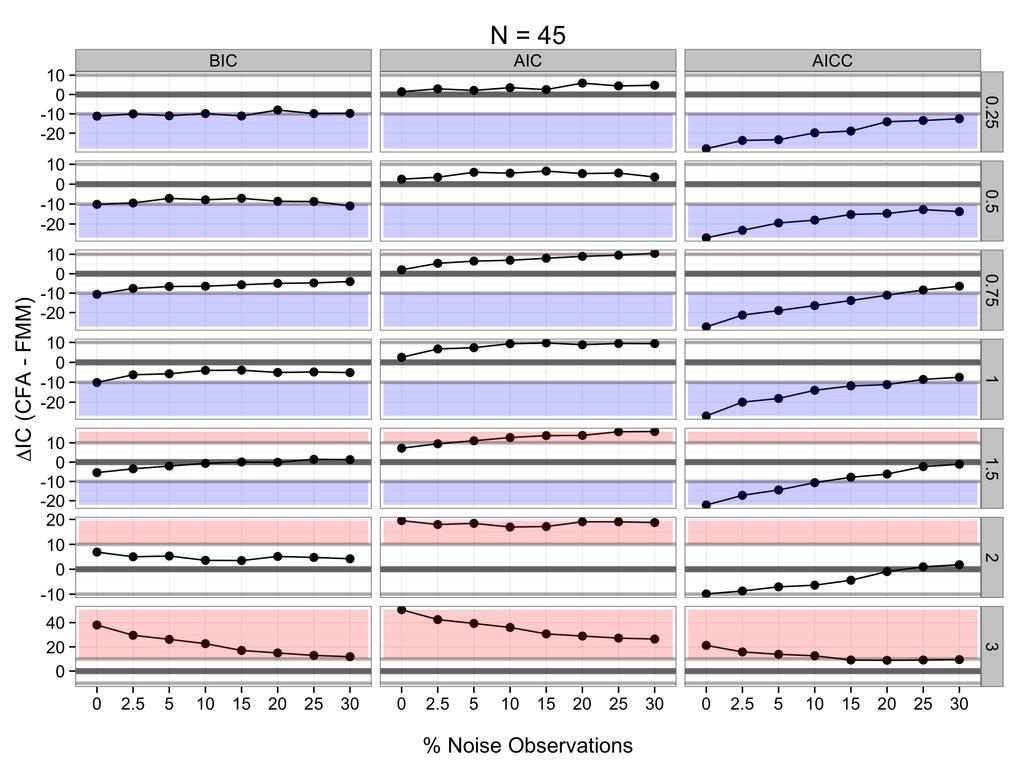
6 Scientific question If mental disorders in the population were sorted by severity (e.g., low, medium, high), would we be able to resolve categorical versus dimensional structure when some observations are noisy? Parameterization: latent profile model (LPM) with diagonal covariance matrices.
: α = 2 Bayesian Information Criterion (BIC): α = log(n) Finite-sample adjusted AIC (AIC C ) α =")
7 Model selection criteria Generally: Model log-likelihood Penalty coefficient Number of parameters Akaike Information Criterion (AIC): α = 2 Bayesian Information Criterion (BIC): α = log(n) Finite-sample adjusted AIC (AIC C ) α = 2*[n/(n-κ-1)]
8 Asymptotic properties of AIC and BIC AIC Efficient: tends to select the model that minimizes prediction error as sample size increases. Primarily concerned with minimizing the relative Kullback-Leibler (K-L) distance between a statistical model and the unknown mechanisms giving rise to the observed data. BIC Consistent: true model will be selected with increasing probability as sample size increases. Vrieze 2012; Yang 2005
9 Simulation Conditions Number of latent classes: 3 (equal prob.) Number of indicators: 5 Sample size: 45, 90, 180, 360, 720, 1440 Mean separation:.25,.5, 1.0, 1.5, 2.0, 3.0 Proportion of noisy observations added: 0%, 2.5%, 5%, 10%, 15%, 20%, 25%, 30% Number of replications: 200/condition
10 Simulation methods Within-class multivariate normal data generated using the MixSim package in R. Noise observations added by randomly sampling observations that were outside the 99% ellipsoids of concentration for all clusters (Maitra & Ramler, 2009). Noise observations were uniformly distributed with bounds -1.5*IQR < x < 1.5*IQR
 of scatter observations outside of 99% ellipsoid bounds Analyze simulated data in Mplus 7.")
11 Simulation Pipeline For each replication, simulate mvnorm Gaussian mixtures using MixSim in R Add some proportion (0 0.3) of scatter observations outside of 99% ellipsoid bounds Analyze simulated data in Mplus 7.0 using LPM and CFA Summarize and visualize results across conditions
12 Example of clean latent structure n = 720, LC separation = 2.0 SD, 0% Noise

13 Example of noisy latent structure n = 720, LC separation = 2.0 SD, 10% Noise
14
15
16
17
18
19
20
21
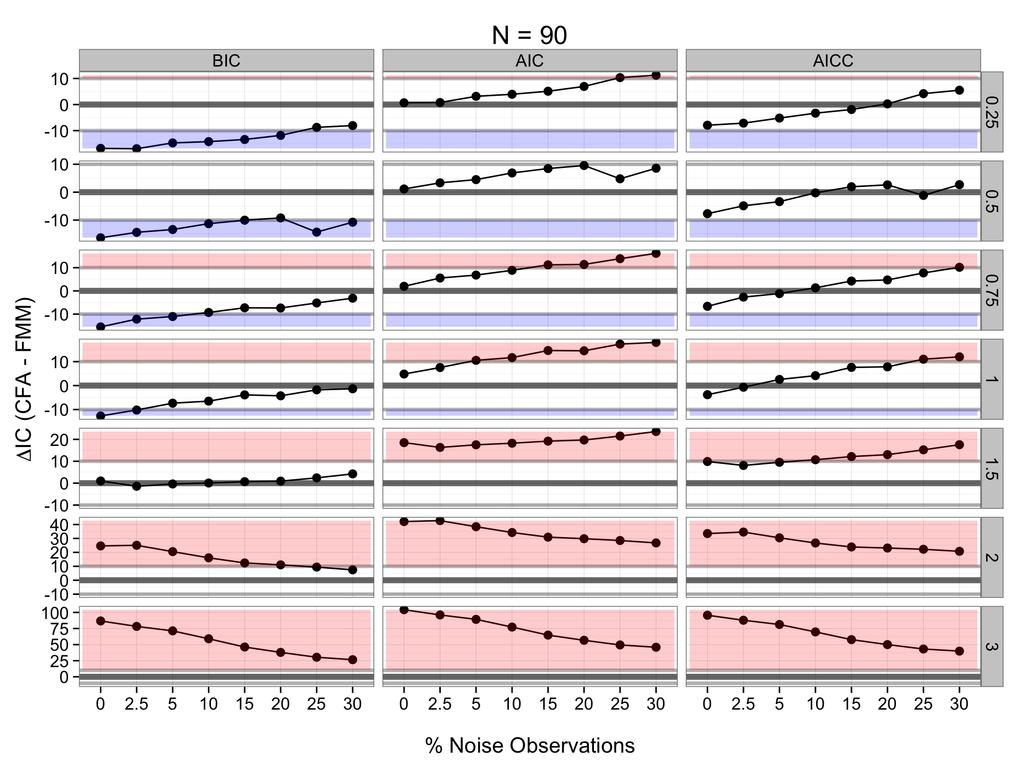
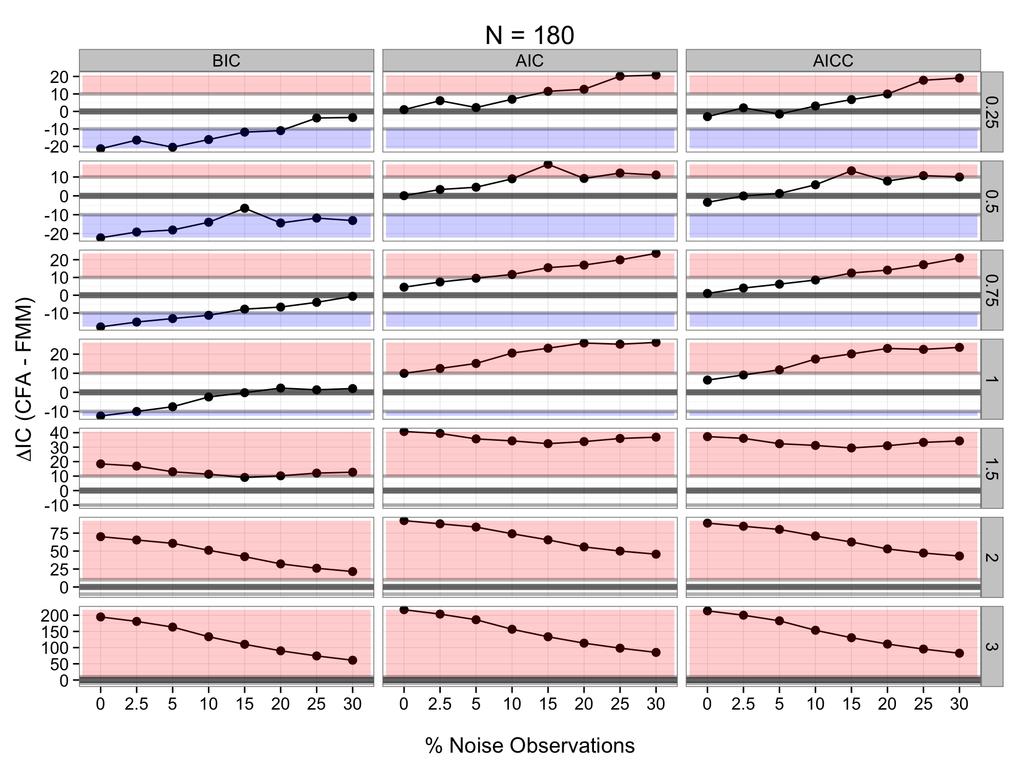
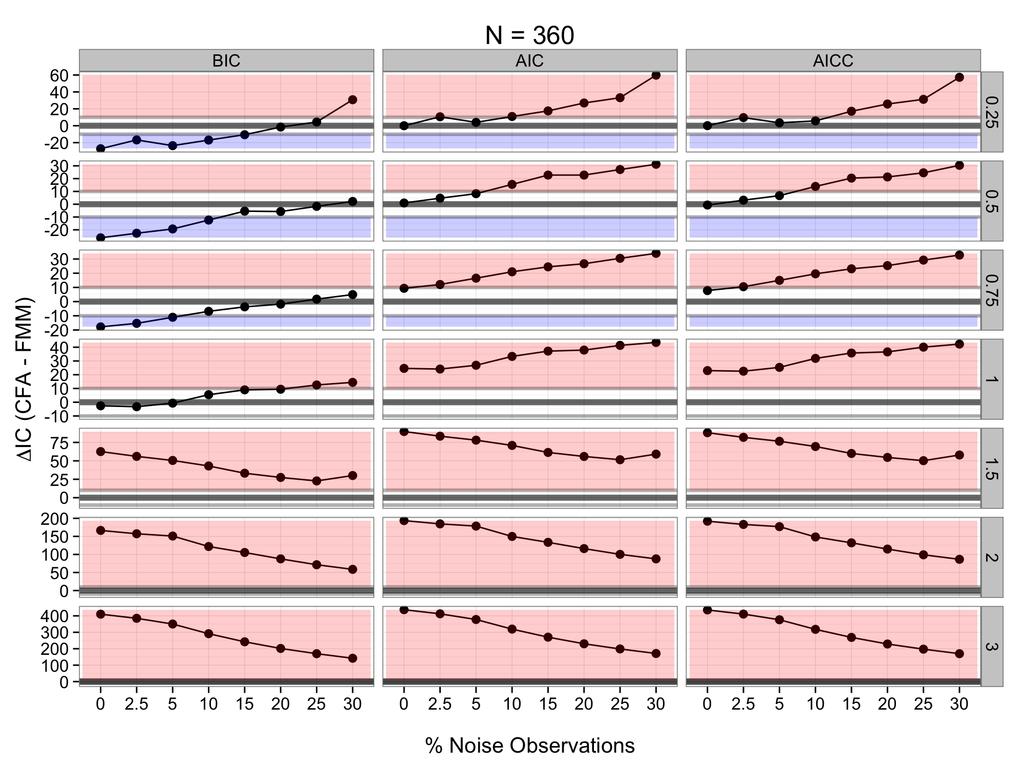
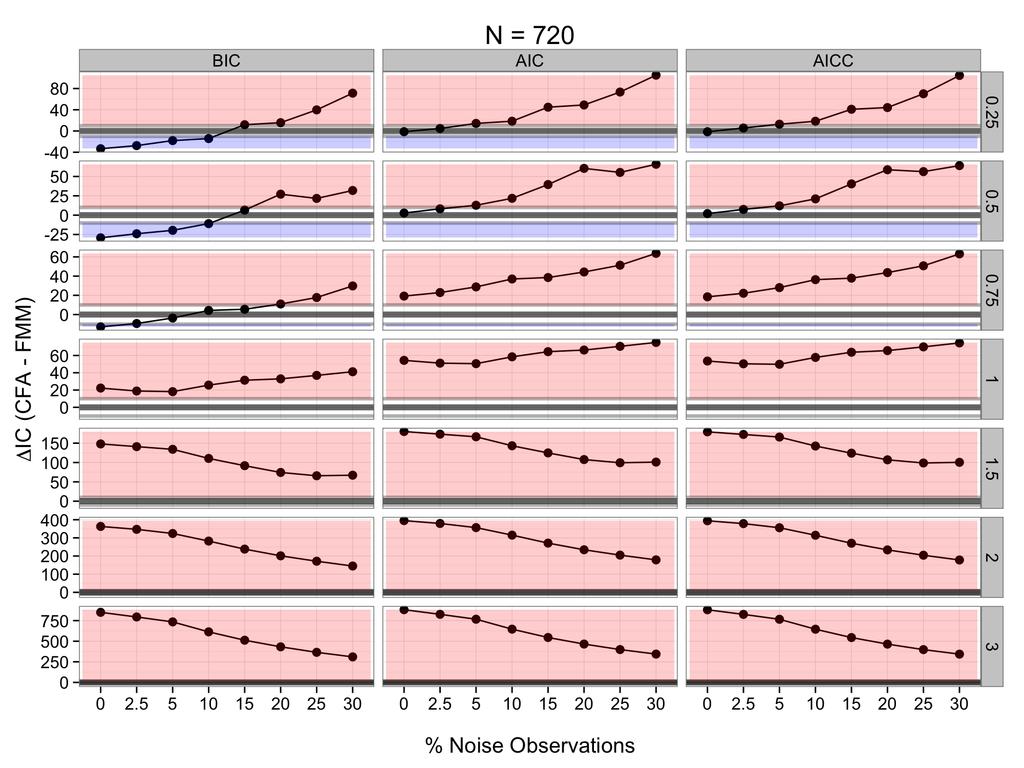
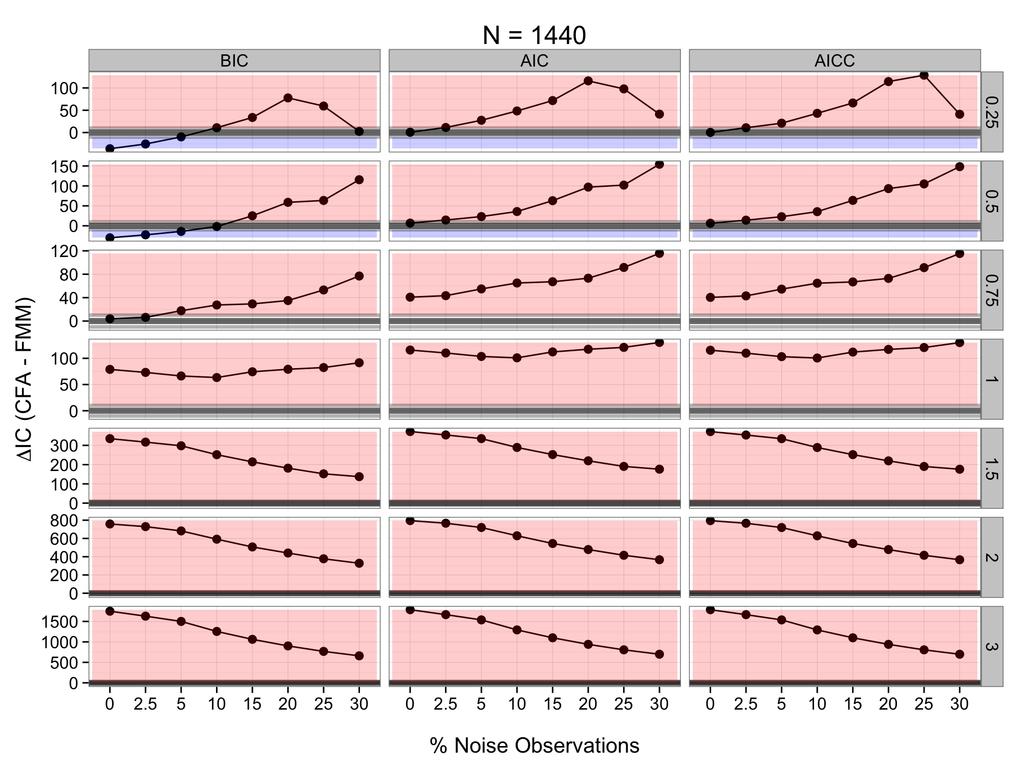
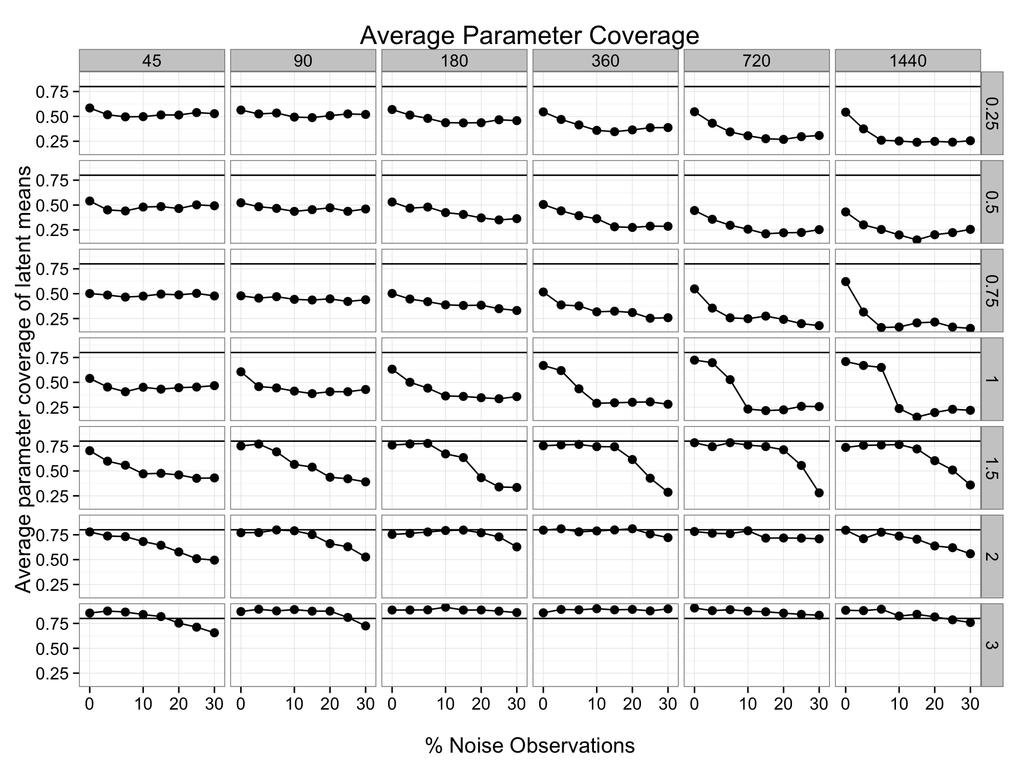
22 Discussion When indicators were separated by 1SD or less, scatter observations (esp. > 10%) seriously degraded latent structure. For models where indicators were well separated (2 3 SDs), parameter coverage for LPMs was relatively robust to scatter. Adding scatter to data separated by < 1SD shifted evidence toward categorical model. For indicators separated by > 1SD, adding scatter weakened evidence for categorical model. Greater latent separation was more important than sample size in determining coverage of latent means.


23 Discussion For moderate sample sizes (n = 360 or less) and low latent separation (0.75SD or less) BIC tends to select dimensional model, whereas AIC prefers categorical model regardless of scatter. AIC C fell in the middle, but has a steeper penalty than BIC at small sample sizes.
24 Future directions Exploring how scatter observations are clustered (normalized mutual information). New approaches to scatter: corruption of selected observations by adding random deviate. Testing clustering algorithms (e.g., k-clips; Maitral & Ramler, 2009) that identify scatter and remove these observations from substantive clusters. Testing performance of model selection criteria for dimensional data with scatter.
Russian Journal of Agricultural and Socio-Economic Sciences, 3(15)
") ON THE COMPARISON OF BAYESIAN INFORMATION CRITERION AND DRAPER S INFORMATION CRITERION IN SELECTION OF AN ASYMMETRIC PRICE RELATIONSHIP: BOOTSTRAP SIMULATION RESULTS Henry de-graft Acquah, Senior Lecturer
ON THE COMPARISON OF BAYESIAN INFORMATION CRITERION AND DRAPER S INFORMATION CRITERION IN SELECTION OF AN ASYMMETRIC PRICE RELATIONSHIP: BOOTSTRAP SIMULATION RESULTS Henry de-graft Acquah, Senior Lecturer
Small Sample Bayesian Factor Analysis. PhUSE 2014 Paper SP03 Dirk Heerwegh
 Small Sample Bayesian Factor Analysis PhUSE 2014 Paper SP03 Dirk Heerwegh Overview Factor analysis Maximum likelihood Bayes Simulation Studies Design Results Conclusions Factor Analysis (FA) Explain correlation
1 Introduction. st0020. The Stata Journal (2002) 2, Number 3, pp
 2, Number 3, pp") The Stata Journal (22) 2, Number 3, pp. 28 289 Comparative assessment of three common algorithms for estimating the variance of the area under the nonparametric receiver operating characteristic curve
The Stata Journal (22) 2, Number 3, pp. 28 289 Comparative assessment of three common algorithms for estimating the variance of the area under the nonparametric receiver operating characteristic curve
Impact of an equality constraint on the class-specific residual variances in regression mixtures: A Monte Carlo simulation study
 Behav Res (16) 8:813 86 DOI 1.3758/s138-15-618-8 Impact of an equality constraint on the class-specific residual variances in regression mixtures: A Monte Carlo simulation study Minjung Kim 1 & Andrea
Past Year Alcohol Consumption Patterns, Alcohol Problems and Alcohol-Related Diagnoses in the New Zealand Mental Health Survey
 Past Year Alcohol Consumption Patterns, Alcohol Problems and Alcohol-Related Diagnoses in the New Zealand Mental Health Survey Jessie Elisabeth Wells * and Magnus Andrew McGee Department of Population
Ecological Statistics
 A Primer of Ecological Statistics Second Edition Nicholas J. Gotelli University of Vermont Aaron M. Ellison Harvard Forest Sinauer Associates, Inc. Publishers Sunderland, Massachusetts U.S.A. Brief Contents
Speech recognition in noisy environments: A survey
 T-61.182 Robustness in Language and Speech Processing Speech recognition in noisy environments: A survey Yifan Gong presented by Tapani Raiko Feb 20, 2003 About the Paper Article published in Speech Communication
2.75: 84% 2.5: 80% 2.25: 78% 2: 74% 1.75: 70% 1.5: 66% 1.25: 64% 1.0: 60% 0.5: 50% 0.25: 25% 0: 0%
 Capstone Test (will consist of FOUR quizzes and the FINAL test grade will be an average of the four quizzes). Capstone #1: Review of Chapters 1-3 Capstone #2: Review of Chapter 4 Capstone #3: Review of
What can the Real World do for simulation studies? A comparison of exploratory methods
 Stella Bollmann, Moritz Heene, Helmut Küchenhoff, Markus Bühner What can the Real World do for simulation studies? A comparison of exploratory methods Technical Report Number 181, 2015 Department of Statistics
Alternative Methods for Assessing the Fit of Structural Equation Models in Developmental Research
 Alternative Methods for Assessing the Fit of Structural Equation Models in Developmental Research Michael T. Willoughby, B.S. & Patrick J. Curran, Ph.D. Duke University Abstract Structural Equation Modeling
Learning from data when all models are wrong
 Learning from data when all models are wrong Peter Grünwald CWI / Leiden Menu Two Pictures 1. Introduction 2. Learning when Models are Seriously Wrong Joint work with John Langford, Tim van Erven, Steven
Multivariate Multilevel Models
 Multivariate Multilevel Models Getachew A. Dagne George W. Howe C. Hendricks Brown Funded by NIMH/NIDA 11/20/2014 (ISSG Seminar) 1 Outline What is Behavioral Social Interaction? Importance of studying
Structure. Results: Evidence for Validity: Internal
 Results: Evidence for Validity: Internal Structure Majority of the respondent ability distributions are covered across their ranges by the item threshold locations. However, the threshold estimates fail
Unit 1 Exploring and Understanding Data
 Unit 1 Exploring and Understanding Data Area Principle Bar Chart Boxplot Conditional Distribution Dotplot Empirical Rule Five Number Summary Frequency Distribution Frequency Polygon Histogram Interquartile
Likelihood Ratio Based Computerized Classification Testing. Nathan A. Thompson. Assessment Systems Corporation & University of Cincinnati.
 Likelihood Ratio Based Computerized Classification Testing Nathan A. Thompson Assessment Systems Corporation & University of Cincinnati Shungwon Ro Kenexa Abstract An efficient method for making decisions
Bayesians methods in system identification: equivalences, differences, and misunderstandings
 Bayesians methods in system identification: equivalences, differences, and misunderstandings Johan Schoukens and Carl Edward Rasmussen ERNSI 217 Workshop on System Identification Lyon, September 24-27,
On the Targets of Latent Variable Model Estimation
 On the Targets of Latent Variable Model Estimation Karen Bandeen-Roche Department of Biostatistics Johns Hopkins University Department of Mathematics and Statistics Miami University December 8, 2005 With
WDHS Curriculum Map Probability and Statistics. What is Statistics and how does it relate to you?
 WDHS Curriculum Map Probability and Statistics Time Interval/ Unit 1: Introduction to Statistics 1.1-1.3 2 weeks S-IC-1: Understand statistics as a process for making inferences about population parameters
Score Tests of Normality in Bivariate Probit Models
 Score Tests of Normality in Bivariate Probit Models Anthony Murphy Nuffield College, Oxford OX1 1NF, UK Abstract: A relatively simple and convenient score test of normality in the bivariate probit model
Lec 02: Estimation & Hypothesis Testing in Animal Ecology
 Lec 02: Estimation & Hypothesis Testing in Animal Ecology Parameter Estimation from Samples Samples We typically observe systems incompletely, i.e., we sample according to a designed protocol. We then
Models and strategies for factor mixture analysis: Two examples concerning the structure underlying psychological disorders
 Running Head: MODELS AND STRATEGIES FOR FMA 1 Models and strategies for factor mixture analysis: Two examples concerning the structure underlying psychological disorders Shaunna L. Clark and Bengt Muthén
Hierarchical Bayesian Modeling of Individual Differences in Texture Discrimination
 Hierarchical Bayesian Modeling of Individual Differences in Texture Discrimination Timothy N. Rubin (trubin@uci.edu) Michael D. Lee (mdlee@uci.edu) Charles F. Chubb (cchubb@uci.edu) Department of Cognitive
Data Analysis Using Regression and Multilevel/Hierarchical Models
 Data Analysis Using Regression and Multilevel/Hierarchical Models ANDREW GELMAN Columbia University JENNIFER HILL Columbia University CAMBRIDGE UNIVERSITY PRESS Contents List of examples V a 9 e xv " Preface
Intelligent Systems. Discriminative Learning. Parts marked by * are optional. WS2013/2014 Carsten Rother, Dmitrij Schlesinger
 Intelligent Systems Discriminative Learning Parts marked by * are optional 30/12/2013 WS2013/2014 Carsten Rother, Dmitrij Schlesinger Discriminative models There exists a joint probability distribution
Technical Specifications
 Technical Specifications In order to provide summary information across a set of exercises, all tests must employ some form of scoring models. The most familiar of these scoring models is the one typically
Advanced Bayesian Models for the Social Sciences. TA: Elizabeth Menninga (University of North Carolina, Chapel Hill)
") Advanced Bayesian Models for the Social Sciences Instructors: Week 1&2: Skyler J. Cranmer Department of Political Science University of North Carolina, Chapel Hill skyler@unc.edu Week 3&4: Daniel Stegmueller
Advanced Bayesian Models for the Social Sciences Instructors: Week 1&2: Skyler J. Cranmer Department of Political Science University of North Carolina, Chapel Hill skyler@unc.edu Week 3&4: Daniel Stegmueller
For general queries, contact
 Much of the work in Bayesian econometrics has focused on showing the value of Bayesian methods for parametric models (see, for example, Geweke (2005), Koop (2003), Li and Tobias (2011), and Rossi, Allenby,
Estimating drug effects in the presence of placebo response: Causal inference using growth mixture modeling
 STATISTICS IN MEDICINE Statist. Med. 2009; 28:3363 3385 Published online 3 September 2009 in Wiley InterScience (www.interscience.wiley.com).3721 Estimating drug effects in the presence of placebo response:
Individual Differences in Attention During Category Learning
 Individual Differences in Attention During Category Learning Michael D. Lee (mdlee@uci.edu) Department of Cognitive Sciences, 35 Social Sciences Plaza A University of California, Irvine, CA 92697-5 USA
A Comparison of Several Goodness-of-Fit Statistics
 A Comparison of Several Goodness-of-Fit Statistics Robert L. McKinley The University of Toledo Craig N. Mills Educational Testing Service A study was conducted to evaluate four goodnessof-fit procedures
A Comparison of Pseudo-Bayesian and Joint Maximum Likelihood Procedures for Estimating Item Parameters in the Three-Parameter IRT Model
 A Comparison of Pseudo-Bayesian and Joint Maximum Likelihood Procedures for Estimating Item Parameters in the Three-Parameter IRT Model Gary Skaggs Fairfax County, Virginia Public Schools José Stevenson
Testing Hypotheses Regarding the Causes of Comorbidity: Examining the Underlying Deficits of Comorbid Disorders
 Journal of Abnormal Psychology Copyright 2005 by the American Psychological Association 2005, Vol. 114, No. 3, 346 362 0021-843X/05/$12.00 DOI: 10.1037/0021-843X.114.3.346 Testing Hypotheses Regarding
MEA DISCUSSION PAPERS
 Inference Problems under a Special Form of Heteroskedasticity Helmut Farbmacher, Heinrich Kögel 03-2015 MEA DISCUSSION PAPERS mea Amalienstr. 33_D-80799 Munich_Phone+49 89 38602-355_Fax +49 89 38602-390_www.mea.mpisoc.mpg.de
Selection of Linking Items
 Selection of Linking Items Subset of items that maximally reflect the scale information function Denote the scale information as Linear programming solver (in R, lp_solve 5.5) min(y) Subject to θ, θs,
Technical Appendix: Methods and Results of Growth Mixture Modelling
 s1 Technical Appendix: Methods and Results of Growth Mixture Modelling (Supplement to: Trajectories of change in depression severity during treatment with antidepressants) Rudolf Uher, Bengt Muthén, Daniel
Running head: NESTED FACTOR ANALYTIC MODEL COMPARISON 1. John M. Clark III. Pearson. Author Note
 Running head: NESTED FACTOR ANALYTIC MODEL COMPARISON 1 Nested Factor Analytic Model Comparison as a Means to Detect Aberrant Response Patterns John M. Clark III Pearson Author Note John M. Clark III,
STATISTICAL INFERENCE PROCEDURE BY THE INFORMATION-BASED TEST AND ITS APPLICATION IN MARINE CLIMATOLOGY
 - 1973 - STATISTICAL INFERENCE PROCEDURE BY THE INFORMATION-BASED TEST AND ITS APPLICATION IN MARINE CLIMATOLOGY SEZER, A. ASMA, S. OZDEMIR, O.* Department of Statistics, Faculty of Science, Anadolu University,
UNIVERSITY of PENNSYLVANIA CIS 520: Machine Learning Final, Fall 2014
 UNIVERSITY of PENNSYLVANIA CIS 520: Machine Learning Final, Fall 2014 Exam policy: This exam allows two one-page, two-sided cheat sheets (i.e. 4 sides); No other materials. Time: 2 hours. Be sure to write
PCA Enhanced Kalman Filter for ECG Denoising
 IOSR Journal of Electronics & Communication Engineering (IOSR-JECE) ISSN(e) : 2278-1684 ISSN(p) : 2320-334X, PP 06-13 www.iosrjournals.org PCA Enhanced Kalman Filter for ECG Denoising Febina Ikbal 1, Prof.M.Mathurakani
Multivariate meta-analysis for non-linear and other multi-parameter associations
 Research Article Received 9 August 2011, Accepted 11 May 2012 Published online 16 July 2012 in Wiley Online Library (wileyonlinelibrary.com) DOI: 10.1002/sim.5471 Multivariate meta-analysis for non-linear
A NOVEL VARIABLE SELECTION METHOD BASED ON FREQUENT PATTERN TREE FOR REAL-TIME TRAFFIC ACCIDENT RISK PREDICTION
 OPT-i An International Conference on Engineering and Applied Sciences Optimization M. Papadrakakis, M.G. Karlaftis, N.D. Lagaros (eds.) Kos Island, Greece, 4-6 June 2014 A NOVEL VARIABLE SELECTION METHOD
Manifestation Of Differences In Item-Level Characteristics In Scale-Level Measurement Invariance Tests Of Multi-Group Confirmatory Factor Analyses
 Journal of Modern Applied Statistical Methods Copyright 2005 JMASM, Inc. May, 2005, Vol. 4, No.1, 275-282 1538 9472/05/$95.00 Manifestation Of Differences In Item-Level Characteristics In Scale-Level Measurement
Advances In Measurement Modeling: Bringing Genetic Information Into Preventive Interventions And Getting The Phenotype Right
 Advances In Measurement Modeling: Bringing Genetic Information Into Preventive Interventions And Getting The Phenotype Right Bengt Muthen, UCLA bmuthen@ucla.edu 1 Modeling The Influence On A Person s Behavior
Chapter 1. Introduction
 Chapter 1 Introduction 1.1 Motivation and Goals The increasing availability and decreasing cost of high-throughput (HT) technologies coupled with the availability of computational tools and data form a
Ordinal Data Modeling
 Valen E. Johnson James H. Albert Ordinal Data Modeling With 73 illustrations I ". Springer Contents Preface v 1 Review of Classical and Bayesian Inference 1 1.1 Learning about a binomial proportion 1 1.1.1
Statistics and Probability
 Statistics and a single count or measurement variable. S.ID.1: Represent data with plots on the real number line (dot plots, histograms, and box plots). S.ID.2: Use statistics appropriate to the shape
Reveal Relationships in Categorical Data
 SPSS Categories 15.0 Specifications Reveal Relationships in Categorical Data Unleash the full potential of your data through perceptual mapping, optimal scaling, preference scaling, and dimension reduction
How many speakers? How many tokens?:
 1 NWAV 38- Ottawa, Canada 23/10/09 How many speakers? How many tokens?: A methodological contribution to the study of variation. Jorge Aguilar-Sánchez University of Wisconsin-La Crosse 2 Sample size in
MODELLING CHARACTER LEGIBILITY
 Watson, A. B. & Fitzhugh, A. E. (989). Modelling character legibility. Society for Information Display Digest of Technical Papers 2, 36-363. MODELLING CHARACTER LEGIBILITY Andrew B. Watson NASA Ames Research
16:35 17:20 Alexander Luedtke (Fred Hutchinson Cancer Research Center)
") Conference on Causal Inference in Longitudinal Studies September 21-23, 2017 Columbia University Thursday, September 21, 2017: tutorial 14:15 15:00 Miguel Hernan (Harvard University) 15:00 15:45 Miguel
Conference on Causal Inference in Longitudinal Studies September 21-23, 2017 Columbia University Thursday, September 21, 2017: tutorial 14:15 15:00 Miguel Hernan (Harvard University) 15:00 15:45 Miguel
PLEASE SCROLL DOWN FOR ARTICLE. Full terms and conditions of use:
 This article was downloaded by: [CDL Journals Account] On: 26 November 2009 Access details: Access Details: [subscription number 794379768] Publisher Psychology Press Informa Ltd Registered in England
An Ideal Observer Model of Visual Short-Term Memory Predicts Human Capacity Precision Tradeoffs
 An Ideal Observer Model of Visual Short-Term Memory Predicts Human Capacity Precision Tradeoffs Chris R. Sims Robert A. Jacobs David C. Knill (csims@cvs.rochester.edu) (robbie@bcs.rochester.edu) (knill@cvs.rochester.edu)
Selection and Combination of Markers for Prediction
 Selection and Combination of Markers for Prediction NACC Data and Methods Meeting September, 2010 Baojiang Chen, PhD Sarah Monsell, MS Xiao-Hua Andrew Zhou, PhD Overview 1. Research motivation 2. Describe
Empowered by Psychometrics The Fundamentals of Psychometrics. Jim Wollack University of Wisconsin Madison
 Empowered by Psychometrics The Fundamentals of Psychometrics Jim Wollack University of Wisconsin Madison Psycho-what? Psychometrics is the field of study concerned with the measurement of mental and psychological
Advanced Bayesian Models for the Social Sciences
 Advanced Bayesian Models for the Social Sciences Jeff Harden Department of Political Science, University of Colorado Boulder jeffrey.harden@colorado.edu Daniel Stegmueller Department of Government, University
Is There a General Factor of Prevalent Psychopathology During Adulthood?
 Journal of Abnormal Psychology 2012 American Psychological Association 2012, Vol. 121, No. 4, 971 977 0021-843X/12/$12.00 DOI: 10.1037/a0028355 BRIEF REPORT Is There a General Factor of Prevalent Psychopathology
A COMPARISON OF IMPUTATION METHODS FOR MISSING DATA IN A MULTI-CENTER RANDOMIZED CLINICAL TRIAL: THE IMPACT STUDY
 A COMPARISON OF IMPUTATION METHODS FOR MISSING DATA IN A MULTI-CENTER RANDOMIZED CLINICAL TRIAL: THE IMPACT STUDY Lingqi Tang 1, Thomas R. Belin 2, and Juwon Song 2 1 Center for Health Services Research,
Measurement Models for Behavioral Frequencies: A Comparison Between Numerically and Vaguely Quantified Reports. September 2012 WORKING PAPER 10
 WORKING PAPER 10 BY JAMIE LYNN MARINCIC Measurement Models for Behavioral Frequencies: A Comparison Between Numerically and Vaguely Quantified Reports September 2012 Abstract Surveys collecting behavioral
A Bayesian Nonparametric Model Fit statistic of Item Response Models
 A Bayesian Nonparametric Model Fit statistic of Item Response Models Purpose As more and more states move to use the computer adaptive test for their assessments, item response theory (IRT) has been widely
Mathematisches Forschungsinstitut Oberwolfach. Statistische und Probabilistische Methoden der Modellwahl
 Mathematisches Forschungsinstitut Oberwolfach Report No. 47/2005 Statistische und Probabilistische Methoden der Modellwahl Organised by James O. Berger (Durham) Holger Dette (Bochum) Gabor Lugosi (Barcelona)
Self-Oriented and Socially Prescribed Perfectionism in the Eating Disorder Inventory Perfectionism Subscale
 Self-Oriented and Socially Prescribed Perfectionism in the Eating Disorder Inventory Perfectionism Subscale Simon B. Sherry, 1 Paul L. Hewitt, 1 * Avi Besser, 2 Brandy J. McGee, 1 and Gordon L. Flett 3
LEDYARD R TUCKER AND CHARLES LEWIS
 PSYCHOMETRIKA--VOL. ~ NO. 1 MARCH, 1973 A RELIABILITY COEFFICIENT FOR MAXIMUM LIKELIHOOD FACTOR ANALYSIS* LEDYARD R TUCKER AND CHARLES LEWIS UNIVERSITY OF ILLINOIS Maximum likelihood factor analysis provides
Discriminant Analysis with Categorical Data
 - AW)a Discriminant Analysis with Categorical Data John E. Overall and J. Arthur Woodward The University of Texas Medical Branch, Galveston A method for studying relationships among groups in terms of
Bayesian Logistic Regression Modelling via Markov Chain Monte Carlo Algorithm
 Journal of Social and Development Sciences Vol. 4, No. 4, pp. 93-97, Apr 203 (ISSN 222-52) Bayesian Logistic Regression Modelling via Markov Chain Monte Carlo Algorithm Henry De-Graft Acquah University
Assessment of a disease screener by hierarchical all-subset selection using area under the receiver operating characteristic curves
 Research Article Received 8 June 2010, Accepted 15 February 2011 Published online 15 April 2011 in Wiley Online Library (wileyonlinelibrary.com) DOI: 10.1002/sim.4246 Assessment of a disease screener by
KRISTIAN ERIC MARKON. Phone: (319)
") KRISTIAN ERIC MARKON Department of Psychological and Brain Sciences University of Iowa 302 Stuit Hall Iowa City, IA 52242 Phone: (319) 335-2809 Email: kristian-markon@uiowa.edu EDUCATIONAL AND PROFESSIONAL
KRISTIAN ERIC MARKON Department of Psychological and Brain Sciences University of Iowa 302 Stuit Hall Iowa City, IA 52242 Phone: (319) 335-2809 Email: kristian-markon@uiowa.edu EDUCATIONAL AND PROFESSIONAL
Online Appendix. According to a recent survey, most economists expect the economic downturn in the United
 Online Appendix Part I: Text of Experimental Manipulations and Other Survey Items a. Macroeconomic Anxiety Prime According to a recent survey, most economists expect the economic downturn in the United
Hanne Søberg Finbråten 1,2*, Bodil Wilde-Larsson 2,3, Gun Nordström 3, Kjell Sverre Pettersen 4, Anne Trollvik 3 and Øystein Guttersrud 5
 Finbråten et al. BMC Health Services Research (2018) 18:506 https://doi.org/10.1186/s12913-018-3275-7 RESEARCH ARTICLE Open Access Establishing the HLS-Q12 short version of the European Health Literacy
Different styles of modeling
 Different styles of modeling Marieke Timmerman m.e.timmerman@rug.nl 19 February 2015 Different styles of modeling (19/02/2015) What is psychometrics? 1/40 Overview 1 Breiman (2001). Statistical modeling:
Statistics 202: Data Mining. c Jonathan Taylor. Final review Based in part on slides from textbook, slides of Susan Holmes.
 Final review Based in part on slides from textbook, slides of Susan Holmes December 5, 2012 1 / 1 Final review Overview Before Midterm General goals of data mining. Datatypes. Preprocessing & dimension
Basic concepts and principles of classical test theory
 Basic concepts and principles of classical test theory Jan-Eric Gustafsson What is measurement? Assignment of numbers to aspects of individuals according to some rule. The aspect which is measured must
You must answer question 1.
 Research Methods and Statistics Specialty Area Exam October 28, 2015 Part I: Statistics Committee: Richard Williams (Chair), Elizabeth McClintock, Sarah Mustillo You must answer question 1. 1. Suppose
The Influence of Test Characteristics on the Detection of Aberrant Response Patterns
 The Influence of Test Characteristics on the Detection of Aberrant Response Patterns Steven P. Reise University of California, Riverside Allan M. Due University of Minnesota Statistical methods to assess
Problem 1) Match the terms to their definitions. Every term is used exactly once. (In the real midterm, there are fewer terms).
 Match the terms to their definitions. Every term is used exactly once. (In the real midterm, there are fewer terms).") Problem 1) Match the terms to their definitions. Every term is used exactly once. (In the real midterm, there are fewer terms). 1. Bayesian Information Criterion 2. Cross-Validation 3. Robust 4. Imputation
Problem 1) Match the terms to their definitions. Every term is used exactly once. (In the real midterm, there are fewer terms). 1. Bayesian Information Criterion 2. Cross-Validation 3. Robust 4. Imputation
A Memory Model for Decision Processes in Pigeons
 From M. L. Commons, R.J. Herrnstein, & A.R. Wagner (Eds.). 1983. Quantitative Analyses of Behavior: Discrimination Processes. Cambridge, MA: Ballinger (Vol. IV, Chapter 1, pages 3-19). A Memory Model for
Running head: STATISTICAL AND SUBSTANTIVE CHECKING
 Statistical and Substantive 1 Running head: STATISTICAL AND SUBSTANTIVE CHECKING Statistical and Substantive Checking in Growth Mixture Modeling Bengt Muthén University of California, Los Angeles Statistical
1999 Wiley-Liss, Inc. Cytometry 36:60 70 (1999)
") 1999 Wiley-Liss, Inc. Cytometry 36:60 70 (1999) Some Theoretical and Practical Considerations for Multivariate Statistical Cell Classification Useful in Autologous Stem Cell Transplantation and Tumor Cell
1999 Wiley-Liss, Inc. Cytometry 36:60 70 (1999) Some Theoretical and Practical Considerations for Multivariate Statistical Cell Classification Useful in Autologous Stem Cell Transplantation and Tumor Cell
Multilevel Latent Class Analysis: an application to repeated transitive reasoning tasks
 Multilevel Latent Class Analysis: an application to repeated transitive reasoning tasks Multilevel Latent Class Analysis: an application to repeated transitive reasoning tasks MLLC Analysis: an application
On the Performance of Maximum Likelihood Versus Means and Variance Adjusted Weighted Least Squares Estimation in CFA
 STRUCTURAL EQUATION MODELING, 13(2), 186 203 Copyright 2006, Lawrence Erlbaum Associates, Inc. On the Performance of Maximum Likelihood Versus Means and Variance Adjusted Weighted Least Squares Estimation
Neural Noise and Movement-Related Codes in the Macaque Supplementary Motor Area
 7630 The Journal of Neuroscience, August 20, 2003 23(20):7630 7641 Behavioral/Systems/Cognitive Neural Noise and Movement-Related Codes in the Macaque Supplementary Motor Area Bruno B. Averbeck and Daeyeol
HIV risk associated with injection drug use in Houston, Texas 2009: A Latent Class Analysis
 HIV risk associated with injection drug use in Houston, Texas 2009: A Latent Class Analysis Syed WB Noor Michael Ross Dejian Lai Jan Risser UTSPH, Houston Texas Presenter Disclosures Syed WB Noor No relationships
The Statistical Analysis of Failure Time Data
 The Statistical Analysis of Failure Time Data Second Edition JOHN D. KALBFLEISCH ROSS L. PRENTICE iwiley- 'INTERSCIENCE A JOHN WILEY & SONS, INC., PUBLICATION Contents Preface xi 1. Introduction 1 1.1
Graphical assessment of internal and external calibration of logistic regression models by using loess smoothers
 Tutorial in Biostatistics Received 21 November 2012, Accepted 17 July 2013 Published online 23 August 2013 in Wiley Online Library (wileyonlinelibrary.com) DOI: 10.1002/sim.5941 Graphical assessment of
Introduction to Multilevel Models for Longitudinal and Repeated Measures Data
 Introduction to Multilevel Models for Longitudinal and Repeated Measures Data Today s Class: Features of longitudinal data Features of longitudinal models What can MLM do for you? What to expect in this
Modeling unobserved heterogeneity in Stata
 Modeling unobserved heterogeneity in Stata Rafal Raciborski StataCorp LLC November 27, 2017 Rafal Raciborski (StataCorp) Modeling unobserved heterogeneity November 27, 2017 1 / 59 Plan of the talk Concepts
2014 Modern Modeling Methods (M 3 ) Conference, UCONN
 Conference, UCONN") 2014 Modern Modeling (M 3 ) Conference, UCONN Comparative study of two calibration methods for micro-simulation models Department of Biostatistics Center for Statistical Sciences Brown University School
2014 Modern Modeling (M 3 ) Conference, UCONN Comparative study of two calibration methods for micro-simulation models Department of Biostatistics Center for Statistical Sciences Brown University School
Non-parametric methods for linkage analysis
 BIOSTT516 Statistical Methods in Genetic Epidemiology utumn 005 Non-parametric methods for linkage analysis To this point, we have discussed model-based linkage analyses. These require one to specify a
accuracy (see, e.g., Mislevy & Stocking, 1989; Qualls & Ansley, 1985; Yen, 1987). A general finding of this research is that MML and Bayesian
. A general finding of this research is that MML and Bayesian") Recovery of Marginal Maximum Likelihood Estimates in the Two-Parameter Logistic Response Model: An Evaluation of MULTILOG Clement A. Stone University of Pittsburgh Marginal maximum likelihood (MML) estimation
Recovery of Marginal Maximum Likelihood Estimates in the Two-Parameter Logistic Response Model: An Evaluation of MULTILOG Clement A. Stone University of Pittsburgh Marginal maximum likelihood (MML) estimation
General recognition theory of categorization: A MATLAB toolbox
 ehavior Research Methods 26, 38 (4), 579-583 General recognition theory of categorization: MTL toolbox LEOL. LFONSO-REESE San Diego State University, San Diego, California General recognition theory (GRT)
A BAYESIAN SOLUTION FOR THE LAW OF CATEGORICAL JUDGMENT WITH CATEGORY BOUNDARY VARIABILITY AND EXAMINATION OF ROBUSTNESS TO MODEL VIOLATIONS
 A BAYESIAN SOLUTION FOR THE LAW OF CATEGORICAL JUDGMENT WITH CATEGORY BOUNDARY VARIABILITY AND EXAMINATION OF ROBUSTNESS TO MODEL VIOLATIONS A Thesis Presented to The Academic Faculty by David R. King
George B. Ploubidis. The role of sensitivity analysis in the estimation of causal pathways from observational data. Improving health worldwide
 George B. Ploubidis The role of sensitivity analysis in the estimation of causal pathways from observational data Improving health worldwide www.lshtm.ac.uk Outline Sensitivity analysis Causal Mediation
Mediation Analysis With Principal Stratification
 University of Pennsylvania ScholarlyCommons Statistics Papers Wharton Faculty Research 3-30-009 Mediation Analysis With Principal Stratification Robert Gallop Dylan S. Small University of Pennsylvania
Package mdsdt. March 12, 2016
 Version 1.2 Date 2016-03-11 Package mdsdt March 12, 2016 Title Functions for Analysis of Data with General Recognition Theory Author Robert X.D. Hawkins , Joe Houpt ,
How few countries will do? Comparative survey analysis from a Bayesian perspective
 Survey Research Methods (2012) Vol.6, No.2, pp. 87-93 ISSN 1864-3361 http://www.surveymethods.org European Survey Research Association How few countries will do? Comparative survey analysis from a Bayesian
Supplementary Materials. Instructions for Target Subjects (Taken from, and kindly shared by, Haselton & Gildersleeve, 2011).
.") Supplementary Materials Instructions for Target Subjects (Taken from, and kindly shared by, Haselton & Gildersleeve, 2011). Participant ID: Scent Samples Task Instructions Next Lab Session - Date: Time:
Supplementary Materials Instructions for Target Subjects (Taken from, and kindly shared by, Haselton & Gildersleeve, 2011). Participant ID: Scent Samples Task Instructions Next Lab Session - Date: Time:
JRC Community of Practice Meeting Panel VI: Ageing societies & Migration
 Building a Protection Vulnerability Formula JRC Community of Practice Meeting Panel VI: Ageing societies & Migration 11,157 in 468 in 128 Staff members Locations Countries Advocacy Asylum and migration
Accuracy of Range Restriction Correction with Multiple Imputation in Small and Moderate Samples: A Simulation Study
 A peer-reviewed electronic journal. Copyright is retained by the first or sole author, who grants right of first publication to Practical Assessment, Research & Evaluation. Permission is granted to distribute
UNIVERSITY of PENNSYLVANIA CIS 520: Machine Learning Midterm, 2016
 UNIVERSITY of PENNSYLVANIA CIS 520: Machine Learning Midterm, 2016 Exam policy: This exam allows one one-page, two-sided cheat sheet; No other materials. Time: 80 minutes. Be sure to write your name and
Bayesian Tolerance Intervals for Sparse Data Margin Assessment
 Bayesian Tolerance Intervals for Sparse Data Margin Assessment Benjamin Schroeder and Lauren Hund ASME V&V Symposium May 3, 2017 - Las Vegas, NV SAND2017-4590 C - (UUR) Sandia National Laboratories is