Ward Headstrom Institutional Research Humboldt State University CAIR
|
|
|
- Philippa Bradford
- 6 years ago
- Views:
Transcription
1 Using a Random Forest model to predict enrollment Ward Headstrom Institutional Research Humboldt State University CAIR
2 Overview Forecasting enrollment to assist University planning The R language The Random Forest model Binary Logistic Regression model Cautions and Conclusions The example I am going to use is projecting New enrollment. These techniques can easily be applied to predicting Retention Graduation Other future events 2
 enhance by breaking it down into subgroups 3) possibly use linear regressions (trends) 4) enhance")
3 Simple enrollment projections 1) how many student enrolled last year? 2) enhance by breaking it down into subgroups 3) possibly use linear regressions (trends) 4) enhance further by looking at to-date information 3

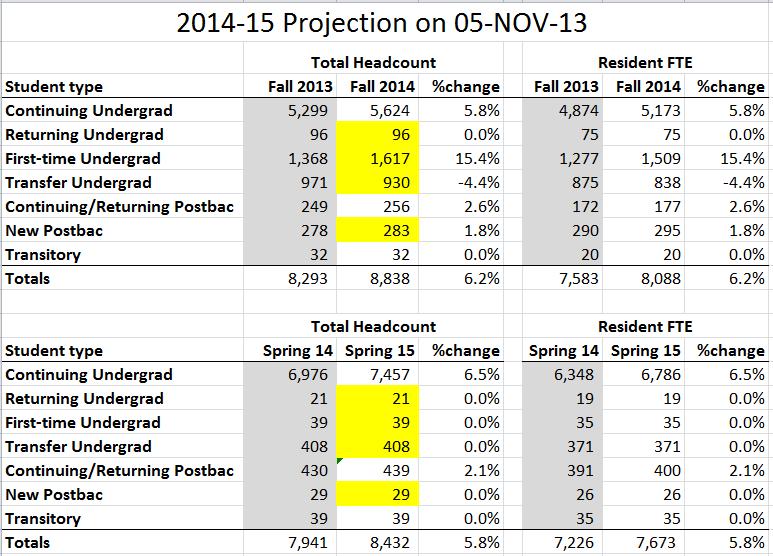
4 2014 projection = 2013 to-date yield * 2014 apps = 1,369/3,692*4,361 = 1,617 4
5 5
6 But what about Why applicant yield might not be the best predictor: Admits more likely to enroll Confirms more likely to enroll Denied or withdrawn will not enroll Housing deposits may be good indicator of intent Local applicants more likely than distant applicants Certain majors or ethnicities may be more likely to enroll Do this year s applicants look like last year s? Ideally, we would like to use all the data we have about applicants to predict how likely they are to enroll. Variables: demographics, academics, actions to-date Model 1: Random Forest Model 2: Binary logistic regression 6
7 The language R CAIR comment: an emphasis on R would be limiting to institutions that used other software. The first (only?) implementation of Random Forest models R is open source free to use Many online tutorials:
8 R and RStudio overview Function-based: function(data,options) Case-specific language 4 panes help, history, import dataset, packages Object types: data.frame, vector, scalars, factor, models Useful commands: command line console can be used as calculator assignment -> or <- functions: na.omit(), summary(), table(), tolower() subsets: dataframe[row select, column select] graphics: hist(), plot() library(), especially library(randomforest) 8
9 RStudio 9
10 Data files All the data fields you think might help predict yields Major discipline Region of origin Sex Ethnicity Academic preparation Actions to-date Accepted SUG Confirmed intent to enroll Paid housing deposit Institutional actions Admit Deny/cancel 10
11 Import data into R 11
12 Decision Trees 12
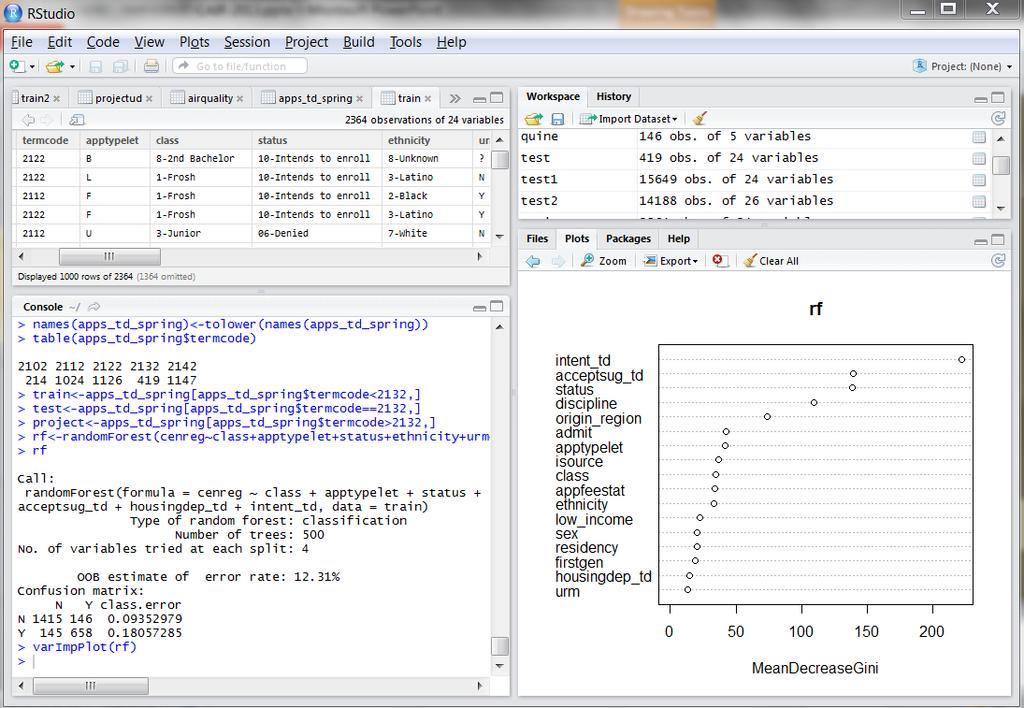
13 Random Forest Model Developed by Leo Brieman and Adele Cutler Plan: grow a random forest of 500 decision trees randomforest(cenreg~variable1+variable2+,data=train) Randomly picks fields for each tree Randomly selects rows to exclude from each tree Measure of variable importance Out Of Box estimate of error rate and Confusion matrix Run new data through all 500 trees and let them vote 13

14 Random Forest model of applicant yield 14
15 varimpplot(rf) 15
16 1 st tree in Random Forest For categorical predictors, the splitting point is represented by an integer, whose binary expansion gives the identities of the categories that goes to left or right. For example, if a predictor has four categories, and the split point is 13. The binary expansion of 13 is (1, 0, 1, 1) (because 13 = 1*2^0 + 0*2^1 + 1*2^2 + 1*2^3), so cases with categories 1, 3, or 4 in this predictor get sent to the left, and the rest to the right. 16
17 Testing and making a Projection f Random Forest projects that 42% of current Spring apps will enroll, compared to 45% of last year s apps to-date and 34% of training years. 17
18 Binary Logistic Regression p(x) is the probability that x will occur, where x is a binary object (Y/N, 1/0, true/false) log p(x) 1 p(x) = B 0 + B 1 X 1 + B 2 X 2 + B 3 X 3 + B n represents calculated coefficients X n represents the value of dependent variables Break up factor variables into many terms where X n is 1 or 0 Can manipulate the result to return the probability (between 0 and 1) that x will occur, given the state of a particular set of dependent variables. Difficult to predict outcome of a single individual Can sum probabilities to estimate total 18
19 Binary logistic regression model of applicant yield 19
20 20
21 21
22 BLR model testing and projecting Binary Logistic Regression predicted 324 of current Spring applicants will enroll, compared to 340 projected by Random Forest model. 22
23 Cautions and Conclusions Null or new values in variables will cause problems Beware of to-date variables (e.g. intent_td). Make sure that procedures have not changed in a way that will affect behavior. R is a very powerful tool which can be very useful if you are willing to invest some time learning it. Multivariate models may improve the accuracy of your predictions. Corroborate with simple models and consultation with involved staff. 23
24 Questions? Comments? This presentation: My 24
Intro to SPSS. Using SPSS through WebFAS
 Intro to SPSS Using SPSS through WebFAS http://www.yorku.ca/computing/students/labs/webfas/ Try it early (make sure it works from your computer) If you need help contact UIT Client Services Voice: 416-736-5800
Hour 2: lm (regression), plot (scatterplots), cooks.distance and resid (diagnostics) Stat 302, Winter 2016 SFU, Week 3, Hour 1, Page 1
, plot (scatterplots), cooks.distance and resid (diagnostics) Stat 302, Winter 2016 SFU, Week 3, Hour 1, Page 1") Agenda for Week 3, Hr 1 (Tuesday, Jan 19) Hour 1: - Installing R and inputting data. - Different tools for R: Notepad++ and RStudio. - Basic commands:?,??, mean(), sd(), t.test(), lm(), plot() - t.test()
Agenda for Week 3, Hr 1 (Tuesday, Jan 19) Hour 1: - Installing R and inputting data. - Different tools for R: Notepad++ and RStudio. - Basic commands:?,??, mean(), sd(), t.test(), lm(), plot() - t.test()
MULTIPLE LINEAR REGRESSION 24.1 INTRODUCTION AND OBJECTIVES OBJECTIVES
 24 MULTIPLE LINEAR REGRESSION 24.1 INTRODUCTION AND OBJECTIVES In the previous chapter, simple linear regression was used when you have one independent variable and one dependent variable. This chapter
Predicting Breast Cancer Survival Using Treatment and Patient Factors
 Predicting Breast Cancer Survival Using Treatment and Patient Factors William Chen wchen808@stanford.edu Henry Wang hwang9@stanford.edu 1. Introduction Breast cancer is the leading type of cancer in women
Analysis of Rheumatoid Arthritis Data using Logistic Regression and Penalized Approach
 University of South Florida Scholar Commons Graduate Theses and Dissertations Graduate School November 2015 Analysis of Rheumatoid Arthritis Data using Logistic Regression and Penalized Approach Wei Chen
CRITERIA FOR USE. A GRAPHICAL EXPLANATION OF BI-VARIATE (2 VARIABLE) REGRESSION ANALYSISSys
 REGRESSION ANALYSISSys") Multiple Regression Analysis 1 CRITERIA FOR USE Multiple regression analysis is used to test the effects of n independent (predictor) variables on a single dependent (criterion) variable. Regression tests
Multiple Regression Analysis 1 CRITERIA FOR USE Multiple regression analysis is used to test the effects of n independent (predictor) variables on a single dependent (criterion) variable. Regression tests
Nature Neuroscience: doi: /nn Supplementary Figure 1. Behavioral training.
 Supplementary Figure 1 Behavioral training. a, Mazes used for behavioral training. Asterisks indicate reward location. Only some example mazes are shown (for example, right choice and not left choice maze
Weight Adjustment Methods using Multilevel Propensity Models and Random Forests
 Weight Adjustment Methods using Multilevel Propensity Models and Random Forests Ronaldo Iachan 1, Maria Prosviryakova 1, Kurt Peters 2, Lauren Restivo 1 1 ICF International, 530 Gaither Road Suite 500,
BIOL 458 BIOMETRY Lab 7 Multi-Factor ANOVA
 BIOL 458 BIOMETRY Lab 7 Multi-Factor ANOVA PART 1: Introduction to Factorial ANOVA ingle factor or One - Way Analysis of Variance can be used to test the null hypothesis that k or more treatment or group
STATISTICS IN CLINICAL AND TRANSLATIONAL RESEARCH
 09/07/11 1 Overview and Descriptive Statistics a. Application of statistics in biomedical research b. Type of data c. Graphic representation of data d. Summary statistics: central tendency and dispersion
bivariate analysis: The statistical analysis of the relationship between two variables.
 bivariate analysis: The statistical analysis of the relationship between two variables. cell frequency: The number of cases in a cell of a cross-tabulation (contingency table). chi-square (χ 2 ) test for
Review: Logistic regression, Gaussian naïve Bayes, linear regression, and their connections
 Review: Logistic regression, Gaussian naïve Bayes, linear regression, and their connections New: Bias-variance decomposition, biasvariance tradeoff, overfitting, regularization, and feature selection Yi
THE STATSWHISPERER. Introduction to this Issue. Doing Your Data Analysis INSIDE THIS ISSUE
 Spring 20 11, Volume 1, Issue 1 THE STATSWHISPERER The StatsWhisperer Newsletter is published by staff at StatsWhisperer. Visit us at: www.statswhisperer.com Introduction to this Issue The current issue
SubLasso:a feature selection and classification R package with a. fixed feature subset
 SubLasso:a feature selection and classification R package with a fixed feature subset Youxi Luo,3,*, Qinghan Meng,2,*, Ruiquan Ge,2, Guoqin Mai, Jikui Liu, Fengfeng Zhou,#. Shenzhen Institutes of Advanced
CLASSIFICATION TREE ANALYSIS:
 CLASSIFICATION TREE ANALYSIS: A USEFUL STATISTICAL TOOL FOR PROGRAM EVALUATORS Meredith L. Philyaw, MS Jennifer Lyons, MSW(c) Why This Session? Stand up if you... Consider yourself to be a data analyst,
Simple Linear Regression One Categorical Independent Variable with Several Categories
 Simple Linear Regression One Categorical Independent Variable with Several Categories Does ethnicity influence total GCSE score? We ve learned that variables with just two categories are called binary
Propensity Score Analysis: Its rationale & potential for applied social/behavioral research. Bob Pruzek University at Albany
 Propensity Score Analysis: Its rationale & potential for applied social/behavioral research Bob Pruzek University at Albany Aims: First, to introduce key ideas that underpin propensity score (PS) methodology
Part [2.1]: Evaluation of Markers for Treatment Selection Linking Clinical and Statistical Goals
![Part [2.1]: Evaluation of Markers for Treatment Selection Linking Clinical and Statistical Goals](/thumbs/94/121286452.jpg "Part [2.1]: Evaluation of Markers for Treatment Selection Linking Clinical and Statistical Goals") Part [2.1]: Evaluation of Markers for Treatment Selection Linking Clinical and Statistical Goals Patrick J. Heagerty Department of Biostatistics University of Washington 174 Biomarkers Session Outline
Part [2.1]: Evaluation of Markers for Treatment Selection Linking Clinical and Statistical Goals Patrick J. Heagerty Department of Biostatistics University of Washington 174 Biomarkers Session Outline
Analysis of Environmental Data Conceptual Foundations: En viro n m e n tal Data
 Analysis of Environmental Data Conceptual Foundations: En viro n m e n tal Data 1. Purpose of data collection...................................................... 2 2. Samples and populations.......................................................
LAB ASSIGNMENT 4 INFERENCES FOR NUMERICAL DATA. Comparison of Cancer Survival*
 LAB ASSIGNMENT 4 1 INFERENCES FOR NUMERICAL DATA In this lab assignment, you will analyze the data from a study to compare survival times of patients of both genders with different primary cancers. First,
Application of Local Control Strategy in analyses of the effects of Radon on Lung Cancer Mortality for 2,881 US Counties
 Application of Local Control Strategy in analyses of the effects of Radon on Lung Cancer Mortality for 2,881 US Counties Bob Obenchain, Risk Benefit Statistics, August 2015 Our motivation for using a Cut-Point
Modeling Sentiment with Ridge Regression
 Modeling Sentiment with Ridge Regression Luke Segars 2/20/2012 The goal of this project was to generate a linear sentiment model for classifying Amazon book reviews according to their star rank. More generally,
Using Random Forest in the field of metabolomics
 Rowan University Rowan Digital Works Theses and Dissertations 11-3-2014 Using Random Forest in the field of metabolomics Curtis White Follow this and additional works at: http://rdw.rowan.edu/etd Part
A SAS Macro for Adaptive Regression Modeling
 A SAS Macro for Adaptive Regression Modeling George J. Knafl, PhD Professor University of North Carolina at Chapel Hill School of Nursing Supported in part by NIH Grants R01 AI57043 and R03 MH086132 Overview
CLINICAL BIOSTATISTICS
 09/06/17 1 Overview and Descriptive Statistics a. Application of statistics in biomedical research b. Type of data c. Graphic representation of data d. Summary statistics: central tendency and dispersion
Applications. DSC 410/510 Multivariate Statistical Methods. Discriminating Two Groups. What is Discriminant Analysis
 DSC 4/5 Multivariate Statistical Methods Applications DSC 4/5 Multivariate Statistical Methods Discriminant Analysis Identify the group to which an object or case (e.g. person, firm, product) belongs:
Today: Binomial response variable with an explanatory variable on an ordinal (rank) scale.
 scale.") Model Based Statistics in Biology. Part V. The Generalized Linear Model. Single Explanatory Variable on an Ordinal Scale ReCap. Part I (Chapters 1,2,3,4), Part II (Ch 5, 6, 7) ReCap Part III (Ch 9, 10,
Model Based Statistics in Biology. Part V. The Generalized Linear Model. Single Explanatory Variable on an Ordinal Scale ReCap. Part I (Chapters 1,2,3,4), Part II (Ch 5, 6, 7) ReCap Part III (Ch 9, 10,
Migraine Dataset. Exercise 1
 Migraine Dataset In December 2016 the company BM launched the app MigraineTracker. This app was developed to collect data from people suffering from migraine. Users are able to create a record in this
Discovering New Variables and Improving the Prediction of ALS Progression
 Discovering New Variables and Improving the Prediction of ALS Progression Guang Li, Liuxia Wang Sentrana Inc. November 13, 2012 RECOMB and DREAM Challenge, San Francisco Slide 1 Agenda 1. Problem Description,
Certificate Courses in Biostatistics
 Certificate Courses in Biostatistics Term I : September December 2015 Term II : Term III : January March 2016 April June 2016 Course Code Module Unit Term BIOS5001 Introduction to Biostatistics 3 I BIOS5005
Linear Regression in SAS
 1 Suppose we wish to examine factors that predict patient s hemoglobin levels. Simulated data for six patients is used throughout this tutorial. data hgb_data; input id age race $ bmi hgb; cards; 21 25
Inferential Statistics
 Inferential Statistics and t - tests ScWk 242 Session 9 Slides Inferential Statistics Ø Inferential statistics are used to test hypotheses about the relationship between the independent and the dependent
7 Statistical Issues that Researchers Shouldn t Worry (So Much) About
 About") 7 Statistical Issues that Researchers Shouldn t Worry (So Much) About By Karen Grace-Martin Founder & President About the Author Karen Grace-Martin is the founder and president of The Analysis Factor.
7 Statistical Issues that Researchers Shouldn t Worry (So Much) About By Karen Grace-Martin Founder & President About the Author Karen Grace-Martin is the founder and president of The Analysis Factor.
Controlling Bias & Confounding
 Controlling Bias & Confounding Chihaya Koriyama August 5 th, 2015 QUESTIONS FOR BIAS Key concepts Bias Should be minimized at the designing stage. Random errors We can do nothing at Is the nature the of
Bangor University Laboratory Exercise 1, June 2008
 Laboratory Exercise, June 2008 Classroom Exercise A forest land owner measures the outside bark diameters at.30 m above ground (called diameter at breast height or dbh) and total tree height from ground
Index. Springer International Publishing Switzerland 2017 T.J. Cleophas, A.H. Zwinderman, Modern Meta-Analysis, DOI /
 Index A Adjusted Heterogeneity without Overdispersion, 63 Agenda-driven bias, 40 Agenda-Driven Meta-Analyses, 306 307 Alternative Methods for diagnostic meta-analyses, 133 Antihypertensive effect of potassium,
Small Group Presentations
 Admin Assignment 1 due next Tuesday at 3pm in the Psychology course centre. Matrix Quiz during the first hour of next lecture. Assignment 2 due 13 May at 10am. I will upload and distribute these at the
dataset1 <- read.delim("c:\dca_example_dataset1.txt", header = TRUE, sep = "\t") attach(dataset1)
 attach(dataset1)") Worked examples of decision curve analysis using R A note about R versions The R script files to implement decision curve analysis were developed using R version 2.3.1, and were tested last using R version
Worked examples of decision curve analysis using R A note about R versions The R script files to implement decision curve analysis were developed using R version 2.3.1, and were tested last using R version
Survival Prediction Models for Estimating the Benefit of Post-Operative Radiation Therapy for Gallbladder Cancer and Lung Cancer
 Survival Prediction Models for Estimating the Benefit of Post-Operative Radiation Therapy for Gallbladder Cancer and Lung Cancer Jayashree Kalpathy-Cramer PhD 1, William Hersh, MD 1, Jong Song Kim, PhD
A COMPARISON OF IMPUTATION METHODS FOR MISSING DATA IN A MULTI-CENTER RANDOMIZED CLINICAL TRIAL: THE IMPACT STUDY
 A COMPARISON OF IMPUTATION METHODS FOR MISSING DATA IN A MULTI-CENTER RANDOMIZED CLINICAL TRIAL: THE IMPACT STUDY Lingqi Tang 1, Thomas R. Belin 2, and Juwon Song 2 1 Center for Health Services Research,
List of Figures. List of Tables. Preface to the Second Edition. Preface to the First Edition
 List of Figures List of Tables Preface to the Second Edition Preface to the First Edition xv xxv xxix xxxi 1 What Is R? 1 1.1 Introduction to R................................ 1 1.2 Downloading and Installing
5 14.notebook May 14, 2015
 Objective: I can represent categorical data using a two way frequency table Entry: A marketing company is trying to determine how much diversity there is in the age of people who drink different soft drinks.
Analysis of Categorical Data from the Ashe Center Student Wellness Survey
 Lab 6 Analysis of Categorical Data from the Ashe Center Student Wellness Survey Before starting this lab, you should be familiar with: the difference between categorical and quantitative variables, and
Supplementary Appendix
 Supplementary Appendix This appendix has been provided by the authors to give readers additional information about their work. Supplement to: Weintraub WS, Grau-Sepulveda MV, Weiss JM, et al. Comparative
Sound Texture Classification Using Statistics from an Auditory Model
 Sound Texture Classification Using Statistics from an Auditory Model Gabriele Carotti-Sha Evan Penn Daniel Villamizar Electrical Engineering Email: gcarotti@stanford.edu Mangement Science & Engineering
Biostatistics II
 Biostatistics II 514-5509 Course Description: Modern multivariable statistical analysis based on the concept of generalized linear models. Includes linear, logistic, and Poisson regression, survival analysis,
MULTIFACTOR DESIGNS Page Factorial experiments are more desirable because the researcher can investigate
 MULTIFACTOR DESIGNS Page 1 I. Factorial Designs 1. Factorial experiments are more desirable because the researcher can investigate simultaneously two or more variables and can also determine whether there
Research Manual STATISTICAL ANALYSIS SECTION. By: Curtis Lauterbach 3/7/13
 Research Manual STATISTICAL ANALYSIS SECTION By: Curtis Lauterbach 3/7/13 TABLE OF CONTENTS INTRODUCTION 1 STATISTICAL ANALYSIS 1 Overview 1 Dependent Variable 1 Independent Variable 1 Interval 1 Ratio
Prediction Model For Risk Of Breast Cancer Considering Interaction Between The Risk Factors
 INTERNATIONAL JOURNAL OF SCIENTIFIC & TECHNOLOGY RESEARCH VOLUME, ISSUE 0, SEPTEMBER 01 ISSN 81 Prediction Model For Risk Of Breast Cancer Considering Interaction Between The Risk Factors Nabila Al Balushi
Comparison of discrimination methods for the classification of tumors using gene expression data
 Comparison of discrimination methods for the classification of tumors using gene expression data Sandrine Dudoit, Jane Fridlyand 2 and Terry Speed 2,. Mathematical Sciences Research Institute, Berkeley
Introduction to SPSS S0
 Basic medical statistics for clinical and experimental research Introduction to SPSS S0 Katarzyna Jóźwiak k.jozwiak@nki.nl November 10, 2017 1/55 Introduction SPSS = Statistical Package for the Social
Article from. Forecasting and Futurism. Month Year July 2015 Issue Number 11
 Article from Forecasting and Futurism Month Year July 2015 Issue Number 11 Calibrating Risk Score Model with Partial Credibility By Shea Parkes and Brad Armstrong Risk adjustment models are commonly used
Identification of Neuroimaging Biomarkers
 Identification of Neuroimaging Biomarkers Dan Goodwin, Tom Bleymaier, Shipra Bhal Advisor: Dr. Amit Etkin M.D./PhD, Stanford Psychiatry Department Abstract We present a supervised learning approach to
Logistic Regression Predicting the Chances of Coronary Heart Disease. Multivariate Solutions
 Logistic Regression Predicting the Chances of Coronary Heart Disease Multivariate Solutions What is Logistic Regression? Logistic regression in a nutshell: Logistic regression is used for prediction of
SUPPLEMENTAL DIGITAL CONTENT FILE 2
 Effects of volatile anesthetics on mortality and postoperative pulmonary and other complications in patients undergoing surgery: A systematic review and meta-analysis SUPPLEMENTAL DIGITAL CONTENT FILE
Addendum: Multiple Regression Analysis (DRAFT 8/2/07)
") Addendum: Multiple Regression Analysis (DRAFT 8/2/07) When conducting a rapid ethnographic assessment, program staff may: Want to assess the relative degree to which a number of possible predictive variables
Addendum: Multiple Regression Analysis (DRAFT 8/2/07) When conducting a rapid ethnographic assessment, program staff may: Want to assess the relative degree to which a number of possible predictive variables
Data Analysis Using Regression and Multilevel/Hierarchical Models
 Data Analysis Using Regression and Multilevel/Hierarchical Models ANDREW GELMAN Columbia University JENNIFER HILL Columbia University CAMBRIDGE UNIVERSITY PRESS Contents List of examples V a 9 e xv " Preface
Meta-analysis using RevMan. Yemisi Takwoingi October 2015
 Yemisi Takwoingi October 2015 Contents 1 Introduction... 1 2 Dataset 1 PART I..2 3 Starting RevMan... 2 4 Data and analyses in RevMan... 2 5 RevMan calculator tool... 2 Table 1. Data for derivation of
Using SPSS for Correlation
 Using SPSS for Correlation This tutorial will show you how to use SPSS version 12.0 to perform bivariate correlations. You will use SPSS to calculate Pearson's r. This tutorial assumes that you have: Downloaded
Data management by using R: big data clinical research series
 Big-data Clinical Trial Column Page 1 of 6 Data management by using R: big data clinical research series Zhongheng Zhang Department of Critical Care Medicine, Jinhua Municipal Central Hospital, Jinhua
STAT 135 Introduction to Statistics via Modeling: Midterm II Thursday November 16th, Name:
 STAT 135 Introduction to Statistics via Modeling: Midterm II Thursday November 16th, 2017 Name: 1 1 Short Answer a) For each of these five regression scenarios, name an appropriate visualization (along
10. LINEAR REGRESSION AND CORRELATION
 1 10. LINEAR REGRESSION AND CORRELATION The contingency table describes an association between two nominal (categorical) variables (e.g., use of supplemental oxygen and mountaineer survival ). We have
RISK PREDICTION MODEL: PENALIZED REGRESSIONS
 RISK PREDICTION MODEL: PENALIZED REGRESSIONS Inspired from: How to develop a more accurate risk prediction model when there are few events Menelaos Pavlou, Gareth Ambler, Shaun R Seaman, Oliver Guttmann,
Lecture 21. RNA-seq: Advanced analysis
 Lecture 21 RNA-seq: Advanced analysis Experimental design Introduction An experiment is a process or study that results in the collection of data. Statistical experiments are conducted in situations in
SPSS Correlation/Regression
 SPSS Correlation/Regression Experimental Psychology Lab Session Week 6 10/02/13 (or 10/03/13) Due at the Start of Lab: Lab 3 Rationale for Today s Lab Session This tutorial is designed to ensure that you
Exam 4 Review Exercises
 Math 160: Statistics Spring, 2014 Toews Exam 4 Review Exercises Instructions: Working in groups of 2-4, first review the goals and objectives for this exam (listed below) and then work the following problems.
Biomarker adaptive designs in clinical trials
 Review Article Biomarker adaptive designs in clinical trials James J. Chen 1, Tzu-Pin Lu 1,2, Dung-Tsa Chen 3, Sue-Jane Wang 4 1 Division of Bioinformatics and Biostatistics, National Center for Toxicological
Dr. Kelly Bradley Final Exam Summer {2 points} Name
 {2 points} Name You MUST work alone no tutors; no help from classmates. Email me or see me with questions. You will receive a score of 0 if this rule is violated. This exam is being scored out of 00 points.
Personalized Colorectal Cancer Survivability Prediction with Machine Learning Methods*
 Personalized Colorectal Cancer Survivability Prediction with Machine Learning Methods* 1 st Samuel Li Princeton University Princeton, NJ seli@princeton.edu 2 nd Talayeh Razzaghi New Mexico State University
Research Methods in Forest Sciences: Learning Diary. Yoko Lu December Research process
 Research Methods in Forest Sciences: Learning Diary Yoko Lu 285122 9 December 2016 1. Research process It is important to pursue and apply knowledge and understand the world under both natural and social
Quantitative Methods in Computing Education Research (A brief overview tips and techniques)
") Quantitative Methods in Computing Education Research (A brief overview tips and techniques) Dr Judy Sheard Senior Lecturer Co-Director, Computing Education Research Group Monash University judy.sheard@monash.edu
Quantitative Methods in Computing Education Research (A brief overview tips and techniques) Dr Judy Sheard Senior Lecturer Co-Director, Computing Education Research Group Monash University judy.sheard@monash.edu
Research Manual COMPLETE MANUAL. By: Curtis Lauterbach 3/7/13
 Research Manual COMPLETE MANUAL By: Curtis Lauterbach 3/7/13 TABLE OF CONTENTS INTRODUCTION 1 RESEARCH DESIGN 1 Validity 1 Reliability 1 Within Subjects 1 Between Subjects 1 Counterbalancing 1 Table 1.
Decision Making Process
 Survey Says: How to Create High Quality Surveys to Assist in the Evidence Anaheim, California Based Decision Making Process Daniel Byrd, Ph.D. University of California Office of the President CAIR Conference:
Examining Relationships Least-squares regression. Sections 2.3
 Examining Relationships Least-squares regression Sections 2.3 The regression line A regression line describes a one-way linear relationship between variables. An explanatory variable, x, explains variability
Part 8 Logistic Regression
 1 Quantitative Methods for Health Research A Practical Interactive Guide to Epidemiology and Statistics Practical Course in Quantitative Data Handling SPSS (Statistical Package for the Social Sciences)
Assigning B cell Maturity in Pediatric Leukemia Gabi Fragiadakis 1, Jamie Irvine 2 1 Microbiology and Immunology, 2 Computer Science
 Assigning B cell Maturity in Pediatric Leukemia Gabi Fragiadakis 1, Jamie Irvine 2 1 Microbiology and Immunology, 2 Computer Science Abstract One method for analyzing pediatric B cell leukemia is to categorize
MMI 409 Spring 2009 Final Examination Gordon Bleil. 1. Is there a difference in depression as a function of group and drug?
 MMI 409 Spring 2009 Final Examination Gordon Bleil Table of Contents Research Scenario and General Assumptions Questions for Dataset (Questions are hyperlinked to detailed answers) 1. Is there a difference
MEASURES OF ASSOCIATION AND REGRESSION
 DEPARTMENT OF POLITICAL SCIENCE AND INTERNATIONAL RELATIONS Posc/Uapp 816 MEASURES OF ASSOCIATION AND REGRESSION I. AGENDA: A. Measures of association B. Two variable regression C. Reading: 1. Start Agresti
CSE 255 Assignment 9
 CSE 255 Assignment 9 Alexander Asplund, William Fedus September 25, 2015 1 Introduction In this paper we train a logistic regression function for two forms of link prediction among a set of 244 suspected
Applied Medical. Statistics Using SAS. Geoff Der. Brian S. Everitt. CRC Press. Taylor Si Francis Croup. Taylor & Francis Croup, an informa business
 Applied Medical Statistics Using SAS Geoff Der Brian S. Everitt CRC Press Taylor Si Francis Croup Boca Raton London New York CRC Press is an imprint of the Taylor & Francis Croup, an informa business A
Colon cancer subtypes from gene expression data
 Colon cancer subtypes from gene expression data Nathan Cunningham Giuseppe Di Benedetto Sherman Ip Leon Law Module 6: Applied Statistics 26th February 2016 Aim Replicate findings of Felipe De Sousa et
A review of statistical methods in the analysis of data arising from observer reliability studies (Part 11) *
 *") A review of statistical methods in the analysis of data arising from observer reliability studies (Part 11) * by J. RICHARD LANDIS** and GARY G. KOCH** 4 Methods proposed for nominal and ordinal data Many
A review of statistical methods in the analysis of data arising from observer reliability studies (Part 11) * by J. RICHARD LANDIS** and GARY G. KOCH** 4 Methods proposed for nominal and ordinal data Many
Logistic Regression and Bayesian Approaches in Modeling Acceptance of Male Circumcision in Pune, India
 20th International Congress on Modelling and Simulation, Adelaide, Australia, 1 6 December 2013 www.mssanz.org.au/modsim2013 Logistic Regression and Bayesian Approaches in Modeling Acceptance of Male Circumcision
Parental Smoking Behavior, Ethnicity, Gender, and the Cigarette Smoking Behavior of High School Students
 Parental Smoking Behavior, Ethnicity, Gender, and the Cigarette Smoking Behavior of High School Students Paul R. Yarnold, Ph.D. Optimal Data Analysis, LLC Novometric analysis is used to predict cigarette
STATISTICAL METHODS FOR DIAGNOSTIC TESTING: AN ILLUSTRATION USING A NEW METHOD FOR CANCER DETECTION XIN SUN. PhD, Kansas State University, 2012
 STATISTICAL METHODS FOR DIAGNOSTIC TESTING: AN ILLUSTRATION USING A NEW METHOD FOR CANCER DETECTION by XIN SUN PhD, Kansas State University, 2012 A THESIS Submitted in partial fulfillment of the requirements
An Improved Algorithm To Predict Recurrence Of Breast Cancer
 An Improved Algorithm To Predict Recurrence Of Breast Cancer Umang Agrawal 1, Ass. Prof. Ishan K Rajani 2 1 M.E Computer Engineer, Silver Oak College of Engineering & Technology, Gujarat, India. 2 Assistant
Modeling gene expression using five histone modifications
 Modeling gene expression using five histone modifications Fifth Annual Primes MIT Conference Lalita Devadas Mentor: Angela Yen May 17, 2015 Lalita Devadas Modeling gene expression using five histone modifications
Predicting Breast Cancer Survivability Rates
 Predicting Breast Cancer Survivability Rates For data collected from Saudi Arabia Registries Ghofran Othoum 1 and Wadee Al-Halabi 2 1 Computer Science, Effat University, Jeddah, Saudi Arabia 2 Computer
Fitting discrete-data regression models in social science
 Fitting discrete-data regression models in social science Andrew Gelman Dept. of Statistics and Dept. of Political Science Columbia University For Greg Wawro sclass, 7 Oct 2010 Today s class Example: wells
Section 6: Analysing Relationships Between Variables
 6. 1 Analysing Relationships Between Variables Section 6: Analysing Relationships Between Variables Choosing a Technique The Crosstabs Procedure The Chi Square Test The Means Procedure The Correlations
Analysis of Confidence Rating Pilot Data: Executive Summary for the UKCAT Board
 Analysis of Confidence Rating Pilot Data: Executive Summary for the UKCAT Board Paul Tiffin & Lewis Paton University of York Background Self-confidence may be the best non-cognitive predictor of future
PubH 7405: REGRESSION ANALYSIS. Propensity Score
 PubH 7405: REGRESSION ANALYSIS Propensity Score INTRODUCTION: There is a growing interest in using observational (or nonrandomized) studies to estimate the effects of treatments on outcomes. In observational
Reveal Relationships in Categorical Data
 SPSS Categories 15.0 Specifications Reveal Relationships in Categorical Data Unleash the full potential of your data through perceptual mapping, optimal scaling, preference scaling, and dimension reduction
STAT 151B. Administrative Info. Statistics 151B: Introduction Modern Statistical Prediction and Machine Learning. Overview and introduction
 Statistics 151B: Modern Statistical Prediction and Machine Learning Overview and introduction information Homepage: http://www.stat.berkeley.edu/ jon/ stat-151b-spring-2012 All announcements and materials
Biostatistics 2 nd year Comprehensive Examination. Due: May 31 st, 2013 by 5pm. Instructions:
 Biostatistics 2 nd year Comprehensive Examination Due: May 31 st, 2013 by 5pm. Instructions: 1. The exam is divided into two parts. There are 6 questions in section I and 2 questions in section II. 2.
Intro to R. Professor Clayton Nall h/t Thomas Leeper, Ph.D. (University of Aarhus) and Teppei Yamamoto, Ph.D. (MIT) June 26, 2014
 and Teppei Yamamoto, Ph.D. (MIT) June 26, 2014") Intro to R Professor Clayton Nall h/t Thomas Leeper, Ph.D. (University of Aarhus) and Teppei Yamamoto, Ph.D. (MIT) June 26, 2014 Nall Intro to R 1 / 44 Nall Intro to R 2 / 44 1 Opportunities 2 Challenges
Intro to R Professor Clayton Nall h/t Thomas Leeper, Ph.D. (University of Aarhus) and Teppei Yamamoto, Ph.D. (MIT) June 26, 2014 Nall Intro to R 1 / 44 Nall Intro to R 2 / 44 1 Opportunities 2 Challenges
MS&E 226: Small Data
 MS&E 226: Small Data Lecture 10: Introduction to inference (v2) Ramesh Johari ramesh.johari@stanford.edu 1 / 17 What is inference? 2 / 17 Where did our data come from? Recall our sample is: Y, the vector
Knowledge Discovery and Data Mining. Testing. Performance Measures. Notes. Lecture 15 - ROC, AUC & Lift. Tom Kelsey. Notes
 Knowledge Discovery and Data Mining Lecture 15 - ROC, AUC & Lift Tom Kelsey School of Computer Science University of St Andrews http://tom.home.cs.st-andrews.ac.uk twk@st-andrews.ac.uk Tom Kelsey ID5059-17-AUC
User Guide. Association analysis. Input
 User Guide TFEA.ChIP is a tool to estimate transcription factor enrichment in a set of differentially expressed genes using data from ChIP-Seq experiments performed in different tissues and conditions.
Extending Rungie et al. s model of brand image stability to account for heterogeneity
 University of Wollongong Research Online Faculty of Commerce - Papers (Archive) Faculty of Business 2007 Extending Rungie et al. s model of brand image stability to account for heterogeneity Sara Dolnicar