INTERNATIONALES MARKENMANAGEMENT
|
|
|
- Janel Fleming
- 6 years ago
- Views:
Transcription
1 Chair for Marketing and Retailing INTERNATIONALES MARKENMANAGEMENT 5. Übung im Master WS 2015/2016 Spezialisierung: Handel und Internationales Marketing-Management Modul: Retail Management und Internationales Branding Required Literature Steenkamp, J.-B. E. M., Batra, R., & Alden, D. L. (2003), How perceived brand globalness creates brand value, Journal of International Business Studies, 34(1): Additional Readings Backhaus et al. (2011), Multivariate Analysemethoden, 13 h ed., Springer. Hair et al. (2010), Multivariate Data Analysis, 7 th ed., Pearson. Field, A. (2011), Discovering Statistics using SPSS, 4 th ed., Sage. Slide 2 1
2 Chair for Marketing and Retailing 5 Quantitative Research Technique I 5.1 Linear Regression 5.2 Logistic Regression 5.3 Moderated Regression Analysis Branding effects Perceived brand globalness Brand purchase likelihood How to assess linear relationships? Slide 4 2
3 Corporate Associations and Consumer Product Responses Source: Steenkamp/Batra/Alden (2003), p. 54. Slide 5 Objectives Determine when linear regression analysis is the appropriate statistical tool in analyzing a problem. Be aware of the assumptions underlying regression analysis and how to assess them. Select an estimation technique and explain the difference between stepwise and simultaneous regression. Interpret the results of regression. Understand how to do a multiple regression on SPSS Slide 6 3
4 Multiple regression Multiple regression analysis = a statistical technique that can be used to analyze the relationship between a single dependent (criterion) variable and several independent (predictor) variables. Y = b 0 + b 1 x 1 + b 2 x b n x n + e Y = Dependent Variable b 0 = Intercept (constant) Value of the Y variable when all X n =0. This is the point at which the regression line crosses the Y-axis. b 1 = Regression coefficient 1 b 2 = Regression coefficient 2 x 1 = Independent variable 1 x 2 = Independent variable 2 e = Prediction error (residual) Slide 7 Linear (single) regression A way of predicting the value of one variable from another. It is a hypothetical model of the relationship between two variables. The model used is a linear one. Therefore, we describe the relationship using the equation of a straight line. Y = b 0 + b 1 X 1 + e Slide 8 4
5 Multiple regression decision process Stage 1: Research design of multiple regression Stage 2: Assumptions in multiple regression analysis Stage 3: Estimating the regression model and assessing overall fit Stage 4: Interpreting the regression coefficients Slide 9 Stage 1: Research design of multiple regression In selecting suitable applications of multiple regression, the researcher must consider three primary issues: the appropriateness of the research problem, specification of a statistical relationship, and selection of the dependent and independent variables. The researcher should always consider three issues that can affect any decision about variables: The theory that supports using the variables, Measurement and specification error, especially in the dependent variable. Consider sample size a minimum sample of 50 and preferably 100 observations for most research situations. The minimum ratio of observations to variables is 5 to 1, but the preferred ratio is 15 or 20 to 1. Slide 10 5
6 Stage 2: Assumptions in multiple regression analysis Straightforward assumptions: Variable Type: Outcome must be continuous Predictors can be continuous or dichotomous. Non-Zero Variance: Predictors must not have zero variance. Linearity: The relationship we model is, in reality, linear. Independence: All values of the outcome should come from a different person. Slide 11 Stage 2: Assumptions in multiple regression analysis (cont.) Tricky assumptions: No multicollinearity: Predictors must not be highly correlated. Homoscedasticity: For each value of the predictors the variance of the error term should be constant. Independent errors: For any pair of observations, the error terms should be uncorrelated. Normally-distributed errors Slide 12 6
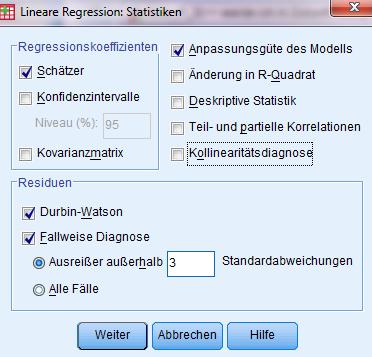
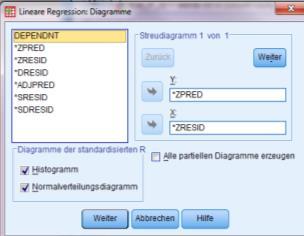
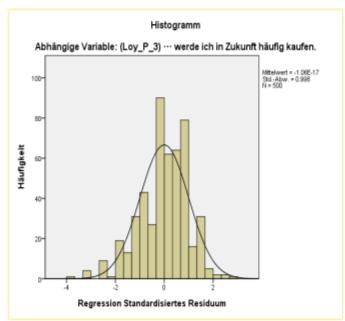
7 Stage 2: Multicollinearity Multicollinearity exists if predictors are highly correlated. This assumption can be checked with collinearity diagnostics. Tolerance should be more than 0.2 (Menard, 1995). VIF should be less than 10 (Myers, 1990; Kim/Timm 2006). Drop variables that do not fulfill the criteria! Slide 13 Stage 2: Homoscedacity, independent errors, normally distributed errors Homoscedacity/Independence of errors: Plot ZRESID against ZPRED. ScatterPlot of residuals compares the standardized predicted values of the dependent variable against the standardized residuals from the regression equation. If the plot exhibits a random pattern then this indicates no identifiable violations of the assumptions underlying regression analysis. Independence of errors: Durbin/Watson value: d = 0: perfect positive correlation d = 2: no correlation d = 4: perfect negative correlation Normality of errors: Normal probability plot enables you to determine if the errors are normally distributed. It compares the observed (sample) standardized residuals against the expected standardized residuals from a normal distribution. Histogram of standardized residuals enables you to determine if the errors are normally distributed. Slide 14 7
8 Stage 3: Estimating the regression model and assessing overall model fit Basic steps: 1. Select a method for specifying the regression model to be estimated, 2. Assess the statistical significance of the overall model in predicting the dependent variable, and 3. Determine whether any of the observations exert an undue influence on the results. Methods of regression: Hierarchical: Experimenter decides the order in which variables are entered into the model. Forced entry (confirmatory, simultaneous): All predictors are entered simultaneously. Stepwise: Predictors are selected using their semi-partial correlation with the outcome. Slide 15 Stage 3: Methods Hierarchical regression: Known predictors (based on past research) are entered into the regression model first. New predictors are then entered in a separate step/block. Experimenter makes the decisions. It is the best method: Based on theory testing. You can see the unique predictive influence of a new variable on the outcome because known predictors are held constant in the model. Bad Point: Relies on the experimenter knowing what they re doing! Forced entry regression: All variables are entered into the model simultaneously. The results obtained depend on the variables entered into the model. It is important to have good theoretical reasons for including a particular variable. Slide 16 8
9 Stage 3: Testing the model R 2 The proportion of variance accounted for by the regression model. R 2 ranges from 0 to 1.0 and represents the amount of the dependent variable explained by the independent variables combined. Coefficient of determination (measure of goodness of fit.) The F-statistic (ANOVA) Looks at whether the variance explained by the model is significantly greater than the error within the model. It tells us whether using the regression model is significantly better at predicting values of the outcome than using the mean. Is used to determine if the overall regression model is statistically significant. If the F statistic is significant, it means it is unlikely that your sample will produce a large R 2 when the population R 2 is actually zero. Slide 17 Stage 4: Interpreting the regression coefficients Beta values: the change in the outcome associated with a unit change in the predictor. Standardized beta values: tell us the same but expressed as standard deviations. Are necessary to compare relative importance Slide 18 9
10 Reporting Example Single and multiple linear regressions showing the influence of different dimensions of Corporate Reputation on Loyalty towards the Corporate Brand Henkel Independent variables Model 1 Model 2 Model 3 Model 4 Product/Service quality.674*** (.545 ***).525 *** (.425 ***).354 *** (.287 ***) Social responsibility.492 *** (.455 ***).262 *** (.242 ***).113 ** (.105 **) Customer orientation.320 *** (.274 ***) Good employer.105 ns (.078 ns) Financial strength.039 ns (.029 ns) Gender (dummy).019 ns (.007 ns) ns (-.016 ns) ns (-.007 ns).001 ns (.000 ns) Age.013** (.129 **).012 ** (.120 **).011 ** (.111 **).011 ns (.112 ns) R Note: standardized coeficients in brackets, *** p<.001; ** p<.005 ; ns: not significant. Slide 19 Inclusion of Control Variables Often, you want to control for other variables (covariates) Simply add centered/z-standardized continuous covariates as predictors to the regression equation. In case of categorical control variables, dummy coding is recommended Typical control variables: Age, gender, nationality, income, etc. Example (Steenkamp/Batra/Alden 2003, p. 57): Although this study focuses on the pathways through which PBG influences purchase likelihood, other exogenous influences are likely. Three sets of covariates are included in our analyses. First, brand familiarity is included because previous research suggests that it may have an important impact on perceived brand quality, brand prestige, and purchase likelihood, whether or not a brand is perceived as global (e.g. Keller, 1998). Second, country-of-origin (CO) image is included to control for the possibility that a certain global brand may attain higher prestige, quality, and/or purchase likelihood because it comes from a particular foreign country, rather than because it is global. ( ) Finally, we add brand dummies to the analyses to control for unobserved, brand-specific effects (such as objective quality, distribution coverage, and market share). Slide 20 10
 and satisfaction (with the product) have on customer loyalty?")

11 Regression example Applied in SPSS Sample of 500 consumers in Germany. Which influence do trust (in the product brand) and satisfaction (with the product) have on customer loyalty? Hypotheses: H 1 : Product loyalty will be positively influenced by the trust of consumers in the product brand. H 2 : Product loyalty will be positively influenced by the satisfaction of consumers with the product brand. Slide 21 Step 1: Regression Model Slide 22 11
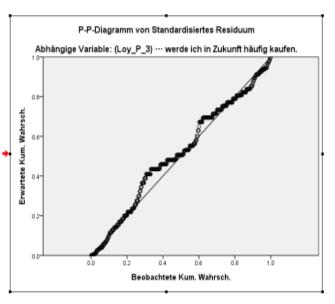
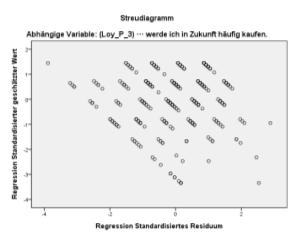
12 Step 2: Assumptions Slide 23 Step 3: Output - Assumptions Slide 24 12
13 Step 4: Output - Model Slide 25 Step 4: Output Regression coefficients Slide 26 13
14 Exercise Perform a multiple linear regression analysis in SPSS Inv_P_2 Ver_P_2 Loy_P_1 Zuf_P_2 How would you phrase the corresponding hypotheses? What do you find? Which item is more important for explaining the dependent variable? How good is your explanatory power? Slide 27 Chair for Marketing and Retailing 5 Quantitative Research Technique I 5.1 Linear Regression 5.2 Logistic Regression 5.3 Moderated Regression Analysis 14

15 Branding Effects Perceived brand globalness Brand purchase (0/1) How to assess non-linear relationships? Slide 29 Objectives State the circumstances under which logistic regression should be used instead of multiple regression. Identify the types of dependent and independent variables used in the application of logistic regression. Describe the method used to transform binary measures into the likelihood and probability measures used in logistic regression. Interpret the results of a logistic regression analysis and assessing predictive accuracy, with comparisons to both multiple regression and discriminant analysis. Understand the strengths and weaknesses of logistic regression compared to discriminant analysis and multiple regression. Slide 30 15
16 Logistic regression Logistic Regression = a specialized form of regression that is designed to predict and explain a binary (two-group dummy variable 0/1) categorical variable rather than a metric dependent measure. P( Y) 1 e 1 ( bo b1 x1 b2x2... b j x ) j j P(Y) = Probability of dependant variable occurring (Y=1) Slide 31 Multiple Regression Decision Process Stage 1: Research design of logistic regression Stage 2: Assumptions of logistic regression Stage 3: Estimation of the logistic regression model and assessing overall fit Stage 4: Interpretation of the results Slide 32 16
17 Stage 1: Research design of logistic regression Logistic regression is best suited to address two research objectives... Identifying the independent variables that impact group membership in the dependent variable. Establishing a classification system based on the logistic model for determining group membership. The binary nature of the dependent variable (0/1) means the error term has a binomial distribution instead of a normal distribution, and it thus invalidates all testing based on the assumption of normality. The variance of the dichotomous variable is not constant, creating instances of heteroscedasticity as well. Neither of the above violations can be remedied through transformations of the dependent or independent variables. Logistic regression was developed to specifically deal with these issues. Slide 33 Stage 2: Assumptions of logistic regression The advantages of logistic regression are primarily the result of the general lack of assumptions. Logistic regression does not require any specific distributional form for the independent variables. Heteroscedasticity of the independent variables is not required. Linear relationships between the dependent and independent variables are not required. But: You should test multicollinearity, independency of errors and check for outliers Slide 34 17
18 Stage 3: Testing the model There are two ways to assess the accuracy of the model in the sample: Residual Statistics Standardized Residuals In an average sample, 95% of standardized residuals should lie between 2. 99% of standardized residuals should lie between 2.5. Outliers: Any case for which the absolute value of the standardized residual is 3 or more, is likely to be an outlier. Influential cases Cook s distance Measures the influence of a single case on the model as a whole. Absolute values greater than 1 may be cause for concern (Weisberg 1982). Slide 35 Stage 3: Estimating the model Model estimation using a maximum likelihood approach, not least squares as in multiple regression The estimation process maximizes the likelihood that an event will occur the event being a respondent is assigned to one group versus another Issues to consider: Sample size (at least 100 cases) Group size should be more or less equal/similar Formulation of hypotheses ( probability) Methods of regression Slide 36 18
19 Stage 3: Assessing the model Criteria Goodness of fit Acceptable values -2loglikelihood statistic (-2LL) -2LL close to 0 (significance close to 1; not significant) Likelihood-Ratio-Test (LR-Test) Model goodness High Chi-Square Value (significance close to 0; significant) McFaddens-R² More than 0.2; good 0.4 Cox & Snell R² More than 0.2; good 0.4 Nagelkerkes R² More than 0.2; good 0.4; very good 0.5 Evaluation of Classification results Proportional Chance Criterion (PCC): α²+(1-α)² Maximum Chance Criterion (MCC) Proportion of correctly classified objects Hosmer-Lemeshow-Test α = relative size of larger group (for different group sizes) relative size of larger group (for similar group sizes) More than PCC and MCC Small Chi-Square Value (significance close to 1; not significant) Source: According to Krafft (2000), p. 244, Backhaus et al. (2008), p Slide 37 Stage 4: Interpretation of the results A positive relationship means an increase in the independent variable is associated with an increase in the predicted probability, and vice versa. Magnitude cannot be assed with the given coefficients (NOT LINEAR!). Interpretation: positive b 0 : function moves to the left negative b 0 : function moves to the right b j > 1: fast rise of probability 0 < b j < 1: slow rise b j = 0: horizontal P(y=1) = 0,5 b j < 0: analogous, but fall of probability 19
20 Stage 4: Assessing predictors The Wald statistic: Similar to t-statistic in Regression. Tests the null hypothesis that b = 0. Is biased when b is large. The Odds-Ratio, Exp(B): Indicates the change in odds resulting from a unit change in the predictor. Exp(B) > 1: Predictor, Probability of outcome occurring. Exp(B) < 1: Predictor, Probability of outcome occurring. Odds = P(y=1) 1-P(y=1) Slide 39 Reporting Example Binary logistic regression analysis with dichotomized dependent variable Variable β Exp(b) β Exp(b) Dependent variable Independent variables Model 1: Satisfaction with Product (0/1) Model 2: Satisfaction with Product (0/1) Product quality *** *** Product price.164 ns Control variables Age ns ns.995 Constant *** ***.000 No of observations n group 1/ n group 2 107/ /391 Model Chi-Square (df) *** (3df) *** (3df) Correctly classified Maximal chance (MCC) Proportional chance (PCC) Nagelkerkes R Slide 40 20

21 Multinomial logistic regression Logistic regression to predict membership of more than two categories. It (basically) works in the same way as binary logistic regression. The analysis breaks the outcome variable down into a series of comparisons between two categories. E.g., if you have three outcome categories (A, B and C), then the analysis will consist of two comparisons that you choose: Compare everything against your first category (e.g. A vs. B and A vs. C), Or your last category (e.g. A vs. C and B vs. C), Or a custom category (e.g. B vs. A and B vs. C). The important parts of the analysis and output are much the same as we have just seen for binary logistic regression. Slide 41 Logistic regression example Applied in SPSS Sample of 500 consumers in Germany. How do trust and satisfaction influence the likelihood that customers are loyal towards the product? Hypotheses: H 1 : Higher trust of consumers in the product brand will increase the likelihood of product loyalty. H 2 : Higher satisfaction of consumers with the product brand will increase the likelihood of product loyalty. Transformation of dependent variable Slide 42 21

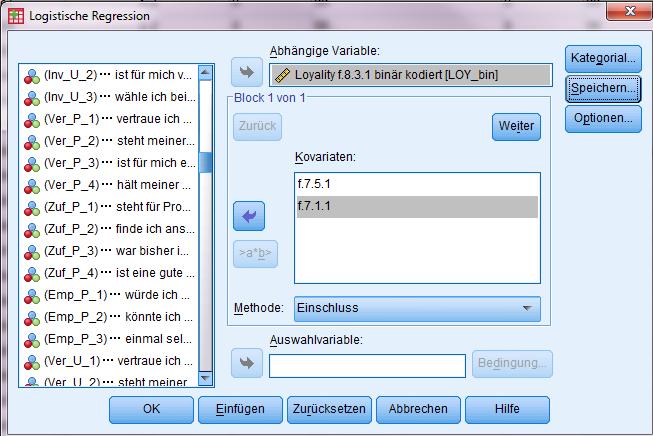
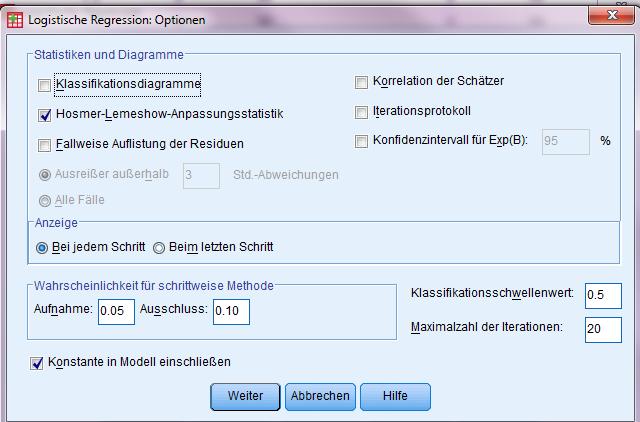
22 Step 1: The regression model Slide 43 Step 2: Assumptions Slide 44 22
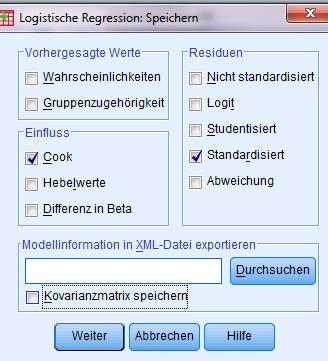
23 Step 2 Procedure: Cook s distance & standardized residuals Innerhalb der binären logistischen Regression unter Speichern : Haken bei Cook und Standardisiert Nach der Berechnung der logistischen Regressionen erscheinen am Ende des Datensatzes zwei neue Variablen COO_1 (Cook s distance) und ZRE_1 (standardisierte Residuen der abhängigen Variablen) Zur Berechnung sollten nur jene Fälle einbezogen werden, die keine Ausreißer beinhalten: Daten > Fälle auswählen > Falls Bedingung zutrifft markieren > Falls > Formel abs(zre_1) < 3.0 and COO_1 < 1.0 > Weiter Ausschluss der Variablen, die diese Bedingung nicht erfüllen (erneute Variable filter_$ am Ende des Datensatzes mit 1 = selektiert, 0 = ausselektiert) Binäre log. Regression erneut berechnen, allerdings ohne das erneut die Variablen Cook s distance und standardisierte Residuen berechnet werden (Haken deaktivieren) Nur dann mit ausgeschlossenen Fällen weiter rechnen, wenn sich die Klassifizierungsgüte um mehr als 2%-Punkte verbessert Slide 45 Step 3: Output Maximum chance Slide 46 23
24 Step 3: Output - Model goodness Slide 47 Step 3: Output Regression coefficients Slide 48 24
25 Exercise Perform a logistic regression analysis in SPSS Inv_P_2 Ver_P_2 Loy_P_1 Zuf_P_2 Slide 49 Chair for Marketing and Retailing 5 Quantitative Research Technique I 5.1 Linear Regression 5.2 Logistic Regression 5.3 Moderated Regression Analysis 25
26 Moderation Model Consumer Ethnocentrism PBG.34***? Brand purchase likelihood PBG* CE? CE.34*** Brand purchase likelihood PBG.07n.s. Slide 51 Objectives Understand the meaning of an interaction effect and the difference to direct effects. State the circumstances under moderation should be used. Learn to differentiate between different types of moderators. Accomplish moderated regression analysis in SPSS. Slide 52 26
27 Moderated regression analysis A moderator variable has been defined as one which systematically modifies either the form and/or strength of the relationship between a predictor and a criterion variable. (Sharma/Durand/Gur-Arie 1981) Effect of a predictor variable (x) on a criterion (y) depends on a third variable (z), the moderator Interaction effect Each moderator effect has to be grounded in theory Predictor and moderator should be mean centered before MRA z x y Slide 53 Moderators (1) y b 0 b x 1 x y z (2) y b 0 b x b 1 2 z x y z (3) y b 0 b x b z b xz x y x*z Slide 54 27
28 Quick facts y b0 b1 x b2 z b3 xz The interaction is carried by the xz term, the product of x and z The b 3 coefficient reflects the interaction between x and z only if the lower order terms b 1 x and b 1 z are included in the equation! Leaving out these terms confounds the additive and multiplicative effects, producing misleading results. The coefficient b 3 indicates the unit change in the effect of x as z changes. The coefficients b 1 and b 1 represent the effects of x and z, respectively, when the other variable is zero (conditional effect meaningful zero levels through mean centering important). Each individual has a score on x and z. To form the xz term, multiply together the individual s scores on x and z. Slide 55 Suggested MRA steps Suggested procedure : 1. Test assumptions 2. Mean centering (i.e. Mittelwertzentrieren ) 3. Create interaction term (multiply x and z) 4. Calculate regression with one depv and three indepv (x, z, x*z) 5. Evaluate model 6. Interpret coefficients Slide 56 28
29 Reporting Example Source: Steenkamp/Batra/Alden 2003, p. 60 Slide 57 Moderated regression example Applied in SPSS Sample of 500 consumers in Germany. Do trust and satisfaction interact in explaining loyalty? Or, is the effect of satisfaction on loyalty dependent on trust? Hypotheses: H 1a : The influence of satisfaction on loyalty will be moderated by trust. or: H 1a : The influence of satisfaction on loyalty will be increased (positively moderated) by trust. (The more trust the consumer has the stronger the effect of satisfaction on loyalty) Slide 58 29


30 Step 1: Mean centered values! Slide 59 Step 2: Model & Output Slide 60 30
31 Exercise Test the following moderation model Inv_P_2 Ver_P_2 Loy_P_1 Slide 61 Exercise for next week Show what you learned today! Get to know the Henkel Data Derive one or several meaningful research questions Test hypotheses (that fit to the research questions) using multiple (linear) regression analysis, moderated regression analysis, and (binary) logistic regression analysis. Prepare a short (max 20 min., 15 slides) presentation; please use the presentation template on our homepage and don t forget to insert your group number, names and matriculation numbers! Hand over the printed slides (i.e. handout) to the lecturer before class. Be prepared to present Up to 3 points on top of the exam!!!! Slide 62 31
11/18/2013. Correlational Research. Correlational Designs. Why Use a Correlational Design? CORRELATIONAL RESEARCH STUDIES
 Correlational Research Correlational Designs Correlational research is used to describe the relationship between two or more naturally occurring variables. Is age related to political conservativism? Are
11/24/2017. Do not imply a cause-and-effect relationship
 Correlational research is used to describe the relationship between two or more naturally occurring variables. Is age related to political conservativism? Are highly extraverted people less afraid of rejection
Daniel Boduszek University of Huddersfield
 Daniel Boduszek University of Huddersfield d.boduszek@hud.ac.uk Introduction to Multiple Regression (MR) Types of MR Assumptions of MR SPSS procedure of MR Example based on prison data Interpretation of
Daniel Boduszek University of Huddersfield
 Daniel Boduszek University of Huddersfield d.boduszek@hud.ac.uk Introduction to Logistic Regression SPSS procedure of LR Interpretation of SPSS output Presenting results from LR Logistic regression is
WELCOME! Lecture 11 Thommy Perlinger
 Quantitative Methods II WELCOME! Lecture 11 Thommy Perlinger Regression based on violated assumptions If any of the assumptions are violated, potential inaccuracies may be present in the estimated regression
Correlation and Regression
 Dublin Institute of Technology ARROW@DIT Books/Book Chapters School of Management 2012-10 Correlation and Regression Donal O'Brien Dublin Institute of Technology, donal.obrien@dit.ie Pamela Sharkey Scott
Daniel Boduszek University of Huddersfield
 Daniel Boduszek University of Huddersfield d.boduszek@hud.ac.uk Introduction to Multinominal Logistic Regression SPSS procedure of MLR Example based on prison data Interpretation of SPSS output Presenting
Multiple Regression Using SPSS/PASW
 MultipleRegressionUsingSPSS/PASW The following sections have been adapted from Field (2009) Chapter 7. These sections have been edited down considerablyandisuggest(especiallyifyou reconfused)thatyoureadthischapterinitsentirety.youwillalsoneed
12/30/2017. PSY 5102: Advanced Statistics for Psychological and Behavioral Research 2
 PSY 5102: Advanced Statistics for Psychological and Behavioral Research 2 Selecting a statistical test Relationships among major statistical methods General Linear Model and multiple regression Special
Small Group Presentations
 Admin Assignment 1 due next Tuesday at 3pm in the Psychology course centre. Matrix Quiz during the first hour of next lecture. Assignment 2 due 13 May at 10am. I will upload and distribute these at the
CHAPTER TWO REGRESSION
 CHAPTER TWO REGRESSION 2.0 Introduction The second chapter, Regression analysis is an extension of correlation. The aim of the discussion of exercises is to enhance students capability to assess the effect
Study Guide #2: MULTIPLE REGRESSION in education
 Study Guide #2: MULTIPLE REGRESSION in education What is Multiple Regression? When using Multiple Regression in education, researchers use the term independent variables to identify those variables that
Summary & Conclusion. Lecture 10 Survey Research & Design in Psychology James Neill, 2016 Creative Commons Attribution 4.0
 Summary & Conclusion Lecture 10 Survey Research & Design in Psychology James Neill, 2016 Creative Commons Attribution 4.0 Overview 1. Survey research and design 1. Survey research 2. Survey design 2. Univariate
Business Statistics Probability
 Business Statistics The following was provided by Dr. Suzanne Delaney, and is a comprehensive review of Business Statistics. The workshop instructor will provide relevant examples during the Skills Assessment
Applications. DSC 410/510 Multivariate Statistical Methods. Discriminating Two Groups. What is Discriminant Analysis
 DSC 4/5 Multivariate Statistical Methods Applications DSC 4/5 Multivariate Statistical Methods Discriminant Analysis Identify the group to which an object or case (e.g. person, firm, product) belongs:
Preliminary Report on Simple Statistical Tests (t-tests and bivariate correlations)
") Preliminary Report on Simple Statistical Tests (t-tests and bivariate correlations) After receiving my comments on the preliminary reports of your datasets, the next step for the groups is to complete
Preliminary Report on Simple Statistical Tests (t-tests and bivariate correlations) After receiving my comments on the preliminary reports of your datasets, the next step for the groups is to complete
MULTIPLE LINEAR REGRESSION 24.1 INTRODUCTION AND OBJECTIVES OBJECTIVES
 24 MULTIPLE LINEAR REGRESSION 24.1 INTRODUCTION AND OBJECTIVES In the previous chapter, simple linear regression was used when you have one independent variable and one dependent variable. This chapter
Dr. Kelly Bradley Final Exam Summer {2 points} Name
 {2 points} Name You MUST work alone no tutors; no help from classmates. Email me or see me with questions. You will receive a score of 0 if this rule is violated. This exam is being scored out of 00 points.
12/31/2016. PSY 512: Advanced Statistics for Psychological and Behavioral Research 2
 PSY 512: Advanced Statistics for Psychological and Behavioral Research 2 Introduce moderated multiple regression Continuous predictor continuous predictor Continuous predictor categorical predictor Understand
Survey research (Lecture 1) Summary & Conclusion. Lecture 10 Survey Research & Design in Psychology James Neill, 2015 Creative Commons Attribution 4.
 Summary & Conclusion. Lecture 10 Survey Research & Design in Psychology James Neill, 2015 Creative Commons Attribution 4.") Summary & Conclusion Lecture 10 Survey Research & Design in Psychology James Neill, 2015 Creative Commons Attribution 4.0 Overview 1. Survey research 2. Survey design 3. Descriptives & graphing 4. Correlation
Summary & Conclusion Lecture 10 Survey Research & Design in Psychology James Neill, 2015 Creative Commons Attribution 4.0 Overview 1. Survey research 2. Survey design 3. Descriptives & graphing 4. Correlation
Survey research (Lecture 1)
") Summary & Conclusion Lecture 10 Survey Research & Design in Psychology James Neill, 2015 Creative Commons Attribution 4.0 Overview 1. Survey research 2. Survey design 3. Descriptives & graphing 4. Correlation
Summary & Conclusion Lecture 10 Survey Research & Design in Psychology James Neill, 2015 Creative Commons Attribution 4.0 Overview 1. Survey research 2. Survey design 3. Descriptives & graphing 4. Correlation
Correlation and regression
 PG Dip in High Intensity Psychological Interventions Correlation and regression Martin Bland Professor of Health Statistics University of York http://martinbland.co.uk/ Correlation Example: Muscle strength
Business Research Methods. Introduction to Data Analysis
 Business Research Methods Introduction to Data Analysis Data Analysis Process STAGES OF DATA ANALYSIS EDITING CODING DATA ENTRY ERROR CHECKING AND VERIFICATION DATA ANALYSIS Introduction Preparation of
Data and Statistics 101: Key Concepts in the Collection, Analysis, and Application of Child Welfare Data
 TECHNICAL REPORT Data and Statistics 101: Key Concepts in the Collection, Analysis, and Application of Child Welfare Data CONTENTS Executive Summary...1 Introduction...2 Overview of Data Analysis Concepts...2
POL 242Y Final Test (Take Home) Name
 Name") POL 242Y Final Test (Take Home) Name_ Due August 6, 2008 The take-home final test should be returned in the classroom (FE 36) by the end of the class on August 6. Students who fail to submit the final
POL 242Y Final Test (Take Home) Name_ Due August 6, 2008 The take-home final test should be returned in the classroom (FE 36) by the end of the class on August 6. Students who fail to submit the final
isc ove ring i Statistics sing SPSS
 isc ove ring i Statistics sing SPSS S E C O N D! E D I T I O N (and sex, drugs and rock V roll) A N D Y F I E L D Publications London o Thousand Oaks New Delhi CONTENTS Preface How To Use This Book Acknowledgements
Media, Discussion and Attitudes Technical Appendix. 6 October 2015 BBC Media Action Andrea Scavo and Hana Rohan
 Media, Discussion and Attitudes Technical Appendix 6 October 2015 BBC Media Action Andrea Scavo and Hana Rohan 1 Contents 1 BBC Media Action Programming and Conflict-Related Attitudes (Part 5a: Media and
Statistical questions for statistical methods
 Statistical questions for statistical methods Unpaired (two-sample) t-test DECIDE: Does the numerical outcome have a relationship with the categorical explanatory variable? Is the mean of the outcome the
CHAPTER VI RESEARCH METHODOLOGY
 CHAPTER VI RESEARCH METHODOLOGY 6.1 Research Design Research is an organized, systematic, data based, critical, objective, scientific inquiry or investigation into a specific problem, undertaken with the
Chapter 10: Moderation, mediation and more regression
 Chapter 10: Moderation, mediation and more regression Smart Alex s Solutions Task 1 McNulty et al. (2008) found a relationship between a person s Attractiveness and how much Support they give their partner
Part 8 Logistic Regression
 1 Quantitative Methods for Health Research A Practical Interactive Guide to Epidemiology and Statistics Practical Course in Quantitative Data Handling SPSS (Statistical Package for the Social Sciences)
Sample Exam Paper Answer Guide
 Sample Exam Paper Answer Guide Notes This handout provides perfect answers to the sample exam paper. I would not expect you to be able to produce such perfect answers in an exam. So, use this document
bivariate analysis: The statistical analysis of the relationship between two variables.
 bivariate analysis: The statistical analysis of the relationship between two variables. cell frequency: The number of cases in a cell of a cross-tabulation (contingency table). chi-square (χ 2 ) test for
Describe what is meant by a placebo Contrast the double-blind procedure with the single-blind procedure Review the structure for organizing a memo
 Business Statistics The following was provided by Dr. Suzanne Delaney, and is a comprehensive review of Business Statistics. The workshop instructor will provide relevant examples during the Skills Assessment
Chapter 14: More Powerful Statistical Methods
 Chapter 14: More Powerful Statistical Methods Most questions will be on correlation and regression analysis, but I would like you to know just basically what cluster analysis, factor analysis, and conjoint
Multiple Regression Analysis
 Multiple Regression Analysis Basic Concept: Extend the simple regression model to include additional explanatory variables: Y = β 0 + β1x1 + β2x2 +... + βp-1xp + ε p = (number of independent variables
Chapter 1: Explaining Behavior
 Chapter 1: Explaining Behavior GOAL OF SCIENCE is to generate explanations for various puzzling natural phenomenon. - Generate general laws of behavior (psychology) RESEARCH: principle method for acquiring
IAPT: Regression. Regression analyses
 Regression analyses IAPT: Regression Regression is the rather strange name given to a set of methods for predicting one variable from another. The data shown in Table 1 and come from a student project
Logistic regression: Why we often can do what we think we can do 1.
 Logistic regression: Why we often can do what we think we can do 1. Augst 8 th 2015 Maarten L. Buis, University of Konstanz, Department of History and Sociology maarten.buis@uni.konstanz.de All propositions
CHAPTER ONE CORRELATION
 CHAPTER ONE CORRELATION 1.0 Introduction The first chapter focuses on the nature of statistical data of correlation. The aim of the series of exercises is to ensure the students are able to use SPSS to
Midterm Exam ANSWERS Categorical Data Analysis, CHL5407H
 Midterm Exam ANSWERS Categorical Data Analysis, CHL5407H 1. Data from a survey of women s attitudes towards mammography are provided in Table 1. Women were classified by their experience with mammography
MODEL SELECTION STRATEGIES. Tony Panzarella
 MODEL SELECTION STRATEGIES Tony Panzarella Lab Course March 20, 2014 2 Preamble Although focus will be on time-to-event data the same principles apply to other outcome data Lab Course March 20, 2014 3
Example 1. Students Mock exam Final exam. Bill Jane Jack Pat John Susan Anna Margret Peggy Joe William Ron Bob Sally Marry
 Regression analysis Example 1 A teacher wants to find out if the results of a exam written earlier during the semester correlate with the results of the final exam. Perform a correlational analysis. Students
3 CONCEPTUAL FOUNDATIONS OF STATISTICS
 3 CONCEPTUAL FOUNDATIONS OF STATISTICS In this chapter, we examine the conceptual foundations of statistics. The goal is to give you an appreciation and conceptual understanding of some basic statistical
Stepwise method Modern Model Selection Methods Quantile-Quantile plot and tests for normality
 Week 9 Hour 3 Stepwise method Modern Model Selection Methods Quantile-Quantile plot and tests for normality Stat 302 Notes. Week 9, Hour 3, Page 1 / 39 Stepwise Now that we've introduced interactions,
Addendum: Multiple Regression Analysis (DRAFT 8/2/07)
") Addendum: Multiple Regression Analysis (DRAFT 8/2/07) When conducting a rapid ethnographic assessment, program staff may: Want to assess the relative degree to which a number of possible predictive variables
Addendum: Multiple Regression Analysis (DRAFT 8/2/07) When conducting a rapid ethnographic assessment, program staff may: Want to assess the relative degree to which a number of possible predictive variables
Unit 1 Exploring and Understanding Data
 Unit 1 Exploring and Understanding Data Area Principle Bar Chart Boxplot Conditional Distribution Dotplot Empirical Rule Five Number Summary Frequency Distribution Frequency Polygon Histogram Interquartile
Unit outcomes. Summary & Conclusion. Lecture 10 Survey Research & Design in Psychology James Neill, 2018 Creative Commons Attribution 4.0.
 Summary & Conclusion Image source: http://commons.wikimedia.org/wiki/file:pair_of_merops_apiaster_feeding_cropped.jpg Lecture 10 Survey Research & Design in Psychology James Neill, 2018 Creative Commons
2.75: 84% 2.5: 80% 2.25: 78% 2: 74% 1.75: 70% 1.5: 66% 1.25: 64% 1.0: 60% 0.5: 50% 0.25: 25% 0: 0%
 Capstone Test (will consist of FOUR quizzes and the FINAL test grade will be an average of the four quizzes). Capstone #1: Review of Chapters 1-3 Capstone #2: Review of Chapter 4 Capstone #3: Review of
Class 7 Everything is Related
 Class 7 Everything is Related Correlational Designs l 1 Topics Types of Correlational Designs Understanding Correlation Reporting Correlational Statistics Quantitative Designs l 2 Types of Correlational
Content. Basic Statistics and Data Analysis for Health Researchers from Foreign Countries. Research question. Example Newly diagnosed Type 2 Diabetes
 Content Quantifying association between continuous variables. Basic Statistics and Data Analysis for Health Researchers from Foreign Countries Volkert Siersma siersma@sund.ku.dk The Research Unit for General
SUMMER 2011 RE-EXAM PSYF11STAT - STATISTIK
 SUMMER 011 RE-EXAM PSYF11STAT - STATISTIK Full Name: Årskortnummer: Date: This exam is made up of three parts: Part 1 includes 30 multiple choice questions; Part includes 10 matching questions; and Part
10. LINEAR REGRESSION AND CORRELATION
 1 10. LINEAR REGRESSION AND CORRELATION The contingency table describes an association between two nominal (categorical) variables (e.g., use of supplemental oxygen and mountaineer survival ). We have
Glossary From Running Randomized Evaluations: A Practical Guide, by Rachel Glennerster and Kudzai Takavarasha
 Glossary From Running Randomized Evaluations: A Practical Guide, by Rachel Glennerster and Kudzai Takavarasha attrition: When data are missing because we are unable to measure the outcomes of some of the
Today: Binomial response variable with an explanatory variable on an ordinal (rank) scale.
 scale.") Model Based Statistics in Biology. Part V. The Generalized Linear Model. Single Explanatory Variable on an Ordinal Scale ReCap. Part I (Chapters 1,2,3,4), Part II (Ch 5, 6, 7) ReCap Part III (Ch 9, 10,
Model Based Statistics in Biology. Part V. The Generalized Linear Model. Single Explanatory Variable on an Ordinal Scale ReCap. Part I (Chapters 1,2,3,4), Part II (Ch 5, 6, 7) ReCap Part III (Ch 9, 10,
Modeling Binary outcome
 Statistics April 4, 2013 Debdeep Pati Modeling Binary outcome Test of hypothesis 1. Is the effect observed statistically significant or attributable to chance? 2. Three types of hypothesis: a) tests of
Doing Quantitative Research 26E02900, 6 ECTS Lecture 6: Structural Equations Modeling. Olli-Pekka Kauppila Daria Kautto
 Doing Quantitative Research 26E02900, 6 ECTS Lecture 6: Structural Equations Modeling Olli-Pekka Kauppila Daria Kautto Session VI, September 20 2017 Learning objectives 1. Get familiar with the basic idea
Analysis and Interpretation of Data Part 1
 Analysis and Interpretation of Data Part 1 DATA ANALYSIS: PRELIMINARY STEPS 1. Editing Field Edit Completeness Legibility Comprehensibility Consistency Uniformity Central Office Edit 2. Coding Specifying
CHILD HEALTH AND DEVELOPMENT STUDY
 CHILD HEALTH AND DEVELOPMENT STUDY 9. Diagnostics In this section various diagnostic tools will be used to evaluate the adequacy of the regression model with the five independent variables developed in
Research Methods in Forest Sciences: Learning Diary. Yoko Lu December Research process
 Research Methods in Forest Sciences: Learning Diary Yoko Lu 285122 9 December 2016 1. Research process It is important to pursue and apply knowledge and understand the world under both natural and social
NORTH SOUTH UNIVERSITY TUTORIAL 2
 NORTH SOUTH UNIVERSITY TUTORIAL 2 AHMED HOSSAIN,PhD Data Management and Analysis AHMED HOSSAIN,PhD - Data Management and Analysis 1 Correlation Analysis INTRODUCTION In correlation analysis, we estimate
6. Unusual and Influential Data
 Sociology 740 John ox Lecture Notes 6. Unusual and Influential Data Copyright 2014 by John ox Unusual and Influential Data 1 1. Introduction I Linear statistical models make strong assumptions about the
Describe what is meant by a placebo Contrast the double-blind procedure with the single-blind procedure Review the structure for organizing a memo
 Please note the page numbers listed for the Lind book may vary by a page or two depending on which version of the textbook you have. Readings: Lind 1 11 (with emphasis on chapters 10, 11) Please note chapter
Overview of Lecture. Survey Methods & Design in Psychology. Correlational statistics vs tests of differences between groups
 Survey Methods & Design in Psychology Lecture 10 ANOVA (2007) Lecturer: James Neill Overview of Lecture Testing mean differences ANOVA models Interactions Follow-up tests Effect sizes Parametric Tests
Citation for published version (APA): Ebbes, P. (2004). Latent instrumental variables: a new approach to solve for endogeneity s.n.
: Ebbes, P. (2004). Latent instrumental variables: a new approach to solve for endogeneity s.n.") University of Groningen Latent instrumental variables Ebbes, P. IMPORTANT NOTE: You are advised to consult the publisher's version (publisher's PDF) if you wish to cite from it. Please check the document
University of Groningen Latent instrumental variables Ebbes, P. IMPORTANT NOTE: You are advised to consult the publisher's version (publisher's PDF) if you wish to cite from it. Please check the document
The SAGE Encyclopedia of Educational Research, Measurement, and Evaluation Multivariate Analysis of Variance
 The SAGE Encyclopedia of Educational Research, Measurement, Multivariate Analysis of Variance Contributors: David W. Stockburger Edited by: Bruce B. Frey Book Title: Chapter Title: "Multivariate Analysis
Results & Statistics: Description and Correlation. I. Scales of Measurement A Review
 Results & Statistics: Description and Correlation The description and presentation of results involves a number of topics. These include scales of measurement, descriptive statistics used to summarize
CHAPTER 3 RESEARCH METHODOLOGY
 CHAPTER 3 RESEARCH METHODOLOGY 3.1 Introduction 3.1 Methodology 3.1.1 Research Design 3.1. Research Framework Design 3.1.3 Research Instrument 3.1.4 Validity of Questionnaire 3.1.5 Statistical Measurement
Still important ideas
 Readings: OpenStax - Chapters 1 13 & Appendix D & E (online) Plous Chapters 17 & 18 - Chapter 17: Social Influences - Chapter 18: Group Judgments and Decisions Still important ideas Contrast the measurement
A COMPARISON BETWEEN MULTIVARIATE AND BIVARIATE ANALYSIS USED IN MARKETING RESEARCH
 Bulletin of the Transilvania University of Braşov Vol. 5 (54) No. 1-2012 Series V: Economic Sciences A COMPARISON BETWEEN MULTIVARIATE AND BIVARIATE ANALYSIS USED IN MARKETING RESEARCH Cristinel CONSTANTIN
Regression CHAPTER SIXTEEN NOTE TO INSTRUCTORS OUTLINE OF RESOURCES
 CHAPTER SIXTEEN Regression NOTE TO INSTRUCTORS This chapter includes a number of complex concepts that may seem intimidating to students. Encourage students to focus on the big picture through some of
Midterm project due next Wednesday at 2 PM
 Course Business Midterm project due next Wednesday at 2 PM Please submit on CourseWeb Next week s class: Discuss current use of mixed-effects models in the literature Short lecture on effect size & statistical
SW 9300 Applied Regression Analysis and Generalized Linear Models 3 Credits. Master Syllabus
 SW 9300 Applied Regression Analysis and Generalized Linear Models 3 Credits Master Syllabus I. COURSE DOMAIN AND BOUNDARIES This is the second course in the research methods sequence for WSU doctoral students.
Differential Item Functioning
 Differential Item Functioning Lecture #11 ICPSR Item Response Theory Workshop Lecture #11: 1of 62 Lecture Overview Detection of Differential Item Functioning (DIF) Distinguish Bias from DIF Test vs. Item
(C) Jamalludin Ab Rahman
 Jamalludin Ab Rahman") SPSS Note The GLM Multivariate procedure is based on the General Linear Model procedure, in which factors and covariates are assumed to have a linear relationship to the dependent variable. Factors. Categorical
SPSS Note The GLM Multivariate procedure is based on the General Linear Model procedure, in which factors and covariates are assumed to have a linear relationship to the dependent variable. Factors. Categorical
M15_BERE8380_12_SE_C15.6.qxd 2/21/11 8:21 PM Page Influence Analysis 1
 M15_BERE8380_12_SE_C15.6.qxd 2/21/11 8:21 PM Page 1 15.6 Influence Analysis FIGURE 15.16 Minitab worksheet containing computed values for the Studentized deleted residuals, the hat matrix elements, and
CRITERIA FOR USE. A GRAPHICAL EXPLANATION OF BI-VARIATE (2 VARIABLE) REGRESSION ANALYSISSys
 REGRESSION ANALYSISSys") Multiple Regression Analysis 1 CRITERIA FOR USE Multiple regression analysis is used to test the effects of n independent (predictor) variables on a single dependent (criterion) variable. Regression tests
Multiple Regression Analysis 1 CRITERIA FOR USE Multiple regression analysis is used to test the effects of n independent (predictor) variables on a single dependent (criterion) variable. Regression tests
CLASSICAL AND. MODERN REGRESSION WITH APPLICATIONS
 - CLASSICAL AND. MODERN REGRESSION WITH APPLICATIONS SECOND EDITION Raymond H. Myers Virginia Polytechnic Institute and State university 1 ~l~~l~l~~~~~~~l!~ ~~~~~l~/ll~~ Donated by Duxbury o Thomson Learning,,
Problem #1 Neurological signs and symptoms of ciguatera poisoning as the start of treatment and 2.5 hours after treatment with mannitol.
 Ho (null hypothesis) Ha (alternative hypothesis) Problem #1 Neurological signs and symptoms of ciguatera poisoning as the start of treatment and 2.5 hours after treatment with mannitol. Hypothesis: Ho:
Data Analysis in the Health Sciences. Final Exam 2010 EPIB 621
 Data Analysis in the Health Sciences Final Exam 2010 EPIB 621 Student s Name: Student s Number: INSTRUCTIONS This examination consists of 8 questions on 17 pages, including this one. Tables of the normal
Inferential Statistics
 Inferential Statistics and t - tests ScWk 242 Session 9 Slides Inferential Statistics Ø Inferential statistics are used to test hypotheses about the relationship between the independent and the dependent
STATISTICAL METHODS FOR DIAGNOSTIC TESTING: AN ILLUSTRATION USING A NEW METHOD FOR CANCER DETECTION XIN SUN. PhD, Kansas State University, 2012
 STATISTICAL METHODS FOR DIAGNOSTIC TESTING: AN ILLUSTRATION USING A NEW METHOD FOR CANCER DETECTION by XIN SUN PhD, Kansas State University, 2012 A THESIS Submitted in partial fulfillment of the requirements
STATISTICS INFORMED DECISIONS USING DATA
 STATISTICS INFORMED DECISIONS USING DATA Fifth Edition Chapter 4 Describing the Relation between Two Variables 4.1 Scatter Diagrams and Correlation Learning Objectives 1. Draw and interpret scatter diagrams
Simple Linear Regression One Categorical Independent Variable with Several Categories
 Simple Linear Regression One Categorical Independent Variable with Several Categories Does ethnicity influence total GCSE score? We ve learned that variables with just two categories are called binary
Daniel Boduszek University of Huddersfield
 Daniel Boduszek University of Huddersfield d.boduszek@hud.ac.uk Introduction to Correlation SPSS procedure for Pearson r Interpretation of SPSS output Presenting results Partial Correlation Correlation
Moderation in management research: What, why, when and how. Jeremy F. Dawson. University of Sheffield, United Kingdom
 Moderation in management research: What, why, when and how Jeremy F. Dawson University of Sheffield, United Kingdom Citing this article: Dawson, J. F. (2014). Moderation in management research: What, why,
Reveal Relationships in Categorical Data
 SPSS Categories 15.0 Specifications Reveal Relationships in Categorical Data Unleash the full potential of your data through perceptual mapping, optimal scaling, preference scaling, and dimension reduction
Readings: Textbook readings: OpenStax - Chapters 1 13 (emphasis on Chapter 12) Online readings: Appendix D, E & F
 Online readings: Appendix D, E & F") Readings: Textbook readings: OpenStax - Chapters 1 13 (emphasis on Chapter 12) Online readings: Appendix D, E & F Plous Chapters 17 & 18 Chapter 17: Social Influences Chapter 18: Group Judgments and Decisions
Readings: Textbook readings: OpenStax - Chapters 1 13 (emphasis on Chapter 12) Online readings: Appendix D, E & F Plous Chapters 17 & 18 Chapter 17: Social Influences Chapter 18: Group Judgments and Decisions
Lecture 6B: more Chapter 5, Section 3 Relationships between Two Quantitative Variables; Regression
 Lecture 6B: more Chapter 5, Section 3 Relationships between Two Quantitative Variables; Regression! Equation of Regression Line; Residuals! Effect of Explanatory/Response Roles! Unusual Observations! Sample
Correlational Research. Correlational Research. Stephen E. Brock, Ph.D., NCSP EDS 250. Descriptive Research 1. Correlational Research: Scatter Plots
 Correlational Research Stephen E. Brock, Ph.D., NCSP California State University, Sacramento 1 Correlational Research A quantitative methodology used to determine whether, and to what degree, a relationship
7 Statistical Issues that Researchers Shouldn t Worry (So Much) About
 About") 7 Statistical Issues that Researchers Shouldn t Worry (So Much) About By Karen Grace-Martin Founder & President About the Author Karen Grace-Martin is the founder and president of The Analysis Factor.
7 Statistical Issues that Researchers Shouldn t Worry (So Much) About By Karen Grace-Martin Founder & President About the Author Karen Grace-Martin is the founder and president of The Analysis Factor.
One-Way Independent ANOVA
 One-Way Independent ANOVA Analysis of Variance (ANOVA) is a common and robust statistical test that you can use to compare the mean scores collected from different conditions or groups in an experiment.
Regression Including the Interaction Between Quantitative Variables
 Regression Including the Interaction Between Quantitative Variables The purpose of the study was to examine the inter-relationships among social skills, the complexity of the social situation, and performance
Detection of Differential Test Functioning (DTF) and Differential Item Functioning (DIF) in MCCQE Part II Using Logistic Models
 and Differential Item Functioning (DIF) in MCCQE Part II Using Logistic Models") Detection of Differential Test Functioning (DTF) and Differential Item Functioning (DIF) in MCCQE Part II Using Logistic Models Jin Gong University of Iowa June, 2012 1 Background The Medical Council of
Detection of Differential Test Functioning (DTF) and Differential Item Functioning (DIF) in MCCQE Part II Using Logistic Models Jin Gong University of Iowa June, 2012 1 Background The Medical Council of
The University of North Carolina at Chapel Hill School of Social Work
 The University of North Carolina at Chapel Hill School of Social Work SOWO 918: Applied Regression Analysis and Generalized Linear Models Spring Semester, 2014 Instructor Shenyang Guo, Ph.D., Room 524j,
Statistical analysis DIANA SAPLACAN 2017 * SLIDES ADAPTED BASED ON LECTURE NOTES BY ALMA LEORA CULEN
 Statistical analysis DIANA SAPLACAN 2017 * SLIDES ADAPTED BASED ON LECTURE NOTES BY ALMA LEORA CULEN Vs. 2 Background 3 There are different types of research methods to study behaviour: Descriptive: observations,
Effect of Sample Size on Correlation and Regression Coefficients
 Effect of Sample Size on Correlation and Regression Coefficients Swati Gupta 1 Research Scholar, Department of Education, Aligarh Muslim University, India Dr. Mamun Ali Naji Qasem 2 Faculty of Education,
Section 3.2 Least-Squares Regression
 Section 3.2 Least-Squares Regression Linear relationships between two quantitative variables are pretty common and easy to understand. Correlation measures the direction and strength of these relationships.