FACES IV & the Circumplex Model: Validation Study
|
|
|
- Abigayle Horn
- 6 years ago
- Views:
Transcription
1 In Press, Journal of Marital & Family Therapy, 2010 FACES IV & the Circumplex Model: Validation Study David H. Olson Abstract FACES IV was developed to tap the full continuum of the cohesion and flexibility dimensions from the Circumplex Model of Marital and Family Systems. Six scales were developed, with two balanced scales and four unbalanced scales designed to tap low & high cohesion (disengaged and enmeshed) and flexibility (rigid and chaotic). This study provides initial evidence the six scales in FACES IV are reliable and valid. High levels of concurrent, construct and predictive validity were found and new ratio scores measure the balanced and unbalanced level of cohesion and flexibility. A clinical example on the use of FACES IV scores to assess family dynamics, plan the treatment and determine the impact of family therapy is provided. Key words: family assessment, FACES, Circumplex Model, cohesion, flexibility INTRODUCTION FACES IV is the latest version of a family self-report assessment designed to assess family cohesion and family flexibility which are the two central dimensions of the Circumplex Model of Marital and Family Systems (Olson, 2000). Previous self report assessments include three versions of the self-report measure called FACES I, II & III (Family Adaptability and Cohesion Evaluation Scales) and the observational assessment called the Clinical Rating Scale (CRS) (Olson, 2000, Thomas & Olson, 1993, Thomas & Lewis, 1999). This paper is based on dissertation study by Dean Gorall (2002) which tested this version of FACES IV and a dissertation by Judy Tiesel (1994) which helped create the four unbalanced scales used in FACES IV. David H. Olson, Ph.D., Professor Emeritus, Family Social Science, University of Minnesota, 2660 Arthur Street, Roseville, MN ( dolson@prepare-enrich.com). The author wishes to thank Dean Goral and Judy Tiesel for their dissertation projects which are reported in this paper and contributed to the development of FACES IV. Thanks also to Clinton Gudmunson for his work on the confirmatory factor analysis used in this paper.
2 2 More than 1,200 published articles and dissertations have used a version of FACES and/or the Circumplex Model of Marital and Family System (Kouneski, 2002) since the first version of the Model was published (Olson, Sprenkle & Russell, 1979). The concepts of cohesion and flexibility have been defined in various ways, both conceptually and operationally, by researchers and theorists to include various aspects of family functioning (Barber & Buehler 1996; Doherty & Hovander, 1990; Werner, Green, Greenberg, Browne & McKenna, 2001). ). The one constant across these discussions and debates has been the consensus on the importance of cohesion and flexibility in understanding couple and family systems. Goals in Developing FACES IV This paper will describe the development, innovations and the clinical application of the self-report instrument called FACES IV. More details on all aspects of FACES IV are contained in the FACES IV Manual (Olson, 2008). The goals in developing FACES IV were as follows: 1. To develop self-report scales that tap the full dimensions (balanced and unbalanced) of cohesion and flexibility as defined in the Circumplex Model. 2. To develop self-report scales that are reliable, valid and clinically relevant. 3. To develop a family assessment tool that is useful for research and clinical work with families. BRIEF OVERVIEW OF THE CIRCUMPLEX MODEL The Circumplex Model is comprised of three key concepts for understanding family functioning. Cohesion is defined as the emotional bonding that family members have toward one another. Family flexibility is defined as the quality and expression of leadership and organization, role relationship, and relationship rules and negotiations. Flexibility as previously used in the Model was defined as the amount of change in family leadership, role relationships and relationship rules. Communication is defined as the positive communication skills utilized in the couple or family system. The communication dimension is viewed as a facilitating dimension that helps families alter their levels of cohesion and flexibility. The main hypothesis of the Circumplex Model is: Balanced levels of cohesion and flexibility are most conducive to healthy family functioning. Conversely, unbalanced levels of cohesion and flexibility (very low or very high levels) are associated with problematic family functioning. Using the Clinical Rating Scale (CRS) based on the Circumplex Model, there is considerable support for the hypotheses that Balanced levels of cohesion and flexibility are more characteristic of healthy families whereas problem families are typically Unbalanced (Thomas and Olson, 1993 & 1994). Another study by Thomas and Lewis (1999) did both exploratory and confirmatory factor analysis with the CRS. The confirmatory analysis found three clear factors (cohesion, flexibility and communication) and no overlap between factors, indicating excellent construct validity for the CRS (p. 88). The next section addresses the issues with FACES for testing this hypothesis.
3 3 Assessing the Extremes of Cohesion and Flexibility While the CRS is an observational assessment completed by a therapist or rater, FACES is a self-report assessment completed by one or more family members. Using the CRS, the Unbalanced aspects of both cohesion and flexibility are measured and the findings using the CRS support the curvilinear hypotheses. However, the scales from FACES II and III have been consistently found to have a linear relationship with healthy/unhealthy family functioning (Olson, 2000). This linear relationship is hypothesized to occur primarily because FACES does not seem to measure the unbalanced (extremes) areas of cohesion (disengaged and enmeshed) or flexibility (rigid and chaotic). A variety of approaches have been used to assess the full dimensions of cohesion and flexibility. One approach used was a bi-polar response format instead of a Likert response format (based on the suggestions of Pratt and Hansen, 1987). A second approach was to use items based on the Clinical Rating Scale and have families rate themselves in much the same way they are rated by outside observers (based on the suggestions of Perosa and Perosa, 1990). Both of these attempts yielded measures that were linear in relation to family functioning. A significant step in developing the current FACES IV instrument was a study by Tiesel (1994) in which she developed four unbalanced scales aimed specifically at the low and high extremes of cohesion (disengaged and enmeshed) and flexibility (rigid and chaotic). Items were developed by having 154 clinical members of the American Association for Marriage and Family Therapy (AAMFT) rate the degree to which they felt an item was representative of either cohesion or flexibility. Then they rated the item as falling into one of the four extremes. This work yielded four scales tapping the very low and very high levels of cohesion (disengaged & enmeshed) and flexibility (rigid & chaotic). These four scales were found to be reliable and valid, and were able to discriminate between problem and nonproblem families. Using these four unbalanced scales, Craddock (2001) found support for the basic hypothesis that families with higher scores on these scales had higher levels of family stress and lower levels of satisfaction. Franklin, Streeter & Springer (2001) examined these same four scales using factor and correlational analysis and their findings replicated the four scales. They found some cross-loading of items and a.60 correlation between the disengaged and chaotic scales and suggested further work on the independence of these two scales. One limitation of the four scales from Tiesel s (1994) research was that they only tapped the extremes or unbalanced aspects of the cohesion and flexibility dimensions. The balanced region of each dimension was not being adequately assessed. The present research overcomes this limitation by adding balanced scales that assess the middle of the dimension so that the full continuum of the dimensions can be measured.
4 4 METHODS Participants The sampling for the current research was a modified convenience and snowball sample. Respondents were recruited from a junior level family systems and diversity university course in a major Midwestern metropolitan area over a one year period. This initial sample pool consisted of 124 students and represents the convenience portion of the sample. These students were given the option of earning extra credit for the course by having others they know also complete the protocol (the snowball portion of the sample). Of the 124 students asked to participate, 87 returned at least one research form. Students were encouraged to have family members, friends, fellow students or co-workers complete additional forms. A total of 487 respondents completed research forms and 469 had usable data with about 15% being other family members. The final sample had an average age of 28 and a range of 18 to 59. About two-thirds of the sample was single and female, and one-third of the sample was married. About half had a salary of $50,000 or higher. In terms of children in these families, the smallest groups had one child (7 percent) or four children (14%), with the larger percentage having two children (30%), three children (28%) or five children (21%). The majority of the sample (80%) were Caucasian with a smaller percentage that were Asian Americans (7%), African Americans (6%) and Hispanics (2%) or Native American (2%). Measures In taking the assessment package, the parents were asked to describe their current family and the adolescents and young adults (most were college students) were asked to describe their family of origin. FACES IV item pool. The 84 item pool from which the FACES IV instrument was developed included items from FACES I and II, and four scales (disengaged, enmeshed, rigid and chaotic) assessing the high and low extremes of the dimensions developed by Tiesel (1994). Thirty-seven items were selected from the original 111-item FACES I scale (Olson, Portner & Bell, 1982). The items drawn from FACES I include items aimed specifically at tapping the high, low and moderate regions of the cohesion and flexibility dimensions. These 37 items were chosen because previous research by Thorslund (1991) identified the items as having a functional factor structure. Twenty-three items from the thirty-item FACES II instrument were also included in the item pool (Olson, Portner & Bell, 1986). Seven of the FACES II items were not used since they had low alpha reliability and were vaguely worded. FACES II items are moderately worded and aimed at tapping balanced cohesion and balanced flexibility. Twenty four items were selected from four scales (each had six items) developed by Tiesel (1994) to assess the low and extremes of cohesion (disengaged and enmeshed) and low and high extreme of flexibility (rigid and chaotic). The resulting 84 items were included to hopefully tap the full range of each of the cohesion and flexibility dimensions. Three other family assessment scales were used as criterion for the validity of the FACES IV scales. These three scales were the Self-Report Family Inventory, Family Assessment Device and the Family Satisfaction Scale.
5 5 Self-Report Family Inventory (Health/Competence Subscale). The Self-Report Family Inventory (SFI) is a 36-item scale designed to assess the dimensions in the Beavers Systems Model. Fourteen items from the Health/Competence subscale were used in the present research for validation and comparison purposes. The subscale was used because it has been found to be most closely related to general family functioning. The SFI has been found to correlate well with other measures of family functioning (Hampson & Beavers, 1996) and to have a positive linear relationship with the FACES II and III instruments (Hampson, Hulgus & Beavers, 1991). Alpha reliability for the SFI scale was.73. To minimize confusion in answering the SFI with the other scales, the response format for the SFI was slightly altered to match that of the item pool for the FACES IV instrument. Family Assessment Device (FAD, General Functioning Subscale). The 12 item General Functioning Subscale is from the 60-item Family Assessment Device. The subscale has been found to have a linear relationship to family functioning (Epstein, Baldwin & Bishop, 1983) and a linear relationship to the FACES II instrument (Miller, Epstein, Bishop, & Keitner; 1985). The items in the scale were either coded or recoded so that higher numbers represented healthier family functioning. The 12 item General Functioning Subscale has also been found in research to be the only one of the seven sub-scales to assess unique variation in family functioning (Ridenour, Daley, & Reich, 1999). Alpha reliability for the scale was.91. Like for the SFI, the response format for the scale was altered to match that of the FACES IV items. Family Satisfaction Scale. The Family Satisfaction Scale (Olson, 1995) is a scale specifically designed to assess the level of satisfaction family members have with their families functioning. The scale currently assesses ten aspects of family functioning in a tenitem format. These ten items when taken together reveal a single satisfaction factor. Alpha reliability for the scale is.93. RESULTS Factor Analysis Exploratory (maximum likelihood) factor analysis with oblique rotation of all 84 items from the total item pool for development of FACES IV was conducted by Gorall (2002). Exploratory factor analysis and rotation was used because it was unclear how many factors would be found with high eigen values and the degree of overlap between the factors. Five factors were found that represented the following areas: balanced cohesion/disengaged, balanced flexibility, enmeshed, rigid and chaos. The first factor contained 7 balanced cohesion items (all positive loadings) and 7 Disengaged items (all negative loadings). The other five factors contained seven items each above.30 and they were labeled as Balanced Flexibility and three unbalanced extremes of rigid, chaotic and enmeshed. This resulted in 42 items with factor loadings above.30 and 42 items were dropped from further analysis.
6 6 Table 1: FACES IV Factor Analysis 84 Items Item Factor I Balanced Cohesion/Disengaged Factor II Rigid Factor III Chaotic Factor IV Balanced Flexibility Factor V Enmeshed Cohesion 1.84 Cohesion 2.77 Cohesion 3.73 Disengaged Cohesion 4.72 Disengaged Disengaged Cohesion 5.63 Cohesion 6.61 Disengaged Disengaged Cohesion 7.53 Disengaged Disengaged Rigid 1.83 Rigid 2.74 Rigid 3.63 Rigid 4.63 Rigid 5.58 Rigid 6.54 Rigid 7.51 Chaos 1.69 Chaos 2.69 Chaos 3.68 Chaos 4.67 Chaos 5.63 Chaos 6.59 Chaos 7.43 Flexibility 1.65 Flexibility 2.63 Flexibility 3.62 Flexibility 4.53 Flexibility 5.51 Flexibility 6.49 Flexibility 7.48 Enmeshed Enmeshed Enmeshed Enmeshed Enmeshed Enmeshed Enmeshed * Only values of.30 or greater are displayed.
7 7 The analysis clearly demonstrated four factors with seven items each (all positive loadings) and one factor (Balanced cohesion/disengaged) that had seven positive items (Balanced cohesion items) and seven negative items (Disengaged items). We accepted these findings as evidence of two Balanced scales and four Unbalanced scales. In order to determine the number of factors and the factor loadings of the unbalanced items, a maximum likelihood factor analysis with oblique rotation was done of the 42 items from the four unbalanced scales (7 items each) disengaged, enmeshed, chaotic and rigid. When the factor analysis was restricted to four factors, the analysis clearly replicated the four factors found in the initial work of Tiesel (1994) and later studies by Craddock (2001) and Franklin, Streeter & Springer (2001). Examples of an item for each of the four Unbalanced scales is: Disengaged scale-- Family member seem to avoid contact with each other when at home ; Enmeshed scale-- Family members are too dependent on each other ; Rigid scale-- Our family has a rule for almost every possible situation ; Chaotic scale-- We never seem to get organized in our family. To validate the Balanced Cohesion & Balanced Flexibility scales, a factor analysis was done of the 7 highest loading items for each scale from the initial analysis. Seven items were highly loaded (.63 to.83) on the Balanced cohesion factor and seven items loaded (.39 to.69) on the balanced flexibility factor with no item cross-over above.30. These findings replicate the two-factor structure of the balanced items on cohesion and flexibility. Examples of items for Balanced cohesion is: Togetherness is a top priority in our family and for balanced flexibility is: We are able to change leadership in our family. Confirmatory Factor Analysis of FACES IV Confirmatory factor analysis (CFA) differs in approach from exploratory factor analysis by the use of constraints in an analysis of variance/covariance. In the typical exploratory factor analysis, items are free to load on every factor at their respective magnitudes. The number of factors is also left open to change, usually set to a particular Eigen value. In contrast, a confirmatory approach requires the analyst to specify a limited number of factors and indicate precisely where each item will be permitted to load. Typically items are proposed to load on a single factor and loadings with other factors are constrained to be equal to zero. Once the relationships are specified, the entire hypothesized structure is tested against the actual pattern of variances and covariances in the observed data. A total of four tests were conducted; first a CFA of the 42 items selected to represent the six FACES IV scales, and then further testing of these scales in separate tests respectively with each of the three validating scales. In the latter tests, items representing each validation scale were also loaded upon latent factors representing each of the scales used to establish the validity of FACES IV scales. These tests were done separately to enable better estimation and to retain the desired properties of testing with adequate sample size (Bentler and Chou, 1987).
8 8 Figure I. Confirmatory factor analysis results for FACES IV scales e1.62 Enmeshed 1 e2.64 Enmeshed Cohesion Scales e1.60 Chaotic 1 e2.67 Chaotic Flexibility Scales.74 e3 Enmeshed e3 Chaotic 3.80 e4.67 Enmeshed 4 e5.64 Enmeshed 5 e6.63 Enmeshed 6.75 e7 Enmeshed Enmeshed e4.52 Chaotic 4 e5.48 Chaotic 5 e6.40 Chaotic 6 e7.64 Chaotic Chaotic.42 e1 Cohesion e1 Flexibility e2 Cohesion e2 Flexibility e3 Cohesion e3 Flexibility 3.43 e4.48 Cohesion 4 e5.52 Cohesion 5 e6.51 Cohesion 6 e7.30 Cohesion Cohesion Balanced.34 e4.58 Flexibility 4 e5.67 Flexibility 5 e6.49 Flexibility 6 e7.56 Flexibility Flexibility Balanced e1 Disengaged e1 Rigid e2 Disengaged e2 Rigid e3 Disengaged e3 Rigid 3.77 e4.59 Disengaged 4 e5.55 Disengaged 5 e6.44 Disengaged 6 e7.38 Disengaged Disengaged e4.55 Rigid 4 e5.50 Rigid 5 e6.67 Rigid 6 e7.45 Rigid Rigid Model fit: χ 2 = (df = 804, p <.001), IFI =.97; CFI =.97; RMSEA =.058. Correlations between scales of different dimensions not shown (see Table I). Figure 1 shows the results of the hypothesized factor structure for the 42 items representing the scales that belong to the cohesion and flexibility dimensions of FACES IV. The top and bottom factors represent the extremes of cohesion, both high (enmeshed) and low (disengaged) and flexibility, both high (chaotic) and low (rigid). The balanced scales for cohesion and flexibility are presented in the center of the figure. The fit statistics suggested an acceptable or well fitted model. The IFI and CFI were both equal to.97 and the RMSEA equaled.058. Figure 1 also shows the factor loadings for all 42 items on their respective scales and reveal a fairly even loading pattern with high loadings. Loadings for balanced cohesion
9 9 averaged.75 and ranged from.69 to.84. Loadings at the extreme high of cohesion averaged.57 for the enmeshed scale (range.50 to.61) and at the extreme low of cohesion.70 for the disengaged scale (range.64 to.79). Similarly strong patterns were found for the dimension of flexibility. Loadings for balanced flexibility averaged.65 and ranged from.43 to.79. Loadings at the extreme high of flexibility averaged.69 for the chaotic scale (range.58 to.80) and at the extreme low of flexibility,.63 for the rigid scale (range.41 to.77). The curved double-headed arrows shown in Figure 1 represent the correlations between the scales within each dimension. Balanced cohesion had a strong negative correlation with the disengaged scale (r = -.90), but had a low negative correlation with the enmeshed scale (r = -.15). Balanced flexibility had a strong negative correlation with the chaotic scale (r = -.70), but a low negative correlation with the rigid scale (r = -.12). The extreme scales are moderately correlated with each other for the two unbalanced cohesion scales (disengaged and enmeshed r =.34; shared variance =.11) and for the two unbalanced flexibility scales ( rigid and chaotic r =.15; shared variance =.02). This is evidence for the independence and value of separate scales for the unbalanced extremes of cohesion and flexibility. Correlation Analysis of Scales A correlation analysis was done of the six scales to assess the relationships between the six scales (see Table 2). The two balanced scales of cohesion and flexibility were highly correlated (r =.60; shared variance =.36) which is similar to the findings with the previous studies of FACES II and III. This demonstrates the concordance in balanced family functioning where healthy functioning is greatest. Conceptually, the cohesion dimension contains balanced cohesion (central area) with enmeshed (high unbalanced) and disengaged (low unbalanced). The findings were a high negative correlation of balanced cohesion and disengaged ( r = -.80) and a low negative correlation ( r = -.15) between balanced and enmeshed. The two unbalanced areas were positively correlated ( r =.27), indicating that the unbalanced areas are related. Conceptually, the flexibility dimension contains balanced flexibility (central area) with chaotic (high unbalanced) and rigid (low unbalanced). The findings demonstrated that balanced flexibility had a high negative correlation ( r = -.53) with chaotic and almost no correlation between balanced flexibility and rigidity ( r = -.05). The two unbalanced areas of rigid and chaotic were not significantly correlated. The two unbalanced scales of disengaged and chaotic were highly correlated ( r =.60), which indicates that family systems that are disengaged may also be chaotic, and vice versa. Looking across dimension analysis, balanced cohesion had a high negative relationship to the chaotic scale (r = -.68) but with low negative relationship to the rigid scale ( r = -.11). Also, balanced flexibility has a high negative relationship with the disengaged scale ( r = -.82 ), but a low correlation with the enmeshed scale (r = -.09).
10 10 Table 2: Correlation & Reliability of FACES IV Scales Balanced Cohesion Enmeshed Disengaged Balanced Flexibility *Correlation is significant at p >.01; Alpha reliability in bold. Chaotic Reliability of Six Scales An alpha reliability analysis was conducted to examine the internal consistency of the six scales (See Table 1). Reliability of the six FACES IV scales is as follows: Enmeshed =.77, Disengaged =.87, Balanced Cohesion =.89, Chaotic =.86, Balanced Flexibility =.84, Rigid =.82. In general, the alpha reliability was very good for all six scales. Correlations of FACES IV with Validation Scales Additional confirmatory factor analyses were run with FACES IV scales respectively with each of the three validation scales. These tests were conducted in order to obtain correlations between the scales of FACES IV and the validation scales. Each of the validating scales was measured or recoded so that higher scores indicated healthier family functioning. The fit statistics (see Table 3) demonstrated acceptable and well-fitting models with fit similar to the initial model. This suggests that the psychometric properties of the validation instruments themselves held up well for the current sample. The correlations between the three family scales and the FACES IV scales were analyzed to determine the validity of the FACES IV scales. Table 3 shows large correlations between most of the FACES IV scales and the validation scales of SFI, FAD and Family Satisfaction. The exceptions are the Enmeshed and Rigid scales which had relatively low correlations with the validating scales (range = -.11 to -.31). The general trend between the FACES IV scales and the validation scales is that the FACES scales designed to measure the balanced (healthy regions) of cohesion and flexibility had large positive correlations with the validation scales (range =.89 to.99), while the FACES scales designed to measure the low extreme of cohesion (disengaged) and the high extreme of flexibility (chaotic) had large negative correlations with the validation scales (range = -.67 to -.93). The exceptions were the rigid and enmeshed scales which had the lowest negative correlations with the validity scales. In summary, the validity of the Balanced cohesion and flexibility scales were highly supported as were the Unbalanced disengaged and chaotic scales, but the two scales that were the weakest were the rigid and enmeshed scales. Rigid 1 Balanced Cohesion.89 2 Enmeshed Disengaged -.80*.27*.87 4 Balanced Flexibility.60* *.84 5 Chaotic -.53*.36*.60* Rigid *
11 11 Table 3: Correlations of latent scales of FACES IV with validation scales. FACES IV Scale Self-report Family Inventory (SFI) Validation Scales Family Satisfaction Scale (FSS) Family Assessment Device (FAD) Cohesion Scales Enmeshed Balanced Cohesion Disengaged Flexibility Scales Chaotic Balanced Flex Rigid Model Fit Chi-square (df) (1463) (1253) (1356) CFI IFI RMSEA Scale alpha reliability Curvilinearity Measured by Balanced/Unbalanced Ratio Scores One of the conceptual and empirical challenges of the cohesion and flexibility dimensions in the Circumplex Model is that they are hypothesized to be curvilinear too much or too little cohesion or flexibility is unhealthy while moderate levels are more healthy. One step in resolving this challenge has been to create separate scores for the healthy (balanced) and unhealthy (unbalanced) cohesion and flexibility. The second step was to create a score that assesses the ratio of healthy and unhealthy cohesion and flexibility. An innovation for testing the hypotheses was the creation of three ratio scores (cohesion ratio, flexibility ratio and total Circumplex ratio) which assesses how balanced or unbalanced the family system is on cohesion and flexibility. Using the two Balanced scales on cohesion and flexibility with the four Unbalanced scales, the ratio score compares the relative amount of balanced versus unbalanced characteristics in a family system. The higher the ratio score is above 1, the more balanced the system. Conversely the lower the ratio score is below 1, the more unbalanced the system. Conceptually, the ratio score assesses the degree to which a system is balanced or unbalanced on cohesion and flexibility. Empirically, the Cohesion Ratio score is calculated by dividing the Balanced Cohesion score by the average of the two unbalanced scales (Disengaged and Enmeshed). The Flexibility Ratio is calculated by dividing the Balanced Flexibility score by the average of the two unbalanced scales (Rigid and Chaotic). A Circumplex Total Ratio was also created to provide a summary of a family s balanced
12 12 (health) and unbalanced (problem) characteristics in a single score. The total ratio was calculated by dividing the average of the two balanced scales (Cohesion and Flexibility) by the average of the four unbalanced scales (Rigid, Enmeshed, Chaotic and Rigid). The major hypothesis of the Circumplex Model is that healthy families are more balanced while problem families are more unbalanced. This hypothesis can now be tested using the ratio scores for cohesion, flexibility and total Circumplex. Empirically, this means that healthy families will have ratio scores above one (indicating more balanced than unbalanced), while problematic families will have a ratio score below one. In summary, the ratio score enables one to determine the degree to which a system is healthy or unhealthy. The ratio score is very useful for research since there is one score assessing the balanced/unbalanced functioning for each dimension and the combined model. The ratio scores are not useful in clinical work and the scores can not be used to place a person s onto the Circumplex Model. However, the research value of the scale is very important for testing hypotheses related to the model. Discriminant Analysis of FACES IV Scales To determine the ability of the FACES IV scales to distinguish between problem and non-problem family systems, a discriminant analysis was run for the FACES IV scales and the validation scales (see Table 4). Since there were no specific criteria or symptoms to assess problem from non-problem families, the problem group was based on each person s score on each family assessment. The results are displayed for each of the six scales entered as individual independent discriminators of the problem/non-problem groupings, as well as for an analysis where the six scales were entered together as the independent variable. Grouping for the discriminant analysis was done based upon a person s scores on family instruments previously established as valid measures. If a subject scored in the top 50% on the SFI and the top 50% on the FAD (FAD scoring was reversed so that higher scores indicated more healthy functioning) they were assigned to the non-problem group. If a person scored in the bottom 50% of the SFI and the bottom 50% of the FAD they were assigned to the problem group. Results for the discriminant analysis based on this grouping are listed in column 1 in Table 4. Problem/non-problem groups were also created based on respondents being in the top (healthiest) vs. bottom (most problematic) 40% on both the SFI and FAD (column 2, Table 4). Similar problem/non-problem groups were created by using top vs. bottom 50 and 40% breaks based on individuals scores on the Family Satisfaction Inventory (columns 3-4 in Table 4).
13 13 Table 4: Discriminant Analysis of Problem and Non-Problem Families Scale (Percent Accuracy in Discriminating Groups) Top vs. Top vs. Top vs. Bottom 50% Bottom 40% Bottom On SFI & On SFI & 50 % on FAD FAD Family Satisfaction Top vs. Bottom 40% on Family Satisfaction N for Each Group Top = 199 Bottom = 192 Top = 142 Bottom = 149 Top = 231 Bottom = 228 Top = 211 Bottom =177 Unbalanced Scales Disengaged Chaos Enmeshed Rigid Balanced Scales Cohesion Flexibility Six Scales Together Dimension Ratios Cohesion Ratio Flexibility Ratio Total Ratio Validation Scales SFI # # FAD # # Family Satisfaction # #
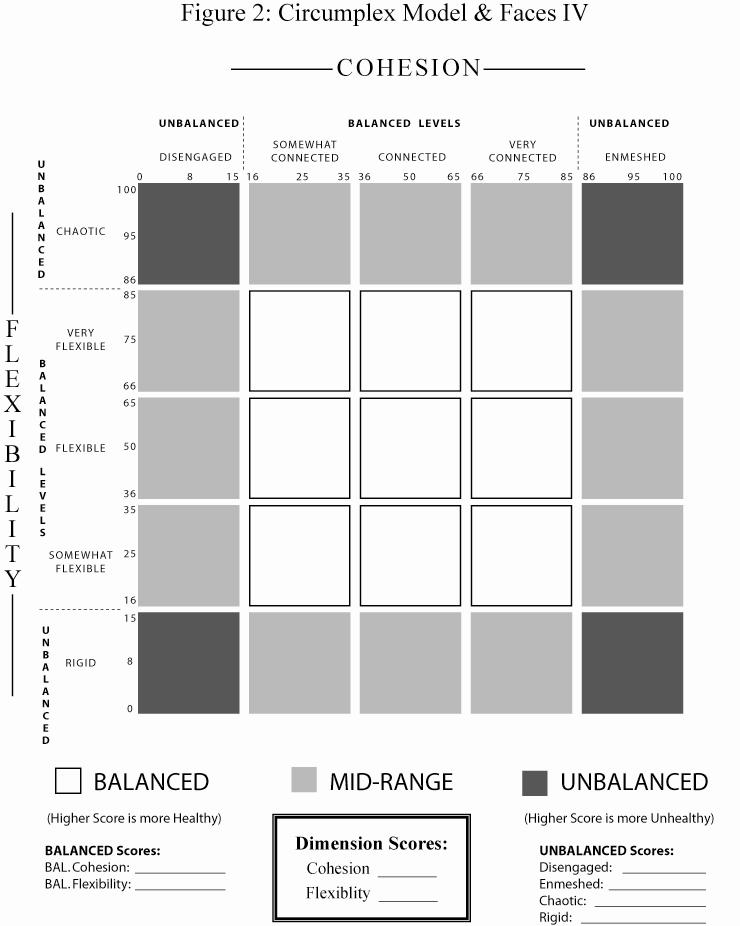
14 14 The problem/non-problem grouping method that resulted in the greatest ability of the scales to discriminate was the top vs. bottom 40% on validation scales of FAD and SFI method. The range of correct placement was from 55% to 94%, with an average for the FACES IV scales of 78%. When all six scales were used in the analysis, the predictive accuracy averaged 92%, with a range from 84% to 99%. When the Circumplex Total Ratio score was used the predictive accuracy was 85%, ranging from 80% to 91%. In summary, these analyses demonstrate the predictive validity of the FACES IV scales. Dimension Scores on Cohesion and Flexibility for Plotting Scores on Circumplex Model The dimension score was created to summarize the balanced and unbalanced scores on each dimension so that it would be possible to plot the location of the person/family on the Circumplex Model. Theoretically, the dimension score is valuable because it summarizes the level of balanced and unbalanced characteristics in a family system. So there is a dimension score for Cohesion and Flexibility (see Figure 2). The model now has five levels of cohesion of flexibility, making a total of 25 types of family systems. The nine balanced types are in the central area of the model and there are 12 mid-range types are balanced on one dimension and unbalanced on the other dimension. The four unbalanced types have unbalanced scores (very high or very low scores) on both cohesion and flexibility. In order to create a single score for cohesion and flexibility dimensions from the two balanced and four unbalanced scales, the following formula was created. This dimension score is created by using the balanced score (for cohesion or flexibility) and adjusting the balanced score up or down the scale based on whether the difference in the two unbalanced scales at the high or low of the dimension. So if the Enmeshed score is higher than Disengaged, then the Balanced cohesion score is adjusted upward. If the Disengaged score is higher than the Enmeshed, the Balanced cohesion score is adjusted downward. Likewise for the Flexibility dimension score, if the Chaotic score is higher than the Rigid score, then the Balanced flexibility score is adjusted upward. However, if the Rigid score is higher than the Chaotic score, then the Balanced Flexibility is adjusted downward. Percentile scores are used for each scale and they are based on the raw scores. The formulas are: Cohesion = Balanced cohesion + ((Enmeshed Disengaged) / 2)); Flexibility = Balanced flexibility + ((Chaotic Rigid) /2)). The major advantage of the dimension score is that it provides one score for both cohesion and flexibility that can be used for plotting onto the Circumplex Model. The dimension scores are not designed to be used for research.
15 15
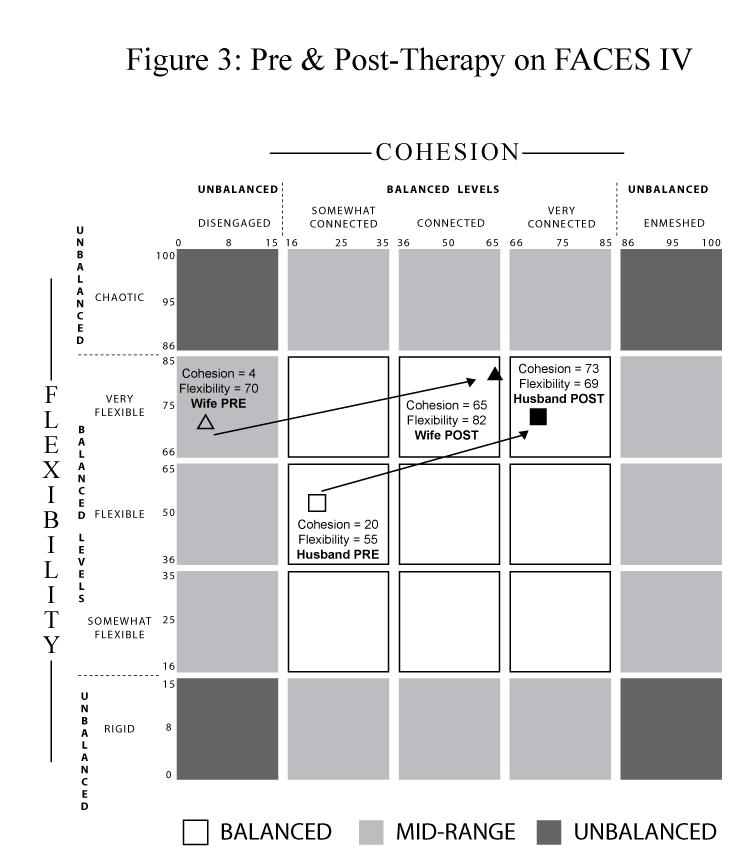
16 16 CLINICAL APPLICATION OF FACES IV The following is a clinical example of use of the FACES IV instrument with a family where the presenting problem was significant emotional and behavioral problems exhibited by two children in the family. Peggy and Doug are a married couple in their mid 30 s who had 3 children, Alex age 10, Sam age 8, and Taylor age 3. The couple began having trouble with emotional outbursts and oppositional behavior in both of their older children from an early age. They tried every different parenting approach they could imagine and read every book on handling difficult children. Their children experienced difficulties in daycare, so Doug and Peggy sought more intensive services to assist them in handling the challenges posed by their boys. After being seen by a child psychiatrist, both Alex and Sam were diagnosed with an early onset of bipolar disorder. Medication was prescribed to aid in reducing the turbulence of the emotions and behavioral difficulties experienced by the brothers. In conjunction with psychiatric services, intensive family therapy services were instituted to assist the parents in adapting their parenting styles and approaches. At the same time couples therapy was initiated when the therapists conducting the family therapy determined that significant couple conflict prevented the parents from cooperatively instituting any of the parenting approaches they had attempted in the past. Clinical Assessment using FACES IV FACES IV was administered to assess the potential strength and growth areas of the family. Dimension scores on FACES IV from the two parents are plotted on to Figure 3 of the Circumplex Model. At the initial assessment (pre-test), the wife saw the family as Very Flexible (70) and Disengaged (4) and the husband described the family as Flexible (50) and Somewhat Connected (20) (See Table 5 and Figure 3). While the dimension scores are useful for summarizing and plotting cohesion and flexibility on the Circumplex Model, these scores do not provide the specific levels of scores on the two balances scales and the four unbalanced scales which are useful in clinical assessment. On the Balanced scales, both the husband and wife described low balanced cohesion (27 and 18 respectively) and moderate balanced flexibility (45 and 54 respectively). Both the husband and wife felt their family was disengaged (55 and 87 respectively) and chaotic (74 and 90 respectively). The high levels of Disengagement and low levels of Balanced Cohesion indicate a lack of emotional closeness they both feel in family. The high level of chaos reported by both the husband and wife was an indicator of problems with organization and leadership that the couple could not effectively provide in parenting the two boys.
17 17 Table 5: FACES IV Scales: Pre & Post Family Therapy Husband Pre Husband Post Wife Pre Wife Post Balanced Scales Unbalanced Scales Dimension Scores Cohesion Flexibility Disengaged Enmeshed Rigid Chaotic Cohesion Flexibility *Dimension Scores on FACES IV Cohesion Dimension Score = Balanced Cohesion + (Enmeshed Disengaged) 2 Flexibility Dimension Score = Balanced Flexibility + (Chaotic Rigid) 2
18
19 Family Treatment & Post Assessment: Therapeutic work with the couple and family was guided by FACES IV results and clinical observations. Intervention focused on increasing the emotional bonding in the couple relationship to enable Doug and Peggy to more effectively function as a co-parenting unit. As the couple relationship improved over time, they also improved at reducing the chaos as they began to work more as a team. They implemented specific parenting techniques aimed at increasing structure and consistency in the home for the boys, as well as increasing the positive emotional connections between the parents and children. The post therapy FACES IV results reflect the significant positive changes made in both closeness and flexibility (see Figure 3). Peggy increased two levels on cohesion from being disengaged to connected but remained at very flexible. Doug increased two levels on cohesion from somewhat connected to very connected and also increased one level on flexibility from flexible to very flexible. In looking at the unbalanced scales, Peggy dropped in disengaged from 87% to 13%. Also, both Doug and Peggy dropped on the chaos scale from pre-test to post-test (74% to 32% for Doug; 90% to 43% for Peggy). In summary, this intake assessment and post-therapy assessment enables the therapist to see the progress in the therapeutic process. The initial assessment provided information on how the system is functioning and helped the therapist develop a treatment plan. The six scales provide a more complete picture of Balanced and Unbalanced scales as perceived by each family member. The post assessment demonstrated the progress as perceived by the family members. DISCUSSION Validation of FACES IV The goal of this project was to create a self report family assessment that would in a reliable and valid manner effectively measure the full dimensions of cohesion and flexibility as defined by the Circumplex Model. This theoretical model defined cohesion as moving from low unbalanced (disengaged), to 3 levels of balanced cohesion to high unbalanced (enmeshed). Flexibility was defined as low unbalanced (rigid), to 3 levels of balanced flexibility to high unbalanced (chaotic). Previous work on FACES II and III helped to create balanced cohesion and balanced flexibility for FACES IV, and four separate scales were created to measure the unbalanced extremes. The findings from this study clearly demonstrated that the six scales created for FACES IV were reliable and were valid. Content validity for the four unbalanced scales was found based on family therapists from AAMFT who described the items as accurately representing the four unbalanced areas. Construct validity was demonstrated by confirmatory factor analysis and concurrent validity was found using three other family scales. Predictive validity was demonstrated by the findings from the discriminant analysis. However, this is only the first validation study of FACES IV and studies with more diverse populations are needed. There has been some discussion in the literature about the dimension of cohesion and how enmeshment relates to cohesion. While some family therapists like Minuchin (1974) have described enmeshment on the same dimension as cohesion like in the Circumplex Model, some
20 researchers (Barber and Buehler, 1996) have conceptualized enmeshment as a distinct scale from cohesion. In this project, balanced cohesion was hypothesized to be positively related to family function and enmeshment (unbalanced scale) as negatively related family functioning. The current study found that balanced cohesion was positively related to family functioning and enmeshment was negatively related to family functioning across all the validation scales. In a recent cross-cultural study comparing cohesion and enmeshment in United Kingdom and Italy, they found the two factors loaded on different factors and cohesion (balanced) was related to positive family functioning in both cultures, but enmeshment was found to be related to positive functioning in the United Kingdom but not in Italy (Manzi, Vignoles, Regalia and Scabini, 2006). Balanced Cohesion and Balanced Flexibility in FACES IV were derived in part from the cohesion and flexibility scales in FACES II and III. Because of the similarity of the Balanced Cohesion and Balanced Flexibility to the FACES II and III scales, it is possible to compare past research on FACES with the new findings of the balanced scales in FACES IV. In those studies, higher levels of cohesion, and to a lesser extent flexibility, were associated with better family functioning. New in FACES IV are the four unbalanced scales which each assess one of the four extremes or unbalanced areas of the Cohesion and Flexibility dimensions. The combination of the six scales provides a more comprehensive assessment of family functioning. In summarizing the findings with the six scales, balanced cohesion and balanced flexibility were positively related to healthy family functioning and the four unbalanced scales were negatively related to healthy family functioning. For the four unbalanced scales, the disengaged and chaotic scales were the most powerful statistically, while the rigid and enmeshed scales were empirically weaker and need more work to improve their potency. Percentile, Ratio and Dimension Scores Three scores were created for use in clinical work and research using FACES IV and they are percentile scores, ratio scores and dimension scores. Percentile scores can be used for both research or clinical work. Ratio scores are only designed for research and dimensions scores are only designed for plotting the scores onto the Circumplex Model. Percentile scores can be obtained for the six scales, 2 balanced and 4 unbalanced, a based on raw scores. The percentile score can be used both clinically and for research. Clinically, individual and multiple family members scores on the six scales can be plotted onto a summary profile. This is useful in comparing how they each describe their family system and for comparing balanced and unbalanced scores. Ratio scores are a new research measure that can be used to determine the ratio of balanced versus unbalanced scores and there is a cohesion ratio, flexibility ratio and total Circumplex ratio score. This is a statistical method for testing curvilinear relationships since a ratio above one indicates more balance than unbalance in a family system while a ratio score below one indicates a system that is more unbalanced. While this ratio is very useful for research, it is generally not that useful clinically.
21 Dimension scores are used for plotting the cohesion and flexibility onto the Circumplex Model, but they should not be used for research. The dimension score adjusts the balanced cohesion scores based on the difference between the disengaged and enmeshed scales. If the disengaged score is higher than enmeshed, the balanced cohesion score is adjusted downward based the size of the difference. An example of the value of the dimension scores is illustrated in the clinical example plotted onto the Circumplex Model (see Figure 3). Limitations of Research A limitation of this study with FACES IV was the use of a convenience sample of nonclinical families. Both these issues limits the variability in the scale scores and limits the how much the results can be generalized to other more diverse families. Not having a clearly identified clinical sample, the groups were created based on their scores on the three validation scales Self Report Family Inventory (SFI), the Family Assessment Device (FAD) and Family Satisfaction (FS). It is, therefore, highly recommend that future studies with FACES IV use clinical and non-clinical samples of couples and families. Also, it is important for the future development of FACES IV for the scale to be used with more diverse populations in terms of types of problems (drug abuse, delinquency, abuse, healthy/happy etc.), ethnicity and cultural background, family size and structure (single parent, two parent, step families, etc.) family income, education and social class. Alpha reliability and test re-test reliability needs to be computed for FACES IV with more diverse populations. While the scales for balanced cohesion and balanced flexibility worked very well empirically as did the unbalanced scales of disengaged and chaotic, the enmeshed and rigid scales still need more work to improve their reliability and the amount of variance they account for in research. Perhaps the enmeshed and rigid scales would be more useful and reliable if the sample included younger children rather than college students. To test the degree to which the factors relate to the theoretical model, confirmatory factor analysis was conducted. This analysis confirmed the validity of the resulting scales, but these results need to be replicated with new more diverse samples using confirmatory factor analysis. Because of the non-clinical sample used in this study, it was not possible to truly create truly distinct non-clinical versus clinical groups for the discriminant analysis. Also, discriminant analysis should be interpreted with caution since it tends to maximize the rate of accuracy in predictive outcomes. Another limitation of discriminant analysis is that in many cases it is only measuring how well one instrument measures similar concepts. Again, using clinically distinct groups will help more adequately testing the validity of FACES IV. An important area for further study would be to include multiple family members since we know that there is a low correlation between family members. Another valuable study would be to compare results from the self-report FACES IV with clinical ratings of couples and families using the Clinical Rating Scale of the Circumplex Model. In conclusion, a major goal is to continue to develop FACES IV and expand its relevance, reliability, validity, and national norms with more diverse populations. The previous versions of FACES were used in over 1,000 studies, but the data was not pooled for scientific analysis. With FACES IV, we are encouraging those who use the scale to voluntarily provide their data so that a national database can be created for developing national norms, and conducting further reliability and validity analysis with more diverse populations.
22 References Barber, B. K., & Buehler, C. (1996). Family cohesion and enmeshment: Different constructs, different effects. Journal of Marriage and the Family, 58, Bentler, P. M., & Chou, C. P. (1987). Practical issues in structural modeling. Sociological Methods and Research, 16, Craddock, A. E. (2001). Relationships between family structure and family functioning: A test of Tiesel and Olson's revision of the circumplex model. Journal of Family Studies, 7, Doherty, W. J., & Hovander, D. (1990). Why don t family measures of cohesion and control behave the way they re supposed to? The American Journal of Family Therapy, 18, Epstein, N. B., Baldwin, L., & Bishop, D. (1983). The McMaster family assessment device. Journal of Marital and Family Therapy, 9, Franklin, C., Streeter, C. L., & Springer, D. W. (2001). Validity of the FACES IV family assessment measure. Research on Social Work Practice, 5, Gorall, D.M. (2002). FACES IV and the Circumplex Model of Marital & Family System. Dissertation Abstract International, University of Michigan, 63. Hampson, R. B., Beavers, W. R. (1996). Measuring family therapy outcome in a clinical setting: Families that do better or do worse in therapy. Family Process, 35, Hampson, R. B., Hulgus, Y. F., & Beavers, W. R. (1991). Comparisons of self-report measures of the Beavers systems model and Olson's circumplex model. Journal of Family Psychology, 4, Kouneski,E, (2001). Circumplex model and FACES: Review of literature. Available online at: Manzi, C. Vignoles, V.L., Regalia, C. & Scabini, E. (2006). Cohesion and enmeshment revisited: Differentiation, identity, and well-being in two European cultures. Journal of Marriage and Family, 68, Miller, I. W., Epstein, N. B., Bishop, D. S., & Keitner, G. I. (1985). The McMaster family assessment device: Reliability and validity. Journal of Marital and Family Therapy, 11, Minuchin, S. (1974). Family and family therapy. Boston, MA: Harvard University Press. Olson, D.H. (2000). Circumplex Model of Family Systems. Journal of Family Therapy. 22, 2, Olson, D. H. (1995). Family Satisfaction Scale. Minneapolis, MN: Life Innovations. Olson, D. H. (2008) FACES IV Manual. Minneapolis, MN: Life Innovations. Olson, D. H., Sprenkle, D. H., & Russell, C. (1979). Circumplex model of marital and family systems: I. Cohesion and adaptability dimensions, family types, and clinical applications. Family Process, 18, Olson, D. H., Portner, J., & Bell, R. (1986). FACES I Manual. Minneapolis, MN: University of Minnesota and Life Innovations. Perosa, L. & Perosa, S. (1990). The use of a bipolar item format for FACES IV: A reconsideration. Journal of Marital and Family Therapy, 16, Pratt, D.M. & Hansen, J.C. (1987). A test of the curvilinear hypothesis with FACES II and III. Journal of Marital and Family Therapy, 13, Ridenour, T. A., Daley, J. G., & Reich, W. (1999). Factor analyses of the family assessment device. Family Process, 38,
FACES IV & the Circumplex Model: Validation Study
 FACES IV & the Circumplex Model: Validation Study David H. Olson Dean M. Gorall Judy W. Tiesel 2007 ABSTRACT FACES IV was developed to tap the full continuum of the cohesion and flexibility dimensions
FACES IV & the Circumplex Model
 FACES IV & the Circumplex Model David H. Olson & Dean M. Gorall 2006 ABSTRACT There are a variety of innovations integrated into FACES IV; first, six scales new (2 balanced and four unbalanced) were developed
Family Assessment Device (FAD)
") Outcome Measure Sensitivity to Change Population Domain Type of Measure ICF-Code/s Description Family Assessment Device (FAD) No Paediatric and adult Family Environment Self-report d7, d9 The Family Assessment
Outcome Measure Sensitivity to Change Population Domain Type of Measure ICF-Code/s Description Family Assessment Device (FAD) No Paediatric and adult Family Environment Self-report d7, d9 The Family Assessment
The Youth Experience Survey 2.0: Instrument Revisions and Validity Testing* David M. Hansen 1 University of Illinois, Urbana-Champaign
 The Youth Experience Survey 2.0: Instrument Revisions and Validity Testing* David M. Hansen 1 University of Illinois, Urbana-Champaign Reed Larson 2 University of Illinois, Urbana-Champaign February 28,
Confirmatory Factor Analysis of Preschool Child Behavior Checklist (CBCL) (1.5 5 yrs.) among Canadian children
 (1.5 5 yrs.) among Canadian children") Confirmatory Factor Analysis of Preschool Child Behavior Checklist (CBCL) (1.5 5 yrs.) among Canadian children Dr. KAMALPREET RAKHRA MD MPH PhD(Candidate) No conflict of interest Child Behavioural Check
Confirmatory Factor Analysis of Preschool Child Behavior Checklist (CBCL) (1.5 5 yrs.) among Canadian children Dr. KAMALPREET RAKHRA MD MPH PhD(Candidate) No conflict of interest Child Behavioural Check
The Personal Profile System 2800 Series Research Report
 The Personal Profile System 2800 Series Research Report The Personal Profile System 2800 Series Research Report Item Number: O-255 1996 by Inscape Publishing, Inc. All rights reserved. Copyright secured
Chapter 9. Youth Counseling Impact Scale (YCIS)
") Chapter 9 Youth Counseling Impact Scale (YCIS) Background Purpose The Youth Counseling Impact Scale (YCIS) is a measure of perceived effectiveness of a specific counseling session. In general, measures
Chapter 9 Youth Counseling Impact Scale (YCIS) Background Purpose The Youth Counseling Impact Scale (YCIS) is a measure of perceived effectiveness of a specific counseling session. In general, measures
Portuguese Validation of FACES-IV in Adult Children Caregivers Facing Parental Cancer. M. Graça Pereira & Ricardo Teixeira
 Portuguese Validation of FACES-IV in Adult Children Caregivers Facing Parental Cancer M. Graça Pereira & Ricardo Teixeira Contemporary Family Therapy An International Journal ISSN 0892-2764 Volume 35 Number
Empirical approaches to family assessment. Journal of Family Therapy, 22 (2):
:") Provided by the author(s) and University College Dublin Library in accordance with publisher policies. Please cite the published version when available. Title Empirical approaches to family assessment
Provided by the author(s) and University College Dublin Library in accordance with publisher policies. Please cite the published version when available. Title Empirical approaches to family assessment
An International Study of the Reliability and Validity of Leadership/Impact (L/I)
") An International Study of the Reliability and Validity of Leadership/Impact (L/I) Janet L. Szumal, Ph.D. Human Synergistics/Center for Applied Research, Inc. Contents Introduction...3 Overview of L/I...5
An International Study of the Reliability and Validity of Leadership/Impact (L/I) Janet L. Szumal, Ph.D. Human Synergistics/Center for Applied Research, Inc. Contents Introduction...3 Overview of L/I...5
Family Influence on Chinese International Students Sense of Coherence
 University of Minnesota Morris Digital Well University of Minnesota Morris Digital Well Undergraduate Research Symposium 2017 Undergraduate Research Symposium 4-2017 Family Influence on Chinese International
The Development of Scales to Measure QISA s Three Guiding Principles of Student Aspirations Using the My Voice TM Survey
 The Development of Scales to Measure QISA s Three Guiding Principles of Student Aspirations Using the My Voice TM Survey Matthew J. Bundick, Ph.D. Director of Research February 2011 The Development of
ORIGINS AND DISCUSSION OF EMERGENETICS RESEARCH
 ORIGINS AND DISCUSSION OF EMERGENETICS RESEARCH The following document provides background information on the research and development of the Emergenetics Profile instrument. Emergenetics Defined 1. Emergenetics
ACDI. An Inventory of Scientific Findings. (ACDI, ACDI-Corrections Version and ACDI-Corrections Version II) Provided by:
 Provided by:") + ACDI An Inventory of Scientific Findings (ACDI, ACDI-Corrections Version and ACDI-Corrections Version II) Provided by: Behavior Data Systems, Ltd. P.O. Box 44256 Phoenix, Arizona 85064-4256 Telephone:
+ ACDI An Inventory of Scientific Findings (ACDI, ACDI-Corrections Version and ACDI-Corrections Version II) Provided by: Behavior Data Systems, Ltd. P.O. Box 44256 Phoenix, Arizona 85064-4256 Telephone:
Drumm, Michael; Carr, Alan; Fitzgerald, Michael. Journal of Family Therapy, 22 (2):
:") Provided by the author(s) and University College Dublin Library in accordance with publisher policies. Please cite the published version when available. Title The Beavers, McMaster and Circumplex Clinical
Provided by the author(s) and University College Dublin Library in accordance with publisher policies. Please cite the published version when available. Title The Beavers, McMaster and Circumplex Clinical
Learning Objectives. Outline. The Dyadic Adjustment Scale: Utility for Rural Marital Assessment
 The Dyadic Adjustment Scale: Utility for Rural Marital Assessment Kara E. Vick, Ph.D. Randal P. Quevillon, Ph.D. Agriwellness Conference August 4, 2009 Learning Objectives To learn why health care providers
An Examination Of The Psychometric Properties Of The CPGI In Applied Research (OPGRC# 2328) Final Report 2007
 Final Report 2007") An Examination Of The Psychometric Properties Of The CPGI In Applied Research (OPGRC# 2328) Final Report 2007 Total funds awarded: $34,980.00 Dates of period of support: November 2005 to August 2006 Sponsoring
An Examination Of The Psychometric Properties Of The CPGI In Applied Research (OPGRC# 2328) Final Report 2007 Total funds awarded: $34,980.00 Dates of period of support: November 2005 to August 2006 Sponsoring
Validity of the Risk & Protective Factor Model
 Validity of the Risk & Protective Factor Model The Use in Evaluation Vicki Schmitt Bruce Frey Michelle Dunham Carol Carman School Program Evaluation and Research (SPEaR) University of Kansas Background
Michael Armey David M. Fresco. Jon Rottenberg. James J. Gross Ian H. Gotlib. Kent State University. Stanford University. University of South Florida
 Further psychometric refinement of depressive rumination: Support for the Brooding and Pondering factor solution in a diverse community sample with clinician-assessed psychopathology Michael Armey David
The most important question in family approach: the potential of the resolve item of the family APGAR in family medicine
 DOI 10.1186/s12930-016-0028-9 Asia Pacific Family Medicine RESEARCH Open Access The most important question in family approach: the potential of the resolve item of the family APGAR in family medicine
Doing Quantitative Research 26E02900, 6 ECTS Lecture 6: Structural Equations Modeling. Olli-Pekka Kauppila Daria Kautto
 Doing Quantitative Research 26E02900, 6 ECTS Lecture 6: Structural Equations Modeling Olli-Pekka Kauppila Daria Kautto Session VI, September 20 2017 Learning objectives 1. Get familiar with the basic idea
VALIDATION OF TWO BODY IMAGE MEASURES FOR MEN AND WOMEN. Shayna A. Rusticus Anita M. Hubley University of British Columbia, Vancouver, BC, Canada
 The University of British Columbia VALIDATION OF TWO BODY IMAGE MEASURES FOR MEN AND WOMEN Shayna A. Rusticus Anita M. Hubley University of British Columbia, Vancouver, BC, Canada Presented at the Annual
Reliability. Internal Reliability
 32 Reliability T he reliability of assessments like the DECA-I/T is defined as, the consistency of scores obtained by the same person when reexamined with the same test on different occasions, or with
Confirmatory Factor Analysis of the BCSSE Scales
 Confirmatory Factor Analysis of the BCSSE Scales Justin Paulsen, ABD James Cole, PhD January 2019 Indiana University Center for Postsecondary Research 1900 East 10th Street, Suite 419 Bloomington, Indiana
Analysis of the Reliability and Validity of an Edgenuity Algebra I Quiz
 Analysis of the Reliability and Validity of an Edgenuity Algebra I Quiz This study presents the steps Edgenuity uses to evaluate the reliability and validity of its quizzes, topic tests, and cumulative
Chapter 3. Psychometric Properties
 Chapter 3 Psychometric Properties Reliability The reliability of an assessment tool like the DECA-C is defined as, the consistency of scores obtained by the same person when reexamined with the same test
Chapter 2 Norms and Basic Statistics for Testing MULTIPLE CHOICE
 Chapter 2 Norms and Basic Statistics for Testing MULTIPLE CHOICE 1. When you assert that it is improbable that the mean intelligence test score of a particular group is 100, you are using. a. descriptive
Oak Meadow Autonomy Survey
 Oak Meadow Autonomy Survey Patricia M. Meehan, Ph.D. August 7, 214 1 Contents Contents 3 List of Figures 3 List of Tables 3 1 Introduction 4 2 Data 4 3 Determining the Number of Factors 5 4 Proposed Model
Psychometric Properties of the Spanish version of the Family Adaptability and Cohesion Evaluation Scale IV
 Psicothema 2017, Vol. 29, No. 3, 414-420 doi: 10.7334/psicothema2016.21 ISSN 0214-9915 CODEN PSOTEG Copyright 2017 Psicothema www.psicothema.com Psychometric Properties of the Spanish version of the Family
Factor Analysis. MERMAID Series 12/11. Galen E. Switzer, PhD Rachel Hess, MD, MS
 Factor Analysis MERMAID Series 2/ Galen E Switzer, PhD Rachel Hess, MD, MS Ways to Examine Groups of Things Groups of People Groups of Indicators Cluster Analysis Exploratory Factor Analysis Latent Class
Personal Well-being Among Medical Students: Findings from a Pilot Survey
 Analysis IN BRIEF Volume 14, Number 4 April 2014 Association of American Medical Colleges Personal Well-being Among Medical Students: Findings from a Pilot Survey Supplemental Information References 1.
Estimates of the Reliability and Criterion Validity of the Adolescent SASSI-A2
 Estimates of the Reliability and Criterion Validity of the Adolescent SASSI-A 01 Camelot Lane Springville, IN 4746 800-76-056 www.sassi.com In 013, the SASSI Profile Sheets were updated to reflect changes
Self-Oriented and Socially Prescribed Perfectionism in the Eating Disorder Inventory Perfectionism Subscale
 Self-Oriented and Socially Prescribed Perfectionism in the Eating Disorder Inventory Perfectionism Subscale Simon B. Sherry, 1 Paul L. Hewitt, 1 * Avi Besser, 2 Brandy J. McGee, 1 and Gordon L. Flett 3
Using the Rasch Modeling for psychometrics examination of food security and acculturation surveys
 Using the Rasch Modeling for psychometrics examination of food security and acculturation surveys Jill F. Kilanowski, PhD, APRN,CPNP Associate Professor Alpha Zeta & Mu Chi Acknowledgements Dr. Li Lin,
Modeling the Influential Factors of 8 th Grades Student s Mathematics Achievement in Malaysia by Using Structural Equation Modeling (SEM)
") International Journal of Advances in Applied Sciences (IJAAS) Vol. 3, No. 4, December 2014, pp. 172~177 ISSN: 2252-8814 172 Modeling the Influential Factors of 8 th Grades Student s Mathematics Achievement
International Journal of Advances in Applied Sciences (IJAAS) Vol. 3, No. 4, December 2014, pp. 172~177 ISSN: 2252-8814 172 Modeling the Influential Factors of 8 th Grades Student s Mathematics Achievement
International Conference on Humanities and Social Science (HSS 2016)
") International Conference on Humanities and Social Science (HSS 2016) The Chinese Version of WOrk-reLated Flow Inventory (WOLF): An Examination of Reliability and Validity Yi-yu CHEN1, a, Xiao-tong YU2,
International Conference on Humanities and Social Science (HSS 2016) The Chinese Version of WOrk-reLated Flow Inventory (WOLF): An Examination of Reliability and Validity Yi-yu CHEN1, a, Xiao-tong YU2,
Personal Style Inventory Item Revision: Confirmatory Factor Analysis
 Personal Style Inventory Item Revision: Confirmatory Factor Analysis This research was a team effort of Enzo Valenzi and myself. I m deeply grateful to Enzo for his years of statistical contributions to
Assessing Measurement Invariance in the Attitude to Marriage Scale across East Asian Societies. Xiaowen Zhu. Xi an Jiaotong University.
 Running head: ASSESS MEASUREMENT INVARIANCE Assessing Measurement Invariance in the Attitude to Marriage Scale across East Asian Societies Xiaowen Zhu Xi an Jiaotong University Yanjie Bian Xi an Jiaotong
PLANNING THE RESEARCH PROJECT
 Van Der Velde / Guide to Business Research Methods First Proof 6.11.2003 4:53pm page 1 Part I PLANNING THE RESEARCH PROJECT Van Der Velde / Guide to Business Research Methods First Proof 6.11.2003 4:53pm
Native American family systems : applications of the circumplex model of families by Amy L Griffith
 Native American family systems : applications of the circumplex model of families by Amy L Griffith A thesis submitted in partial fulfillment of the requirements for the degree of Master of Science in
ALABAMA SELF-ASSESSMENT INDEX PILOT PROGRAM SUMMARY REPORT
 ALABAMA SELF-ASSESSMENT INDEX PILOT PROGRAM SUMMARY REPORT July 7, 2000 A large sample (N = 1,127) of welfare recipient clients were administered the Self-Assessment Index Behavior Data Systems, Ltd. P.O.
ASSESSING THE UNIDIMENSIONALITY, RELIABILITY, VALIDITY AND FITNESS OF INFLUENTIAL FACTORS OF 8 TH GRADES STUDENT S MATHEMATICS ACHIEVEMENT IN MALAYSIA
 1 International Journal of Advance Research, IJOAR.org Volume 1, Issue 2, MAY 2013, Online: ASSESSING THE UNIDIMENSIONALITY, RELIABILITY, VALIDITY AND FITNESS OF INFLUENTIAL FACTORS OF 8 TH GRADES STUDENT
Packianathan Chelladurai Troy University, Troy, Alabama, USA.
 DIMENSIONS OF ORGANIZATIONAL CAPACITY OF SPORT GOVERNING BODIES OF GHANA: DEVELOPMENT OF A SCALE Christopher Essilfie I.B.S Consulting Alliance, Accra, Ghana E-mail: chrisessilfie@yahoo.com Packianathan
MBA 605 Business Analytics Don Conant, PhD. GETTING TO THE STANDARD NORMAL DISTRIBUTION
 MBA 605 Business Analytics Don Conant, PhD. GETTING TO THE STANDARD NORMAL DISTRIBUTION Variables In the social sciences data are the observed and/or measured characteristics of individuals and groups
Journal of Political Economy, Vol. 93, No. 2 (Apr., 1985)
") Confirmations and Contradictions Journal of Political Economy, Vol. 93, No. 2 (Apr., 1985) Estimates of the Deterrent Effect of Capital Punishment: The Importance of the Researcher's Prior Beliefs Walter
Confirmations and Contradictions Journal of Political Economy, Vol. 93, No. 2 (Apr., 1985) Estimates of the Deterrent Effect of Capital Punishment: The Importance of the Researcher's Prior Beliefs Walter
PSYCHOLOGY, PSYCHIATRY & BRAIN NEUROSCIENCE SECTION
 Pain Medicine 2015; 16: 2109 2120 Wiley Periodicals, Inc. PSYCHOLOGY, PSYCHIATRY & BRAIN NEUROSCIENCE SECTION Original Research Articles Living Well with Pain: Development and Preliminary Evaluation of
CLINICAL VS. BEHAVIOR ASSESSMENT
 CLINICAL VS. BEHAVIOR ASSESSMENT Informal Tes3ng Personality Tes3ng Assessment Procedures Ability Tes3ng The Clinical Interview 3 Defining Clinical Assessment The process of assessing the client through
Development of a New Fear of Hypoglycemia Scale: Preliminary Results
 Development of a New Fear of Hypoglycemia Scale: Preliminary Results Jodi L. Kamps, 1 PHD, Michael C. Roberts, 2 PHD, ABPP, and R. Enrique Varela, 3 PHD 1 Children s Hospital of New Orleans, 2 University
Results & Statistics: Description and Correlation. I. Scales of Measurement A Review
 Results & Statistics: Description and Correlation The description and presentation of results involves a number of topics. These include scales of measurement, descriptive statistics used to summarize
Internal Consistency and Reliability of the Networked Minds Social Presence Measure
 Internal Consistency and Reliability of the Networked Minds Social Presence Measure Chad Harms, Frank Biocca Iowa State University, Michigan State University Harms@iastate.edu, Biocca@msu.edu Abstract
Organizational readiness for implementing change: a psychometric assessment of a new measure
 Shea et al. Implementation Science 2014, 9:7 Implementation Science RESEARCH Organizational readiness for implementing change: a psychometric assessment of a new measure Christopher M Shea 1,2*, Sara R
Making a psychometric. Dr Benjamin Cowan- Lecture 9
 Making a psychometric Dr Benjamin Cowan- Lecture 9 What this lecture will cover What is a questionnaire? Development of questionnaires Item development Scale options Scale reliability & validity Factor
Inferential Statistics
 Inferential Statistics and t - tests ScWk 242 Session 9 Slides Inferential Statistics Ø Inferential statistics are used to test hypotheses about the relationship between the independent and the dependent
Structural Validation of the 3 X 2 Achievement Goal Model
 50 Educational Measurement and Evaluation Review (2012), Vol. 3, 50-59 2012 Philippine Educational Measurement and Evaluation Association Structural Validation of the 3 X 2 Achievement Goal Model Adonis
A CONSTRUCT VALIDITY ANALYSIS OF THE WORK PERCEPTIONS PROFILE DATA DECEMBER 4, 2014
 A CONSTRUCT VALIDITY ANALYSIS OF THE WORK PERCEPTIONS PROFILE DATA DECEMBER 4, 2014 RESEARCH PROBLEM The Work Perceptions Profile is an existing instrument that is currently being used as an indicator
Shoplifting Inventory: Standardization Study
 Shoplifting Inventory: Standardization Study Donald D Davignon, Ph.D. 10-2-02 Abstract The Shoplifting Inventory (SI) is an adult shoplifting offender assessment test that accurately measures offender
The Ego Identity Process Questionnaire: Factor Structure, Reliability, and Convergent Validity in Dutch-Speaking Late. Adolescents
 33 2 The Ego Identity Process Questionnaire: Factor Structure, Reliability, and Convergent Validity in Dutch-Speaking Late Adolescents Koen Luyckx, Luc Goossens, Wim Beyers, & Bart Soenens (2006). Journal
Juvenile Pre-Disposition Evaluation: Reliability and Validity
 Juvenile Pre-Disposition Evaluation: Reliability and Validity Donald D Davignon, Ph.D. Abstract The Juvenile Pre-Disposition Evaluation (JPE) is a juvenile defendant assessment test that accurately measures
11 Validity. Content Validity and BIMAS Scale Structure. Overview of Results
 11 Validity The validity of a test refers to the quality of inferences that can be made by the test s scores. That is, how well does the test measure the construct(s) it was designed to measure, and how
Self Determination Theory, COACHE, and Faculty Outcomes in Higher Education. Lisa M. Larson Mack C. Shelley Sandra W. Gahn Matthew Seipel
 Self Determination Theory, COACHE, and Faculty Outcomes in Higher Education Lisa M. Larson Mack C. Shelley Sandra W. Gahn Matthew Seipel Overview ISU COACHE survey through the lens of Self- Determination
Development and Psychometric Properties of the Relational Mobility Scale for the Indonesian Population
 Development and Psychometric Properties of the Relational Mobility Scale for the Indonesian Population Sukaesi Marianti Abstract This study aims to develop the Relational Mobility Scale for the Indonesian
Highlights of the Research Consortium 2002 Non-Clinical Sample Study
 A RESEARCH REPORT OF THE RESEARCH CONSORTIUM OF COUNSELING & PSYCHOLOGICAL SERVICES IN HIGHER EDUCATION Highlights of the Research Consortium 2002 Non-Clinical Sample Study by Lisa K. Kearney and Augustine
DEVELOPING A TOOL TO MEASURE SOCIAL WORKERS PERCEPTIONS REGARDING THE EXTENT TO WHICH THEY INTEGRATE THEIR SPIRITUALITY IN THE WORKPLACE
 North American Association of Christians in Social Work (NACSW) PO Box 121; Botsford, CT 06404 *** Phone/Fax (tollfree): 888.426.4712 Email: info@nacsw.org *** Website: http://www.nacsw.org A Vital Christian
A Cross-cultural Analysis of the Structure of Subjective Well-Being
 1 A Cross-cultural Analysis of the Structure of Subjective Well-Being William A. Stock Morris A. Okun Arizona State University, USA and Juana Gomez Benito University of Barcelona, Spain In order for investigations
A Hierarchical Comparison on Influence Paths from Cognitive & Emotional Trust to Proactive Behavior Between China and Japan
 A Hierarchical Comparison on Influence Paths from Cognitive & Emotional Trust to Proactive Behavior Between China and Japan Pei Liu School of Management and Economics, North China Zhen Li Data Science
Variable Measurement, Norms & Differences
 Variable Measurement, Norms & Differences 1 Expectations Begins with hypothesis (general concept) or question Create specific, testable prediction Prediction can specify relation or group differences Different
The measurement of media literacy in eating disorder risk factor research: psychometric properties of six measures
 McLean et al. Journal of Eating Disorders (2016) 4:30 DOI 10.1186/s40337-016-0116-0 RESEARCH ARTICLE Open Access The measurement of media literacy in eating disorder risk factor research: psychometric
Treatment Intervention Inventory Reliability, Validity and Accuracy
 Treatment Intervention Inventory Reliability, Validity and Accuracy 8-2-02 Abstract The validity of the Treatment Intervention Inventory (TII) was investigated in a sample of 3,414 participants. The TII
Using the WHO 5 Well-Being Index to Identify College Students at Risk for Mental Health Problems
 Using the WHO 5 Well-Being Index to Identify College Students at Risk for Mental Health Problems Andrew Downs, Laura A. Boucher, Duncan G. Campbell, Anita Polyakov Journal of College Student Development,
CONVERGENT VALIDITY OF THE MMPI A AND MACI SCALES OF DEPRESSION 1
 Psychological Reports, 2009, 105, 605-609. Psychological Reports 2009 CONVERGENT VALIDITY OF THE MMPI A AND MACI SCALES OF DEPRESSION 1 ERIN K. MERYDITH AND LeADELLE PHELPS University at Buffalo, SUNY
Electronic Supplementary Material. for. Pride, Personality, and the Evolutionary Foundations of Human Social Status
 1 Electronic Supplementary Material for Pride, Personality, and the Evolutionary Foundations of Human Social Status Joey T. Cheng, Jessica L. Tracy, & Joseph Henrich 2 Dominance and Prestige Scale Construction
Everything DiSC 363 for Leaders. Research Report. by Inscape Publishing
 Everything DiSC 363 for Leaders Research Report by Inscape Publishing Introduction Everything DiSC 363 for Leaders is a multi-rater assessment and profile that is designed to give participants feedback
Development of self efficacy and attitude toward analytic geometry scale (SAAG-S)
") Available online at www.sciencedirect.com Procedia - Social and Behavioral Sciences 55 ( 2012 ) 20 27 INTERNATIONAL CONFERENCE ON NEW HORIZONS IN EDUCATION INTE2012 Development of self efficacy and attitude
Available online at www.sciencedirect.com Procedia - Social and Behavioral Sciences 55 ( 2012 ) 20 27 INTERNATIONAL CONFERENCE ON NEW HORIZONS IN EDUCATION INTE2012 Development of self efficacy and attitude
Factor Structure Within and Across Three Family-Assessment Procedures
 Journal of Family Psychology 1993. Vol.6, No. 3, 278-289 Copyright 1993 by the American Psychological Association, nc. O893-32OO/93/$3.OO Factor Structure Within and Across Three Family-Assessment Procedures
Domestic Violence Inventory: Annual Summary Report
 * * * Domestic Violence Inventory: Annual Summary Report Donald D. Davignon, Ph.D. February 15, 2003 Abstract This research study summarizes Domestic Violence Inventory (DVI) test data for 10,933 domestic
The Family Assessment Device: An Update
 The Family Assessment Device: An Update ABIGAIL K. MANSFIELD* GABOR I. KEITNER* JENNIFER DEALY The current study set out to describe family functioning scores of a contemporary community sample, using
Anger Management Profile (AMP)
") Anger Management Profile (AMP) 2012 Summary Report This report summarizes data received from 989 participants who completed the Anger Management Profile (AMP) from May 1, 2010 thru August 11, 2012. This
Anger Management Profile (AMP) 2012 Summary Report This report summarizes data received from 989 participants who completed the Anger Management Profile (AMP) from May 1, 2010 thru August 11, 2012. This
Extension of the Children's Perceptions of Interparental Conflict Scale for Use With Late Adolescents
 Journal of Family Psychology 1997, Vol. 11, No. 2, 246-250 Copyright 1997 by the American Psychological Association, Inc. O893-32OO/97/S3.OO BRIEF REPORTS Extension of the Children's Perceptions of Interparental
Internal Consistency and Reliability of the Networked Minds Measure of Social Presence
 Internal Consistency and Reliability of the Networked Minds Measure of Social Presence Chad Harms Iowa State University Frank Biocca Michigan State University Abstract This study sought to develop and
Testing the Multiple Intelligences Theory in Oman
 Available online at www.sciencedirect.com ScienceDirect Procedia - Social and Behavioral Sciences 190 ( 2015 ) 106 112 2nd GLOBAL CONFERENCE on PSYCHOLOGY RESEARCHES, 28-29, November 2014 Testing the Multiple
The Bilevel Structure of the Outcome Questionnaire 45
 Psychological Assessment 2010 American Psychological Association 2010, Vol. 22, No. 2, 350 355 1040-3590/10/$12.00 DOI: 10.1037/a0019187 The Bilevel Structure of the Outcome Questionnaire 45 Jamie L. Bludworth,
A Coding System to Measure Elements of Shared Decision Making During Psychiatric Visits
 Measuring Shared Decision Making -- 1 A Coding System to Measure Elements of Shared Decision Making During Psychiatric Visits Michelle P. Salyers, Ph.D. 1481 W. 10 th Street Indianapolis, IN 46202 mpsalyer@iupui.edu
MEASURING STUDENT ATTACHMENT TO SCHOOL : A STRUCTURAL EQUATION MODELING APPROACH
 MEASURING STUDENT ATTACHMENT TO SCHOOL : A STRUCTURAL EQUATION MODELING APPROACH Azlina Abu Bakar a a University Malaysia Terengganu, Malaysia. a Corresponding author: azlina@umt.edu.my Ontario International
Impulsivity, negative expectancies, and marijuana use: A test of the acquired preparedness model
 Addictive Behaviors 30 (2005) 1071 1076 Short communication Impulsivity, negative expectancies, and marijuana use: A test of the acquired preparedness model Laura Vangsness*, Brenna H. Bry, Erich W. LaBouvie
A Study of a Diet Improvement Method for Controlling High Sodium Intake Based on Protective Motivation Theory
 pissn 1229-1153 / eissn 2465-9223 J. Food Hyg. Saf. Vol. 33, No. 2, pp. 89~93 (2018) https://doi.org/10.13103/jfhs.2018.33.2.89 Journal of Food Hygiene and Safety Available online at http://www.foodhygiene.or.kr
Health Behavioral Patterns Associated with Psychologic Distress Among Middle-Aged Korean Women
 ORIGINAL ARTICLE Health Behavioral Patterns Associated with Psychologic Distress Among Middle-Aged Korean Women Hye-Sook Shin 1, PhD, RN, Jia Lee 2 *, PhD, RN, Kyung-Hee Lee 3, PhD, RN, Young-A Song 4,
A Modification to the Behavioural Regulation in Exercise Questionnaire to Include an Assessment of Amotivation
 JOURNAL OF SPORT & EXERCISE PSYCHOLOGY, 2004, 26, 191-196 2004 Human Kinetics Publishers, Inc. A Modification to the Behavioural Regulation in Exercise Questionnaire to Include an Assessment of Amotivation
Multiple Act criterion:
 Common Features of Trait Theories Generality and Stability of Traits: Trait theorists all use consistencies in an individual s behavior and explain why persons respond in different ways to the same stimulus
Using the STIC to Measure Progress in Therapy and Supervision
 Using the STIC to Measure Progress in Therapy and Supervision William Pinsof As well as providing a system for the conduct of empirically informed and multisystemic psychotherapy, the Systemic Therapy
Examining the ability to detect change using the TRIM-Diabetes and TRIM-Diabetes Device measures
 Qual Life Res (2011) 20:1513 1518 DOI 10.1007/s11136-011-9886-7 BRIEF COMMUNICATION Examining the ability to detect change using the TRIM-Diabetes and TRIM-Diabetes Device measures Meryl Brod Torsten Christensen
Relationship between Belief System and Depression with Anxiety among Undergraduate Students in Yemen
 Relationship between Belief System and Depression with Anxiety among Undergraduate Students in Yemen Nasser Abdul Hafeeth Alareqe,[1] Othman Bin Mohammed,[2] Lily Harun,[3] Bahaman Abu Samah,[4] 1-Introduction
GHABP Scoring/ Administration instructions GHABP Complete questionnaire. Buy full version here - for $7.00
 This is a Sample version of the Glasgow Hearing Aid Benefit Profile- KIT (GHABP- KIT). The full version of Disability Assessment For Dementia (DAD) comes without sample watermark.. The full complete KIT
DISCPP (DISC Personality Profile) Psychometric Report
 Psychometric Report") Psychometric Report Table of Contents Test Description... 5 Reference... 5 Vitals... 5 Question Type... 5 Test Development Procedures... 5 Test History... 8 Operational Definitions... 9 Test Research and
Psychometric Report Table of Contents Test Description... 5 Reference... 5 Vitals... 5 Question Type... 5 Test Development Procedures... 5 Test History... 8 Operational Definitions... 9 Test Research and
Gambler Addiction Index: Gambler Assessment
 Gambler Addiction Index: Gambler Assessment Donald D Davignon, Ph.D. 8-2-02 Abstract The Gambler Addiction Index (GAI) is an adult gambler assessment test that accurately measures gambler risk of gambling
Running head: INFLUENCE OF LABELS ON JUDGMENTS OF PERFORMANCE
 The influence of 1 Running head: INFLUENCE OF LABELS ON JUDGMENTS OF PERFORMANCE The Influence of Stigmatizing Labels on Participants Judgments of Children s Overall Performance and Ability to Focus on
Psychometric Properties of the Mean Opinion Scale
 Psychometric Properties of the Mean Opinion Scale James R. Lewis IBM Voice Systems 1555 Palm Beach Lakes Blvd. West Palm Beach, Florida jimlewis@us.ibm.com Abstract The Mean Opinion Scale (MOS) is a seven-item
Relations of Ethnic Stereotype Threat and Mindset to Achievement Goals in Science
 Relations of Ethnic Stereotype Threat and Mindset to Achievement Goals in Science Despite efforts to increase the persistence and achievement of underrepresented minority (URM) students in STEM, these
Review of Various Instruments Used with an Adolescent Population. Michael J. Lambert
 Review of Various Instruments Used with an Adolescent Population Michael J. Lambert Population. This analysis will focus on a population of adolescent youth between the ages of 11 and 20 years old. This
Instrument equivalence across ethnic groups. Antonio Olmos (MHCD) Susan R. Hutchinson (UNC)
 Susan R. Hutchinson (UNC)") Instrument equivalence across ethnic groups Antonio Olmos (MHCD) Susan R. Hutchinson (UNC) Overview Instrument Equivalence Measurement Invariance Invariance in Reliability Scores Factorial Invariance Item
Instrument equivalence across ethnic groups Antonio Olmos (MHCD) Susan R. Hutchinson (UNC) Overview Instrument Equivalence Measurement Invariance Invariance in Reliability Scores Factorial Invariance Item