SUMMER 2011 RE-EXAM PSYF11STAT - STATISTIK
|
|
|
- Brianne Cannon
- 6 years ago
- Views:
Transcription
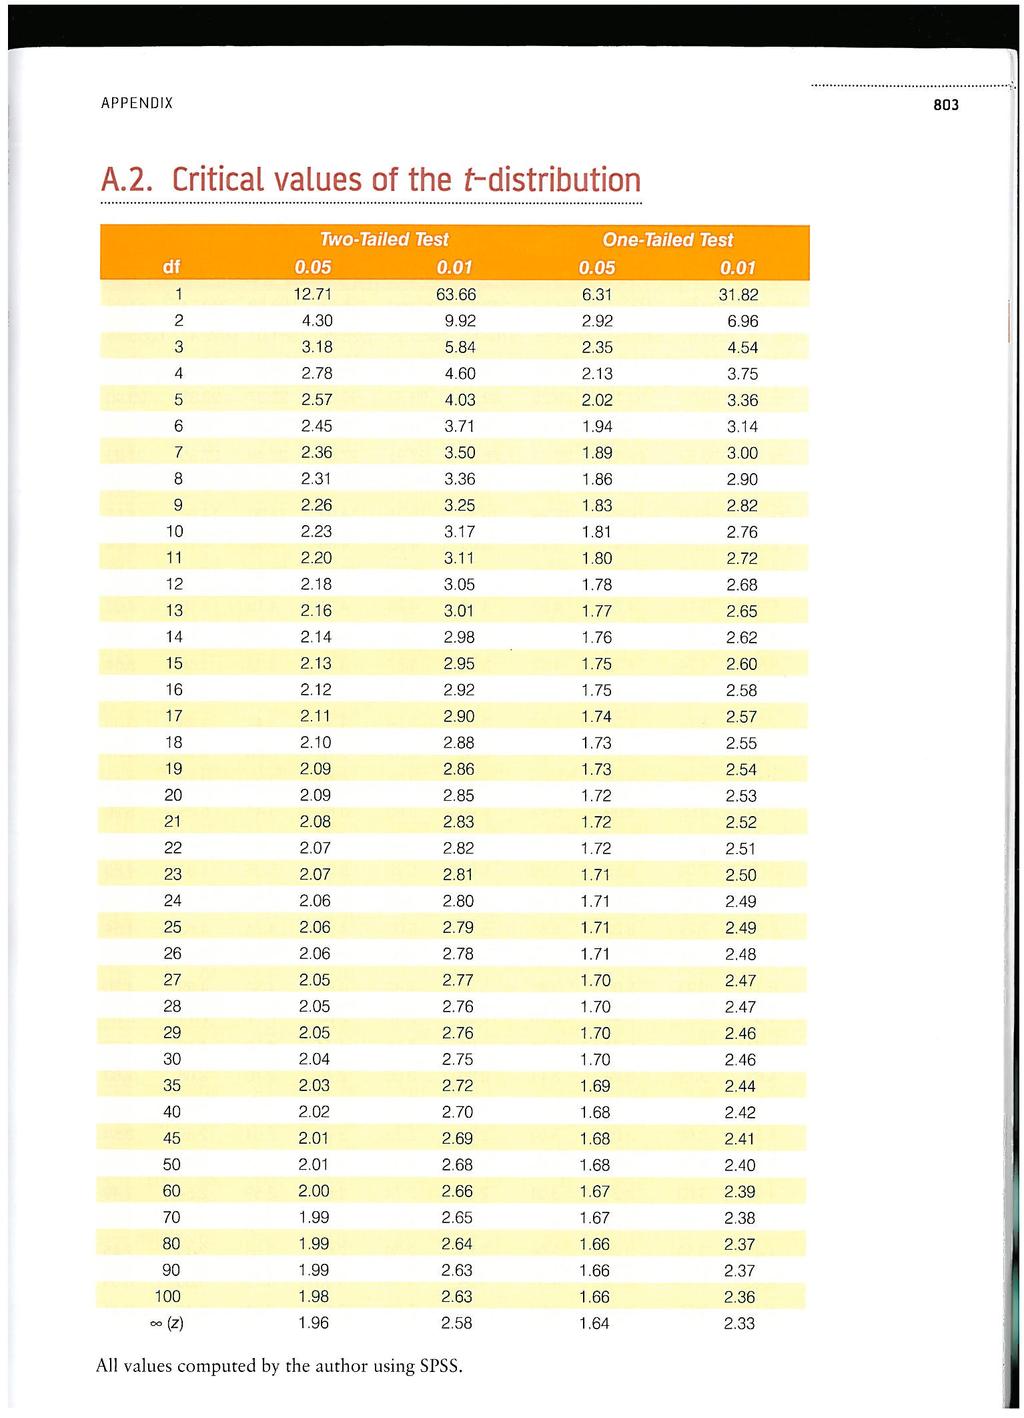
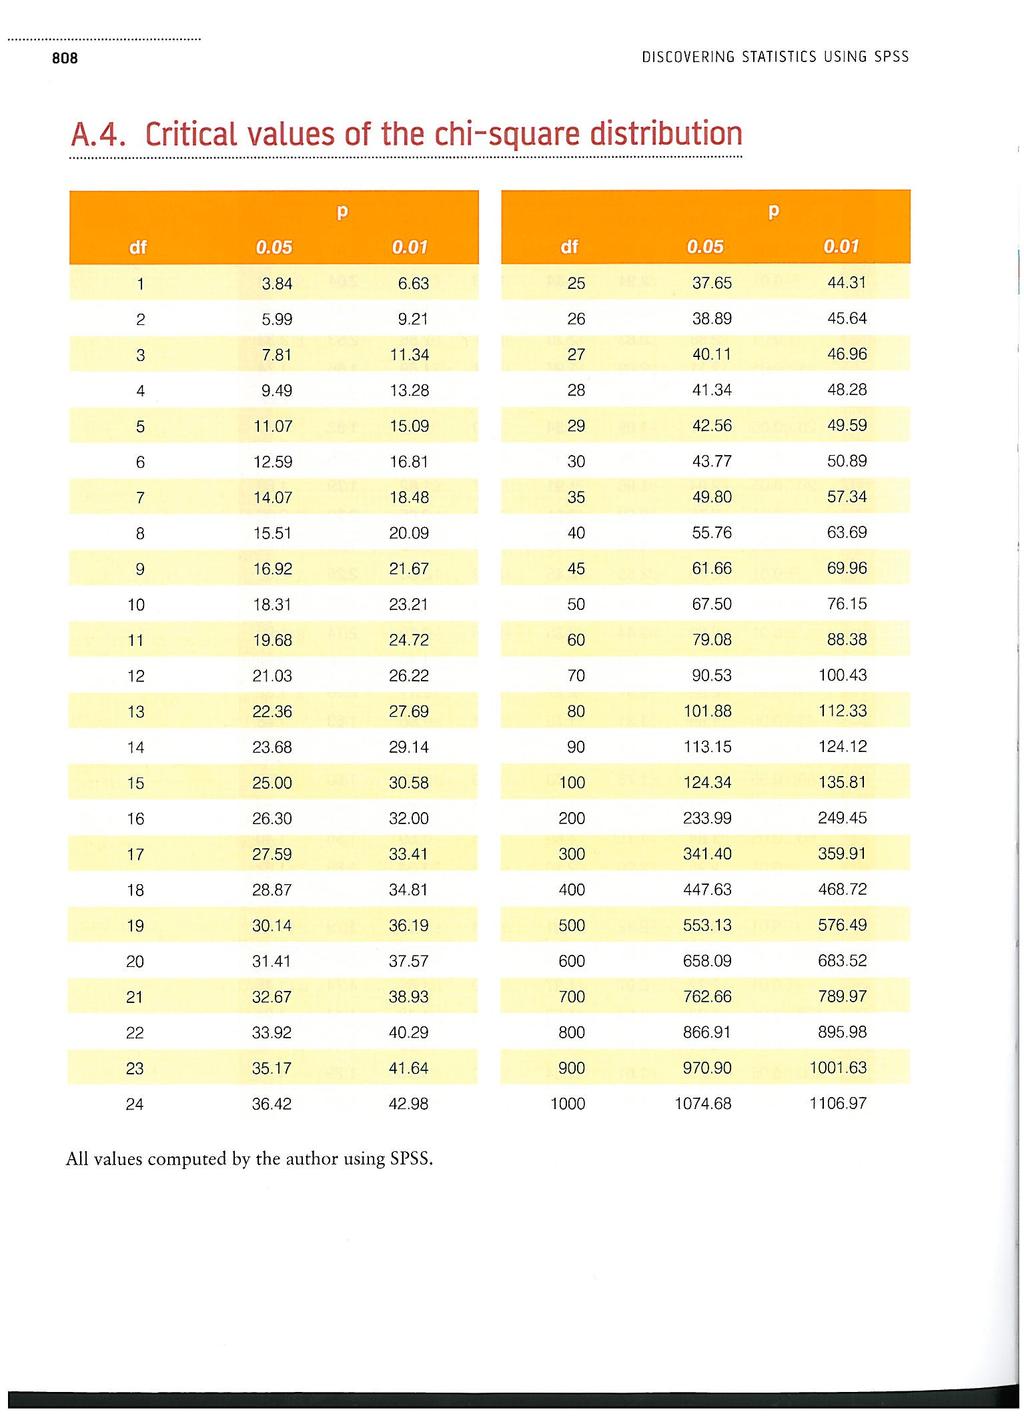
1 SUMMER 011 RE-EXAM PSYF11STAT - STATISTIK Full Name: Årskortnummer: Date: This exam is made up of three parts: Part 1 includes 30 multiple choice questions; Part includes 10 matching questions; and Part 3 includes 3 written/calculation questions. You have three hours to complete the exam. Please clearly mark your answer for each question in the spaces provided using either pen or pencil. In Part 3, you may provide your written answers in either Danish or English. You will find a formula sheet and critical value tables for t and χ at the end of this exam booklet. GOOD LUCK! 1

2 PART 1. MULTIPLE CHOICE QUESTIONS (30 POINTS) Please circle the best answer for each of the questions below. 1. In experimental studies, we typically aim to: a. Eliminate systematic and unsystematic variation b. Balance systematic and unsystematic variation c. Maximize systematic variation and limit unsystematic variation d. Maximize unsystematic variation and limit systematic variation. Which of the following methods would come closest to recruiting a random sample of University students? a. Drawing 50 telephone numbers from a hat containing the phone numbers of all students b. Asking 50 people in the library on a Saturday morning to participate in your study c. Asking the first 50 names from an alphabetical list of all students to participate d. Advertising for 50 participants by putting up a poster in the canteen 3. If a researcher creates a variable that measures a person s reaction time (in milliseconds) on a cognitive task, what type of variable it is? a. Binary b. Nominal c. Ordinal d. Ratio 4. The frequency distribution below is: a. Platykurtic b. Positively skewed c. Negatively skewed d. Leptokurtic 5. Which of the following is NOT a measure of central tendency? a. The mean b. The median c. The standard deviation d. The mode 6. What is the range for the following distribution: ? a. 10 b c. 6 d. 34
3 7. If an individual has a z score of -.58, what percentage of people would be expected to have a score LOWER than this? a. 95% b. 99% c. 1% d. 5% 8. If the scores on an exam have a mean of 6 and a standard deviation of 4, what is the z-score for an exam score of 18? a. b. 11 c. d Which of the following terms best describes the sentence: It is expected that male and female participants will report equal numbers of sexual partners? a. An alternative hypothesis b. A directional hypothesis c. A null hypothesis d. A non-directional hypothesis 10. The standard error is equal to the standard deviation of. a. The distribution of the sample data b. The normal distribution c. The sampling distribution of means d. The sum of errors 11. Critical values for significance in a theoretical distribution depend on: a. Sample size b. Whether your hypothesis is directional or non-directional c. The p level you have chosen for the test d. Both b and c e. All of the above 1. If a test is NOT statistically significant, it means that: a. There is a low probability of the result occurring if the null hypothesis is true b. The result is not very important c. The null hypothesis has been proven true d. There is a high probability of the result occurring if the null hypothesis is true 13. The assumption of normality applies to which of the following test(s)? a. The z-test b. Linear Regression c. Both a and b d. None of the above 3
4 14. Which of the following indicates the strongest correlation between two variables? a. r=.63 b. r=.00 c. r= -.3 d. r= What is the co-efficient of determination for the analysis shown below? a b c..000 d. None of the above 16. Determine the predicted value of y for a regression line with an intercept of 13.6, a slope of 0.43, and an x value of 4. a b c d In a regression analysis, F measures: a. The intercept of the regression line b. The slope of the regression line c. The overall fit of the model c. The effect of individual predictors 18. What is the risk of making a Type 1 error for the t-test shown in the output below? a. 1.07% b. 10.7% c. 3.86% d. 38.6% 4
5 19. What can you conclude from the output below? Measure: MEASURE_1 Mauchly's Test of Sphericity b Within Subjects Effect factor1 Mauchly's W Approx. Chi-Square df Sig a. That the assumption of homogeneity of variance has been violated b. That the assumption of homogeneity of variance has been satisfied c. That the assumption of sphericity has been satisfied d. That the assumption of sphericity has been violated 0. One possible solution to deal with a violation of sphericity is to use: a. A Welch correction b. A log transformation c. A Brown Forsyth correction d. A Huynh-Feldt correction 1. A clinical psychologist compares the scores of 15 depressed patients with 15 phobic patients on a social avoidance test and gets the following results (higher scores = more avoidance). Based on this SPSS output, what should he report? a. Depressed patients had significantly higher scores on the avoidance test as compared to phobic patients, t(8)= -4.3, p<.001 b. Phobic patients had significantly higher scores on the avoidance test as compared to depressed patients, t(8)= -4.3, p<.001 c. The avoidance scores for phobic and depressed patients did not differ significantly, t(8)= - 4.3, p>.05 d. Phobic patients had significantly higher scores on the avoidance test as compared to depressed patients, t(18.75)= -4.3, p<.001 5
6 . A psychologist collects data on students fear of statistics before (n=0) and after (n=0) they complete a statistics course (higher scores = more fear). What is the effect size for this test? a..31 b..5 c..01 d If an ANOVA F-ratio is greater than 1, what can we conclude? a. Effect > Error b. Error > Effect c. F is significant d. F is not significant 4. If you run a one-way independent ANOVA comparing 4 groups, with 7 people in each group, what are the degrees of freedom for your test? a. 3, 4 b. 3, 8 c. 4, 4 d. 4, 8 5. If you have run an ANOVA comparing 5 groups and want to use a Bonferroni correction for your pairwise comparisons, you should: a. Divide the p value by 5 b. Divide the p value by 10 c. Divide the F value by 5 d. Divide the F value by The statistical symbol typically used to represent a Kruskall-Wallis test is: a. t b. H c. U d. X 6
7 7. If you have a repeated measures design with three conditions, a sample size of 3, and a significant K-S test, what should you do? a. Automatically use a Repeated measures ANOVA b. Automatically use a Friedman s test c. Use the central limit theorem to justify using a Repeated measures ANOVA d. Use the central limit theorem to justify using a Friedman s test 8. A researcher has conducted a Friedman s ANOVA to explore the effect of three different treatment conditions on an ordinal measure of outcome. What type of posthoc test should he conduct to identify which conditions differ from one another? a. Independent t-tests b. Dependent t-tests c. Mann-Whitney tests d. Wilcoxon Signed-rank tests 9. The critical value for p<.05 with 10 degrees of freedom is in the chi-squared distribution. If a researcher calculates that his chi-squared value is also 18.31, what should he do? a. Reject the null hypothesis b. Fail to reject the null hypothesis c. Conclude that the alternative hypothesis has been proven true d. Both a and c 30. The best effect size measure to use for a 3 x 3 Chi-square test is: a. Z b. Cramer s v c. Phi d. Odds ratio 7
8 PART. MATCHING QUESTIONS (10 POINTS) Match each question on the left to one of the possible answers on the right. Each answer can be used only once. Please write the letter that identifies your answers in the blank spaces provided. Questions 1. The experimental design best able to control for unsystematic variance is a design.. A frequency distribution (histogram) that has two peaks can be described as. 3. A significance test should be used when a researcher has stated a directional hypothesis. 4. The variable is manipulated or controlled by the researcher in an experimental study 5. The value of y when x = 0 in a regression equation is equal to the. 6. The difference between the observed value of a variable and the value predicted by a statistical model is called the. 7. A is an objective and standardized measure of an effect that can be directly compared across studies. 8. is a measure of the symmetry of a frequency distribution. 9. A measure that accurately measures what it intends to is said to be a measure. 10. The measures whether the difference between two group means is large enough to be significant. Possible Answers A. Normal B. F-ratio C. t-value D. Unreliable E. Between-subjects F. Leptokurtic G. Sampling distribution of means H. Confounding I. Within-subjects J. One-tailed K. Brown-Forsythe L. Platykurtic M. Effect size N. Significance O. Greenhouse Geisser P. Kurtosis Q. Correlational R. Independent S. Outcome T. p level U. Standard error V. Bimodal W. Valid X. Bonferroni Y. Two-tailed Z. Gradient AA. Variance BB. Skew CC. Intercept DD. Deviance EE. Reliable 8
9 PART 3. WRITTEN/CALCULATION QUESTIONS (30 POINTS) Please answer each of the questions below in as much detail as possible. Each question is worth a total of 10 points. You may choose to answer in either Danish or English. 1. A cognitive psychologist is interested in exploring the relationship between age and verbal ability. She recruits a sample of 10 adults and asks them to complete a simple verbal fluency task in which they have to name as many different animals as possible in a 60 second period. For each participant she records their age (in years) and the total number of animals they are able to name (see below). When exploring her data, the psychologist finds that both variables are normally distributed. Participant ID Age (years) Number of Animals Named a. What test should the psychologist use to analyze her data? b. Calculate the appropriate statistic by hand (show all of the steps in your calculation) c. Determine whether your test is statistically significant and give an effect size d. What should the psychologist conclude? Please provide your answers here (you may continue on the next page): 9
10 Answers (cont): 10
.")
11 1. A work psychologist has been hired by a large clothing company to compare customers satisfaction with their shopping experience at boutiques located in four different cities (Aarhus, Odense, Copenhagen and Vejle). The psychologist recruits 3 participants (8 from each store) and asks them to complete a survey measuring their satisfaction (scored from 0-50, where higher scores = more satisfaction). When testing his assumptions, the psychologist finds that the K-S test was p>.05 for all four locations, and he gets the following output for Levene s test: Based on the description and output above, identify the type of test(s) the psychologist should use to examine whether there is a difference in customer satisfaction across cities. Provide a step-by-step decision process and include as many details as possible in your answer (you do not need to calculate the actual test). Please provide your answer here (you may continue on the next page if needed): 11
12 1. Answer (cont): 1
13 3. Many people believe that they can tell when someone is lying, often claiming that the person looks, speaks, or acts differently when lying as compared to when they are telling the truth. In order to explore this issue, a social psychologist designs an experimental study in which 3 participants are asked to listen to the same person telling two different stories. One story is true, and the other is a lie. After each story, the 3 participants are asked to rate how confident they are that the story is true on an ordinal scale (lower scores= less confidence in the truth of the story). Based on this description and the SPSS output provided below, decide what type of analysis was done and report the psychologist s findings in the proper format. Statistics Lying_condition Truth_condition N Valid 3 3 Missing 0 0 Median Ranks N Mean Rank Sum of Ranks Truth_condition - Lying_condition Negative Ranks 8 a Positive Ranks 15 b Ties 0 c Total 3 a. Truth_condition < Lying_condition b. Truth_condition > Lying_condition c. Truth_condition = Lying_condition Test Statistics Truth_condition - Lying_condition Z a Asymp. Sig. (-tailed).116 a. Based on negative ranks. 13
14 Please provide your answer here: 14
15 Regression s Descriptives PSYF11STAT- FORMULA SHEET Mean Median Mode x Mean= Mdn= N +1 Mode= most common score N Variance Standard deviation Range ( x x) = N 1 s = ( x x) N 1 Standard Error Z- scores SE= s N Correlation Pearson s r Coefficient of Determination r cov xy = = r = s x s y ( x x)( y y) ( N 1) sxsy t-statistic (for significance of r) Df for t r r = N t r 1 r z= x x s Range df = N Where N = x biggest x smallest R = r = number of participants Regression Equation Model Fit for Regression y= b0 + b1 x1 +ε t-tests Independent t-test Df for Independent t-test (equal sample size) df = N t = Dependent t-test Df for Dependent t-test (paired samples) df = N 1 t = s d d / Effect size for t-tests Mann-Whitney/Wilcoxon-signed rank tests Effect size r = x x 1 s n z 1 N s + 1 n N r = Where N = total t t + df number of R Where N Where N observations SS = SS F= = total MS MS Model Total Model Re sidual number of = number of participants (n1 + n +...) participants
16 One-Way ANOVA Independent ANOVA F-ratio Df for Independent ANOVA F= MS MS Model( Between) Re sidual( Within) df Model = k 1 Where k = number of groups df Residual = N k Where N = total number of participants (n + n +...) 1 Dependent ANOVA F-ratio Df for Dependent ANOVA (Repeated Measures) F = MS MS Model( Condition) Re sidual( Error) df df Model Residual = k 1 = df Within df Model Chi-Squared Chi-squared statistic Expected cell frequency χ ( O E) E = row total* column total E= N( total) Df for Chi-Squared df = (# rows 1)*(# columns 1) Odds Ratio for Outcome 1 OR= Odds of Outcome 1 for Predictor Variable Category 1(N with outcome' 1' Odds of Outcome 1 for Predictor Variable Category (N with outcome'1' / Odds Ratio for Outcome OR= Odds of Outcome for Predictor Variable Category 1(N with outcome' ' Odds of Outcome for Predictor Variable Category (N with outcome'' / / N with outcome'' ) N with outcome '' ) / N with outcome'1' ) N with outcome '1' ) Note: you choose which level of the outcome variable to report the odds for. E.g., the odds of outcome 1, or the odds of outcome
17
Analysis of Variance: repeated measures
 Analysis of Variance: repeated measures Tests for comparing three or more groups or conditions: (a) Nonparametric tests: Independent measures: Kruskal-Wallis. Repeated measures: Friedman s. (b) Parametric
Dr. Kelly Bradley Final Exam Summer {2 points} Name
 {2 points} Name You MUST work alone no tutors; no help from classmates. Email me or see me with questions. You will receive a score of 0 if this rule is violated. This exam is being scored out of 00 points.
Readings Assumed knowledge
 3 N = 59 EDUCAT 59 TEACHG 59 CAMP US 59 SOCIAL Analysis of Variance 95% CI Lecture 9 Survey Research & Design in Psychology James Neill, 2012 Readings Assumed knowledge Howell (2010): Ch3 The Normal Distribution
PSY 216: Elementary Statistics Exam 4
 Name: PSY 16: Elementary Statistics Exam 4 This exam consists of multiple-choice questions and essay / problem questions. For each multiple-choice question, circle the one letter that corresponds to the
Basic Biostatistics. Chapter 1. Content
 Chapter 1 Basic Biostatistics Jamalludin Ab Rahman MD MPH Department of Community Medicine Kulliyyah of Medicine Content 2 Basic premises variables, level of measurements, probability distribution Descriptive
Business Statistics Probability
 Business Statistics The following was provided by Dr. Suzanne Delaney, and is a comprehensive review of Business Statistics. The workshop instructor will provide relevant examples during the Skills Assessment
Statistics as a Tool. A set of tools for collecting, organizing, presenting and analyzing numerical facts or observations.
 Statistics as a Tool A set of tools for collecting, organizing, presenting and analyzing numerical facts or observations. Descriptive Statistics Numerical facts or observations that are organized describe
Analysis and Interpretation of Data Part 1
 Analysis and Interpretation of Data Part 1 DATA ANALYSIS: PRELIMINARY STEPS 1. Editing Field Edit Completeness Legibility Comprehensibility Consistency Uniformity Central Office Edit 2. Coding Specifying
Overview of Lecture. Survey Methods & Design in Psychology. Correlational statistics vs tests of differences between groups
 Survey Methods & Design in Psychology Lecture 10 ANOVA (2007) Lecturer: James Neill Overview of Lecture Testing mean differences ANOVA models Interactions Follow-up tests Effect sizes Parametric Tests
STA 3024 Spring 2013 EXAM 3 Test Form Code A UF ID #
 STA 3024 Spring 2013 Name EXAM 3 Test Form Code A UF ID # Instructions: This exam contains 34 Multiple Choice questions. Each question is worth 3 points, for a total of 102 points (there are TWO bonus
Quantitative Methods in Computing Education Research (A brief overview tips and techniques)
") Quantitative Methods in Computing Education Research (A brief overview tips and techniques) Dr Judy Sheard Senior Lecturer Co-Director, Computing Education Research Group Monash University judy.sheard@monash.edu
Quantitative Methods in Computing Education Research (A brief overview tips and techniques) Dr Judy Sheard Senior Lecturer Co-Director, Computing Education Research Group Monash University judy.sheard@monash.edu
Repeated Measures ANOVA and Mixed Model ANOVA. Comparing more than two measurements of the same or matched participants
 Repeated Measures ANOVA and Mixed Model ANOVA Comparing more than two measurements of the same or matched participants Data files Fatigue.sav MentalRotation.sav AttachAndSleep.sav Attitude.sav Homework:
Advanced ANOVA Procedures
 Advanced ANOVA Procedures Session Lecture Outline:. An example. An example. Two-way ANOVA. An example. Two-way Repeated Measures ANOVA. MANOVA. ANalysis of Co-Variance (): an ANOVA procedure whereby the
What you should know before you collect data. BAE 815 (Fall 2017) Dr. Zifei Liu
 Dr. Zifei Liu") What you should know before you collect data BAE 815 (Fall 2017) Dr. Zifei Liu Zifeiliu@ksu.edu Types and levels of study Descriptive statistics Inferential statistics How to choose a statistical test
What you should know before you collect data BAE 815 (Fall 2017) Dr. Zifei Liu Zifeiliu@ksu.edu Types and levels of study Descriptive statistics Inferential statistics How to choose a statistical test
One-Way Independent ANOVA
 One-Way Independent ANOVA Analysis of Variance (ANOVA) is a common and robust statistical test that you can use to compare the mean scores collected from different conditions or groups in an experiment.
ANOVA in SPSS (Practical)
") ANOVA in SPSS (Practical) Analysis of Variance practical In this practical we will investigate how we model the influence of a categorical predictor on a continuous response. Centre for Multilevel Modelling
ANOVA in SPSS (Practical) Analysis of Variance practical In this practical we will investigate how we model the influence of a categorical predictor on a continuous response. Centre for Multilevel Modelling
STATISTICS AND RESEARCH DESIGN
 Statistics 1 STATISTICS AND RESEARCH DESIGN These are subjects that are frequently confused. Both subjects often evoke student anxiety and avoidance. To further complicate matters, both areas appear have
Examining differences between two sets of scores
 6 Examining differences between two sets of scores In this chapter you will learn about tests which tell us if there is a statistically significant difference between two sets of scores. In so doing you
Theoretical Exam. Monday 15 th, Instructor: Dr. Samir Safi. 1. Write your name, student ID and section number.
 بسم االله الرحمن الرحيم COMPUTER & DATA ANALYSIS Theoretical Exam FINAL THEORETICAL EXAMINATION Monday 15 th, 2007 Instructor: Dr. Samir Safi Name: ID Number: Instructor: INSTRUCTIONS: 1. Write your name,
HS Exam 1 -- March 9, 2006
 Please write your name on the back. Don t forget! Part A: Short answer, multiple choice, and true or false questions. No use of calculators, notes, lab workbooks, cell phones, neighbors, brain implants,
THE UNIVERSITY OF SUSSEX. BSc Second Year Examination DISCOVERING STATISTICS SAMPLE PAPER INSTRUCTIONS
 C8552 THE UNIVERSITY OF SUSSEX BSc Second Year Examination DISCOVERING STATISTICS SAMPLE PAPER INSTRUCTIONS Do not, under any circumstances, remove the question paper, used or unused, from the examination
Business Research Methods. Introduction to Data Analysis
 Business Research Methods Introduction to Data Analysis Data Analysis Process STAGES OF DATA ANALYSIS EDITING CODING DATA ENTRY ERROR CHECKING AND VERIFICATION DATA ANALYSIS Introduction Preparation of
MMI 409 Spring 2009 Final Examination Gordon Bleil. 1. Is there a difference in depression as a function of group and drug?
 MMI 409 Spring 2009 Final Examination Gordon Bleil Table of Contents Research Scenario and General Assumptions Questions for Dataset (Questions are hyperlinked to detailed answers) 1. Is there a difference
Still important ideas
 Readings: OpenStax - Chapters 1 13 & Appendix D & E (online) Plous Chapters 17 & 18 - Chapter 17: Social Influences - Chapter 18: Group Judgments and Decisions Still important ideas Contrast the measurement
Describe what is meant by a placebo Contrast the double-blind procedure with the single-blind procedure Review the structure for organizing a memo
 Business Statistics The following was provided by Dr. Suzanne Delaney, and is a comprehensive review of Business Statistics. The workshop instructor will provide relevant examples during the Skills Assessment
HOW STATISTICS IMPACT PHARMACY PRACTICE?
 HOW STATISTICS IMPACT PHARMACY PRACTICE? CPPD at NCCR 13 th June, 2013 Mohamed Izham M.I., PhD Professor in Social & Administrative Pharmacy Learning objective.. At the end of the presentation pharmacists
1. Below is the output of a 2 (gender) x 3(music type) completely between subjects factorial ANOVA on stress ratings
 x 3(music type) completely between subjects factorial ANOVA on stress ratings") SPSS 3 Practice Interpretation questions A researcher is interested in the effects of music on stress levels, and how stress levels might be related to anxiety and life satisfaction. 1. Below is the output
SPSS 3 Practice Interpretation questions A researcher is interested in the effects of music on stress levels, and how stress levels might be related to anxiety and life satisfaction. 1. Below is the output
Overview of Non-Parametric Statistics
 Overview of Non-Parametric Statistics LISA Short Course Series Mark Seiss, Dept. of Statistics April 7, 2009 Presentation Outline 1. Homework 2. Review of Parametric Statistics 3. Overview Non-Parametric
isc ove ring i Statistics sing SPSS
 isc ove ring i Statistics sing SPSS S E C O N D! E D I T I O N (and sex, drugs and rock V roll) A N D Y F I E L D Publications London o Thousand Oaks New Delhi CONTENTS Preface How To Use This Book Acknowledgements
Statistics Guide. Prepared by: Amanda J. Rockinson- Szapkiw, Ed.D.
 This guide contains a summary of the statistical terms and procedures. This guide can be used as a reference for course work and the dissertation process. However, it is recommended that you refer to statistical
Readings: Textbook readings: OpenStax - Chapters 1 13 (emphasis on Chapter 12) Online readings: Appendix D, E & F
 Online readings: Appendix D, E & F") Readings: Textbook readings: OpenStax - Chapters 1 13 (emphasis on Chapter 12) Online readings: Appendix D, E & F Plous Chapters 17 & 18 Chapter 17: Social Influences Chapter 18: Group Judgments and Decisions
Readings: Textbook readings: OpenStax - Chapters 1 13 (emphasis on Chapter 12) Online readings: Appendix D, E & F Plous Chapters 17 & 18 Chapter 17: Social Influences Chapter 18: Group Judgments and Decisions
C.3 Repeated Measures ANOVA
 C. Repeated Measures ANOVA A study was conducted to find the effect of yoga on lowering the total serum cholesterol level in newly diagnosed patients of hypercholesterolemia. Thirty patients were selected
Comparing 3 Means- ANOVA
 Comparing 3 Means- ANOVA Evaluation Methods & Statistics- Lecture 7 Dr Benjamin Cowan Research Example- Theory of Planned Behaviour Ajzen & Fishbein (1981) One of the most prominent models of behaviour
CHAPTER - 6 STATISTICAL ANALYSIS. This chapter discusses inferential statistics, which use sample data to
 CHAPTER - 6 STATISTICAL ANALYSIS 6.1 Introduction This chapter discusses inferential statistics, which use sample data to make decisions or inferences about population. Populations are group of interest
Lecture 20: Chi Square
 Statistics 20_chi.pdf Michael Hallstone, Ph.D. hallston@hawaii.edu Lecture 20: Chi Square Introduction Up until now, we done statistical test using means, but the assumptions for means have eliminated
Describe what is meant by a placebo Contrast the double-blind procedure with the single-blind procedure Review the structure for organizing a memo
 Please note the page numbers listed for the Lind book may vary by a page or two depending on which version of the textbook you have. Readings: Lind 1 11 (with emphasis on chapters 10, 11) Please note chapter
Two-Way Independent ANOVA
 Two-Way Independent ANOVA Analysis of Variance (ANOVA) a common and robust statistical test that you can use to compare the mean scores collected from different conditions or groups in an experiment. There
Choosing the Correct Statistical Test
 Choosing the Correct Statistical Test T racie O. Afifi, PhD Departments of Community Health Sciences & Psychiatry University of Manitoba Department of Community Health Sciences COLLEGE OF MEDICINE, FACULTY
EPS 625 INTERMEDIATE STATISTICS TWO-WAY ANOVA IN-CLASS EXAMPLE (FLEXIBILITY)
") EPS 625 INTERMEDIATE STATISTICS TO-AY ANOVA IN-CLASS EXAMPLE (FLEXIBILITY) A researcher conducts a study to evaluate the effects of the length of an exercise program on the flexibility of female and male
EPS 625 INTERMEDIATE STATISTICS TO-AY ANOVA IN-CLASS EXAMPLE (FLEXIBILITY) A researcher conducts a study to evaluate the effects of the length of an exercise program on the flexibility of female and male
Unit 1 Exploring and Understanding Data
 Unit 1 Exploring and Understanding Data Area Principle Bar Chart Boxplot Conditional Distribution Dotplot Empirical Rule Five Number Summary Frequency Distribution Frequency Polygon Histogram Interquartile
CHAPTER TWO REGRESSION
 CHAPTER TWO REGRESSION 2.0 Introduction The second chapter, Regression analysis is an extension of correlation. The aim of the discussion of exercises is to enhance students capability to assess the effect
Summary & Conclusion. Lecture 10 Survey Research & Design in Psychology James Neill, 2016 Creative Commons Attribution 4.0
 Summary & Conclusion Lecture 10 Survey Research & Design in Psychology James Neill, 2016 Creative Commons Attribution 4.0 Overview 1. Survey research and design 1. Survey research 2. Survey design 2. Univariate
Learning Objectives 9/9/2013. Hypothesis Testing. Conflicts of Interest. Descriptive statistics: Numerical methods Measures of Central Tendency
 Conflicts of Interest I have no conflict of interest to disclose Biostatistics Kevin M. Sowinski, Pharm.D., FCCP Last-Chance Ambulatory Care Webinar Thursday, September 5, 2013 Learning Objectives For
9/4/2013. Decision Errors. Hypothesis Testing. Conflicts of Interest. Descriptive statistics: Numerical methods Measures of Central Tendency
 Conflicts of Interest I have no conflict of interest to disclose Biostatistics Kevin M. Sowinski, Pharm.D., FCCP Pharmacotherapy Webinar Review Course Tuesday, September 3, 2013 Descriptive statistics:
Still important ideas
 Readings: OpenStax - Chapters 1 11 + 13 & Appendix D & E (online) Plous - Chapters 2, 3, and 4 Chapter 2: Cognitive Dissonance, Chapter 3: Memory and Hindsight Bias, Chapter 4: Context Dependence Still
Table of Contents. Plots. Essential Statistics for Nursing Research 1/12/2017
 Essential Statistics for Nursing Research Kristen Carlin, MPH Seattle Nursing Research Workshop January 30, 2017 Table of Contents Plots Descriptive statistics Sample size/power Correlations Hypothesis
9 research designs likely for PSYC 2100
 9 research designs likely for PSYC 2100 1) 1 factor, 2 levels, 1 group (one group gets both treatment levels) related samples t-test (compare means of 2 levels only) 2) 1 factor, 2 levels, 2 groups (one
AMSc Research Methods Research approach IV: Experimental [2]
![AMSc Research Methods Research approach IV: Experimental [2]](/thumbs/96/127502980.jpg "AMSc Research Methods Research approach IV: Experimental [2]") AMSc Research Methods Research approach IV: Experimental [2] Marie-Luce Bourguet mlb@dcs.qmul.ac.uk Statistical Analysis 1 Statistical Analysis Descriptive Statistics : A set of statistical procedures
AMSc Research Methods Research approach IV: Experimental [2] Marie-Luce Bourguet mlb@dcs.qmul.ac.uk Statistical Analysis 1 Statistical Analysis Descriptive Statistics : A set of statistical procedures
Statistical analysis DIANA SAPLACAN 2017 * SLIDES ADAPTED BASED ON LECTURE NOTES BY ALMA LEORA CULEN
 Statistical analysis DIANA SAPLACAN 2017 * SLIDES ADAPTED BASED ON LECTURE NOTES BY ALMA LEORA CULEN Vs. 2 Background 3 There are different types of research methods to study behaviour: Descriptive: observations,
Reflection Questions for Math 58B
 Reflection Questions for Math 58B Johanna Hardin Spring 2017 Chapter 1, Section 1 binomial probabilities 1. What is a p-value? 2. What is the difference between a one- and two-sided hypothesis? 3. What
Psychology Research Process
 Psychology Research Process Logical Processes Induction Observation/Association/Using Correlation Trying to assess, through observation of a large group/sample, what is associated with what? Examples:
Day 11: Measures of Association and ANOVA
 Day 11: Measures of Association and ANOVA Daniel J. Mallinson School of Public Affairs Penn State Harrisburg mallinson@psu.edu PADM-HADM 503 Mallinson Day 11 November 2, 2017 1 / 45 Road map Measures of
CLINICAL RESEARCH METHODS VISP356. MODULE LEADER: PROF A TOMLINSON B.Sc./B.Sc.(HONS) OPTOMETRY
 OPTOMETRY") DIVISION OF VISION SCIENCES SESSION: 2005/2006 DIET: 1ST CLINICAL RESEARCH METHODS VISP356 LEVEL: MODULE LEADER: PROF A TOMLINSON B.Sc./B.Sc.(HONS) OPTOMETRY MAY 2006 DURATION: 2 HRS CANDIDATES SHOULD
DIVISION OF VISION SCIENCES SESSION: 2005/2006 DIET: 1ST CLINICAL RESEARCH METHODS VISP356 LEVEL: MODULE LEADER: PROF A TOMLINSON B.Sc./B.Sc.(HONS) OPTOMETRY MAY 2006 DURATION: 2 HRS CANDIDATES SHOULD
CLINICAL RESEARCH METHODS VISP356. MODULE LEADER: PROF A TOMLINSON B.Sc./B.Sc.(HONS) OPTOMETRY
 OPTOMETRY") DIVISION OF VISION SCIENCES SESSION: 2006/2007 DIET: 1ST CLINICAL RESEARCH METHODS VISP356 LEVEL: MODULE LEADER: PROF A TOMLINSON B.Sc./B.Sc.(HONS) OPTOMETRY MAY 2007 DURATION: 2 HRS CANDIDATES SHOULD
DIVISION OF VISION SCIENCES SESSION: 2006/2007 DIET: 1ST CLINICAL RESEARCH METHODS VISP356 LEVEL: MODULE LEADER: PROF A TOMLINSON B.Sc./B.Sc.(HONS) OPTOMETRY MAY 2007 DURATION: 2 HRS CANDIDATES SHOULD
Statistics 571: Statistical Methods Summer 2003 Final Exam Ramón V. León
 Name: Statistics 571: Statistical Methods Summer 2003 Final Exam Ramón V. León This exam is closed-book and closed-notes. However, you can use up to twenty pages of personal notes as an aid in answering
Survey research (Lecture 1) Summary & Conclusion. Lecture 10 Survey Research & Design in Psychology James Neill, 2015 Creative Commons Attribution 4.
 Summary & Conclusion. Lecture 10 Survey Research & Design in Psychology James Neill, 2015 Creative Commons Attribution 4.") Summary & Conclusion Lecture 10 Survey Research & Design in Psychology James Neill, 2015 Creative Commons Attribution 4.0 Overview 1. Survey research 2. Survey design 3. Descriptives & graphing 4. Correlation
Summary & Conclusion Lecture 10 Survey Research & Design in Psychology James Neill, 2015 Creative Commons Attribution 4.0 Overview 1. Survey research 2. Survey design 3. Descriptives & graphing 4. Correlation
Survey research (Lecture 1)
") Summary & Conclusion Lecture 10 Survey Research & Design in Psychology James Neill, 2015 Creative Commons Attribution 4.0 Overview 1. Survey research 2. Survey design 3. Descriptives & graphing 4. Correlation
Summary & Conclusion Lecture 10 Survey Research & Design in Psychology James Neill, 2015 Creative Commons Attribution 4.0 Overview 1. Survey research 2. Survey design 3. Descriptives & graphing 4. Correlation
Midterm Exam MMI 409 Spring 2009 Gordon Bleil
 Midterm Exam MMI 409 Spring 2009 Gordon Bleil Table of contents: (Hyperlinked to problem sections) Problem 1 Hypothesis Tests Results Inferences Problem 2 Hypothesis Tests Results Inferences Problem 3
Applied Statistical Analysis EDUC 6050 Week 4
 Applied Statistical Analysis EDUC 6050 Week 4 Finding clarity using data Today 1. Hypothesis Testing with Z Scores (continued) 2. Chapters 6 and 7 in Book 2 Review! = $ & '! = $ & ' * ) 1. Which formula
10. LINEAR REGRESSION AND CORRELATION
 1 10. LINEAR REGRESSION AND CORRELATION The contingency table describes an association between two nominal (categorical) variables (e.g., use of supplemental oxygen and mountaineer survival ). We have
Readings: Textbook readings: OpenStax - Chapters 1 11 Online readings: Appendix D, E & F Plous Chapters 10, 11, 12 and 14
 Readings: Textbook readings: OpenStax - Chapters 1 11 Online readings: Appendix D, E & F Plous Chapters 10, 11, 12 and 14 Still important ideas Contrast the measurement of observable actions (and/or characteristics)
Example of Interpreting and Applying a Multiple Regression Model
 Example of Interpreting and Applying a Multiple Regression We'll use the same data set as for the bivariate correlation example -- the criterion is 1 st year graduate grade point average and the predictors
Introduction to statistics Dr Alvin Vista, ACER Bangkok, 14-18, Sept. 2015
 Analysing and Understanding Learning Assessment for Evidence-based Policy Making Introduction to statistics Dr Alvin Vista, ACER Bangkok, 14-18, Sept. 2015 Australian Council for Educational Research Structure
Midterm STAT-UB.0003 Regression and Forecasting Models. I will not lie, cheat or steal to gain an academic advantage, or tolerate those who do.
 Midterm STAT-UB.0003 Regression and Forecasting Models The exam is closed book and notes, with the following exception: you are allowed to bring one letter-sized page of notes into the exam (front and
SPSS output for 420 midterm study
 Ψ Psy Midterm Part In lab (5 points total) Your professor decides that he wants to find out how much impact amount of study time has on the first midterm. He randomly assigns students to study for hours,
Before we get started:
 Before we get started: http://arievaluation.org/projects-3/ AEA 2018 R-Commander 1 Antonio Olmos Kai Schramm Priyalathta Govindasamy Antonio.Olmos@du.edu AntonioOlmos@aumhc.org AEA 2018 R-Commander 2 Plan
Statistics for EES Factorial analysis of variance
 Statistics for EES Factorial analysis of variance Dirk Metzler http://evol.bio.lmu.de/_statgen 1. July 2013 1 ANOVA and F-Test 2 Pairwise comparisons and multiple testing 3 Non-parametric: The Kruskal-Wallis
Intro to SPSS. Using SPSS through WebFAS
 Intro to SPSS Using SPSS through WebFAS http://www.yorku.ca/computing/students/labs/webfas/ Try it early (make sure it works from your computer) If you need help contact UIT Client Services Voice: 416-736-5800
MODULE S1 DESCRIPTIVE STATISTICS
 MODULE S1 DESCRIPTIVE STATISTICS All educators are involved in research and statistics to a degree. For this reason all educators should have a practical understanding of research design. Even if an educator
Chapter 2 Organizing and Summarizing Data. Chapter 3 Numerically Summarizing Data. Chapter 4 Describing the Relation between Two Variables
 Tables and Formulas for Sullivan, Fundamentals of Statistics, 4e 014 Pearson Education, Inc. Chapter Organizing and Summarizing Data Relative frequency = frequency sum of all frequencies Class midpoint:
bivariate analysis: The statistical analysis of the relationship between two variables.
 bivariate analysis: The statistical analysis of the relationship between two variables. cell frequency: The number of cases in a cell of a cross-tabulation (contingency table). chi-square (χ 2 ) test for
11/18/2013. Correlational Research. Correlational Designs. Why Use a Correlational Design? CORRELATIONAL RESEARCH STUDIES
 Correlational Research Correlational Designs Correlational research is used to describe the relationship between two or more naturally occurring variables. Is age related to political conservativism? Are
A Brief (very brief) Overview of Biostatistics. Jody Kreiman, PhD Bureau of Glottal Affairs
 Overview of Biostatistics. Jody Kreiman, PhD Bureau of Glottal Affairs") A Brief (very brief) Overview of Biostatistics Jody Kreiman, PhD Bureau of Glottal Affairs What We ll Cover Fundamentals of measurement Parametric versus nonparametric tests Descriptive versus inferential
A Brief (very brief) Overview of Biostatistics Jody Kreiman, PhD Bureau of Glottal Affairs What We ll Cover Fundamentals of measurement Parametric versus nonparametric tests Descriptive versus inferential
Daniel Boduszek University of Huddersfield
 Daniel Boduszek University of Huddersfield d.boduszek@hud.ac.uk Introduction to Correlation SPSS procedure for Pearson r Interpretation of SPSS output Presenting results Partial Correlation Correlation
Correlation and Regression
 Dublin Institute of Technology ARROW@DIT Books/Book Chapters School of Management 2012-10 Correlation and Regression Donal O'Brien Dublin Institute of Technology, donal.obrien@dit.ie Pamela Sharkey Scott
FORM C Dr. Sanocki, PSY 3204 EXAM 1 NAME
 PSYCH STATS OLD EXAMS, provided for self-learning. LEARN HOW TO ANSWER the QUESTIONS; memorization of answers won t help. All answers are in the textbook or lecture. Instructors can provide some clarification
PRINCIPLES OF STATISTICS
 PRINCIPLES OF STATISTICS STA-201-TE This TECEP is an introduction to descriptive and inferential statistics. Topics include: measures of central tendency, variability, correlation, regression, hypothesis
7 Statistical Issues that Researchers Shouldn t Worry (So Much) About
 About") 7 Statistical Issues that Researchers Shouldn t Worry (So Much) About By Karen Grace-Martin Founder & President About the Author Karen Grace-Martin is the founder and president of The Analysis Factor.
7 Statistical Issues that Researchers Shouldn t Worry (So Much) About By Karen Grace-Martin Founder & President About the Author Karen Grace-Martin is the founder and president of The Analysis Factor.
Simple Linear Regression the model, estimation and testing
 Simple Linear Regression the model, estimation and testing Lecture No. 05 Example 1 A production manager has compared the dexterity test scores of five assembly-line employees with their hourly productivity.
Introduction to Quantitative Methods (SR8511) Project Report
 Project Report") Introduction to Quantitative Methods (SR8511) Project Report Exploring the variables related to and possibly affecting the consumption of alcohol by adults Student Registration number: 554561 Word counts
Introduction to Quantitative Methods (SR8511) Project Report Exploring the variables related to and possibly affecting the consumption of alcohol by adults Student Registration number: 554561 Word counts
Single-Factor Experimental Designs. Chapter 8
 Single-Factor Experimental Designs Chapter 8 Experimental Control manipulation of one or more IVs measured DV(s) everything else held constant Causality and Confounds What are the three criteria that must
Daniel Boduszek University of Huddersfield
 Daniel Boduszek University of Huddersfield d.boduszek@hud.ac.uk Introduction to Multinominal Logistic Regression SPSS procedure of MLR Example based on prison data Interpretation of SPSS output Presenting
MULTIPLE LINEAR REGRESSION 24.1 INTRODUCTION AND OBJECTIVES OBJECTIVES
 24 MULTIPLE LINEAR REGRESSION 24.1 INTRODUCTION AND OBJECTIVES In the previous chapter, simple linear regression was used when you have one independent variable and one dependent variable. This chapter
Basic Steps in Planning Research. Dr. P.J. Brink and Dr. M.J. Wood
 Basic Steps in Planning Research Dr. P.J. Brink and Dr. M.J. Wood Research Levels Level 1: There is little or no literature available on the topic or on the population. The purpose is to describe what
Basic Features of Statistical Analysis and the General Linear Model
 01-Foster-3327(ch-01).qxd 9/5/2005 5:48 PM Page 1 1 Basic Features of Statistical Analysis and the General Linear Model INTRODUCTION The aim of this book is to describe some of the statistical techniques
Content. Basic Statistics and Data Analysis for Health Researchers from Foreign Countries. Research question. Example Newly diagnosed Type 2 Diabetes
 Content Quantifying association between continuous variables. Basic Statistics and Data Analysis for Health Researchers from Foreign Countries Volkert Siersma siersma@sund.ku.dk The Research Unit for General
Problem #1 Neurological signs and symptoms of ciguatera poisoning as the start of treatment and 2.5 hours after treatment with mannitol.
 Ho (null hypothesis) Ha (alternative hypothesis) Problem #1 Neurological signs and symptoms of ciguatera poisoning as the start of treatment and 2.5 hours after treatment with mannitol. Hypothesis: Ho:
Regression Including the Interaction Between Quantitative Variables
 Regression Including the Interaction Between Quantitative Variables The purpose of the study was to examine the inter-relationships among social skills, the complexity of the social situation, and performance
Investigating the robustness of the nonparametric Levene test with more than two groups
 Psicológica (2014), 35, 361-383. Investigating the robustness of the nonparametric Levene test with more than two groups David W. Nordstokke * and S. Mitchell Colp University of Calgary, Canada Testing
INTRODUCTION TO MEDICAL RESEARCH: ESSENTIAL SKILLS
 INTRODUCTION TO MEDICAL RESEARCH: ESSENTIAL SKILLS SCALES OF MEASUREMENT AND WAYS OF SUMMARIZING DATA Alecsandra IRIMIE-ANA 1 1. Psychiatry Hospital Prof. Dr. Alexandru Obregia ABSTRACT Regardless the
Chapter 14: More Powerful Statistical Methods
 Chapter 14: More Powerful Statistical Methods Most questions will be on correlation and regression analysis, but I would like you to know just basically what cluster analysis, factor analysis, and conjoint
Research paper. One-way Analysis of Variance (ANOVA) Research paper. SPSS output. Learning objectives. Alcohol and driving ability
 Research paper. SPSS output. Learning objectives. Alcohol and driving ability") Research paper Alcohol and driving ability One-way Analysis of Variance (ANOVA) Thirty-six people took part in an experiment to discover the effects of alcohol on drinking ability. They were randomly assigned
Research paper Alcohol and driving ability One-way Analysis of Variance (ANOVA) Thirty-six people took part in an experiment to discover the effects of alcohol on drinking ability. They were randomly assigned
Name: emergency please discuss this with the exam proctor. 6. Vanderbilt s academic honor code applies.
 Name: Biostatistics 1 st year Comprehensive Examination: Applied in-class exam May 28 th, 2015: 9am to 1pm Instructions: 1. There are seven questions and 12 pages. 2. Read each question carefully. Answer
Applied Medical. Statistics Using SAS. Geoff Der. Brian S. Everitt. CRC Press. Taylor Si Francis Croup. Taylor & Francis Croup, an informa business
 Applied Medical Statistics Using SAS Geoff Der Brian S. Everitt CRC Press Taylor Si Francis Croup Boca Raton London New York CRC Press is an imprint of the Taylor & Francis Croup, an informa business A
SPSS output for 420 midterm study
 Ψ Psy Midterm Part In lab (5 points total) Your professor decides that he wants to find out how much impact amount of study time has on the first midterm. He randomly assigns students to study for hours,
1) What is the independent variable? What is our Dependent Variable?
 What is the independent variable? What is our Dependent Variable?") 1) What is the independent variable? What is our Dependent Variable? Independent Variable: Whether the font color and word name are the same or different. (Congruency) Dependent Variable: The amount of
1) What is the independent variable? What is our Dependent Variable? Independent Variable: Whether the font color and word name are the same or different. (Congruency) Dependent Variable: The amount of
ANALYSIS OF VARIANCE (ANOVA): TESTING DIFFERENCES INVOLVING THREE OR MORE MEANS
: TESTING DIFFERENCES INVOLVING THREE OR MORE MEANS") ANALYSIS OF VARIANCE (ANOVA): TESTING DIFFERENCES INVOLVING THREE OR MORE MEANS REVIEW Testing hypothesis using the difference between two means: One-sample t-test Independent-samples t-test Dependent/Paired-samples
ANALYSIS OF VARIANCE (ANOVA): TESTING DIFFERENCES INVOLVING THREE OR MORE MEANS REVIEW Testing hypothesis using the difference between two means: One-sample t-test Independent-samples t-test Dependent/Paired-samples
POST GRADUATE DIPLOMA IN BIOETHICS (PGDBE) Term-End Examination June, 2016 MHS-014 : RESEARCH METHODOLOGY
 Term-End Examination June, 2016 MHS-014 : RESEARCH METHODOLOGY") No. of Printed Pages : 12 MHS-014 POST GRADUATE DIPLOMA IN BIOETHICS (PGDBE) Term-End Examination June, 2016 MHS-014 : RESEARCH METHODOLOGY Time : 2 hours Maximum Marks : 70 PART A Attempt all questions.
No. of Printed Pages : 12 MHS-014 POST GRADUATE DIPLOMA IN BIOETHICS (PGDBE) Term-End Examination June, 2016 MHS-014 : RESEARCH METHODOLOGY Time : 2 hours Maximum Marks : 70 PART A Attempt all questions.
Understandable Statistics
 Understandable Statistics correlated to the Advanced Placement Program Course Description for Statistics Prepared for Alabama CC2 6/2003 2003 Understandable Statistics 2003 correlated to the Advanced Placement
Research Analysis MICHAEL BERNSTEIN CS 376
 Research Analysis MICHAEL BERNSTEIN CS 376 Last time What is a statistical test? Chi-square t-test Paired t-test 2 Today ANOVA Posthoc tests Two-way ANOVA Repeated measures ANOVA 3 Recall: hypothesis testing