Chapter 12: Introduction to Analysis of Variance
|
|
|
- Alban McBride
- 6 years ago
- Views:
Transcription
1 Chapter 12: Introduction to Analysis of Variance
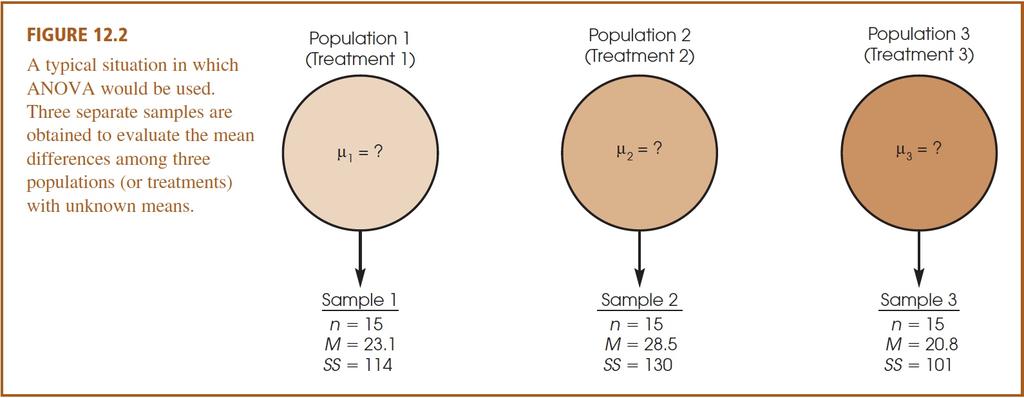
2 of Variance Chapter 12 presents the general logic and basic formulas for the hypothesis testing procedure known as analysis of variance (ANOVA). The purpose of ANOVA is much the same as for t tests: the goal of t tests is to compare distances; between sample means and between distances computed for the standard error. The goal of ANOVA is to determine whether the variances (measures of squared distance) between means are sufficiently large to justify a conclusion that there are mean differences between the populations from which the samples were obtained.
3 of Variance (cont'd.) The difference between ANOVA and the t tests is that ANOVA can be used in situations where there are two or more means being compared, whereas the t tests are limited to situations where only two means are involved. When only two means are involved, either test can be used, since these two techniques always result in the same statistical decision (p. 420). ANOVA is necessary to protect researchers from excessive risk of a Type I error (rejecting a null hypothesis that is actually true) in situations where a study is comparing more than two population means.
4 of Variance (cont'd.) These situations would require a series of several t tests to evaluate all of the mean differences. (Remember, a t test can compare only two means at a time.) Although each t test can be done with a specific α-level (risk of Type I error), the α-levels accumulate over a series of tests so that the final experiment-wide α-level can be quite large. For this reason, ANOVA is the most practical method for comparing multiple sample means. ANOVA allows researchers to evaluate all of the mean differences in a single hypothesis test using a single α-level, and thus keeps the risk of a Type I error under control no matter how many different means are being compared.
5 The Logic and the Process of Analysis Although ANOVA can be used in a variety of different research situations, this chapter presents only independentmeasures designs involving only one independent variable. Because ANOVA requires so many different formulas, it can be problematic to keep track of formulas and numbers, let alone calculating all of them. For this reason, we are learning how ANOVA is organized, but not requiring you to actually calculate all the formulas. In other words, you need to know about ANOVA, and how to interpret its results. Those of you who want to actually work with ANOVA can do so using the problems given in your text and your SPSS software.
6
7
8 of Variance (cont'd.) Thus, the F-ratio has the same basic structure as the independent-measures t statistic presented in Chapter 10. obtained mean differences (including treatment effects) MS between F = = differences expected by chance (without treatment effects) MS within
9
10 A large value for the F-ratio indicates that the obtained sample mean differences are greater than would be expected if the treatments had no effect. Each of the sample variances, MS values, in the F-ratio is computed using the basic formula for sample variance: SS sample variance = S 2 = df
11 To obtain the SS and df values, you must go through an analysis that separates the total variability for the entire set of data into two basic components: within-treatment variability (which will be the denominator) and between-treatment variability (which will become the numerator of the F-ratio).
12 The two components of the F-ratio can be described as follows: Within-Treatments Variability: MS within measures the size of the differences that exist inside each of the samples. Because all the individuals in a sample receive exactly the same treatment, any differences (or variance) within a sample cannot be caused by different treatments.
13 Thus, these differences are caused by only one source: Chance or Error: The unpredictable differences that exist between individual scores are not caused by any systematic factors and are simply considered to be random chance or error.
14 Between-Treatments Variability: MS between measures the size of the differences between the sample means. For example, suppose that three treatments, each with a sample of n = 5 subjects, have means of M 1 = 1, M 2 = 2, and M 3 = 3. Notice that the three means are different; that is, they are variable.
15 By computing the variance for the three means we can measure the size of the differences. Although it is possible to compute a variance for the set of sample means, it usually is easier to use the total, T, for each sample instead of the mean, and compute variance for the set of T values.
16 Logically, the differences (or variance) between means can be caused by two sources: Treatment Effects: If the treatments have different effects, this could cause the mean for one treatment to be higher (or lower) than the mean for another treatment. Chance or Sampling Error: If there is no treatment effect at all, you would still expect some differences between samples. Mean differences from one sample to another are an example of random, unsystematic sampling error.
17 Considering these sources of variability, the structure of the F-ratio becomes: treatment effect + random differences F = random differences
18 When the null hypothesis is true and there are no differences between treatments, the F-ratio is balanced. That is, when the "treatment effect" is zero, the top and bottom of the F-ratio are measuring the same variance. In this case, you should expect an F-ratio near When the sample data produce an F-ratio near 1.00, we will conclude that there is no significant treatment effect.
19 of Variance (cont'd.) On the other hand, a large treatment effect will produce a large value for the F-ratio. Thus, when the sample data produce a large F-ratio we will reject the null hypothesis and conclude that there are significant differences between treatments. To determine whether an F-ratio is large enough to be significant, you must select an α-level, find the df values for the numerator and denominator of the F-ratio, and consult the F-distribution table to find the critical value. (see appendix B for statistical tables)
20
21 Analysis of Variance and Post Tests The null hypothesis for ANOVA states that for the general population there are no mean differences among the treatments being compared; H 0 : μ 1 = μ 2 = μ 3 =... When the null hypothesis is rejected, the conclusion is that there are significant mean differences. However, the ANOVA simply establishes that differences exist, it does not indicate exactly which treatments are different.
22 Measuring Effect Size for an Analysis of Variance As with other hypothesis tests, an ANOVA evaluates the significance of the sample mean differences; that is, are the differences bigger than would be reasonable to expect just by chance. With large samples, however, it is possible for relatively small mean differences to be statistically significant. Thus, the hypothesis test does not necessarily provide information about the actual size of the mean differences.
23 Measuring Effect Size for an Analysis To supplement the hypothesis test, it is recommended that you calculate a measure of effect size. For an analysis of variance the common technique for measuring effect size is to compute the percentage of variance that is accounted for by the treatment effects.
24 Measuring Effect Size for an Analysis For the t statistics, this percentage was identified as r 2, but in the context of ANOVA the percentage is identified as η 2 (the Greek letter eta, squared). The formula for computing effect size is: SS between treatments η 2 = SS total
25 Post Hoc Tests With more than two treatments, this creates a problem. Specifically, you must follow the ANOVA with additional tests, called post hoc tests, to determine exactly which treatments are different and which are not. The Tukey s HSD and Scheffé test are examples of post hoc tests. These tests are done after an ANOVA where H 0 is rejected with more than two treatment conditions. The tests compare the treatments, two at a time, to test the significance of the mean differences.
Analysis of Variance (ANOVA)
") Research Methods and Ethics in Psychology Week 4 Analysis of Variance (ANOVA) One Way Independent Groups ANOVA Brief revision of some important concepts To introduce the concept of familywise error rate.
Research Methods and Ethics in Psychology Week 4 Analysis of Variance (ANOVA) One Way Independent Groups ANOVA Brief revision of some important concepts To introduce the concept of familywise error rate.
One-Way ANOVAs t-test two statistically significant Type I error alpha null hypothesis dependant variable Independent variable three levels;
 1 One-Way ANOVAs We have already discussed the t-test. The t-test is used for comparing the means of two groups to determine if there is a statistically significant difference between them. The t-test
Testing Means. Related-Samples t Test With Confidence Intervals. 6. Compute a related-samples t test and interpret the results.
 10 Learning Objectives Testing Means After reading this chapter, you should be able to: Related-Samples t Test With Confidence Intervals 1. Describe two types of research designs used when we select related
Analysis of Variance (ANOVA) Program Transcript
 Program Transcript") Analysis of Variance (ANOVA) Program Transcript DR. JENNIFER ANN MORROW: Welcome to Analysis of Variance. My name is Dr. Jennifer Ann Morrow. In today's demonstration, I'll review with you the definition
Analysis of Variance (ANOVA) Program Transcript DR. JENNIFER ANN MORROW: Welcome to Analysis of Variance. My name is Dr. Jennifer Ann Morrow. In today's demonstration, I'll review with you the definition
One-Way Independent ANOVA
 One-Way Independent ANOVA Analysis of Variance (ANOVA) is a common and robust statistical test that you can use to compare the mean scores collected from different conditions or groups in an experiment.
Analysis of Variance: repeated measures
 Analysis of Variance: repeated measures Tests for comparing three or more groups or conditions: (a) Nonparametric tests: Independent measures: Kruskal-Wallis. Repeated measures: Friedman s. (b) Parametric
Still important ideas
 Readings: OpenStax - Chapters 1 13 & Appendix D & E (online) Plous Chapters 17 & 18 - Chapter 17: Social Influences - Chapter 18: Group Judgments and Decisions Still important ideas Contrast the measurement
Applied Statistical Analysis EDUC 6050 Week 4
 Applied Statistical Analysis EDUC 6050 Week 4 Finding clarity using data Today 1. Hypothesis Testing with Z Scores (continued) 2. Chapters 6 and 7 in Book 2 Review! = $ & '! = $ & ' * ) 1. Which formula
Still important ideas
 Readings: OpenStax - Chapters 1 11 + 13 & Appendix D & E (online) Plous - Chapters 2, 3, and 4 Chapter 2: Cognitive Dissonance, Chapter 3: Memory and Hindsight Bias, Chapter 4: Context Dependence Still
Readings: Textbook readings: OpenStax - Chapters 1 13 (emphasis on Chapter 12) Online readings: Appendix D, E & F
 Online readings: Appendix D, E & F") Readings: Textbook readings: OpenStax - Chapters 1 13 (emphasis on Chapter 12) Online readings: Appendix D, E & F Plous Chapters 17 & 18 Chapter 17: Social Influences Chapter 18: Group Judgments and Decisions
Readings: Textbook readings: OpenStax - Chapters 1 13 (emphasis on Chapter 12) Online readings: Appendix D, E & F Plous Chapters 17 & 18 Chapter 17: Social Influences Chapter 18: Group Judgments and Decisions
8/28/2017. If the experiment is successful, then the model will explain more variance than it can t SS M will be greater than SS R
 PSY 5101: Advanced Statistics for Psychological and Behavioral Research 1 If the ANOVA is significant, then it means that there is some difference, somewhere but it does not tell you which means are different
Two-Way Independent ANOVA
 Two-Way Independent ANOVA Analysis of Variance (ANOVA) a common and robust statistical test that you can use to compare the mean scores collected from different conditions or groups in an experiment. There
Readings: Textbook readings: OpenStax - Chapters 1 11 Online readings: Appendix D, E & F Plous Chapters 10, 11, 12 and 14
 Readings: Textbook readings: OpenStax - Chapters 1 11 Online readings: Appendix D, E & F Plous Chapters 10, 11, 12 and 14 Still important ideas Contrast the measurement of observable actions (and/or characteristics)
Two-Way Independent Samples ANOVA with SPSS
 Two-Way Independent Samples ANOVA with SPSS Obtain the file ANOVA.SAV from my SPSS Data page. The data are those that appear in Table 17-3 of Howell s Fundamental statistics for the behavioral sciences
Final Exam PS 217, Fall 2010
 Final Exam PS 27, Fall 200. Farzin, et al. (200) wrote an article that appeared in Psychological Science titled: Spatial resolution of conscious visual perception in infants. The abstract read: Humans
ANOVA. Thomas Elliott. January 29, 2013
 ANOVA Thomas Elliott January 29, 2013 ANOVA stands for analysis of variance and is one of the basic statistical tests we can use to find relationships between two or more variables. ANOVA compares the
Business Statistics Probability
 Business Statistics The following was provided by Dr. Suzanne Delaney, and is a comprehensive review of Business Statistics. The workshop instructor will provide relevant examples during the Skills Assessment
Describe what is meant by a placebo Contrast the double-blind procedure with the single-blind procedure Review the structure for organizing a memo
 Please note the page numbers listed for the Lind book may vary by a page or two depending on which version of the textbook you have. Readings: Lind 1 11 (with emphasis on chapters 10, 11) Please note chapter
Comparing 3 Means- ANOVA
 Comparing 3 Means- ANOVA Evaluation Methods & Statistics- Lecture 7 Dr Benjamin Cowan Research Example- Theory of Planned Behaviour Ajzen & Fishbein (1981) One of the most prominent models of behaviour
Math Section MW 1-2:30pm SR 117. Bekki George 206 PGH
 Math 3339 Section 21155 MW 1-2:30pm SR 117 Bekki George bekki@math.uh.edu 206 PGH Office Hours: M 11-12:30pm & T,TH 10:00 11:00 am and by appointment More than Two Independent Samples: Single Factor Analysis
Describe what is meant by a placebo Contrast the double-blind procedure with the single-blind procedure Review the structure for organizing a memo
 Business Statistics The following was provided by Dr. Suzanne Delaney, and is a comprehensive review of Business Statistics. The workshop instructor will provide relevant examples during the Skills Assessment
Chapter 11. Experimental Design: One-Way Independent Samples Design
 11-1 Chapter 11. Experimental Design: One-Way Independent Samples Design Advantages and Limitations Comparing Two Groups Comparing t Test to ANOVA Independent Samples t Test Independent Samples ANOVA Comparing
Chapter 14 B Section D
 Explaining Psychological Statistics (2 nd Ed.) by Barry H. Cohen Chapter 14 B Section D More about Partial Effect Sizes In Section C, I explained why the ordinary formula for eta squared (SS effect / SS
PSY 216: Elementary Statistics Exam 4
 Name: PSY 16: Elementary Statistics Exam 4 This exam consists of multiple-choice questions and essay / problem questions. For each multiple-choice question, circle the one letter that corresponds to the
Chapter 13: Introduction to Analysis of Variance
 Chapter 13: Introduction to Analysis of Variance Although the t-test is a useful statistic, it is limited to testing hypotheses about two conditions or levels. The analysis of variance (ANOVA) was developed
Stat Wk 9: Hypothesis Tests and Analysis
 Stat 342 - Wk 9: Hypothesis Tests and Analysis Crash course on ANOVA, proc glm Stat 342 Notes. Week 9 Page 1 / 57 Crash Course: ANOVA AnOVa stands for Analysis Of Variance. Sometimes it s called ANOVA,
CHAPTER ONE CORRELATION
 CHAPTER ONE CORRELATION 1.0 Introduction The first chapter focuses on the nature of statistical data of correlation. The aim of the series of exercises is to ensure the students are able to use SPSS to
Hypothesis Testing. Richard S. Balkin, Ph.D., LPC-S, NCC
 Hypothesis Testing Richard S. Balkin, Ph.D., LPC-S, NCC Overview When we have questions about the effect of a treatment or intervention or wish to compare groups, we use hypothesis testing Parametric statistics
Basic Statistics and Data Analysis in Work psychology: Statistical Examples
 Basic Statistics and Data Analysis in Work psychology: Statistical Examples WORK PSYCHOLOGY INTRODUCTION In this chapter we examine a topic which is given too little coverage in most texts of this kind,
PSYCHOLOGY 320L Problem Set #4: Estimating Sample Size, Post Hoc Tests, and Two-Factor ANOVA
 PSYCHOLOGY 320L Problem Set #4: Estimating Sample Size, Post Hoc Tests, and Two-Factor ANOVA Name: Score: 1. Suppose you are planning an experiment for a class project with a group of students and you
Analysis of Variance ANOVA, Part 2. What We Will Cover in This Section. Factorial ANOVA, Two-way Design
 Analysis of Variance ANOVA, Part //007 P33 Analysis of Variance What We Will Cover in This Section Introduction. Overview. Factorial ANOVA Repeated Measures ANOVA. //007 P33 Analysis of Variance Factorial
Describe what is meant by a placebo Contrast the double-blind procedure with the single-blind procedure Review the structure for organizing a memo
 Please note the page numbers listed for the Lind book may vary by a page or two depending on which version of the textbook you have. Readings: Lind 1 11 (with emphasis on chapters 5, 6, 7, 8, 9 10 & 11)
Lesson 11.1: The Alpha Value
 Hypothesis Testing Lesson 11.1: The Alpha Value The alpha value is the degree of risk we are willing to take when making a decision. The alpha value, often abbreviated using the Greek letter α, is sometimes
Research Methods II, Spring Term Logic of repeated measures designs
 Research Methods II, Spring Term 2003 1 Logic of repeated measures designs Imagine you want to test the effect of drinking Fosters on the time it takes to respond to a light turning red. The independent
1) What is the independent variable? What is our Dependent Variable?
 What is the independent variable? What is our Dependent Variable?") 1) What is the independent variable? What is our Dependent Variable? Independent Variable: Whether the font color and word name are the same or different. (Congruency) Dependent Variable: The amount of
1) What is the independent variable? What is our Dependent Variable? Independent Variable: Whether the font color and word name are the same or different. (Congruency) Dependent Variable: The amount of
Research Methods 1 Handouts, Graham Hole,COGS - version 1.0, September 2000: Page 1:
 Research Methods 1 Handouts, Graham Hole,COGS - version 10, September 000: Page 1: T-TESTS: When to use a t-test: The simplest experimental design is to have two conditions: an "experimental" condition
ANALYSIS OF VARIANCE (ANOVA): TESTING DIFFERENCES INVOLVING THREE OR MORE MEANS
: TESTING DIFFERENCES INVOLVING THREE OR MORE MEANS") ANALYSIS OF VARIANCE (ANOVA): TESTING DIFFERENCES INVOLVING THREE OR MORE MEANS REVIEW Testing hypothesis using the difference between two means: One-sample t-test Independent-samples t-test Dependent/Paired-samples
ANALYSIS OF VARIANCE (ANOVA): TESTING DIFFERENCES INVOLVING THREE OR MORE MEANS REVIEW Testing hypothesis using the difference between two means: One-sample t-test Independent-samples t-test Dependent/Paired-samples
Chapter 9. Factorial ANOVA with Two Between-Group Factors 10/22/ Factorial ANOVA with Two Between-Group Factors
 Chapter 9 Factorial ANOVA with Two Between-Group Factors 10/22/2001 1 Factorial ANOVA with Two Between-Group Factors Recall that in one-way ANOVA we study the relation between one criterion variable and
Midterm Exam MMI 409 Spring 2009 Gordon Bleil
 Midterm Exam MMI 409 Spring 2009 Gordon Bleil Table of contents: (Hyperlinked to problem sections) Problem 1 Hypothesis Tests Results Inferences Problem 2 Hypothesis Tests Results Inferences Problem 3
STA 3024 Spring 2013 EXAM 3 Test Form Code A UF ID #
 STA 3024 Spring 2013 Name EXAM 3 Test Form Code A UF ID # Instructions: This exam contains 34 Multiple Choice questions. Each question is worth 3 points, for a total of 102 points (there are TWO bonus
The t-test: Answers the question: is the difference between the two conditions in my experiment "real" or due to chance?
 The t-test: Answers the question: is the difference between the two conditions in my experiment "real" or due to chance? Two versions: (a) Dependent-means t-test: ( Matched-pairs" or "one-sample" t-test).
Chapter 13: Introduction to Analysis of Variance
 Chapter 13: Introduction to Analysis of Variance Although the t-test is a useful statistic, it is limited to testing hypotheses about two conditions or levels. The analysis of variance (ANOVA) was developed
Statistics for EES Factorial analysis of variance
 Statistics for EES Factorial analysis of variance Dirk Metzler http://evol.bio.lmu.de/_statgen 1. July 2013 1 ANOVA and F-Test 2 Pairwise comparisons and multiple testing 3 Non-parametric: The Kruskal-Wallis
Comparing Two Means using SPSS (T-Test)
") Indira Gandhi Institute of Development Research From the SelectedWorks of Durgesh Chandra Pathak Winter January 23, 2009 Comparing Two Means using SPSS (T-Test) Durgesh Chandra Pathak Available at: https://works.bepress.com/durgesh_chandra_pathak/12/
Indira Gandhi Institute of Development Research From the SelectedWorks of Durgesh Chandra Pathak Winter January 23, 2009 Comparing Two Means using SPSS (T-Test) Durgesh Chandra Pathak Available at: https://works.bepress.com/durgesh_chandra_pathak/12/
EPS 625 INTERMEDIATE STATISTICS TWO-WAY ANOVA IN-CLASS EXAMPLE (FLEXIBILITY)
") EPS 625 INTERMEDIATE STATISTICS TO-AY ANOVA IN-CLASS EXAMPLE (FLEXIBILITY) A researcher conducts a study to evaluate the effects of the length of an exercise program on the flexibility of female and male
EPS 625 INTERMEDIATE STATISTICS TO-AY ANOVA IN-CLASS EXAMPLE (FLEXIBILITY) A researcher conducts a study to evaluate the effects of the length of an exercise program on the flexibility of female and male
Statisticians deal with groups of numbers. They often find it helpful to use
 Chapter 4 Finding Your Center In This Chapter Working within your means Meeting conditions The median is the message Getting into the mode Statisticians deal with groups of numbers. They often find it
Research Analysis MICHAEL BERNSTEIN CS 376
 Research Analysis MICHAEL BERNSTEIN CS 376 Last time What is a statistical test? Chi-square t-test Paired t-test 2 Today ANOVA Posthoc tests Two-way ANOVA Repeated measures ANOVA 3 Recall: hypothesis testing
Dr. Kelly Bradley Final Exam Summer {2 points} Name
 {2 points} Name You MUST work alone no tutors; no help from classmates. Email me or see me with questions. You will receive a score of 0 if this rule is violated. This exam is being scored out of 00 points.
SPSS output for 420 midterm study
 Ψ Psy Midterm Part In lab (5 points total) Your professor decides that he wants to find out how much impact amount of study time has on the first midterm. He randomly assigns students to study for hours,
Lesson 9: Two Factor ANOVAS
 Published on Agron 513 (https://courses.agron.iastate.edu/agron513) Home > Lesson 9 Lesson 9: Two Factor ANOVAS Developed by: Ron Mowers, Marin Harbur, and Ken Moore Completion Time: 1 week Introduction
Lessons in biostatistics
 Lessons in biostatistics The test of independence Mary L. McHugh Department of Nursing, School of Health and Human Services, National University, Aero Court, San Diego, California, USA Corresponding author:
CHAPTER - 6 STATISTICAL ANALYSIS. This chapter discusses inferential statistics, which use sample data to
 CHAPTER - 6 STATISTICAL ANALYSIS 6.1 Introduction This chapter discusses inferential statistics, which use sample data to make decisions or inferences about population. Populations are group of interest
Exam 3 PS 217, Spring 2011
 Exam 3 PS 217, Spring 2011 1. First, some random questions about topics we covered this semester. [10 pts] a. In a repeated measures design, what is the effect of counterbalancing on order or carry-over
The Single-Sample t Test and the Paired-Samples t Test
 C H A P T E R 9 The Single-Sample t Test and the Paired-Samples t Test BEFORE YOU GO ON The t Distributions Estimating Population Standard Deviation from the Sample Calculating Standard Error for the t
Biology 345: Biometry Fall 2005 SONOMA STATE UNIVERSITY Lab Exercise 8 One Way ANOVA and comparisons among means Introduction
 Biology 345: Biometry Fall 2005 SONOMA STATE UNIVERSITY Lab Exercise 8 One Way ANOVA and comparisons among means Introduction In this exercise, we will conduct one-way analyses of variance using two different
One way Analysis of Variance (ANOVA)
") One way Analysis of Variance (ANOVA) Esra Akdeniz March 22nd, 2016 Introduction Test hypothesis concerning one population mean. Test hypothesis concerning two population means What if we want to compare
One way Analysis of Variance (ANOVA) Esra Akdeniz March 22nd, 2016 Introduction Test hypothesis concerning one population mean. Test hypothesis concerning two population means What if we want to compare
Psychology Research Process
 Psychology Research Process Logical Processes Induction Observation/Association/Using Correlation Trying to assess, through observation of a large group/sample, what is associated with what? Examples:
Statistical Significance, Effect Size, and Practical Significance Eva Lawrence Guilford College October, 2017
 Statistical Significance, Effect Size, and Practical Significance Eva Lawrence Guilford College October, 2017 Definitions Descriptive statistics: Statistical analyses used to describe characteristics of
CHAPTER THIRTEEN. Data Analysis and Interpretation: Part II.Tests of Statistical Significance and the Analysis Story CHAPTER OUTLINE
 CHAPTER THIRTEEN Data Analysis and Interpretation: Part II.Tests of Statistical Significance and the Analysis Story CHAPTER OUTLINE OVERVIEW NULL HYPOTHESIS SIGNIFICANCE TESTING (NHST) EXPERIMENTAL SENSITIVITY
Simple Sensitivity Analyses for Matched Samples Thomas E. Love, Ph.D. ASA Course Atlanta Georgia https://goo.
 Goal of a Formal Sensitivity Analysis To replace a general qualitative statement that applies in all observational studies the association we observe between treatment and outcome does not imply causation
1. Below is the output of a 2 (gender) x 3(music type) completely between subjects factorial ANOVA on stress ratings
 x 3(music type) completely between subjects factorial ANOVA on stress ratings") SPSS 3 Practice Interpretation questions A researcher is interested in the effects of music on stress levels, and how stress levels might be related to anxiety and life satisfaction. 1. Below is the output
SPSS 3 Practice Interpretation questions A researcher is interested in the effects of music on stress levels, and how stress levels might be related to anxiety and life satisfaction. 1. Below is the output
CHAPTER OBJECTIVES - STUDENTS SHOULD BE ABLE TO:
 3 Chapter 8 Introducing Inferential Statistics CHAPTER OBJECTIVES - STUDENTS SHOULD BE ABLE TO: Explain the difference between descriptive and inferential statistics. Define the central limit theorem and
Final Exam Practice Test
 Final Exam Practice Test The t distribution and z-score distributions are located in the back of your text book (the appendices) You will be provided with a new copy of each during your final exam True
Chapter 11 Nonexperimental Quantitative Research Steps in Nonexperimental Research
 Chapter 11 Nonexperimental Quantitative Research (Reminder: Don t forget to utilize the concept maps and study questions as you study this and the other chapters.) Nonexperimental research is needed because
A Brief (very brief) Overview of Biostatistics. Jody Kreiman, PhD Bureau of Glottal Affairs
 Overview of Biostatistics. Jody Kreiman, PhD Bureau of Glottal Affairs") A Brief (very brief) Overview of Biostatistics Jody Kreiman, PhD Bureau of Glottal Affairs What We ll Cover Fundamentals of measurement Parametric versus nonparametric tests Descriptive versus inferential
A Brief (very brief) Overview of Biostatistics Jody Kreiman, PhD Bureau of Glottal Affairs What We ll Cover Fundamentals of measurement Parametric versus nonparametric tests Descriptive versus inferential
12.1 Inference for Linear Regression. Introduction
 12.1 Inference for Linear Regression vocab examples Introduction Many people believe that students learn better if they sit closer to the front of the classroom. Does sitting closer cause higher achievement,
Chapter 12: Analysis of covariance, ANCOVA
 Chapter 12: Analysis of covariance, ANCOVA Smart Alex s Solutions Task 1 A few years back I was stalked. You d think they could have found someone a bit more interesting to stalk, but apparently times
Variability. After reading this chapter, you should be able to do the following:
 LEARIG OBJECTIVES C H A P T E R 3 Variability After reading this chapter, you should be able to do the following: Explain what the standard deviation measures Compute the variance and the standard deviation
ANOVA in SPSS (Practical)
") ANOVA in SPSS (Practical) Analysis of Variance practical In this practical we will investigate how we model the influence of a categorical predictor on a continuous response. Centre for Multilevel Modelling
ANOVA in SPSS (Practical) Analysis of Variance practical In this practical we will investigate how we model the influence of a categorical predictor on a continuous response. Centre for Multilevel Modelling
25. Two-way ANOVA. 25. Two-way ANOVA 371
 25. Two-way ANOVA The Analysis of Variance seeks to identify sources of variability in data with when the data is partitioned into differentiated groups. In the prior section, we considered two sources
Sheila Barron Statistics Outreach Center 2/8/2011
 Sheila Barron Statistics Outreach Center 2/8/2011 What is Power? When conducting a research study using a statistical hypothesis test, power is the probability of getting statistical significance when
Research paper. One-way Analysis of Variance (ANOVA) Research paper. SPSS output. Learning objectives. Alcohol and driving ability
 Research paper. SPSS output. Learning objectives. Alcohol and driving ability") Research paper Alcohol and driving ability One-way Analysis of Variance (ANOVA) Thirty-six people took part in an experiment to discover the effects of alcohol on drinking ability. They were randomly assigned
Research paper Alcohol and driving ability One-way Analysis of Variance (ANOVA) Thirty-six people took part in an experiment to discover the effects of alcohol on drinking ability. They were randomly assigned
Psychology Research Process
 Psychology Research Process Logical Processes Induction Observation/Association/Using Correlation Trying to assess, through observation of a large group/sample, what is associated with what? Examples:
Research Questions, Variables, and Hypotheses: Part 2. Review. Hypotheses RCS /7/04. What are research questions? What are variables?
 Research Questions, Variables, and Hypotheses: Part 2 RCS 6740 6/7/04 1 Review What are research questions? What are variables? Definition Function Measurement Scale 2 Hypotheses OK, now that we know how
HS Exam 1 -- March 9, 2006
 Please write your name on the back. Don t forget! Part A: Short answer, multiple choice, and true or false questions. No use of calculators, notes, lab workbooks, cell phones, neighbors, brain implants,
CHAPTER NINE DATA ANALYSIS / EVALUATING QUALITY (VALIDITY) OF BETWEEN GROUP EXPERIMENTS
 OF BETWEEN GROUP EXPERIMENTS") CHAPTER NINE DATA ANALYSIS / EVALUATING QUALITY (VALIDITY) OF BETWEEN GROUP EXPERIMENTS Chapter Objectives: Understand Null Hypothesis Significance Testing (NHST) Understand statistical significance and
CHAPTER NINE DATA ANALYSIS / EVALUATING QUALITY (VALIDITY) OF BETWEEN GROUP EXPERIMENTS Chapter Objectives: Understand Null Hypothesis Significance Testing (NHST) Understand statistical significance and
Interactions between predictors and two-factor ANOVA
 Interactions between predictors and two-factor ANOVA March 6, 2017 psych10.stanford.edu Announcements / Action Items Quiz 4 is on Wednesday 3/7 Option to earn extra credit (added to Quiz 3) New topics
Chapter 23. Inference About Means. Copyright 2010 Pearson Education, Inc.
 Chapter 23 Inference About Means Copyright 2010 Pearson Education, Inc. Getting Started Now that we know how to create confidence intervals and test hypotheses about proportions, it d be nice to be able
Statistical inference provides methods for drawing conclusions about a population from sample data.
 Chapter 14 Tests of Significance Statistical inference provides methods for drawing conclusions about a population from sample data. Two of the most common types of statistical inference: 1) Confidence
Problem #1 Neurological signs and symptoms of ciguatera poisoning as the start of treatment and 2.5 hours after treatment with mannitol.
 Ho (null hypothesis) Ha (alternative hypothesis) Problem #1 Neurological signs and symptoms of ciguatera poisoning as the start of treatment and 2.5 hours after treatment with mannitol. Hypothesis: Ho:
Overview of Lecture. Survey Methods & Design in Psychology. Correlational statistics vs tests of differences between groups
 Survey Methods & Design in Psychology Lecture 10 ANOVA (2007) Lecturer: James Neill Overview of Lecture Testing mean differences ANOVA models Interactions Follow-up tests Effect sizes Parametric Tests
STAT 200. Guided Exercise 4
 STAT 200 Guided Exercise 4 1. Let s Revisit this Problem. Fill in the table again. Diagnostic tests are not infallible. We often express a fale positive and a false negative with any test. There are further
Regression Including the Interaction Between Quantitative Variables
 Regression Including the Interaction Between Quantitative Variables The purpose of the study was to examine the inter-relationships among social skills, the complexity of the social situation, and performance
3 CONCEPTUAL FOUNDATIONS OF STATISTICS
 3 CONCEPTUAL FOUNDATIONS OF STATISTICS In this chapter, we examine the conceptual foundations of statistics. The goal is to give you an appreciation and conceptual understanding of some basic statistical
MULTIPLE LINEAR REGRESSION 24.1 INTRODUCTION AND OBJECTIVES OBJECTIVES
 24 MULTIPLE LINEAR REGRESSION 24.1 INTRODUCTION AND OBJECTIVES In the previous chapter, simple linear regression was used when you have one independent variable and one dependent variable. This chapter
Day 11: Measures of Association and ANOVA
 Day 11: Measures of Association and ANOVA Daniel J. Mallinson School of Public Affairs Penn State Harrisburg mallinson@psu.edu PADM-HADM 503 Mallinson Day 11 November 2, 2017 1 / 45 Road map Measures of
PSYCHOLOGY 300B (A01) One-sample t test. n = d = ρ 1 ρ 0 δ = d (n 1) d
 One-sample t test. n = d = ρ 1 ρ 0 δ = d (n 1) d") PSYCHOLOGY 300B (A01) Assignment 3 January 4, 019 σ M = σ N z = M µ σ M d = M 1 M s p d = µ 1 µ 0 σ M = µ +σ M (z) Independent-samples t test One-sample t test n = δ δ = d n d d = µ 1 µ σ δ = d n n = δ
PSYCHOLOGY 300B (A01) Assignment 3 January 4, 019 σ M = σ N z = M µ σ M d = M 1 M s p d = µ 1 µ 0 σ M = µ +σ M (z) Independent-samples t test One-sample t test n = δ δ = d n d d = µ 1 µ σ δ = d n n = δ
Study Guide for the Final Exam
 Study Guide for the Final Exam When studying, remember that the computational portion of the exam will only involve new material (covered after the second midterm), that material from Exam 1 will make
Fixed-Effect Versus Random-Effects Models
 PART 3 Fixed-Effect Versus Random-Effects Models Introduction to Meta-Analysis. Michael Borenstein, L. V. Hedges, J. P. T. Higgins and H. R. Rothstein 2009 John Wiley & Sons, Ltd. ISBN: 978-0-470-05724-7
EXERCISE: HOW TO DO POWER CALCULATIONS IN OPTIMAL DESIGN SOFTWARE
 ...... EXERCISE: HOW TO DO POWER CALCULATIONS IN OPTIMAL DESIGN SOFTWARE TABLE OF CONTENTS 73TKey Vocabulary37T... 1 73TIntroduction37T... 73TUsing the Optimal Design Software37T... 73TEstimating Sample
Steps in Inferential Analyses. Inferential Statistics. t-test
 Steps in Inferential Analyses Inferential Statistics Dr. K. A. Korb University of Jos VassarStats: http://faculty.vassar.edu/lowry/vassarstats.html In any inferential statistic, the first step is always
Library of Congress Cataloging-in-Publication Data. QA U dc
 Routledge Taylor & Francis Group 270 Madison Avenue New York, NY 10016 Routledge Taylor & Francis Group 27 Church Road Hove, East Sussex BN3 2FA 2010 by Taylor and Francis Group, LLC Routledge is an imprint
Levene Statistic df1 df2 Sig
 Activity #: Follow-up ests (Bonferroni method) ection 1. Resources: handicap.sav he U.. Vocational Rehabilitation Act of 19 prohibited discrimination against people with physical disabilities. he act defined
THIS PROBLEM HAS BEEN SOLVED BY USING THE CALCULATOR. A 90% CONFIDENCE INTERVAL IS ALSO SHOWN. ALL QUESTIONS ARE LISTED BELOW THE RESULTS.
 Math 117 Confidence Intervals and Hypothesis Testing Interpreting Results SOLUTIONS The results are given. Interpret the results and write the conclusion within context. Clearly indicate what leads to
ID# Exam 3 PS 217, Spring 2009 (You must use your official student ID)
") ID# Exam 3 PS 217, Spring 2009 (You must use your official student ID) As always, the Skidmore Honor Code is in effect. You ll attest to your adherence to the code at the end of the exam. Read each question
ID# Exam 3 PS 217, Spring 2009 (You must use your official student ID) As always, the Skidmore Honor Code is in effect. You ll attest to your adherence to the code at the end of the exam. Read each question
Inferential Statistics
 Inferential Statistics and t - tests ScWk 242 Session 9 Slides Inferential Statistics Ø Inferential statistics are used to test hypotheses about the relationship between the independent and the dependent
t-test for r Copyright 2000 Tom Malloy. All rights reserved
 t-test for r Copyright 2000 Tom Malloy. All rights reserved This is the text of the in-class lecture which accompanied the Authorware visual graphics on this topic. You may print this text out and use
Overview. Survey Methods & Design in Psychology. Readings. Significance Testing. Significance Testing. The Logic of Significance Testing
 Survey Methods & Design in Psychology Lecture 11 (2007) Significance Testing, Power, Effect Sizes, Confidence Intervals, Publication Bias, & Scientific Integrity Overview Significance testing Inferential
Instructions for doing two-sample t-test in Excel
 Instructions for doing two-sample t-test in Excel (1) If you do not see Data Analysis in the menu, this means you need to use Add-ins and make sure that the box in front of Analysis ToolPak is checked.
CHAPTER TWO REGRESSION
 CHAPTER TWO REGRESSION 2.0 Introduction The second chapter, Regression analysis is an extension of correlation. The aim of the discussion of exercises is to enhance students capability to assess the effect