Chapter 1: Data Collection Pearson Prentice Hall. All rights reserved
|
|
|
- Veronica Jones
- 6 years ago
- Views:
Transcription

1 Chapter 1: Data Collection 2010 Pearson Prentice Hall. All rights reserved 1-1
2 Statistics is the science of collecting, organizing, summarizing, and analyzing information to draw conclusions or answer questions. In addition, statistics is about providing a measure of confidence in any conclusions. The information referred to in the definition is data. Data are a fact or proposition used to draw a conclusion or make a decision. Data describe characteristics of of an individual. 1-2

3 The entire group of individuals to be studied is called the population. An individual is a person or object that is a member of the population being studied. A sample is a subset of the population that is being studied. 1-3
4 Descriptive statistics consist of organizing and summarizing data. Descriptive statistics describe data through numerical summaries, tables, and graphs. 1-4
5 Inferential statistics uses methods that take results from a sample, extends them to the population, and measures the reliability of the result. 1-5
6 A statistic is a numerical summary based on a sample. A parameter is a numerical summary of a population. 1-6
7 EXAMPLE PARAMETER VERSUS STATISTIC Statistic or parameter: Suppose the percentage of all students on your campus who have a job is 84.9%. This value represents a parameter because it is a numerical summary of a population. Suppose a sample of 250 students is obtained, and from this sample we find that 86.3% have a job. This value represents a statistic because it is a numerical summary based on a sample Pearson Prentice Hall. All rights reserved 1-7

8 2010 Pearson Prentice Hall. All rights reserved 1-8
9 Variables are the characteristics of the individuals within the population. The list of observations a variable assumes is called data. 1-9
10 Qualitative or Categorical variables allow for classification of individuals based on some attribute or characteristic. Quantitative variables provide numerical measures of individuals. Arithmetic operations such as addition and subtraction can be performed on the values of the quantitative variable and provide meaningful results. 1-10
11 EXAMPLE Distinguishing between Qualitative and Quantitative Variables Researcher Elisabeth Kvaavik and others studied factors that affect the eating habits of adults in their mid-thirties. (Source: Kvaavik E, et. al. Psychological explanatorys of eating habits among adults in their mid-30 s (2005) International Journal of Behavioral Nutrition and Physical Activity (2)9.) Classify each of the following variables considered in the study as qualitative or quantitative. a. Nationality b. Number of children c. Household income in the previous year d. Level of education Qualitative Quantitative Qualitative Quantitative e. Daily intake of whole grains (measured in grams per day) Quantitative 2010 Pearson Prentice Hall. All rights reserved 1-11

12 A discrete variable is a quantitative variable that either has a finite number of possible values or a countable number of possible values. The term countable means the values result from counting such as 0, 1, 2, 3, and so on. A continuous variable is a quantitative variable that has an infinite number of possible values it can take on and can be measured to any desired level of accuracy. 1-12
13 EXAMPLE Distinguishing between Qualitative and Quantitative Variables Researcher Elisabeth Kvaavik and others studied factors that affect the eating habits of adults in their mid-thirties. (Source: Kvaavik E, et. al. Psychological explanatorys of eating habits among adults in their mid-30 s (2005) International Journal of Behavioral Nutrition and Physical Activity (2)9.) Classify each of the following quantitative variables considered in the study as discrete or continuous. a. Number of children Discrete b. Household income in the previous year Continuous c. Daily intake of whole grains (measured in grams per day) Continuous 1-13
14 A variable is at the nominal level of measurement if the values of the variable name, label, or categorize. In addition, the naming scheme does not allow for the values of the variable to be arranged in a ranked, or specific, order. A variable is at the ordinal level of measurement if it has the properties of the nominal level of measurement and the naming scheme allows for the values of the variable to be arranged in a ranked, or specific, order. A variable is at the interval level of measurement if it has the properties of the ordinal level of measurement and the differences in the values of the variable have meaning. A value of zero in the interval level of measurement does not mean the absence of the quantity. Arithmetic operations such as addition and subtraction can be performed on values of the variable. A variable is at the ratio level of measurement if it has the properties of the interval level of measurement and the ratios of the values of the variable have meaning. A value of zero in the ratio level of measurement means the absence of the quantity. Arithmetic operations such as multiplication and division can be performed on the values of the variable. 1-14
15 EXAMPLE DETERMINING THE LEVEL OF MEASUREMENT OF A VARIABLE A study was conducted to assess school eating patterns in high schools in the United States. The study analyzed the impact of vending machines and school policies on student food consumption. A total of 1088 students in 20 schools were surveyed. (Source: Neumark-Sztainer D, French SA, Hannan PJ, Story M and Fulkerson JA (2005) School lunch and snacking patterns among high school students: associations with school food environment and policies. International Journal of Behavioral Nutrition and Physical Activity 2005, (2)14.) Classify each of the following variables considered in the study as qualitative or quantitative. a. Number of snack and soft drink vending machines in the school Ratio b. Whether or not the school has a closed campus policy during lunch Nominal c. Class rank (Freshman, Sophomore, Junior, Senior) Ordinal d. Number of days per week a student eats school lunch Ratio 2010 Pearson Prentice Hall. All rights reserved 1-15
16 In research, we wish to determine how varying the amount of an explanatory variable affects the value of a response variable. 1-16
17 An observational study measures the value of the response variable without attempting to influence the value of either the response or explanatory variables. That is, in an observational study, the researcher observes the behavior of the individuals in the study without trying to influence the outcome of the study. If a researcher assigns the individuals in a study to a certain group, intentionally changes the value of the explanatory variable, and then records the value of the response variable for each group, the researcher is conducting a designed experiment. 1-17
18 Confounding in a study occurs when the effects of two or more explanatory variables are not separated. Therefore, any relation that may exist between an explanatory variable and the response variable may be due to some other variable or variables not accounted for in the study. A lurking variable is an explanatory variable that was not considered in a study, but that affect the value of the response variable in the study. In addition, lurking variables are typically related to any explanatory variables considered in the study. 1-18
19 A census is a list of all individuals in a population along with certain characteristics of each individual. 1-19
20 Random sampling is the process of using chance to select individuals from a population to be included in the sample. 1-20
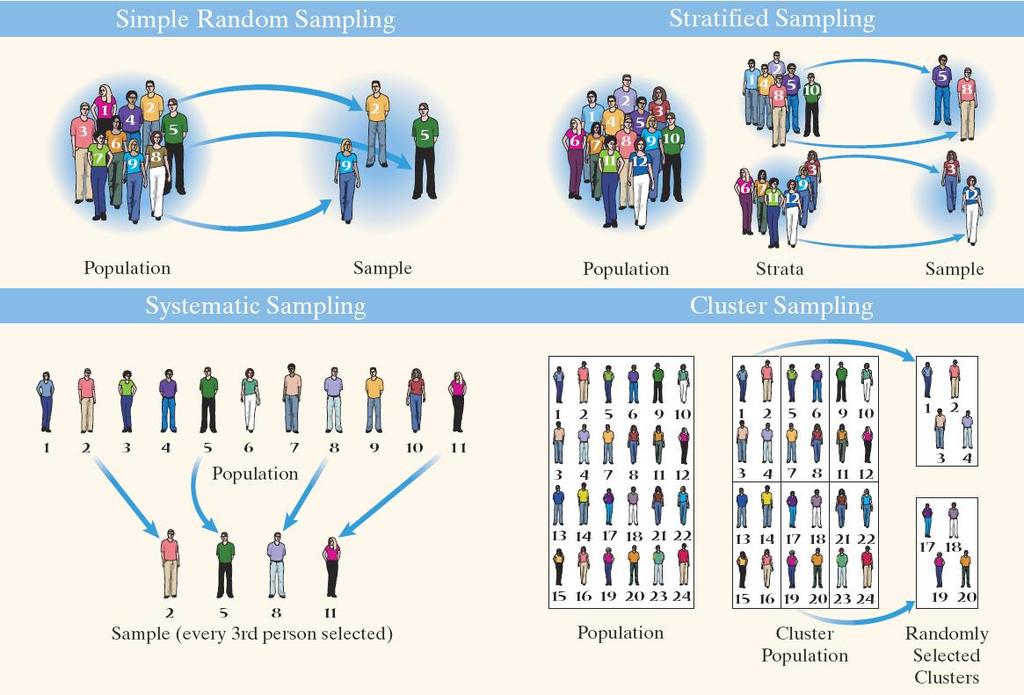
21 A sample of size n from a population of size N is obtained through simple random sampling if every possible sample of size n has an equally likely chance of occurring. The sample is then called a simple random sample. 1-21
22 A stratified sample is one obtained by separating the population into homogeneous, nonoverlapping groups called strata, and then obtaining a simple random sample from each stratum. 1-22
23 A systematic sample is obtained by selecting every k th individual from the population. The first individual selected is a random number between 1 and k. 1-23
24 A cluster sample is obtained by selecting all individuals within a randomly selected collection or group of individuals. 1-24
25 1-25


26 A convenience sample is one in which the individuals in the sample are easily obtained. Any studies that use this type of sampling generally have results that are suspect. Results should be looked upon with extreme skepticism Pearson Prentice Hall. All rights reserved 1-26
27 If the results of the sample are not representative of the population, then the sample has bias. Three Sources of Bias 1. Sampling Bias 2. Nonresponse Bias 3. Response Bias 1-27
28 Sampling bias means that the technique used to obtain the individuals to be in the sample tend to favor one part of the population over another. Undercoverage is a type of sampling bias. Undercoverage occurs when the proportion of one segment of the population is lower in a sample than it is in the population. 1-28
29 Nonresponse bias exists when individuals selected to be in the sample who do not respond to the survey have different opinions from those who do. Nonresponse can be improved through the use of callbacks or rewards/incentives. 1-29
30 Response bias exists when the answers on a survey do not reflect the true feelings of the respondent. Types of Response Bias 1. Interviewer error 2. Misrepresented answers 3. Words used in survey question 4. Order of the questions or words within the question 1-30
31 An experiment is a controlled study conducted to determine the effect of varying one or more explanatory variables or factors has on a response variable. Any combination of the values of the factors is called a treatment. The experimental unit (or subject) is a person, object or some other well-defined item upon which a treatment is applied. A control group serves as a baseline treatment that can be used to compare to other treatments. A placebo is an innocuous medication, such as a sugar tablet, that looks, tastes, and smells like the experimental medication. 1-31
32 Blinding refers to nondisclosure of the treatment an experimental unit is receiving. A single-blind experiment is one in which the experimental unit (or subject) does not know which treatment he or she is receiving. A double-blind experiment is one in which neither the experimental unit nor the researcher in contact with the experimental unit knows which treatment the experimental unit is receiving. 1-32
Ch 1.1 & 1.2 Basic Definitions for Statistics
 Ch 1.1 & 1.2 Basic Definitions for Statistics Objective A : Basic Definition A1. Definition What is Statistics? Statistics is the science of collecting, organizing, summarizing, and analyzing data to draw
Sampling. (James Madison University) January 9, / 13
 January 9, / 13") Sampling The population is the entire group of individuals about which we want information. A sample is a part of the population from which we actually collect information. A sampling design describes
Sampling The population is the entire group of individuals about which we want information. A sample is a part of the population from which we actually collect information. A sampling design describes
Mini-Lecture 1.1 Introduction to the Practice of Statistics
 Mini-Lecture 1.1 Introduction to the Practice of Statistics Objectives 1. Define statistics and statistical thinking 2. Explain the process of statistics 3. Distinguish between qualitative and quantitative
Lecture Slides. Elementary Statistics Eleventh Edition. by Mario F. Triola. and the Triola Statistics Series 1.1-1
 Lecture Slides Elementary Statistics Eleventh Edition and the Triola Statistics Series by Mario F. Triola 1.1-1 Chapter 1 Introduction to Statistics 1-1 Review and Preview 1-2 Statistical Thinking 1-3
The Nature of Probability and Statistics
 Chapter 1 The Nature of Probability and Statistics Chapter 1 Overview Introduction 1-1 Descriptive and Inferential Statistics 1-2 Variables and Types of Data 1-3 Data Collection & Sampling Techniques 1-4
Chapter 1 Data Collection
 Chapter 1 Data Collection OUTLINE 1.1 Introduction to the Practice of Statistics 1.2 Observational Studies versus Designed Experiments 1.3 Simple Random Sampling 1.4 Other Effective Sampling Methods 1.5
Introduction to Statistics
 Introduction to Statistics Parameter: measurable characteristic of a population. Population: all members of a definable group. For statistical purposes a population must have definable characteristics
Vocabulary. Bias. Blinding. Block. Cluster sample
 Bias Blinding Block Census Cluster sample Confounding Control group Convenience sample Designs Experiment Experimental units Factor Level Any systematic failure of a sampling method to represent its population
Sta 309 (Statistics And Probability for Engineers)
") Instructor: Prof. Mike Nasab Sta 309 (Statistics And Probability for Engineers) Chapter (1) 1. Statistics: The science of collecting, organizing, summarizing, analyzing numerical information called data
Instructor: Prof. Mike Nasab Sta 309 (Statistics And Probability for Engineers) Chapter (1) 1. Statistics: The science of collecting, organizing, summarizing, analyzing numerical information called data
aps/stone U0 d14 review d2 teacher notes 9/14/17 obj: review Opener: I have- who has
 aps/stone U0 d14 review d2 teacher notes 9/14/17 obj: review Opener: I have- who has 4: You should be able to explain/discuss each of the following words/concepts below... Observational Study/Sampling
Unit 1 Exploring and Understanding Data
 Unit 1 Exploring and Understanding Data Area Principle Bar Chart Boxplot Conditional Distribution Dotplot Empirical Rule Five Number Summary Frequency Distribution Frequency Polygon Histogram Interquartile
Section 6.1 Sampling. Population each element (or person) from the set of observations that can be made (entire group)
 from the set of observations that can be made (entire group)") Section 6.1 Sampling Population each element (or person) from the set of observations that can be made (entire group) Sample a subset of the population Census systematically getting information about an
Section 6.1 Sampling Population each element (or person) from the set of observations that can be made (entire group) Sample a subset of the population Census systematically getting information about an
Population. population. parameter. Census versus Sample. Statistic. sample. statistic. Parameter. Population. Example: Census.
 Population Population the complete collection of ALL individuals (scores, people, measurements, etc.) to be studied the population is usually too big to be studied directly, then statistics is used Parameter
AP Statistics Exam Review: Strand 2: Sampling and Experimentation Date:
 AP Statistics NAME: Exam Review: Strand 2: Sampling and Experimentation Date: Block: II. Sampling and Experimentation: Planning and conducting a study (10%-15%) Data must be collected according to a well-developed
Introduction to Biostatics.
 Introduction to Biostatics. Shahzad Bashir RN, BScN. 1 ELEMENTARY STATISTICS MARIO F. TRIOLA EIGHTH EDITION 2 ELEMENTARY STATISTICS Chapter 1 Introduction to Statistics MARIO F. TRIOLA EIGHTH EDITION 3
Chapter 2. The Data Analysis Process and Collecting Data Sensibly. Copyright 2005 Brooks/Cole, a division of Thomson Learning, Inc.
 Chapter 2 The Data Analysis Process and Collecting Data Sensibly Important Terms Variable A variable is any characteristic whose value may change from one individual to another Examples: Brand of television
You can t fix by analysis what you bungled by design. Fancy analysis can t fix a poorly designed study.
 You can t fix by analysis what you bungled by design. Light, Singer and Willett Or, not as catchy but perhaps more accurate: Fancy analysis can t fix a poorly designed study. Producing Data The Role of
Sampling Reminders about content and communications:
 Sampling A free response question dealing with sampling or experimental design has appeared on every AP Statistics exam. The question is designed to assess your understanding of fundamental concepts such
Design, Sampling, and Probability
 STAT 269 Design, Sampling, and Probability Three ways to classify data Quantitative vs. Qualitative Quantitative Data: data that represents counts or measurements, answers the questions how much? or how
Chapter 1: Introduction to Statistics
 Chapter 1: Introduction to Statistics Name Period 1 1.1 Review and Preview Data: Ex: measurements, genders, survey responses Statistics: Common & Important Goal of Statistics: Population: Ex: scores, people,
IS STATISTICS 100% CORRECT?
 TYPES OF DATA IS STATISTICS 100% CORRECT? 2 DATA SOURSES Primary Data Collection Secondary Data Compilation Print or Electronic Observation 3 Survey Experimentation 3 TYPES OF DATA Data Categorical Numerical
Data Collection. MATH 130, Elements of Statistics I. J. Robert Buchanan. Fall Department of Mathematics
 Data Collection MATH 130, Elements of Statistics I J. Robert Buchanan Department of Mathematics Fall 2018 Big Definition Statistics is the science of collecting, organizing, summarizing, and analyzing
Chapter 1: The Nature of Probability and Statistics
 Chapter 1: The Nature of Probability and Statistics Diana Pell Section 1.1: Descriptive and Inferential Statistics Statistics is the science of conducting studies to collect, organize, summarize, analyze,
Section 6.1 Sampling. Population each element (or person) from the set of observations that can be made (entire group)
 from the set of observations that can be made (entire group)") Section 6.1 Sampling Population each element (or person) from the set of observations that can be made (entire group) Sample a subset of the population Census systematically getting information about an
Section 6.1 Sampling Population each element (or person) from the set of observations that can be made (entire group) Sample a subset of the population Census systematically getting information about an
Section 1.1 What is Statistics?
 Chapter 1 Getting Started Name Section 1.1 What is Statistics? Objective: In this lesson you learned how to identify variables in a statistical study, distinguish between quantitative and qualitative variables,
Chapter 3. Producing Data
 Chapter 3. Producing Data Introduction Mostly data are collected for a specific purpose of answering certain questions. For example, Is smoking related to lung cancer? Is use of hand-held cell phones associated
Variable Data univariate data set bivariate data set multivariate data set categorical qualitative numerical quantitative
 The Data Analysis Process and Collecting Data Sensibly Important Terms Variable A variable is any characteristic whose value may change from one individual to another Examples: Brand of television Height
CH 13 Experiments and observational Studies
 CH 13 Experiments and observational Studies Key Terms Observational Study Retrospective Study Prospective Study Experiment Random Assignment Factor Response Experimental Units Level Treatment Principles
Probability and Statistics Chapter 1 Notes
 Probability and Statistics Chapter 1 Notes I Section 1-1 A is the science of collecting, organizing, analyzing, and interpreting data in order to make decisions 1 is information coming from observations,
Examining Relationships Least-squares regression. Sections 2.3
 Examining Relationships Least-squares regression Sections 2.3 The regression line A regression line describes a one-way linear relationship between variables. An explanatory variable, x, explains variability
Chapter 3. Producing Data
 Chapter 3 Producing Data Types of data collected Anecdotal data data collected haphazardly (not representative!!) Available data existing data (examples: internet, library, census bureau,.) Gather own
Slide 1 - Introduction to Statistics Tutorial: An Overview Slide notes
 Slide 1 - Introduction to Statistics Tutorial: An Overview Introduction to Statistics Tutorial: An Overview. This tutorial is the first in a series of several tutorials that introduce probability and statistics.
Data = collections of observations, measurements, gender, survey responses etc. Sample = collection of some members (a subset) of the population
 of the population") Chapter 1: Basic Ideas 1.1 Sampling Statistics = the Science of Data By collecting a limited amount of data, we want to say something about the whole group that we want to study, i.e. we want to say something
Chapter 1: Basic Ideas 1.1 Sampling Statistics = the Science of Data By collecting a limited amount of data, we want to say something about the whole group that we want to study, i.e. we want to say something
General Biostatistics Concepts
 General Biostatistics Concepts Dongmei Li Department of Public Health Sciences Office of Public Health Studies University of Hawai i at Mānoa Outline 1. What is Biostatistics? 2. Types of Measurements
Unit 3: Collecting Data. Observational Study Experimental Study Sampling Bias Types of Sampling
 Unit 3: Collecting Data Observational Study Experimental Study Sampling Bias Types of Sampling Feb 7 10:12 AM The step of data collection is critical to obtain reliable information for your study. 2 Types
INTRODUCTION TO STATISTICS SORANA D. BOLBOACĂ
 INTRODUCTION TO STATISTICS SORANA D. BOLBOACĂ OBJECTIVES Definitions Stages of Scientific Knowledge Quantification and Accuracy Types of Medical Data Population and sample Sampling methods DEFINITIONS
Chapter 1: Exploring Data
 Chapter 1: Exploring Data Key Vocabulary:! individual! variable! frequency table! relative frequency table! distribution! pie chart! bar graph! two-way table! marginal distributions! conditional distributions!
Empirical Knowledge: based on observations. Answer questions why, whom, how, and when.
 INTRO TO RESEARCH METHODS: Empirical Knowledge: based on observations. Answer questions why, whom, how, and when. Experimental research: treatments are given for the purpose of research. Experimental group
Chapter 1 - Sampling and Experimental Design
 Chapter 1 - Sampling and Experimental Design Read sections 1.3-1.5 Sampling (1.3.3 and 1.4.2) Sampling Plans: methods of selecting individuals from a population. We are interested in sampling plans such
HOW STATISTICS IMPACT PHARMACY PRACTICE?
 HOW STATISTICS IMPACT PHARMACY PRACTICE? CPPD at NCCR 13 th June, 2013 Mohamed Izham M.I., PhD Professor in Social & Administrative Pharmacy Learning objective.. At the end of the presentation pharmacists
Chapter 5: Producing Data
 Chapter 5: Producing Data Key Vocabulary: observational study vs. experiment confounded variables population vs. sample sampling vs. census sample design voluntary response sampling convenience sampling
Example 1. October 1, / 14
 Example 1 An all male jury of 12 people is chosen for a trial. The defence lawyer claims the jury must have been chosen in a biased manner because 50% of the city s adult residents are women and yet the
Section 1: Exploring Data
 Section 1: Exploring Data The following maps the videos in this section to the Texas Essential Knowledge and Skills for Mathematics TAC 111.47(c). 1.01 Introduction to Statistics 1.02 Statistics and Parameters
Chapter 1 - The Nature of Probability and Statistics
 1. Statistics is the science of conducting studies to A) solve a system of equations. B) hypothesize, experiment, and form conclusions. C) collect, organize, summarize, analyze, and draw conclusions from
1. If a variable has possible values 2, 6, and 17, then this variable is
 Name: Date: 1. If a variable has possible values 2, 6, and 17, then this variable is A) both a continuous and a discrete variable B) a continuous variable C) neither a continuous nor a discrete variable
CHAPTER 5: PRODUCING DATA
 CHAPTER 5: PRODUCING DATA 5.1: Designing Samples Exploratory data analysis seeks to what data say by using: These conclusions apply only to the we examine. To answer questions about some of individuals
Statistics are commonly used in most fields of study and are regularly seen in newspapers, on television, and in professional work.
 I. Introduction and Data Collection A. Introduction to Statistics In this section Basic Statistical Terminology Branches of Statistics Types of Studies Types of Data Levels of Measurement 1. Basic Statistical
MULTIPLE CHOICE. Choose the one alternative that best completes the statement or answers the question.
 Exam Name MULTIPLE CHOICE. Choose the one alternative that best completes the statement or answers the question. Identify the W's for the description of data. 1) A survey of bicycles parked outside college
Observational study is a poor way to gauge the effect of an intervention. When looking for cause effect relationships you MUST have an experiment.
 Chapter 5 Producing data Observational study Observes individuals and measures variables of interest but does not attempt to influence the responses. Experiment Deliberately imposes some treatment on individuals
Chapter 1: Introduction to Statistics
 Chapter 1: Introduction to Statistics Statistics, Science, and Observations Definition: The term statistics refers to a set of mathematical procedures for organizing, summarizing, and interpreting information.
REVIEW FOR THE PREVIOUS LECTURE
 Slide 2-1 Calculator: The same calculator policies as for the ACT hold for STT 315: http://www.actstudent.org/faq/answers/calculator.html. It is highly recommended that you have a TI-84, as this is the
Experimental Design There is no recovery from poorly collected data!
 Experimental Design There is no recovery from poorly collected data! Vocabulary List n Look over the list of words. n Count how many you feel you know. n Place a dot on the number line above that number.
Copyright 2014, 2011, and 2008 Pearson Education, Inc. 1-1
 1-1 Statistics for Business and Economics Chapter 1 Statistics, Data, & Statistical Thinking 1-2 Contents 1. The Science of Statistics 2. Types of Statistical Applications in Business 3. Fundamental Elements
UNIT I SAMPLING AND EXPERIMENTATION: PLANNING AND CONDUCTING A STUDY (Chapter 4)
") UNIT I SAMPLING AND EXPERIMENTATION: PLANNING AND CONDUCTING A STUDY (Chapter 4) A DATA COLLECTION (Overview) When researchers want to make conclusions/inferences about an entire population, they often
UNIT I SAMPLING AND EXPERIMENTATION: PLANNING AND CONDUCTING A STUDY (Chapter 4) A DATA COLLECTION (Overview) When researchers want to make conclusions/inferences about an entire population, they often
WDHS Curriculum Map Probability and Statistics. What is Statistics and how does it relate to you?
 WDHS Curriculum Map Probability and Statistics Time Interval/ Unit 1: Introduction to Statistics 1.1-1.3 2 weeks S-IC-1: Understand statistics as a process for making inferences about population parameters
Chapter 13. Experiments and Observational Studies
 Chapter 13 Experiments and Observational Studies 1 /36 Homework Read Chpt 13 Do p312 1, 7, 9, 11, 17, 20, 25, 27, 29, 33, 40, 41 2 /36 Observational Studies In an observational study, researchers do not
Ch. 1 Collecting and Displaying Data
 Ch. 1 Collecting and Displaying Data In the first two sections of this chapter you will learn about sampling techniques and the different levels of measurement for a variable. It is important that you
UNIVERSITY OF THE FREE STATE DEPARTMENT OF COMPUTER SCIENCE AND INFORMATICS CSIS6813 MODULE TEST 2
 UNIVERSITY OF THE FREE STATE DEPARTMENT OF COMPUTER SCIENCE AND INFORMATICS CSIS6813 MODULE TEST 2 DATE: 3 May 2017 MARKS: 75 ASSESSOR: Prof PJ Blignaut MODERATOR: Prof C de Villiers (UP) TIME: 2 hours
AP Statistics Experimental Design. Penny Smeltzer
 AP Statistics Experimental Design Penny Smeltzer First step: What are you trying to measure or count? What population are you interested in? Determine the explanatory and response variable How will you
Chapter 1: Introduction to Statistics
 Chapter 1: Introduction o to Statistics Statistics, ti ti Science, and Observations Definition: The term statistics refers to a set of mathematical procedures for organizing, summarizing, and interpreting
Data collection, summarizing data (organization and analysis of data) The drawing of inferences about a population from a sample taken from
 The drawing of inferences about a population from a sample taken from") 1 Nature of Statistics The Study of statistics involves; Data collection, summarizing data (organization and analysis of data) and interpretation of data. The drawing of inferences about a population from
1 Nature of Statistics The Study of statistics involves; Data collection, summarizing data (organization and analysis of data) and interpretation of data. The drawing of inferences about a population from
MATH 2300: Statistical Methods. What is Statistics?
 MATH 2300: Statistical Methods Introduction and Chapter 1 What is Statistics? What do you think of when you hear statistics? 1 What is Statistics? Statistics is the science of collecting, organizing, summarizing,
Overview: Part I. December 3, Basics Sources of data Sample surveys Experiments
 Overview: Part I December 3, 2012 Basics Sources of data Sample surveys Experiments 1.0 Basics Observational Units. Variables, Scales of Measurement. 1.1 Walking and Texting An article in Seattle Times
AP Stats Review for Midterm
 AP Stats Review for Midterm NAME: Format: 10% of final grade. There will be 20 multiple-choice questions and 3 free response questions. The multiple-choice questions will be worth 2 points each and the
Methodological skills
 Methodological skills rma linguistics, week 3 Tamás Biró ACLC University of Amsterdam t.s.biro@uva.nl Tamás Biró, UvA 1 Topics today Parameter of the population. Statistic of the sample. Re: descriptive
Review+Practice. May 30, 2012
 Review+Practice May 30, 2012 Final: Tuesday June 5 8:30-10:20 Venue: Sections AA and AB (EEB 125), sections AC and AD (EEB 105), sections AE and AF (SIG 134) Format: Short answer. Bring: calculator, BRAINS
AP Statistics Chapter 5 Multiple Choice
 AP Statistics Chapter 5 Multiple Choice 1. A nutritionist wants to study the effect of storage time (6, 12, and 18 months) on the amount of vitamin C present in freeze dried fruit when stored for these
Class 1. b. Sampling a total of 100 Californians, where individuals are randomly selected from each major ethnic group.
 What you need to know: Class 1 Sampling Study design The goal and importance of sampling methods Bias Sampling frame Volunteer sample Convenience sample Systematic sample Volunteer response Non-response
Chapter 1: Statistical Basics
 Section 1.1: What is Statistics? You are exposed to statistics regularly. If you are a sports fan, then you have the statistics for your favorite player. If you are interested in politics, then you look
Moore, IPS 6e Chapter 03
 Page 1 of 7 Moore, IPS 6e Chapter 03 Quizzes prepared by Dr. Patricia Humphrey, Georgia Southern University Researchers are studying the absorption of two drugs into the bloodstream. Each drug is to be
2.75: 84% 2.5: 80% 2.25: 78% 2: 74% 1.75: 70% 1.5: 66% 1.25: 64% 1.0: 60% 0.5: 50% 0.25: 25% 0: 0%
 Capstone Test (will consist of FOUR quizzes and the FINAL test grade will be an average of the four quizzes). Capstone #1: Review of Chapters 1-3 Capstone #2: Review of Chapter 4 Capstone #3: Review of
Test Bank for Privitera, Statistics for the Behavioral Sciences
 1. The use of tables and graphs to summarize data is an example of A) inferential statistics B) interpretation C) descriptive statistics D) generalization 2. Statistical analysis allows researchers to
I. Introduction and Data Collection B. Sampling. 1. Bias. In this section Bias Random Sampling Sampling Error
 I. Introduction and Data Collection B. Sampling In this section Bias Random Sampling Sampling Error 1. Bias Bias a prejudice in one direction (this occurs when the sample is selected in such a way that
The Practice of Statistics 1 Week 2: Relationships and Data Collection
 The Practice of Statistics 1 Week 2: Relationships and Data Collection Video 12: Data Collection - Experiments Experiments are the gold standard since they allow us to make causal conclusions. example,
Collecting Data Example: Does aspirin prevent heart attacks?
 Collecting Data In an experiment, the researcher controls or manipulates the environment of the individuals. The intent of most experiments is to study the effect of changes in the explanatory variable
7) A tax auditor selects every 1000th income tax return that is received.
 A tax auditor selects every 1000th income tax return that is received.") Redwood High School. Department of Mathematics 2015-2016 Advanced Algebra Stats wkst #3. Hard Worker's name: Solve the problem. Round results to the nearest hundredth. 1) The mean of a set of data 1) is
Redwood High School. Department of Mathematics 2015-2016 Advanced Algebra Stats wkst #3. Hard Worker's name: Solve the problem. Round results to the nearest hundredth. 1) The mean of a set of data 1) is
Define the population Determine appropriate sample size Choose a sampling design Choose an appropriate research design
 Numbers! Observation Study: observing individuals and measuring variables of interest without attempting to influence the responses Correlational Research: examining the relationship between two variables
Creative Commons Attribution-NonCommercial-Share Alike License
 Author: Brenda Gunderson, Ph.D., 2015 License: Unless otherwise noted, this material is made available under the terms of the Creative Commons Attribution- NonCommercial-Share Alike 3.0 Unported License:
Introduction to Statistics and Research Design. Arlo Clark-Foos
 Introduction to Statistics and Research Design Arlo Clark-Foos Dr. John Snow and Cholera 1854.London Two Branches of Statistics Descriptive Statistics Organize, summarize, & communicate Reduce large amounts
Chapter 4 Review. Name: Class: Date: Multiple Choice Identify the choice that best completes the statement or answers the question.
 Name: Class: Date: Chapter 4 Review Multiple Choice Identify the choice that best completes the statement or answers the question. 1. Use Scenario 4-1. The newspaper asks you to comment on their survey
Mathacle. PSet Stats, Concepts In Statistics Level Number Name: Date:
 II. DESIGN OF STUDIES Observational studies and experiments are two types of studies that aim to describe or explain the variation of responses under the hypothesized factors, without or with manipulation.
Chapter 1 Overview. Created by Tom Wegleitner, Centreville, Virginia. Copyright 2007 Pearson Education, Inc Publishing as Pearson Addison-Wesley.
 Chapter 1 Overview Created by Tom Wegleitner, Centreville, Virginia Slide 1 11 Statistics Overview Slide 2 A. Statistics is the science of conducting studies to: Collect Organize Summarize Analyze Draw
Lecture (chapter 1): Introduction
: Introduction") Lecture (chapter 1): Introduction Ernesto F. L. Amaral January 17, 2018 Advanced Methods of Social Research (SOCI 420) Source: Healey, Joseph F. 2015. Statistics: A Tool for Social Research. Stamford:
Lecture (chapter 1): Introduction Ernesto F. L. Amaral January 17, 2018 Advanced Methods of Social Research (SOCI 420) Source: Healey, Joseph F. 2015. Statistics: A Tool for Social Research. Stamford:
Designed Experiments have developed their own terminology. The individuals in an experiment are often called subjects.
 When we wish to show a causal relationship between our explanatory variable and the response variable, a well designed experiment provides the best option. Here, we will discuss a few basic concepts and
Introduction, Evidence, and Sampling
 Motivation: Why analyze data? Introduction, Evidence, and Sampling Clinical trials/drug development: compare existing treatments with new methods Agriculture: enhance crop yields, improve pest resistance
Statistics. Nur Hidayanto PSP English Education Dept. SStatistics/Nur Hidayanto PSP/PBI
 Statistics Nur Hidayanto PSP English Education Dept. RESEARCH STATISTICS WHAT S THE RELATIONSHIP? RESEARCH RESEARCH positivistic Prepositivistic Postpositivistic Data Initial Observation (research Question)
CHAPTER 1. YAKUP ARI,Ph.D.(C)
") CHAPTER 1 YAKUP ARI,Ph.D.(C) math.stat.yeditepe@gmail.com DEFINITION OF STATISTICS The term STATISTICS refers to a set of mathematical procedures for organizing, summarizing, and interpreing information.
CHAPTER 1 YAKUP ARI,Ph.D.(C) math.stat.yeditepe@gmail.com DEFINITION OF STATISTICS The term STATISTICS refers to a set of mathematical procedures for organizing, summarizing, and interpreing information.
What Is Statistics. Chapter 1
 What Is Statistics Chapter 1 Learning Objectives Explain why we study statistics. Explain what is meant by descriptive statistics and inferential statistics. Distinguish between a quantitative variable
What Is Statistics. Learning Objectives. Definition. Who Uses Statistics? 12/9/2015
 Learning Objectives What Is Statistics Chapter 1 Explain why we study statistics. Explain what is meant by descriptive statistics and inferential statistics. Distinguish between a quantitative variable
Do Now Prob & Stats 8/26/14 What conclusions can you draw from this bar graph?
 Do Now Prob & Stats 8/26/14 What conclusions can you draw from this bar graph? Probability & Statistics Section 1 1 What Is Statistics? Vocabulary: Statistics: the science of collecting, organizing, summarizing,
MULTIPLE CHOICE. Choose the one alternative that best completes the statement or answers the question.
 381 Exam #2 E Name MULTIPLE CHOICE. Choose the one alternative that best completes the statement or answers the question. 1) An approach to qualitative research that focuses on building theories is known
Prepared by: Assoc. Prof. Dr Bahaman Abu Samah Department of Professional Development and Continuing Education Faculty of Educational Studies
 Prepared by: Assoc. Prof. Dr Bahaman Abu Samah Department of Professional Development and Continuing Education Faculty of Educational Studies Universiti Putra Malaysia Serdang At the end of this session,
A) I only B) II only C) III only D) II and III only E) I, II, and III
 I only B) II only C) III only D) II and III only E) I, II, and III") AP Statistics Review Chapters 13, 3, 4 Your Name: Per: MULTIPLE CHOICE. Write the letter corresponding to the best answer. 1.* The Physicians Health Study, a large medical experiment involving 22,000 male
AP Statistics Review Chapters 13, 3, 4 Your Name: Per: MULTIPLE CHOICE. Write the letter corresponding to the best answer. 1.* The Physicians Health Study, a large medical experiment involving 22,000 male
in explaning the result of research studies In planning and decision making are supported by data
 N. Setyaningsih Statistics is collection of theory and method applied purpose of understanding data. Or Statistics is the science of the collection, organazing and interpretation of data. So, Statistics
full file at
 Chapter 01 What Is Statistics? True / False Questions 1. A population is a collection of all individuals, objects, or measurements of interest. True False 2. Statistics are used as a basis for making decisions.
For each of the following cases, describe the population, sample, population parameters, and sample statistics.
 Chapter 5: Statistical Reasoning Section 5A Fundamentals of Statistics Statistics is the science of collecting, organizing and interpreting data Statistics is the data that describe or summarize something
STA Module 1 Introduction to Statistics and Data
 STA 2023 Module 1 Introduction to Statistics and Data 1 Learning Objectives Upon completing this module, you should be able to: 1. Classify a statistical study as either descriptive or inferential. 2.
Summer AP Statistic. Chapter 4 : Sampling and Surveys: Read What s the difference between a population and a sample?
 Chapter 4 : Sampling and Surveys: Read 207-208 Summer AP Statistic What s the difference between a population and a sample? Alternate Example: Identify the population and sample in each of the following
I. Identifying the question Define Research Hypothesis and Questions
 Term Paper I. Identifying the question What is the question? (What are my hypotheses?) Is it possible to answer the question with statistics? Is the data obtainable? (birth weight, socio economic, drugs,
Villarreal Rm. 170 Handout (4.3)/(4.4) - 1 Designing Experiments I
/(4.4) - 1 Designing Experiments I") Statistics and Probability B Ch. 4 Sample Surveys and Experiments Villarreal Rm. 170 Handout (4.3)/(4.4) - 1 Designing Experiments I Suppose we wanted to investigate if caffeine truly affects ones pulse
Statistics and Probability B Ch. 4 Sample Surveys and Experiments Villarreal Rm. 170 Handout (4.3)/(4.4) - 1 Designing Experiments I Suppose we wanted to investigate if caffeine truly affects ones pulse