3.4 What are some cautions in analyzing association?
|
|
|
- Dale Quentin Hart
- 6 years ago
- Views:
Transcription
1 3.4 What are some cautions in analyzing association? Objectives Extrapolation Outliers and Influential Observations Correlation does not imply causation Lurking variables and confounding Simpson s Paradox 1
2 RECAP If r is.43, what percent of the variation in y-values can be explained by the x-values? 18.49% RECAP Is correlation or LSRL (least squares regression line) resistant to outliers? 2

3 Extrapolation Extrapolation Extrapolation: Using a regression line to predict y- values for x-values outside the observed range of the data Riskier the farther we move from the range of the given x-values There is no guarantee that the relationship given by the regression equation holds outside the range of sampled x-values 3
4 Extrapolation For example, take the price of a car and its age. The older a car is the less it costs. This is only true up to a certain point though then the car can become a classic and increase in value. Extrapolation Think about the size of your shoe if you had a least squares regression line (LSRL) for the size of your shoe from the time you were born to age 12, would you use the same line to predict your shoe size when you are 45? 4
5 Outliers & Influential Points When you construct a scatterplot, search for data points that are well outside of the trend that the remainder of the data points follow Regression Outliers A regression outlier is an observation that lies far away from the trend that the rest of the data follows An observation is influential if: Its x value is relatively low or high compared to the remainder of the data The observation is a regression outlier Influential observations tend to pull the regression line toward that data point and away from the rest of the data 5


6 Regression Outliers Impact of removing an Influential data point Correlation does not imply causation Correlation does not imply causation!!!! 6
7 Correlation does not imply causation A strong correlation between x and y means that there is a strong linear association that exists between the two variables A strong correlation between x and y, does not mean that x causes y Correlation does not imply causation Data are available for all fires in Chicago last year on x = number of firefighters at the fires and y = cost of damages due to fire Would you expect the correlation to be negative, zero, or positive? If the correlation is positive, does this mean that having more firefighters at a fire causes the damages to be worse? Yes or No 7
8 Association does not imply causation Data are available for all fires in Chicago last year on x = number of firefighters at the fires and y = cost of damages due to fire Identify a third variable that could be considered a common cause of x and y: a. Distance from the fire station b. Intensity of the fire c. Size of the fire Lurking Variable A lurking variable is a variable, usually unobserved, that influences the association between the variables of primary interest Ice cream sales and drowning temperature Reading level and shoe size age 8
9 Lurking Variable Most car accidents happen close to home! Taller people are better at math! Sun block sales are associated with higher murder rates! Risk of heart attack is associated with race! You get better gas mileage with a heavier car! Students with bigger heads have higher reading abilities! Confounding A coach wants his players to do better, so he has them run 2 miles at every practice. Without knowing it, the players also start taking vitamins. Two months later, they are playing better. But is that from the running or the vitamins? This is confounding. When two explanatory variables are both associated with a response variable but are also associated with each other, there is said to be confounding 9


10 Confounding A group of people is offered either a low deductible and a high interest rate on their insurance or a high deductible and a low interest rate. We ll never know if they picked their plan based on deductible, interest rate, or a combination of both confounding. When the direction of an association between two variables changes after we include a third variable and analyze the data at separate levels of that variable 10


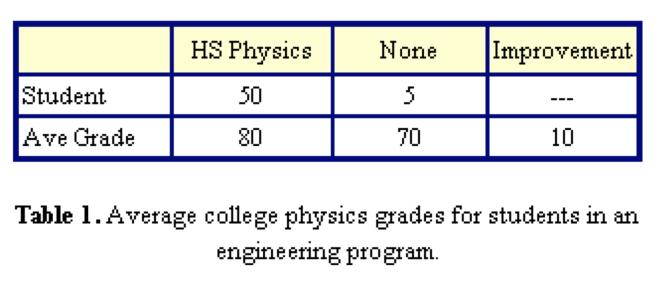
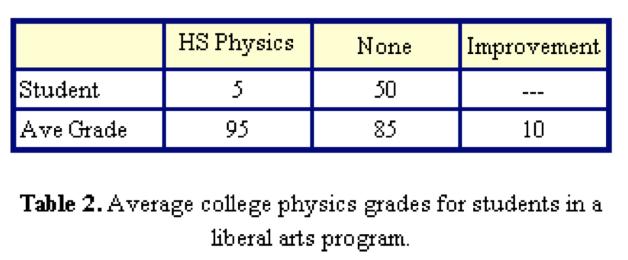
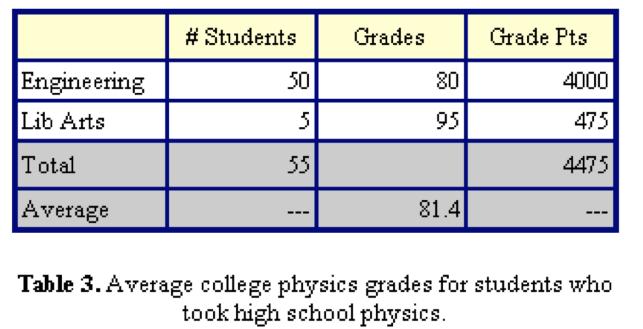
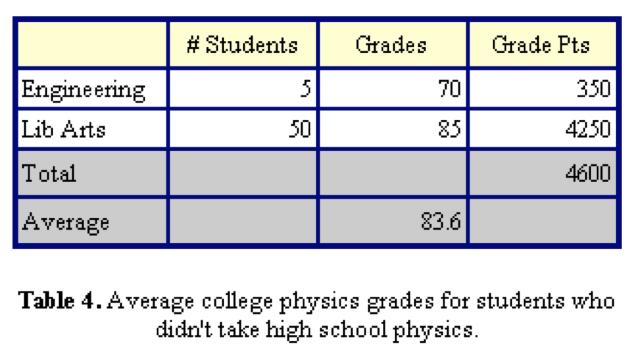
11 Example: Is Smoking Actually Beneficial to Your Health? Probability of Death of Smoker = 139/582=24% Probability of Death of Nonsmoker=230/732=31% This can t be true that smoking improves your chances of living! What s going on! Break out Data by Age 11

12 An association can look quite different after adjusting for the effect of a third variable by grouping the data according to the values of the third variable 12
13 13
14 14
15 is caused by a combination of a lurking variable and data from unequal sized groups being combined into a single data set. The unequal group sizes, in the presence of a lurking variable, can weight the results incorrectly. This can lead to seriously flawed conclusions. The obvious way to prevent it is to not combine data sets of different sizes from diverse sources or sizes. will generally not be a problem in a well designed experiment or survey if possible lurking variables are identified ahead of time and properly controlled. This includes eliminating them, holding them constant for all groups or making them part of the study. 15
16 HOMEWORK Page 141 #44, 45, 47, 53 56, and 57 c, d Collect that project data!! 16
STAT 201 Chapter 3. Association and Regression
 STAT 201 Chapter 3 Association and Regression 1 Association of Variables Two Categorical Variables Response Variable (dependent variable): the outcome variable whose variation is being studied Explanatory
BIVARIATE DATA ANALYSIS
 BIVARIATE DATA ANALYSIS Sometimes, statistical studies are done where data is collected on two variables instead of one in order to establish whether there is a relationship between the two variables.
Further Mathematics 2018 CORE: Data analysis Chapter 3 Investigating associations between two variables
 Chapter 3: Investigating associations between two variables Further Mathematics 2018 CORE: Data analysis Chapter 3 Investigating associations between two variables Extract from Study Design Key knowledge
M 140 Test 1 A Name SHOW YOUR WORK FOR FULL CREDIT! Problem Max. Points Your Points Total 60
 M 140 Test 1 A Name SHOW YOUR WORK FOR FULL CREDIT! Problem Max. Points Your Points 1-10 10 11 3 12 4 13 3 14 10 15 14 16 10 17 7 18 4 19 4 Total 60 Multiple choice questions (1 point each) For questions
Chapter 4. More On Bivariate Data. More on Bivariate Data: 4.1: Transforming Relationships 4.2: Cautions about Correlation
 Chapter 4 More On Bivariate Data Chapter 3 discussed methods for describing and summarizing bivariate data. However, the focus was on linear relationships. In this chapter, we are introduced to methods
Lecture 12 Cautions in Analyzing Associations
 Lecture 12 Cautions in Analyzing Associations MA 217 - Stephen Sawin Fairfield University August 8, 2017 Cautions in Linear Regression Three things to be careful when doing linear regression we have already
Unit 8 Day 1 Correlation Coefficients.notebook January 02, 2018
 [a] Welcome Back! Please pick up a new packet Get a Chrome Book Complete the warm up Choose points on each graph and find the slope of the line. [b] Agenda 05 MIN Warm Up 25 MIN Notes Correlation 15 MIN
4.2: Experiments. SAT Survey vs. SAT. Experiment. Confounding Variables. Section 4.2 Experiments. Observational Study vs.
 4.2: s SAT Survey vs. SAT Describe a survey and an experiment that can be used to determine the relationship between SAT scores and hours studied? Section 4.2 s After this section, you should be able to
Chapter 4: More about Relationships between Two-Variables Review Sheet
 Review Sheet 4. Which of the following is true? A) log(ab) = log A log B. D) log(a/b) = log A log B. B) log(a + B) = log A + log B. C) log A B = log A log B. 5. Suppose we measure a response variable Y
Homework #3. SHORT ANSWER. Write the word or phrase that best completes each statement or answers the question.
 Homework #3 Name Due Due on on February Tuesday, Due on February 17th, Sept Friday 28th 17th, Friday SHORT ANSWER. Write the word or phrase that best completes each statement or answers the question. Fill
Unit 3 Lesson 2 Investigation 4
 Name: Investigation 4 ssociation and Causation Reports in the media often suggest that research has found a cause-and-effect relationship between two variables. For example, a newspaper article listed
Chapter 4: More about Relationships between Two-Variables
 1. Which of the following scatterplots corresponds to a monotonic decreasing function f(t)? A) B) C) D) G Chapter 4: More about Relationships between Two-Variables E) 2. Which of the following transformations
M 140 Test 1 A Name (1 point) SHOW YOUR WORK FOR FULL CREDIT! Problem Max. Points Your Points Total 75
 SHOW YOUR WORK FOR FULL CREDIT! Problem Max. Points Your Points Total 75") M 140 est 1 A Name (1 point) SHOW YOUR WORK FOR FULL CREDI! Problem Max. Points Your Points 1-10 10 11 10 12 3 13 4 14 18 15 8 16 7 17 14 otal 75 Multiple choice questions (1 point each) For questions
M 140 est 1 A Name (1 point) SHOW YOUR WORK FOR FULL CREDI! Problem Max. Points Your Points 1-10 10 11 10 12 3 13 4 14 18 15 8 16 7 17 14 otal 75 Multiple choice questions (1 point each) For questions
2.75: 84% 2.5: 80% 2.25: 78% 2: 74% 1.75: 70% 1.5: 66% 1.25: 64% 1.0: 60% 0.5: 50% 0.25: 25% 0: 0%
 Capstone Test (will consist of FOUR quizzes and the FINAL test grade will be an average of the four quizzes). Capstone #1: Review of Chapters 1-3 Capstone #2: Review of Chapter 4 Capstone #3: Review of
c. Construct a boxplot for the data. Write a one sentence interpretation of your graph.
 STAT 280 Sample Test Problems Page 1 of 1 1. An English survey of 3000 medical records showed that smokers are more inclined to get depressed than non-smokers. Does this imply that smoking causes depression?
Lecture 6B: more Chapter 5, Section 3 Relationships between Two Quantitative Variables; Regression
 Lecture 6B: more Chapter 5, Section 3 Relationships between Two Quantitative Variables; Regression! Equation of Regression Line; Residuals! Effect of Explanatory/Response Roles! Unusual Observations! Sample
Regression Equation. November 29, S10.3_3 Regression. Key Concept. Chapter 10 Correlation and Regression. Definitions
 MAT 155 Statistical Analysis Dr. Claude Moore Cape Fear Community College Chapter 10 Correlation and Regression 10 1 Review and Preview 10 2 Correlation 10 3 Regression 10 4 Variation and Prediction Intervals
10. Introduction to Multivariate Relationships
 10. Introduction to Multivariate Relationships Bivariate analyses are informative, but we usually need to take into account many variables. Many explanatory variables have an influence on any particular
Chapter 3 Review. Name: Class: Date: Multiple Choice Identify the choice that best completes the statement or answers the question.
 Name: Class: Date: Chapter 3 Review Multiple Choice Identify the choice that best completes the statement or answers the question. Scenario 3-1 The height (in feet) and volume (in cubic feet) of usable
STATISTICS INFORMED DECISIONS USING DATA
 STATISTICS INFORMED DECISIONS USING DATA Fifth Edition Chapter 4 Describing the Relation between Two Variables 4.1 Scatter Diagrams and Correlation Learning Objectives 1. Draw and interpret scatter diagrams
Unit 1 Exploring and Understanding Data
 Unit 1 Exploring and Understanding Data Area Principle Bar Chart Boxplot Conditional Distribution Dotplot Empirical Rule Five Number Summary Frequency Distribution Frequency Polygon Histogram Interquartile
What is Data? Part 2: Patterns & Associations. INFO-1301, Quantitative Reasoning 1 University of Colorado Boulder
 What is Data? Part 2: Patterns & Associations INFO-1301, Quantitative Reasoning 1 University of Colorado Boulder August 29, 2016 Prof. Michael Paul Prof. William Aspray Overview This lecture will look
Homework Linear Regression Problems should be worked out in your notebook
 Homework Linear Regression Problems should be worked out in your notebook 1. Following are the mean heights of Kalama children: Age (months) 18 19 20 21 22 23 24 25 26 27 28 29 Height (cm) 76.1 77.0 78.1
Part 1. For each of the following questions fill-in the blanks. Each question is worth 2 points.
 Part 1. For each of the following questions fill-in the blanks. Each question is worth 2 points. 1. The bell-shaped frequency curve is so common that if a population has this shape, the measurements are
Section 3.2 Least-Squares Regression
 Section 3.2 Least-Squares Regression Linear relationships between two quantitative variables are pretty common and easy to understand. Correlation measures the direction and strength of these relationships.
Welcome to OSA Training Statistics Part II
 Welcome to OSA Training Statistics Part II Course Summary Using data about a population to draw graphs Frequency distribution and variability within populations Bell Curves: What are they and where do
4.2 Cautions about Correlation and Regression
 4.2 Cautions about Correlation and Regression Two statisticians were traveling in an airplane from Los Angeles to New York City. About an hour into the flight, the pilot announced that although they had
Lecture 12: more Chapter 5, Section 3 Relationships between Two Quantitative Variables; Regression
 Lecture 12: more Chapter 5, Section 3 Relationships between Two Quantitative Variables; Regression Equation of Regression Line; Residuals Effect of Explanatory/Response Roles Unusual Observations Sample
Chapter 1: Exploring Data
 Chapter 1: Exploring Data Key Vocabulary:! individual! variable! frequency table! relative frequency table! distribution! pie chart! bar graph! two-way table! marginal distributions! conditional distributions!
Eating and Sleeping Habits of Different Countries
 9.2 Analyzing Scatter Plots Now that we know how to draw scatter plots, we need to know how to interpret them. A scatter plot graph can give us lots of important information about how data sets are related
Math 075 Activities and Worksheets Book 2:
 Math 075 Activities and Worksheets Book 2: Linear Regression Name: 1 Scatterplots Intro to Correlation Represent two numerical variables on a scatterplot and informally describe how the data points are
Examining Relationships Least-squares regression. Sections 2.3
 Examining Relationships Least-squares regression Sections 2.3 The regression line A regression line describes a one-way linear relationship between variables. An explanatory variable, x, explains variability
Chapter 3: Describing Relationships
 Chapter 3: Describing Relationships Objectives: Students will: Construct and interpret a scatterplot for a set of bivariate data. Compute and interpret the correlation, r, between two variables. Demonstrate
Chapter 3 CORRELATION AND REGRESSION
 CORRELATION AND REGRESSION TOPIC SLIDE Linear Regression Defined 2 Regression Equation 3 The Slope or b 4 The Y-Intercept or a 5 What Value of the Y-Variable Should be Predicted When r = 0? 7 The Regression
Section The Question of Causation
 Section 2.5 - The Question of Causation Statistics 104 Autumn 2004 Copyright c 2004 by Mark E. Irwin Causation Does smoking cause cancer? Did chemical weapons exposure cause health problems in Gulf War
Confounding and Effect Modification. John McGready Johns Hopkins University
 This work is licensed under a Creative Commons Attribution-NonCommercial-ShareAlike License. Your use of this material constitutes acceptance of that license and the conditions of use of materials on this
A response variable is a variable that. An explanatory variable is a variable that.
 Name:!!!! Date: Scatterplots The most common way to display the relation between two quantitative variable is a scatterplot. Statistical studies often try to show through scatterplots, that changing one
Results & Statistics: Description and Correlation. I. Scales of Measurement A Review
 Results & Statistics: Description and Correlation The description and presentation of results involves a number of topics. These include scales of measurement, descriptive statistics used to summarize
STATS Relationships between variables: Correlation
 STATS 1060 Relationships between variables: Correlation READINGS: Chapter 7 of your text book (DeVeaux, Vellman and Bock); on-line notes for correlation; on-line practice problems for correlation NOTICE:
MAT Mathematics in Today's World
 MAT 1000 Mathematics in Today's World Last Time 1. What does a sample tell us about the population? 2. Practical problems in sample surveys. Last Time Parameter: Number that describes a population Statistic:
Chapter 3: Examining Relationships
 Name Date Per Key Vocabulary: response variable explanatory variable independent variable dependent variable scatterplot positive association negative association linear correlation r-value regression
Confounding and Effect Modification
 Confounding and Effect Modification Karen Bandeen-Roche, Ph.D. Hurley-Dorrier Chair and Professor of Biostatistics July 17, 2012 JHU Intro to Clinical Research 1 Outline 1. Causal inference: comparing
CHILD HEALTH AND DEVELOPMENT STUDY
 CHILD HEALTH AND DEVELOPMENT STUDY 9. Diagnostics In this section various diagnostic tools will be used to evaluate the adequacy of the regression model with the five independent variables developed in
Regression. Regression lines CHAPTER 5
 CHAPTER 5 NASA/GSFC Can scientists predict in advance how many hurricanes the coming season will bring? Exercise 5.44 has some data. Regression IN THIS CHAPTER WE COVER... Linear (straight-line) relationships
STATISTICS & PROBABILITY
 STATISTICS & PROBABILITY LAWRENCE HIGH SCHOOL STATISTICS & PROBABILITY CURRICULUM MAP 2015-2016 Quarter 1 Unit 1 Collecting Data and Drawing Conclusions Unit 2 Summarizing Data Quarter 2 Unit 3 Randomness
1. What is the difference between positive and negative correlations?
 1. What is the difference between positive and negative correlations? 2. Can correlations make predictions? 3. Can correlations prove causation? 4. What are illusory correlations? We can take data from
Residuals. Scatterplots can be deceiving. The y-intercept. residual, e y yˆ
 Learning Objectives At the end of this chapter, students will be able to: understand that sometimes there may be subsets in the data worth exploring separately. describe how unusual data points affect
3.2 Least- Squares Regression
 3.2 Least- Squares Regression Linear (straight- line) relationships between two quantitative variables are pretty common and easy to understand. Correlation measures the direction and strength of these
Lecture 4. Confounding
 Lecture 4 Confounding Learning Objectives In this set of lectures we will: - Formally define confounding and give explicit examples of it s impact - Define adjustment and adjusted estimates conceptually
Popper If data follows a trend that is not linear, we cannot make a prediction about it. a. True b. False
 Popper 12 1. If data follows a trend that is not linear, we cannot make a prediction about it. a. True b. False 5.5 Non-Linear Methods Many times a scatter-plot reveals a curved pattern instead of a linear
Midterm STAT-UB.0003 Regression and Forecasting Models. I will not lie, cheat or steal to gain an academic advantage, or tolerate those who do.
 Midterm STAT-UB.0003 Regression and Forecasting Models The exam is closed book and notes, with the following exception: you are allowed to bring one letter-sized page of notes into the exam (front and
WELCOME! Lecture 11 Thommy Perlinger
 Quantitative Methods II WELCOME! Lecture 11 Thommy Perlinger Regression based on violated assumptions If any of the assumptions are violated, potential inaccuracies may be present in the estimated regression
2 INSTRUCTOR GUIDELINES
 STAGE: Not Ready to Quit (Ready to cut back) You have been approached by Mr. Faulk, a healthy young male, aged 28, who has applied to become a fireman and has a good chance of being offered the job. His
Chapter 11 Nonexperimental Quantitative Research Steps in Nonexperimental Research
 Chapter 11 Nonexperimental Quantitative Research (Reminder: Don t forget to utilize the concept maps and study questions as you study this and the other chapters.) Nonexperimental research is needed because
CHAPTER 3 Describing Relationships
 CHAPTER 3 Describing Relationships 3.1 Scatterplots and Correlation The Practice of Statistics, 5th Edition Starnes, Tabor, Yates, Moore Bedford Freeman Worth Publishers Reading Quiz 3.1 True/False 1.
Observational studies; descriptive statistics
 Observational studies; descriptive statistics Patrick Breheny August 30 Patrick Breheny University of Iowa Biostatistical Methods I (BIOS 5710) 1 / 38 Observational studies Association versus causation
Scatter Plots and Association
 ? LESSON 1.1 ESSENTIAL QUESTION Scatter Plots and Association How can you construct and interpret scatter plots? Measurement and data 8.11.A Construct a scatterplot and describe the observed data to address
AP Statistics Practice Test Ch. 3 and Previous
 AP Statistics Practice Test Ch. 3 and Previous Name Date Use the following to answer questions 1 and 2: A researcher measures the height (in feet) and volume of usable lumber (in cubic feet) of 32 cherry
Math 124: Module 2, Part II
 , Part II David Meredith Department of Mathematics San Francisco State University September 15, 2009 What we will do today 1 Explanatory and Response Variables When you study the relationship between two
STATISTICS 201. Survey: Provide this Info. How familiar are you with these? Survey, continued IMPORTANT NOTE. Regression and ANOVA 9/29/2013
 STATISTICS 201 Survey: Provide this Info Outline for today: Go over syllabus Provide requested information on survey (handed out in class) Brief introduction and hands-on activity Name Major/Program Year
Simple Sensitivity Analyses for Matched Samples Thomas E. Love, Ph.D. ASA Course Atlanta Georgia https://goo.
 Goal of a Formal Sensitivity Analysis To replace a general qualitative statement that applies in all observational studies the association we observe between treatment and outcome does not imply causation
Lab 4 (M13) Objective: This lab will give you more practice exploring the shape of data, and in particular in breaking the data into two groups.
 Objective: This lab will give you more practice exploring the shape of data, and in particular in breaking the data into two groups.") Lab 4 (M13) Objective: This lab will give you more practice exploring the shape of data, and in particular in breaking the data into two groups. Activity 1 Examining Data From Class Background Download
Lab 4 (M13) Objective: This lab will give you more practice exploring the shape of data, and in particular in breaking the data into two groups. Activity 1 Examining Data From Class Background Download
Relationships. Between Measurements Variables. Chapter 10. Copyright 2005 Brooks/Cole, a division of Thomson Learning, Inc.
 Relationships Chapter 10 Between Measurements Variables Copyright 2005 Brooks/Cole, a division of Thomson Learning, Inc. Thought topics Price of diamonds against weight Male vs female age for dating Animals
Statistical questions for statistical methods
 Statistical questions for statistical methods Unpaired (two-sample) t-test DECIDE: Does the numerical outcome have a relationship with the categorical explanatory variable? Is the mean of the outcome the
HW 3.2: page 193 #35-51 odd, 55, odd, 69, 71-78
 35. What s My Line? You use the same bar of soap to shower each morning. The bar weighs 80 grams when it is new. Its weight goes down by 6 grams per day on average. What is the equation of the regression
Estimating indirect and direct effects of a Cancer of Unknown Primary (CUP) diagnosis on survival for a 6 month-period after diagnosis.
 diagnosis on survival for a 6 month-period after diagnosis.") Estimating indirect and direct effects of a Cancer of Unknown Primary (CUP) diagnosis on survival for a 6 month-period after diagnosis. A Manuscript prepared in Fulfillment of a B.S Honors Thesis in Statistics
Estimating indirect and direct effects of a Cancer of Unknown Primary (CUP) diagnosis on survival for a 6 month-period after diagnosis. A Manuscript prepared in Fulfillment of a B.S Honors Thesis in Statistics
Descriptive Methods: Correlation
 LP 1E correlation and limits of correlations 1 Descriptive Methods: Correlation A correlational study is a research strategy that allows the calculation of how strongly related two factors are to each
Confounding, Effect modification, and Stratification
 Confounding, Effect modification, and Stratification Tunisia, 30th October 2014 Acknowledgment: Kostas Danis Takis Panagiotopoulos National Schoool of Public Health, Athens, Greece takis.panagiotopoulos@gmail.com
Gathering. Useful Data. Chapter 3. Copyright 2004 Brooks/Cole, a division of Thomson Learning, Inc.
 Gathering Chapter 3 Useful Data Copyright 2004 Brooks/Cole, a division of Thomson Learning, Inc. Principal Idea: The knowledge of how the data were generated is one of the key ingredients for translating
Math Workshop On-Line Tutorial Judi Manola Paul Catalano. Slide 1. Slide 3
 Kinds of Numbers and Data First we re going to think about the kinds of numbers you will use in the problems you will encounter in your studies. Then we will expand a bit and think about kinds of data.
Constructing a Bivariate Table: Introduction. Chapter 10: Relationships Between Two Variables. Constructing a Bivariate Table. Column Percentages
 Chapter 10: Between Two Variables 1. Constructing a Bivariate Table 2. Elaboration Spurious relationships Intervening relationships Conditional Introduction Bivariate Analysis: A statistical method designed
Math Workshop On-Line Tutorial Judi Manola Paul Catalano
 Math Workshop On-Line Tutorial Judi Manola Paul Catalano 1 Session 1 Kinds of Numbers and Data, Fractions, Negative Numbers, Rounding, Averaging, Properties of Real Numbers, Exponents and Square Roots,
8.SP.1 Hand span and height
 8.SP.1 Hand span and height Task Do taller people tend to have bigger hands? To investigate this question, each student in your class should measure his or her hand span (in cm) and height (in inches).
Correlation & Regression Exercises Chapters 14-15
 Correlation & Regression Exercises Chapters 14-15 1. Which of these are true and which are false? Explain why the false statements are wrong. a. If the slope of the line is 1, then the correlation must
Business Statistics Probability
 Business Statistics The following was provided by Dr. Suzanne Delaney, and is a comprehensive review of Business Statistics. The workshop instructor will provide relevant examples during the Skills Assessment
Exemplar for Internal Assessment Resource Mathematics Level 3. Resource title: Sport Science. Investigate bivariate measurement data
 Exemplar for internal assessment resource Mathematics 3.9A for Achievement Standard 91581 Exemplar for Internal Assessment Resource Mathematics Level 3 Resource title: Sport Science This exemplar supports
How Faithful is the Old Faithful? The Practice of Statistics, 5 th Edition 1
 How Faithful is the Old Faithful? The Practice of Statistics, 5 th Edition 1 Who Has Been Eating My Cookies????????? Someone has been steeling the cookie I bought for your class A teacher from the highschool
t-test for r Copyright 2000 Tom Malloy. All rights reserved
 t-test for r Copyright 2000 Tom Malloy. All rights reserved This is the text of the in-class lecture which accompanied the Authorware visual graphics on this topic. You may print this text out and use
(a) 50% of the shows have a rating greater than: impossible to tell
 50% of the shows have a rating greater than: impossible to tell") KEY 1. Here is a histogram of the Distribution of grades on a quiz. How many students took the quiz? 15 What percentage of students scored below a 60 on the quiz? (Assume left-hand endpoints are included
KEY 1. Here is a histogram of the Distribution of grades on a quiz. How many students took the quiz? 15 What percentage of students scored below a 60 on the quiz? (Assume left-hand endpoints are included
Experimental and survey design
 Friday, October 12, 2001 Page: 1 Experimental and survey design 1. There is a positive association between the number of drownings and ice cream sales. This is an example of an association likely caused
Name Class Date. Even when random sampling is used for a survey, the survey s results can have errors. Some of the sources of errors are:
 Name Class Date 8-3 Surveys, Experiments, and Observational Studies Going Deeper Essential question: What kinds of statistical research are there, and which ones can establish cause-and-effect relationships
An Introduction to Statistical Thinking Dan Schafer Table of Contents
 An Introduction to Statistical Thinking Dan Schafer Table of Contents PART I: CONCLUSIONS AND THEIR UNCERTAINTY NUMERICAL AND ELEMENTS OF Chapter1 Statistics as a Branch of Human Reasoning Chapter 2 What
Reminders/Comments. Thanks for the quick feedback I ll try to put HW up on Saturday and I ll you
 Reminders/Comments Thanks for the quick feedback I ll try to put HW up on Saturday and I ll email you Final project will be assigned in the last week of class You ll have that week to do it Participation
Dr. Allen Back. Sep. 30, 2016
 Dr. Allen Back Sep. 30, 2016 Extrapolation is Dangerous Extrapolation is Dangerous And watch out for confounding variables. e.g.: A strong association between numbers of firemen and amount of damge at
Test Anxiety: The Silent Intruder, William B. Daigle, Ph.D. Test Anxiety The Silent Intruder
 Test Anxiety The Silent Intruder Resources; St. Gerard Majella Catholic School, March 6, 2010 William B. Daigle, Ph.D. 8748 Quarters Lake Road Baton Rouge, LA 70809 (225) 922-7767 225) 922-7768 fax williambdaiglephd@hotmail.com
Observational Studies and Experiments. Observational Studies
 Section 1 3: Observational Studies and Experiments Data is the basis for everything we do in statistics. Every method we use in this course starts with the collection of data. Observational Studies and
Correlational Method. Does ice cream cause murder, or murder cause people to eat ice cream? As more ice cream is eaten, more people are murdered.
 Correlational Method Naturalistic observations, surveys, and case studies often show us that one trait or behavior is related to another. Correlation expresses a relationship between two variables. Does
REVIEW PROBLEMS FOR FIRST EXAM
 M358K Sp 6 REVIEW PROBLEMS FOR FIRST EXAM Please Note: This review sheet is not intended to tell you what will or what will not be on the exam. However, most of these problems have appeared on or are very
Introduction. Lecture 1. What is Statistics?
 Lecture 1 Introduction What is Statistics? Statistics is the science of collecting, organizing and interpreting data. The goal of statistics is to gain information and understanding from data. A statistic
Instrumental Variables Estimation: An Introduction
 Instrumental Variables Estimation: An Introduction Susan L. Ettner, Ph.D. Professor Division of General Internal Medicine and Health Services Research, UCLA The Problem The Problem Suppose you wish to
Identify two variables. Classify them as explanatory or response and quantitative or explanatory.
 OLI Module 2 - Examining Relationships Objective Summarize and describe the distribution of a categorical variable in context. Generate and interpret several different graphical displays of the distribution
Warm Up Categorize each variable based on its level of measurement as nominal, ordinal, interval, or ratio.
 Warm Up Categorize each variable based on its level of measurement as nominal, ordinal, interval, or ratio. gender IQ distance commuting pain rating 1 10 Warm Up Solve: 1 An observational study measures
CHAPTER 9: Producing Data: Experiments
 CHAPTER 9: Producing Data: Experiments The Basic Practice of Statistics 6 th Edition Moore / Notz / Fligner Lecture PowerPoint Slides Chapter 9 Concepts 2 Observation vs. Experiment Subjects, Factors,
1.4 - Linear Regression and MS Excel
 1.4 - Linear Regression and MS Excel Regression is an analytic technique for determining the relationship between a dependent variable and an independent variable. When the two variables have a linear
A teaching presentation to help general psychology students overcome the common misconception that correlation equals causation
 A teaching presentation to help general psychology students overcome the common misconception that correlation equals causation 1 Original A teaching presentation to help general psychology students overcome
Political Science 15, Winter 2014 Final Review
 Political Science 15, Winter 2014 Final Review The major topics covered in class are listed below. You should also take a look at the readings listed on the class website. Studying Politics Scientifically
Simple Linear Regression the model, estimation and testing
 Simple Linear Regression the model, estimation and testing Lecture No. 05 Example 1 A production manager has compared the dexterity test scores of five assembly-line employees with their hourly productivity.
Unit 8 Bivariate Data/ Scatterplots
 Unit 8 Bivariate Data/ Scatterplots Oct 20 9:19 PM Scatterplots are used to determine if there is a relationship between two variables. /Correlation /Correlation /Correlation Line of best fit cuts the
Key: 18 5 = 1.85 cm. 5 a Stem Leaf. Key: 2 0 = 20 points. b Stem Leaf Key: 2 0 = 20 cm. 6 a Stem Leaf. c Stem Leaf
 Answers EXERCISE. D D C B Numerical: a, b, c Categorical: c, d, e, f, g Discrete: c Continuous: a, b C 9 C Categorical B A Categorical and ordinal Discrete Ordinal D EXERCISE. Stem Leaf 9 9 9 Key: = Stem
Correlation is not Causation Causation. If we have high correlation, we d like to determine causation.
 Correlation is not Causation 3.3 63 Causation If we have high correlation, we d like to determine causation. Correlation is not Causation 3.3 63 Causation If we have high correlation, we d like to determine