V. Gathering and Exploring Data
|
|
|
- Maria Tyler
- 5 years ago
- Views:
Transcription
1 V. Gathering and Exploring Data With the language of probability in our vocabulary, we re now ready to talk about sampling and analyzing data.
2 Data Analysis We can divide statistical methods into roughly two categories: Statistics Exploratory Data Analysis Inference Exploratory analysis answers the question: What do we observe? If h i B d h b Inference answers the question: Based upon what we observe, what conclusions can we draw about the underlying population?
3 Example V.A According to a recent available General Social Survey (see % of 4492 randomly polled Americans attend church at least weekly. Does this result provide any evidence that a minority of Americans attend weekly religious services? What do we observe? We observe 1177 of 4492 randomly sampled adults (26%) go to church at least weekly. What can we infer about the underlying population? What does this sample say about the proportion of all Americans who attend weekly services? Does this survey provide evidence that t a majority do not attend weekly? Can we make a reliable judgment about general opinion using a sample of this size?
 Our object is")


4 The Purpose of Statistics (parameters) (estimates, statistics) Our object is to characterize the underlying population from which the sample was taken i.e., we want to infer something about the population using information from the sample.
5 Key Terminology A parameter is a quantity that characterizes the population (such as the population mean or population variance). A statistic ttiti is a quantity computed dfrom the sample. Statistics i are often used to estimate population parameters. For example, the sample mean X is used to estimate the population p mean µ. A random sample is one for which every subject in the population has some chance of selection. A simple random sample (or SRS) is a random sample for which each subject in the population has equal chance of selection.
6 Representative Samples No statistical ti ti methods no matter how sophisticated t will help in understanding the underlying population if the sample is not representative of the population of interest! A sample is representative if it is random. A random sample with n = 5 is better than a nonrandom (i.e., biased) sample with n = 10,000! Example V.B Read the handout Samples in History How did nonrandom Read the handout Samples in History. How did nonrandom sampling lead to biased observations?
7 Controlled Experiments One way of gathering data is through a controlled experiment, such as a randomized trial. For example, in order to test the efficacy of a new drug or treatment, we may randomly divide the study subjects into two groups: treatment and control. Controlled experiments are often considered the gold standard, in the sense that they eliminate spurious associations due to confounding.
8 Confounding Factors Confounding is best understood through examples. It is easy to demonstrate, for instance, that incidents of drowning increase when more ice cream is consumed. Also, drunk driving deaths increase when with increased chocolate sales. Does eating ice cream cause drowning, or does eating chocolate cause accidents due to impaired i driving? i Can you think of explanations for these associations? The confounder in each case is a third variable that is associated with both the cause and effect.
9 Observational Studies Sometimes, it is unethical or infeasible to randomize subjects to treatment groups. For example, how might we carry out a randomized study to determine the effects of smoking? In the absence of a controlled study, we rely on observational data (or a survey). However, we need always use caution when interpreting the results of an observational study. Remember: ASSOCIATION does not necessarily imply CAUSATION.
10 Example V.C For years, investigators reported based on observational data that hormone replacement therapy (HRT) among postmenopausal women leads to other health benefits, including lowering the risk of heart disease. Note that this assumption has widespread repercussions: HRT was prescribed almost universally to help ease uncomfortable symptoms of menopause. Recently, a randomized HRT trial reached a seemingly opposite conclusion: women on HRT were at higher risk of heart disease (on average) than women on placebo. For example, see: hlbi ih /h l h/ / h Can you think of an explanation for these seemingly contradictory findings?
11 Example V.D Read the handout titled Readings on Controlled Experiments. Consider these questions: Why might a controlled experiment be more ethical than an observational study? When is a controlled experiment not ethical? Considering the last question, how should a researcher design a study to ensure she is following ethical practices?
12 Exploratory Data Analysis: Visualizing Data Recall that there are two types of variables we can measure: Categorical Variables (e.g., gender, race, political party affiliation). Continuous Variables (e.g., height, weight, age, income). For categorical variables, we can visualize data using a bar chart or pie chart. For continuous variables, we often visualize the distribution of the data using a histogram, stem-and-leaf plot, or boxplot.
13 Bar Charts A bar chart is plot where each possible category of the variable is represented by a bar. The height of a given bar is proportional to the number of observations from the sample that fall in the associated itdcategory. Example V.E Sketch a bar chart for gender, using our class as a sample.
14 Pie Charts A pie chart is plot where the whole sample is represented by a circle, or pie. The slice of pie associated with a given category is sized proportionally to the number of subjects that fall in that t category. For example, if 1/3 of the sample subjects fall in a given category, then the interior angle of the slice for that category is (1/3)360 = 120. Example V.F Sketch a pie chart for gender, using our class as a sample.
15 Histograms A histogram helps us to visualize the distribution of a sample of continuous data. We construct a histogram by following these steps: Divide the range of possible values of the variable into intervals, called bins. The width of the intervals is sometimes referred to as the binwidth. Count the number of observations that fall within each interval. Represent each interval with a bar, whose height is proportional to the number of observations falling within that interval, or bin.
16 Additional Comments on Histograms Don t confuse a histogram and a bar chart. The vertical axis of a histogram contains intervals over a continuum, whereas the bar chart has categories that are possibly unordered (like race, for example). The binwidth is somewhat arbitrary. The width should be chosen so that the plot is aesthetic not overly smooth (width too wide) and not too ragged (width too narrow). Statistical software packages will select a default binwidth, but will generally also give you the option of explicitly choosing a different binwidth.
17 Example V.G The following table shows the number of O-ring incidents id (failures) versus temperature in space shuttle take-offs up to and including the Challenger disaster of O-ring Incidents Temperature (degrees Fahrenheit) None One Two 75 Three 53
18 Example V.G, cont d Construct three histograms for all of the launch temperatures combined: one with a binwidth of 2.5 degrees, a second with a binwidth of 5 degrees, and a third with a binwidth of 10 degrees. Take the minimum value of all three to be 50 degrees. Which h of the three do you prefer, and why?
19 Interpreting a Histogram The purpose of a histogram is to visually assess the distribution of your sample. We are generally interested in four characteristics: 1. Symmetry versus skewness: is the distribution roughly symmetric? If not, is it right-skewed (or positively skewed)? ) Is it left-skewed (negatively g y skewed)? ) 2. Center: around what approximate value do the observations cluster? 3. Mode: roughly how many peaks do we observe in the distribution? One (is it unimodal)? Two (is it bimodal)? 4. Outliers: are there any observations that lie relatively far away from the main body of data?
20 Skewness A Symmetric distribution appears to have roughly equal numbers of observations on either side of the midpoint of the distribution. A sample from a normally distributed population (such as height or blood pressure measurements, for example) would appear to have a symmetric distribution. A right (or positively) skewed distribution appears to have a bulk of the data clustered toward the lower end of the distribution, with the proportion of larger values tailing off to the right. Measurements such as annual income tend to have positively skewed distributions. A left (or negatively) skewed distribution appears to have a bulk of the data clustered toward the upper end of the distribution, with the proportion of smaller values tailing off to the left. Homework scores in this class have a leftskewed distribution most students tend to score high (between 20-25) with the proportion p of lower scores tailing to the left.


21 Example V.H The data used for the following three histograms were randomly g g y generated using computer software. Can you describe the distribution in each case?
22 Example V.H, cont d

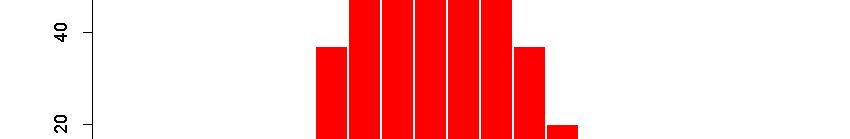
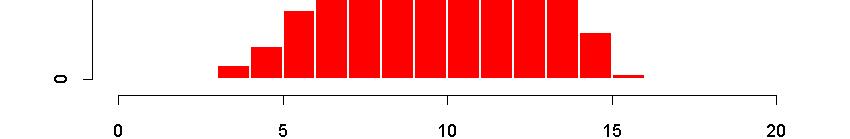
23 Example V.H, cont d


, describe")
24 Example V.I Given the histogram for the space shuttle temperatures from Example V.G (seen below with a binwidth of 5), describe the distribution.
25 Stem-and-Leaf Plots A type of plot closely related to the histogram is the stem-and- leaf plot (or stemplot, for short). Both plots have the same purpose: to help us to quickly characterize the distribution of our sample. The stemplot, however, allows us to view the actual measurements in the sample while still providing a graphical description of their distribution. In a stemplot, the stems are analogous to the bins of a histogram. The leaves represent individual observations bl belonging to each stem. The more leaves in a stem, the more observations fall within that range of the data. THE IDEA: Choose stems that correspond to a base digit of the measurements (such as the 10 s or 100 s digit, for example).
26 Example V.J Construct a stem-and-leaf plot for the shuttle launch temperatures in Example V.G. Use a stem corresponding to the tens digit in each temperature, with ten leaves per stem. Construct another stemplot that splits the stems of your first plot in two (i.e., five leaves per stem). Construct a third stemplot that splits the stems of the first plot into five (i.e., two leaves per stem). Which do you prefer, and why?
27 Choosing Stems Y th t th i di bi idth f hi t You can see that the same issues regarding binwidth for histograms apply to stemplots: you don t want to split stems too much, or the plot will look too ragged. Not splitting enough results in an oversmooth plot. Either extreme results in a graph that is difficult to interpret.
28 Exploratory Data Analysis: Summarizing Data The purpose of exploratory data analysis is to describe the distribution of the sample. Summary statistics help to reduce the data to just a handful of numbers that help an investigator to quickly characterize the distribution. ib ti We will discuss two types of summary statistics: Measures of Center: mean, median, mode. Measures of Spread (Variability): variance, interquartile range, range.
29 Summary Statistics: Measures of Center The sample mean is defined as X 1 n 1 X n i i The sample median is defined as the middle observed value. In other words, let X (1), X (2),, X (n) represent the sample, sorted from the smallest to the largest value. If n is odd, then the sample median is the middle observation, or X ([n+1]/2). If n is even, then the sample median is the average of the middle two ordered observations, or (X (n/2) + X ([n/2]+1) )/2. The sample mode is the most frequently observed value in the data The sample mode is the most frequently observed value in the data set..
30 We observe the data 4, 3, 4, 2, 8. Example V.K What are the sample mean, median, and mode?
31 Interpreting and Comparing the Sample Mean and Median The sample median is often described d as robust. This simply means that it is not greatly affected by extreme or outlying observations. The sample mean, on the other hand, is not robust it can be highly sensitive to extreme observations. Suppose, for example, that we also observe the value 1000 in addition to the data sampled in Example V.K. VK How does this affect the values of the sample mean and median?
32 Interpreting and Comparing the Sample Mean and Median Because the sample mean is more sensitive to extreme observations than the sample median, how do you think the mean and median compare (i.e., which will be larger) under the following circumstances? Distribution is right-skewed. Distribution is left-skewed. Distribution is symmetric. When reporting about individual or household income, why do p g, y researchers most often use median income as a measure of center?
33 The Trimmed Mean The sample trimmed mean is a sort of compromise between the sample mean and median. The α100% sample trimmed mean is the sample mean of the middle (1 2α)100% of the ordered observations, where α is some proportion of the data that will be trimmed from each tail. The quantity α is typically chosen to be something like 0.10 or What is the 20% trimmed mean for Example VK? V.K? While the sample trimmed mean is an interesting way of producing a sample mean that is more robust, it is actually not often used in practice.
34 Summary Statistics: Measures of Spread The sample variance s 2 is defined as s 1 1 n 2 ( ) n 2 X X X nx 2. i 1 i i 1 i n 1 n 1 2 n The interquartile range (or IQR) is defined as IQR = Q3 Q1, where Q1 is the first quartile (sample 25 th percentile) and Q3 is the third quartile (sample 75 th percentile). Note that the second quartile Q2 is the sample median. The range is defined as the largest observed value less the The range is defined as the largest observed value less the smallest observed value, or X (n) X (1).
35 Computing the Quartiles Note that the p th sample percentile is the value (based on the sample) such that p% of the sample lies below that value. The quartiles Q1 and Q3 are hence the sample 25 th and 75 th percentiles. How do we find these quantiles? Divide the ordered data set in half (e.g., if n = 20, then we use X (1),, X (10) to find Q1 and X (11),, X (20) to find Q3; if n = 21, then we use X (1),, X (10) to find Q1 and X (12),,X X (21) to find Q3). To determine Q1, if the number of observations comprising the first half of the ordered data is odd, then Q1 is the middle of these. If the number of observations is even, then Q1 is computed as the value lying 25% of the distance between the middle two of these observations. Q3 is found in a similar manner, applying the same logic to the second half of the ordered observations.
36 Example V.L What are the sample variance s 2, the standard deviation s, the IQR, and the range for the data in Example V.K? How do these values change if an additional observation equal to 1000 is observed?
37 The Boxplot A boxplot (or box-and-whisker plot) ) allows us to visualize the distribution of our sample via the so called five-number summary, which consists of the three quartiles along with the minimum and the maximum. The diagram below shows how we construct such a chart. X (1) Q1 Q2 Q3 X (n) Computer software packages sometimes add other features, like an asterisk that indicates the location of the sample mean.
38 Example V.M Construct a boxplot for the data in Example V.K.
39 Example V.N Side-by-side boxplots are often useful in comparing the distributions of a continuous variable between two groups. The boxplots below show the distribution of launch temperatures for shuttle missions (through 1986) with zero O-ring failures, versus the distribution for missions with at least one O-ring failure. What do you observe? No Failures 1 Failure
40 Example V.O Stat 3000 Statistics for Scientists and Engineers The following data are pre-azt serum antigen levels measured in a study of 20 AIDS patients. Patient Serum Antigen Level (pg/ml) Patient Serum Antigen Level (pg/ml)
41 Example V.O, cont d What are the mean, median, and mode? What are the variance, standard deviation, and IQR? Draw a boxplot for these data.
Population. Sample. AP Statistics Notes for Chapter 1 Section 1.0 Making Sense of Data. Statistics: Data Analysis:
 Section 1.0 Making Sense of Data Statistics: Data Analysis: Individuals objects described by a set of data Variable any characteristic of an individual Categorical Variable places an individual into one
Chapter 1: Exploring Data
 Chapter 1: Exploring Data Key Vocabulary:! individual! variable! frequency table! relative frequency table! distribution! pie chart! bar graph! two-way table! marginal distributions! conditional distributions!
Introduction to Statistical Data Analysis I
 Introduction to Statistical Data Analysis I JULY 2011 Afsaneh Yazdani Preface What is Statistics? Preface What is Statistics? Science of: designing studies or experiments, collecting data Summarizing/modeling/analyzing
Unit 1 Exploring and Understanding Data
 Unit 1 Exploring and Understanding Data Area Principle Bar Chart Boxplot Conditional Distribution Dotplot Empirical Rule Five Number Summary Frequency Distribution Frequency Polygon Histogram Interquartile
Outline. Practice. Confounding Variables. Discuss. Observational Studies vs Experiments. Observational Studies vs Experiments
 1 2 Outline Finish sampling slides from Tuesday. Study design what do you do with the subjects/units once you select them? (OI Sections 1.4-1.5) Observational studies vs. experiments Descriptive statistics
STP226 Brief Class Notes Instructor: Ela Jackiewicz
 CHAPTER 2 Organizing Data Statistics=science of analyzing data. Information collected (data) is gathered in terms of variables (characteristics of a subject that can be assigned a numerical value or nonnumerical
Summarizing Data. (Ch 1.1, 1.3, , 2.4.3, 2.5)
") 1 Summarizing Data (Ch 1.1, 1.3, 1.10-1.13, 2.4.3, 2.5) Populations and Samples An investigation of some characteristic of a population of interest. Example: You want to study the average GPA of juniors
1 Summarizing Data (Ch 1.1, 1.3, 1.10-1.13, 2.4.3, 2.5) Populations and Samples An investigation of some characteristic of a population of interest. Example: You want to study the average GPA of juniors
WDHS Curriculum Map Probability and Statistics. What is Statistics and how does it relate to you?
 WDHS Curriculum Map Probability and Statistics Time Interval/ Unit 1: Introduction to Statistics 1.1-1.3 2 weeks S-IC-1: Understand statistics as a process for making inferences about population parameters
Understandable Statistics
 Understandable Statistics correlated to the Advanced Placement Program Course Description for Statistics Prepared for Alabama CC2 6/2003 2003 Understandable Statistics 2003 correlated to the Advanced Placement
Business Statistics Probability
 Business Statistics The following was provided by Dr. Suzanne Delaney, and is a comprehensive review of Business Statistics. The workshop instructor will provide relevant examples during the Skills Assessment
Probability and Statistics. Chapter 1
 Probability and Statistics Chapter 1 Individuals and Variables Individuals and Variables Individuals are objects described by data. Individuals and Variables Individuals are objects described by data.
Statistics is the science of collecting, organizing, presenting, analyzing, and interpreting data to assist in making effective decisions
 Readings: OpenStax Textbook - Chapters 1 5 (online) Appendix D & E (online) Plous - Chapters 1, 5, 6, 13 (online) Introductory comments Describe how familiarity with statistical methods can - be associated
M 140 Test 1 A Name SHOW YOUR WORK FOR FULL CREDIT! Problem Max. Points Your Points Total 60
 M 140 Test 1 A Name SHOW YOUR WORK FOR FULL CREDIT! Problem Max. Points Your Points 1-10 10 11 3 12 4 13 3 14 10 15 14 16 10 17 7 18 4 19 4 Total 60 Multiple choice questions (1 point each) For questions
Statistics is the science of collecting, organizing, presenting, analyzing, and interpreting data to assist in making effective decisions
 Readings: OpenStax Textbook - Chapters 1 5 (online) Appendix D & E (online) Plous - Chapters 1, 5, 6, 13 (online) Introductory comments Describe how familiarity with statistical methods can - be associated
Describe what is meant by a placebo Contrast the double-blind procedure with the single-blind procedure Review the structure for organizing a memo
 Please note the page numbers listed for the Lind book may vary by a page or two depending on which version of the textbook you have. Readings: Lind 1 11 (with emphasis on chapters 10, 11) Please note chapter
Test 1C AP Statistics Name:
 Test 1C AP Statistics Name: Part 1: Multiple Choice. Circle the letter corresponding to the best answer. 1. At the beginning of the school year, a high-school teacher asks every student in her classes
Undertaking statistical analysis of
 Descriptive statistics: Simply telling a story Laura Delaney introduces the principles of descriptive statistical analysis and presents an overview of the various ways in which data can be presented by
Still important ideas
 Readings: OpenStax - Chapters 1 11 + 13 & Appendix D & E (online) Plous - Chapters 2, 3, and 4 Chapter 2: Cognitive Dissonance, Chapter 3: Memory and Hindsight Bias, Chapter 4: Context Dependence Still
Observational studies; descriptive statistics
 Observational studies; descriptive statistics Patrick Breheny August 30 Patrick Breheny University of Iowa Biostatistical Methods I (BIOS 5710) 1 / 38 Observational studies Association versus causation
Unit 7 Comparisons and Relationships
 Unit 7 Comparisons and Relationships Objectives: To understand the distinction between making a comparison and describing a relationship To select appropriate graphical displays for making comparisons
Knowledge discovery tools 381
 Knowledge discovery tools 381 hours, and prime time is prime time precisely because more people tend to watch television at that time.. Compare histograms from di erent periods of time. Changes in histogram
Describe what is meant by a placebo Contrast the double-blind procedure with the single-blind procedure Review the structure for organizing a memo
 Business Statistics The following was provided by Dr. Suzanne Delaney, and is a comprehensive review of Business Statistics. The workshop instructor will provide relevant examples during the Skills Assessment
Department of Statistics TEXAS A&M UNIVERSITY STAT 211. Instructor: Keith Hatfield
 Department of Statistics TEXAS A&M UNIVERSITY STAT 211 Instructor: Keith Hatfield 1 Topic 1: Data collection and summarization Populations and samples Frequency distributions Histograms Mean, median, variance
Example The median earnings of the 28 male students is the average of the 14th and 15th, or 3+3
 Lecture 3 Nancy Pfenning Stats 1000 We learned last time how to construct a stemplot to display a single quantitative variable. A back-to-back stemplot is a useful display tool when we are interested in
Statistics is a broad mathematical discipline dealing with
 Statistical Primer for Cardiovascular Research Descriptive Statistics and Graphical Displays Martin G. Larson, SD Statistics is a broad mathematical discipline dealing with techniques for the collection,
CHAPTER 2. MEASURING AND DESCRIBING VARIABLES
 4 Chapter 2 CHAPTER 2. MEASURING AND DESCRIBING VARIABLES 1. A. Age: name/interval; military dictatorship: value/nominal; strongly oppose: value/ ordinal; election year: name/interval; 62 percent: value/interval;
Chapter 1. Picturing Distributions with Graphs
 Chapter 1 Picturing Distributions with Graphs Statistics Statistics is a science that involves the extraction of information from numerical data obtained during an experiment or from a sample. It involves
AP Stats Review for Midterm
 AP Stats Review for Midterm NAME: Format: 10% of final grade. There will be 20 multiple-choice questions and 3 free response questions. The multiple-choice questions will be worth 2 points each and the
CHAPTER 3 Describing Relationships
 CHAPTER 3 Describing Relationships 3.1 Scatterplots and Correlation The Practice of Statistics, 5th Edition Starnes, Tabor, Yates, Moore Bedford Freeman Worth Publishers Reading Quiz 3.1 True/False 1.
Still important ideas
 Readings: OpenStax - Chapters 1 13 & Appendix D & E (online) Plous Chapters 17 & 18 - Chapter 17: Social Influences - Chapter 18: Group Judgments and Decisions Still important ideas Contrast the measurement
SPRING GROVE AREA SCHOOL DISTRICT. Course Description. Instructional Strategies, Learning Practices, Activities, and Experiences.
 SPRING GROVE AREA SCHOOL DISTRICT PLANNED COURSE OVERVIEW Course Title: Basic Introductory Statistics Grade Level(s): 11-12 Units of Credit: 1 Classification: Elective Length of Course: 30 cycles Periods
Table of Contents. Plots. Essential Statistics for Nursing Research 1/12/2017
 Essential Statistics for Nursing Research Kristen Carlin, MPH Seattle Nursing Research Workshop January 30, 2017 Table of Contents Plots Descriptive statistics Sample size/power Correlations Hypothesis
M 140 Test 1 A Name (1 point) SHOW YOUR WORK FOR FULL CREDIT! Problem Max. Points Your Points Total 75
 SHOW YOUR WORK FOR FULL CREDIT! Problem Max. Points Your Points Total 75") M 140 est 1 A Name (1 point) SHOW YOUR WORK FOR FULL CREDI! Problem Max. Points Your Points 1-10 10 11 10 12 3 13 4 14 18 15 8 16 7 17 14 otal 75 Multiple choice questions (1 point each) For questions
M 140 est 1 A Name (1 point) SHOW YOUR WORK FOR FULL CREDI! Problem Max. Points Your Points 1-10 10 11 10 12 3 13 4 14 18 15 8 16 7 17 14 otal 75 Multiple choice questions (1 point each) For questions
PRINTABLE VERSION. Quiz 1. True or False: The amount of rainfall in your state last month is an example of continuous data.
 Question 1 PRINTABLE VERSION Quiz 1 True or False: The amount of rainfall in your state last month is an example of continuous data. a) True b) False Question 2 True or False: The standard deviation is
Readings: Textbook readings: OpenStax - Chapters 1 13 (emphasis on Chapter 12) Online readings: Appendix D, E & F
 Online readings: Appendix D, E & F") Readings: Textbook readings: OpenStax - Chapters 1 13 (emphasis on Chapter 12) Online readings: Appendix D, E & F Plous Chapters 17 & 18 Chapter 17: Social Influences Chapter 18: Group Judgments and Decisions
Readings: Textbook readings: OpenStax - Chapters 1 13 (emphasis on Chapter 12) Online readings: Appendix D, E & F Plous Chapters 17 & 18 Chapter 17: Social Influences Chapter 18: Group Judgments and Decisions
Medical Statistics 1. Basic Concepts Farhad Pishgar. Defining the data. Alive after 6 months?
 Medical Statistics 1 Basic Concepts Farhad Pishgar Defining the data Population and samples Except when a full census is taken, we collect data on a sample from a much larger group called the population.
CHAPTER 3 DATA ANALYSIS: DESCRIBING DATA
 Data Analysis: Describing Data CHAPTER 3 DATA ANALYSIS: DESCRIBING DATA In the analysis process, the researcher tries to evaluate the data collected both from written documents and from other sources such
Frequency distributions
 Applied Biostatistics distributions Martin Bland Professor of Health Statistics University of York http://www-users.york.ac.uk/~mb55/ Types of data Qualitative data arise when individuals may fall into
2.4.1 STA-O Assessment 2
 2.4.1 STA-O Assessment 2 Work all the problems and determine the correct answers. When you have completed the assessment, open the Assessment 2 activity and input your responses into the online grading
What you should know before you collect data. BAE 815 (Fall 2017) Dr. Zifei Liu
 Dr. Zifei Liu") What you should know before you collect data BAE 815 (Fall 2017) Dr. Zifei Liu Zifeiliu@ksu.edu Types and levels of study Descriptive statistics Inferential statistics How to choose a statistical test
What you should know before you collect data BAE 815 (Fall 2017) Dr. Zifei Liu Zifeiliu@ksu.edu Types and levels of study Descriptive statistics Inferential statistics How to choose a statistical test
Organizing Data. Types of Distributions. Uniform distribution All ranges or categories have nearly the same value a.k.a. rectangular distribution
 Organizing Data Frequency How many of the data are in a category or range Just count up how many there are Notation x = number in one category n = total number in sample (all categories combined) Relative
Chapter 1 Where Do Data Come From?
 Chapter 1 Where Do Data Come From? Understanding Data: The purpose of this class; to be able to read the newspaper and know what the heck they re talking about! To be able to go to the casino and know
Welcome to OSA Training Statistics Part II
 Welcome to OSA Training Statistics Part II Course Summary Using data about a population to draw graphs Frequency distribution and variability within populations Bell Curves: What are they and where do
Chapter 1: Explaining Behavior
 Chapter 1: Explaining Behavior GOAL OF SCIENCE is to generate explanations for various puzzling natural phenomenon. - Generate general laws of behavior (psychology) RESEARCH: principle method for acquiring
Part 1. For each of the following questions fill-in the blanks. Each question is worth 2 points.
 Part 1. For each of the following questions fill-in the blanks. Each question is worth 2 points. 1. The bell-shaped frequency curve is so common that if a population has this shape, the measurements are
Quantitative Methods in Computing Education Research (A brief overview tips and techniques)
") Quantitative Methods in Computing Education Research (A brief overview tips and techniques) Dr Judy Sheard Senior Lecturer Co-Director, Computing Education Research Group Monash University judy.sheard@monash.edu
Quantitative Methods in Computing Education Research (A brief overview tips and techniques) Dr Judy Sheard Senior Lecturer Co-Director, Computing Education Research Group Monash University judy.sheard@monash.edu
Readings: Textbook readings: OpenStax - Chapters 1 11 Online readings: Appendix D, E & F Plous Chapters 10, 11, 12 and 14
 Readings: Textbook readings: OpenStax - Chapters 1 11 Online readings: Appendix D, E & F Plous Chapters 10, 11, 12 and 14 Still important ideas Contrast the measurement of observable actions (and/or characteristics)
Describe what is meant by a placebo Contrast the double-blind procedure with the single-blind procedure Review the structure for organizing a memo
 Please note the page numbers listed for the Lind book may vary by a page or two depending on which version of the textbook you have. Readings: Lind 1 11 (with emphasis on chapters 5, 6, 7, 8, 9 10 & 11)
Statistical Methods Exam I Review
 Statistical Methods Exam I Review Professor: Dr. Kathleen Suchora SI Leader: Camila M. DISCLAIMER: I have created this review sheet to supplement your studies for your first exam. I am a student here at
Stats 95. Statistical analysis without compelling presentation is annoying at best and catastrophic at worst. From raw numbers to meaningful pictures
 Stats 95 Statistical analysis without compelling presentation is annoying at best and catastrophic at worst. From raw numbers to meaningful pictures Stats 95 Why Stats? 200 countries over 200 years http://www.youtube.com/watch?v=jbksrlysojo
Biostatistics. Donna Kritz-Silverstein, Ph.D. Professor Department of Family & Preventive Medicine University of California, San Diego
 Biostatistics Donna Kritz-Silverstein, Ph.D. Professor Department of Family & Preventive Medicine University of California, San Diego (858) 534-1818 dsilverstein@ucsd.edu Introduction Overview of statistical
Chapter 7: Descriptive Statistics
 Chapter Overview Chapter 7 provides an introduction to basic strategies for describing groups statistically. Statistical concepts around normal distributions are discussed. The statistical procedures of
AP STATISTICS 2010 SCORING GUIDELINES (Form B)
") AP STATISTICS 2010 SCORING GUIDELINES (Form B) Question 1 Intent of Question The primary goals of this question were to assess students ability to (1) compare three distributions of a quantitative variable;
AP STATISTICS 2010 SCORING GUIDELINES (Form B) Question 1 Intent of Question The primary goals of this question were to assess students ability to (1) compare three distributions of a quantitative variable;
Averages and Variation
 Chapter 3 Averages and Variation Name Section 3.1 Measures of Central Tendency: Mode, Median, and Mean Objective: In this lesson you learned how to compute, interpret, and explain mean, median, and mode.
9 research designs likely for PSYC 2100
 9 research designs likely for PSYC 2100 1) 1 factor, 2 levels, 1 group (one group gets both treatment levels) related samples t-test (compare means of 2 levels only) 2) 1 factor, 2 levels, 2 groups (one
LOTS of NEW stuff right away 2. The book has calculator commands 3. About 90% of technology by week 5
 1.1 1. LOTS of NEW stuff right away 2. The book has calculator commands 3. About 90% of technology by week 5 1 Three adventurers are in a hot air balloon. Soon, they find themselves lost in a canyon in
Quantitative Data and Measurement. POLI 205 Doing Research in Politics. Fall 2015
 Quantitative Fall 2015 Theory and We need to test our theories with empirical data Inference : Systematic observation and representation of concepts Quantitative: measures are numeric Qualitative: measures
4.3 Measures of Variation
 4.3 Measures of Variation! How much variation is there in the data?! Look for the spread of the distribution.! What do we mean by spread? 1 Example Data set:! Weight of contents of regular cola (grams).
Methodological skills
 Methodological skills rma linguistics, week 3 Tamás Biró ACLC University of Amsterdam t.s.biro@uva.nl Tamás Biró, UvA 1 Topics today Parameter of the population. Statistic of the sample. Re: descriptive
UF#Stats#Club#STA#2023#Exam#1#Review#Packet# #Fall#2013#
 UF#Stats#Club#STA##Exam##Review#Packet# #Fall## The following data consists of the scores the Gators basketball team scored during the 8 games played in the - season. 84 74 66 58 79 8 7 64 8 6 78 79 77
A) I only B) II only C) III only D) II and III only E) I, II, and III
 I only B) II only C) III only D) II and III only E) I, II, and III") AP Statistics Review Chapters 13, 3, 4 Your Name: Per: MULTIPLE CHOICE. Write the letter corresponding to the best answer. 1.* The Physicians Health Study, a large medical experiment involving 22,000 male
AP Statistics Review Chapters 13, 3, 4 Your Name: Per: MULTIPLE CHOICE. Write the letter corresponding to the best answer. 1.* The Physicians Health Study, a large medical experiment involving 22,000 male
Section 1.2 Displaying Quantitative Data with Graphs. Dotplots
 Section 1.2 Displaying Quantitative Data with Graphs Dotplots One of the simplest graphs to construct and interpret is a dotplot. Each data value is shown as a dot above its location on a number line.
Quizzes (and relevant lab exercises): 20% Midterm exams (2): 25% each Final exam: 30%
: 20% Midterm exams (2): 25% each Final exam: 30%") 1 Intro to statistics Continued 2 Grading policy Quizzes (and relevant lab exercises): 20% Midterm exams (2): 25% each Final exam: 30% Cutoffs based on final avgs (A, B, C): 91-100, 82-90, 73-81 3 Numerical
1 Intro to statistics Continued 2 Grading policy Quizzes (and relevant lab exercises): 20% Midterm exams (2): 25% each Final exam: 30% Cutoffs based on final avgs (A, B, C): 91-100, 82-90, 73-81 3 Numerical
Readings: Textbook readings: OpenStax - Chapters 1 4 Online readings: Appendix D, E & F Online readings: Plous - Chapters 1, 5, 6, 13
 Readings: Textbook readings: OpenStax - Chapters 1 4 Online readings: Appendix D, E & F Online readings: Plous - Chapters 1, 5, 6, 13 Introductory comments Describe how familiarity with statistical methods
AP Psych - Stat 1 Name Period Date. MULTIPLE CHOICE. Choose the one alternative that best completes the statement or answers the question.
 AP Psych - Stat 1 Name Period Date MULTIPLE CHOICE. Choose the one alternative that best completes the statement or answers the question. 1) In a set of incomes in which most people are in the $15,000
How to interpret scientific & statistical graphs
 How to interpret scientific & statistical graphs Theresa A Scott, MS Department of Biostatistics theresa.scott@vanderbilt.edu http://biostat.mc.vanderbilt.edu/theresascott 1 A brief introduction Graphics:
Further Mathematics 2018 CORE: Data analysis Chapter 3 Investigating associations between two variables
 Chapter 3: Investigating associations between two variables Further Mathematics 2018 CORE: Data analysis Chapter 3 Investigating associations between two variables Extract from Study Design Key knowledge
Data, frequencies, and distributions. Martin Bland. Types of data. Types of data. Clinical Biostatistics
 Clinical Biostatistics Data, frequencies, and distributions Martin Bland Professor of Health Statistics University of York http://martinbland.co.uk/ Types of data Qualitative data arise when individuals
Statistics and Probability
 Statistics and a single count or measurement variable. S.ID.1: Represent data with plots on the real number line (dot plots, histograms, and box plots). S.ID.2: Use statistics appropriate to the shape
Section I: Multiple Choice Select the best answer for each question.
 Chapter 1 AP Statistics Practice Test (TPS- 4 p78) Section I: Multiple Choice Select the best answer for each question. 1. You record the age, marital status, and earned income of a sample of 1463 women.
AP Statistics. Semester One Review Part 1 Chapters 1-5
 AP Statistics Semester One Review Part 1 Chapters 1-5 AP Statistics Topics Describing Data Producing Data Probability Statistical Inference Describing Data Ch 1: Describing Data: Graphically and Numerically
Lecture Notes Module 2
 Lecture Notes Module 2 Two-group Experimental Designs The goal of most research is to assess a possible causal relation between the response variable and another variable called the independent variable.
Lesson 9 Presentation and Display of Quantitative Data
 Lesson 9 Presentation and Display of Quantitative Data Learning Objectives All students will identify and present data using appropriate graphs, charts and tables. All students should be able to justify
Statistical Summaries. Kerala School of MathematicsCourse in Statistics for Scientists. Descriptive Statistics. Summary Statistics
 Kerala School of Mathematics Course in Statistics for Scientists Statistical Summaries Descriptive Statistics T.Krishnan Strand Life Sciences, Bangalore may be single numerical summaries of a batch, such
STT315 Chapter 2: Methods for Describing Sets of Data - Part 2
 Chapter 2.5 Interpreting Standard Deviation Chebyshev Theorem Empirical Rule Chebyshev Theorem says that for ANY shape of data distribution at least 3/4 of all data fall no farther from the mean than 2
DOWNLOAD PDF SUMMARIZING AND INTERPRETING DATA : USING STATISTICS
 Chapter 1 : Summarizing Numerical Data Sets Worksheets Stem and Leaf Activity Sheets with Answers. Students first create the stem and leaf plot. Then they use it to answer questions. This is a great way
Results & Statistics: Description and Correlation. I. Scales of Measurement A Review
 Results & Statistics: Description and Correlation The description and presentation of results involves a number of topics. These include scales of measurement, descriptive statistics used to summarize
Math 2200 First Mid-Term Exam September 22, 2010
 Math 2200 First Mid-Term Exam September 22, 2010 This exam has 25 questions of 4 points each. All answers have been rounded-off so if your calculated answer differs from the given options slightly, choose
Clever Hans the horse could do simple math and spell out the answers to simple questions. He wasn t always correct, but he was most of the time.
 Clever Hans the horse could do simple math and spell out the answers to simple questions. He wasn t always correct, but he was most of the time. While a team of scientists, veterinarians, zoologists and
UNIVERSITY OF TORONTO SCARBOROUGH Department of Computer and Mathematical Sciences Midterm Test February 2016
 UNIVERSITY OF TORONTO SCARBOROUGH Department of Computer and Mathematical Sciences Midterm Test February 2016 STAB22H3 Statistics I, LEC 01 and LEC 02 Duration: 1 hour and 45 minutes Last Name: First Name:
STAT243 LS: Intro to Probability and Statistics Quiz 1, Feb 10, 2017 KEY
 STAT243 LS: Intro to Probability and Statistics Quiz 1, Feb 10, 2017 KEY This is a 50-min quiz. Students may use a page of note (front and back), and a calculator, but nothing else is allowed. 1. A researcher
Descriptive Statistics Lecture
 Definitions: Lecture Psychology 280 Orange Coast College 2/1/2006 Statistics have been defined as a collection of methods for planning experiments, obtaining data, and then analyzing, interpreting and
Empirical Rule ( rule) applies ONLY to Normal Distribution (modeled by so called bell curve)
 applies ONLY to Normal Distribution (modeled by so called bell curve)") Chapter 2.5 Interpreting Standard Deviation Chebyshev Theorem Empirical Rule Chebyshev Theorem says that for ANY shape of data distribution at least 3/4 of all data fall no farther from the mean than 2
Chapter 2.5 Interpreting Standard Deviation Chebyshev Theorem Empirical Rule Chebyshev Theorem says that for ANY shape of data distribution at least 3/4 of all data fall no farther from the mean than 2
Statistical Techniques. Masoud Mansoury and Anas Abulfaraj
 Statistical Techniques Masoud Mansoury and Anas Abulfaraj What is Statistics? https://www.youtube.com/watch?v=lmmzj7599pw The definition of Statistics The practice or science of collecting and analyzing
Previously, when making inferences about the population mean,, we were assuming the following simple conditions:
 Chapter 17 Inference about a Population Mean Conditions for inference Previously, when making inferences about the population mean,, we were assuming the following simple conditions: (1) Our data (observations)
AP Psych - Stat 2 Name Period Date. MULTIPLE CHOICE. Choose the one alternative that best completes the statement or answers the question.
 AP Psych - Stat 2 Name Period Date MULTIPLE CHOICE. Choose the one alternative that best completes the statement or answers the question. 1) In a set of incomes in which most people are in the $15,000
c. Construct a boxplot for the data. Write a one sentence interpretation of your graph.
 STAT 280 Sample Test Problems Page 1 of 1 1. An English survey of 3000 medical records showed that smokers are more inclined to get depressed than non-smokers. Does this imply that smoking causes depression?
Distributions and Samples. Clicker Question. Review
 Distributions and Samples Clicker Question The major difference between an observational study and an experiment is that A. An experiment manipulates features of the situation B. An experiment does not
Statistics. Nur Hidayanto PSP English Education Dept. SStatistics/Nur Hidayanto PSP/PBI
 Statistics Nur Hidayanto PSP English Education Dept. RESEARCH STATISTICS WHAT S THE RELATIONSHIP? RESEARCH RESEARCH positivistic Prepositivistic Postpositivistic Data Initial Observation (research Question)
3. For a $5 lunch with a 55 cent ($0.55) tip, what is the value of the residual?
 tip, what is the value of the residual?") STATISTICS 216, SPRING 2006 Name: EXAM 1; February 21, 2006; 100 points. Instructions: Closed book. Closed notes. Calculator allowed. Double-sided exam. NO CELL PHONES. Multiple Choice (3pts each). Circle
STATISTICS 216, SPRING 2006 Name: EXAM 1; February 21, 2006; 100 points. Instructions: Closed book. Closed notes. Calculator allowed. Double-sided exam. NO CELL PHONES. Multiple Choice (3pts each). Circle
Statistics: Interpreting Data and Making Predictions. Interpreting Data 1/50
 Statistics: Interpreting Data and Making Predictions Interpreting Data 1/50 Last Time Last time we discussed central tendency; that is, notions of the middle of data. More specifically we discussed the
Observational study is a poor way to gauge the effect of an intervention. When looking for cause effect relationships you MUST have an experiment.
 Chapter 5 Producing data Observational study Observes individuals and measures variables of interest but does not attempt to influence the responses. Experiment Deliberately imposes some treatment on individuals
Math 214 REVIEW SHEET EXAM #1 Exam: Wednesday March, 2007
 Math 214 REVIEW SHEET EXAM #1 Exam: Wednesday March, 2007 THOUGHT QUESTIONS: 1. Suppose you are interested in determining if women are safer drivers than men in New York. Can you go to the Dept. of Motor
Data and Statistics 101: Key Concepts in the Collection, Analysis, and Application of Child Welfare Data
 TECHNICAL REPORT Data and Statistics 101: Key Concepts in the Collection, Analysis, and Application of Child Welfare Data CONTENTS Executive Summary...1 Introduction...2 Overview of Data Analysis Concepts...2
q2_2 MULTIPLE CHOICE. Choose the one alternative that best completes the statement or answers the question.
 q2_2 MULTIPLE CHOICE. Choose the one alternative that best completes the statement or answers the question. A sporting goods retailer conducted a customer survey to determine its customers primary reason
NORTH SOUTH UNIVERSITY TUTORIAL 1
 NORTH SOUTH UNIVERSITY TUTORIAL 1 REVIEW FROM BIOSTATISTICS I AHMED HOSSAIN,PhD Data Management and Analysis AHMED HOSSAIN,PhD - Data Management and Analysis 1 DATA TYPES/ MEASUREMENT SCALES Categorical:
12.1 Inference for Linear Regression. Introduction
 12.1 Inference for Linear Regression vocab examples Introduction Many people believe that students learn better if they sit closer to the front of the classroom. Does sitting closer cause higher achievement,
Students will understand the definition of mean, median, mode and standard deviation and be able to calculate these functions with given set of
 Students will understand the definition of mean, median, mode and standard deviation and be able to calculate these functions with given set of numbers. Also, students will understand why some measures
OCW Epidemiology and Biostatistics, 2010 David Tybor, MS, MPH and Kenneth Chui, PhD Tufts University School of Medicine October 27, 2010
 OCW Epidemiology and Biostatistics, 2010 David Tybor, MS, MPH and Kenneth Chui, PhD Tufts University School of Medicine October 27, 2010 SAMPLING AND CONFIDENCE INTERVALS Learning objectives for this session:
Displaying the Order in a Group of Numbers Using Tables and Graphs
 SIXTH EDITION 1 Displaying the Order in a Group of Numbers Using Tables and Graphs Statistics (stats) is a branch of mathematics that focuses on the organization, analysis, and interpretation of a group