Midterm project due next Wednesday at 2 PM
|
|
|
- Noreen Gibbs
- 5 years ago
- Views:
Transcription
1 Course Business Midterm project due next Wednesday at 2 PM Please submit on CourseWeb Next week s class: Discuss current use of mixed-effects models in the literature Short lecture on effect size & statistical power Two datasets on CourseWeb for Week 8 We ll work with alcohol.csv first
2 Week 8: Categorical Outcomes! Distributed Practice! Generalized Linear Mixed Effects Models! Problems with Over Proportions! Introduction to Generalized LMEMs! Implementation in R! Parameter Interpretation for Logit Models! Main effects! Confidence intervals! Interactions! Coding the Dependent Variable! Other Families
3 Distributed Practice!! Tzipi has collected a measure of frequency of alcohol use as a function of marital status (single, married, or divorced) in several different US cities. The head() of this dataframe, alcohol, is as follows:! Complete the tapply() statement to show Tzipi the average (mean) weekly alcohol use as a function of marital status:! tapply( (a), (b), (c) )
4 Distributed Practice!! Tzipi has collected a measure of frequency of alcohol use as a function of marital status (single, married, or divorced) in several different US cities. The head() of this dataframe, alcohol, is as follows:! Complete the tapply() statement to show Tzipi the average (mean) weekly alcohol use as a function of marital status:! tapply(alcohol$weeklydrinks, (b), (c) )
5 Distributed Practice!! Tzipi has collected a measure of frequency of alcohol use as a function of marital status (single, married, or divorced) in several different US cities. The head() of this dataframe, alcohol, is as follows:! Complete the tapply() statement to show Tzipi the average (mean) weekly alcohol use as a function of marital status:! tapply(alcohol$weeklydrinks, alcohol$maritalstatus, (c) )
6 Distributed Practice!! Tzipi has collected a measure of frequency of alcohol use as a function of marital status (single, married, or divorced) in several different US cities. The head() of this dataframe, alcohol, is as follows:! Complete the tapply() statement to show Tzipi the average (mean) weekly alcohol use as a function of marital status:! tapply(alcohol$weeklydrinks, alcohol$maritalstatus, mean)
 of this dataframe, alcohol, is as follows:! Complete the tapply() statement to show Tzipi the average (mean) weekly alcohol use as a function of marital status:")
7 Distributed Practice!! Tzipi has collected a measure of frequency of alcohol use as a function of marital status (single, married, or divorced) in several different US cities. The head() of this dataframe, alcohol, is as follows:! Complete the tapply() statement to show Tzipi the average (mean) weekly alcohol use as a function of marital status:
8 Distributed Practice!! Deshawn is looking at some R code sent by a collaborator for a study of threat detection (as measured by response time). The R code sets the following contrasts:! What comparison is performed by the first contrast? And what about the second?

9 Distributed Practice!! Deshawn is looking at some R code sent by a collaborator for a study of threat detection (as measured by response time). The R code sets the following contrasts:! What comparison is performed by the first contrast? And what about the second?! 1 st contrast: Compares PTSD vs. no PTSD! 2 nd contrast: Compares dissociative PTSD to nondissociative PTSD
10 Week 8: Categorical Outcomes! Distributed Practice! Generalized Linear Mixed Effects Models! Problems with Over Proportions! Introduction to Generalized LMEMs! Implementation in R! Parameter Interpretation for Logit Models! Main effects! Confidence intervals! Interactions! Coding the Dependent Variable! Other Families


11 Categorical Outcomes

12 Categorical Outcomes
13 This Week s Dataset Main week 8 dataset: cuedrecall.csv Cued recall task: Study phase: See pairs of words WOLF--PUPPY Test phase: See the first word, have to type in the second WOLF--?
14 CYLINDER CAN
15 CAREER JOB
16 EXPERT PROFESSOR
17 GAME MONOPOLY
18
19 CYLINDER--?
20 EXPERT--?
21 Over Proportions Approach On each trial, only 2 possible outcomes: target is recalled (a hit ) or it s forgotten (a miss ) Over proportions approach: Calculate the proportion (or percentage) of targets recalled correctly for each subject & in each condition Use that as our DV in an ANOVA or linear regression

22 Problems with Over Proportions Suppose we do a regression on percentages and end up with the following model: Percent = 51% + 10% * StudyTime Recalled (Intercept) (per pair, in seconds) If we study the word pairs for 9 seconds each, what percent of pairs does the model predict we ll recall? 141% impossible! Proportions have to be between 0 and 1, but ANOVA/linear regression assume infinite tails -


23 Problems with Over Proportions I don t care about predicting values! I just want to test which variables have a significant effect e.g., Does study time have a significant effect on whether you ll get a passing grade? PREDICTIONS: STUDY TIME = 2 s. PREDICTIONS: STUDY TIME = 5 s. Recall 0-69%: No Pass 0.42 Recall %: Pass 0.58???? Recall >100%:???? 0.35 Recall 0-69%: No Pass 0.1 Recall %: Pass 0.55


24 Problems with Over Proportions I don t care about predicting values! I just want to test which variables have a significant effect e.g., Does study time have a significant effect on whether you ll get a passing grade? Problem: Our model assigns probability to things that can never happen Means we re underestimating the probabilities of everything that can happen Recall >100%:???? 0.35 Recall 0-69%: No Pass 0.1 Recall % : Pass 0.55
25 Solutions? Transform the proportions e.g. arcsine transformation: asin( p) Still possible to predict impossible values; just happens less often Kind of a kludge: Arcsine of a proportion doesn t have any real-world meaning Even if we found a good transformation Calculating a proportion over all of the items means we lose the item information!
26 Solutions? Transform the proportions e.g. arcsine transformation: asin( p) Still possible to predict impossible values; just happens less often Kind of a kludge: Arcsine of a proportion doesn t have any real-world meaning Even if we found a good transformation Calculating a proportion over all of the items means we lose the item information! What we d really like is to model the actual task each pair is either recalled or not
27 Week 8: Categorical Outcomes! Distributed Practice! Generalized Linear Mixed Effects Models! Problems with Over Proportions! Introduction to Generalized LMEMs! Implementation in R! Parameter Interpretation for Logit Models! Main effects! Confidence intervals! Interactions! Coding the Dependent Variable! Other Families


28 Generalized Linear Mixed Effects Models With our mixed effect models, we ve been predicting the outcome of particular trials/observations RT Study Time = Intercept + + Subject + Item But, those were for normally distributed DVs like RT

29 Generalized Linear Mixed Effects Models With our mixed effect models, we ve been predicting the outcome of particular trials/observations Recalled or Not? Study Time = Intercept + + Subject + Item But, those were for normally distributed DVs Here, we have just 2 possible outcomes per trial Clearly not a normal distribution But maybe we can model this with a different distribution

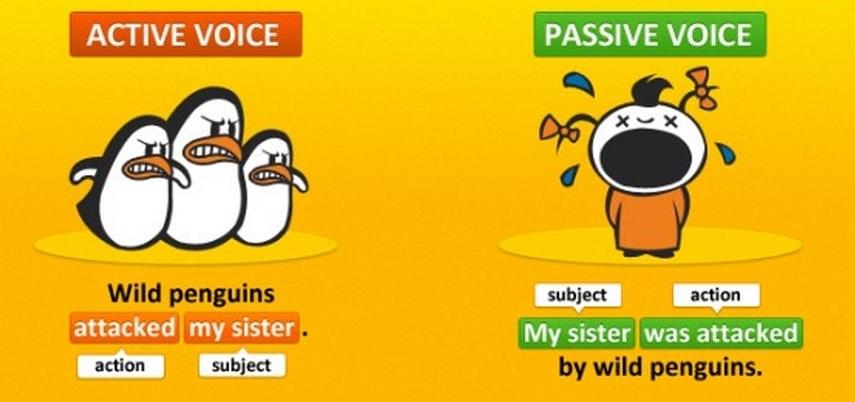
30 Binomial Distribution Distribution of outcomes when one of two events (a hit ) occurs with probability p Examples: Word pair recalled or not Person diagnosed with depression or not High school student decides to attend college or not Speaker produces active sentence or passive sentence

31 Generalized Linear Mixed Effects Models We can model recall as a binomial variable Recalled or Not? = Intercept + + Subject Study Time + Item Binomial: 0 or 1 Could be any number! But, we need a way to link the linear model to 1 of 2 binomial outcomes Won t work to model the probability of a hit Probability bounded between 0 and 1, but linear predictor can take on any value
32 Never Always Tell Me the Odds What about the odds of recalling an item? p(recalled) p(forgotten) p(recalled) 1-p(recalled) If the probability of recall is.67, what are odds?.67/(1-.67) =.67/.33 2 Some other odds: Odds of being right-handed:.9/.1 = 9 Odds of identical twins: 1/ = Odds are < 1 if the event doesn t happen more often that it does happen
 =.67/.33 2 Some other odds: Odds of being right-handed:.9/.1 = 9 Odds of identical twins: 1/375.")
33 Never Always Tell Me the Odds What about the odds of recalling an item? p(recalled) p(forgotten) = p(recalled) 1-p(recalled) If the probability of recall is.67, what are odds?.67/(1-.67) =.67/.33 2 Some other odds: Odds of being right-handed:.9/.1 = 9 Odds of identical twins: 1/ Odds of having five fingers per hand: 500/1
34 Never Always Tell Me the Odds What about the odds of recalling an item? p(recalled) p(forgotten) Try converting these probabilities into odds Probability of graduating high school in the US:.92 Probability of a coin flip being tails:.51 = p(recalled) 1-p(recalled) Probability of depression sometime in your life:.17 Probability of detecting a gorilla walking through a crowd of people:.50
35 Never Always Tell Me the Odds What about the odds of recalling an item? p(recalled) p(forgotten) = p(recalled) 1-p(recalled) Try converting these probabilities into odds Probability of graduating high school in the US: odds you ll graduate Probability of a coin flip being tails: Probability of depression sometime in your life: Probability of detecting a gorilla walking through a crowd of people:.50 = 1.00
36 Never Always Tell Me the Odds What about the odds of recalling an item? p(recalled) p(forgotten) p(recalled) 1-p(recalled) Using the odds in our model would be somewhat better than probabilities Odds have no upper bound Can have 1,000,000:1 odds! But, still a lower bound at 0 =
37 Logit Now, let s take the logarithm of the odds Specifically, the natural log (sometimes written as ln ) The natural log is what we get by default from log() in R (and in most other programming languages, too) log odds = log p(recalled) 1-p(recalled) The log odds or logit [ ]
38 Logit Now, let s take the logarithm of the odds log odds = log [ ] p(recalled) 1-p(recalled) The log odds or logit If the probability of recall is 0.2, what are the log odds of recall? log(.2/(1-.2)) log(.2/.8) log(0.25) -1.39
39 As probability of hit approaches 0, log odds approach negative infinity. No lower bound. LOG ODDS of recall If probability of hit is.5 (even odds), log odds are zero PROBABILITY of recall Probabilities equidistant from.5 have log odds with the same absolute value (-1.39 and 1.39) As probability of hit approaches 1, log odds approach infinity. No upper bound.
40 Logit Now, let s take the logarithm of the odds log odds = log [ ] p(hit) 1-p(hit) What are the log odds when the probability of correctly translating a word from English to Klingon is 50%? the probability that your cause of death will be a heart attack is 29%? the probability that a particular square foot of the Earth s surface is covered with water is 71%?
41 Logit Now, let s take the logarithm of the odds log odds = log [ ] p(hit) 1-p(hit) What are the log odds when the probability of correctly translating a word from English to Klingon is 50%? 0 the probability that your cause of death will be a heart attack is 29%? the probability that a particular square foot of the Earth s surface is covered with water is 71%? 0.90

![upper or lower bound Link function is the logit [ ] p(hit) 1-p(hit)](/docs-images/83/87885493/images/42-4.jpg "Study Time = Intercept + + Subject + Item Generalized linear mixed")

42 Generalized Linear Mixed Effects Models log To make predictions about a binomial distribution, we ll be predicting the log odds of a hit No upper or lower bound Link function is the logit [ ] p(hit) 1-p(hit) Study Time = Intercept + + Subject + Item Generalized linear mixed effect models when we use a link function to relate the model to a distribution other than the normal Before, our link function was just the identity
43 Week 8: Categorical Outcomes! Distributed Practice! Generalized Linear Mixed Effects Models! Problems with Over Proportions! Introduction to Generalized LMEMs! Implementation in R! Parameter Interpretation for Logit Models! Main effects! Confidence intervals! Interactions! Coding the Dependent Variable! Other Families
 Part of lme4, so you")

44 From lmer() to glmer() For generalized linear mixed effects models, we use glmer() Part of lme4, so you already have it! LMER Linear Mixed Effects Regression GLMER Generalized Linear Mixed Effects Regression
45 glmer() glmer() syntax identical to lmer() except we add family=binomial argument to indicate which distribution we want Generic example: glmer(dv ~ 1 + Variables + (1+Variables RandomEffect), data=mydataframe, family=binomial)
46 cuedrecall.csv Let s model our cued recall data with glmer() 120 Subjects, all see the same 36 WordPairs AssocStrength (property of WordPairs): Two words have Low or High relation in meaning VIKING HELMET = high associative strength VIKING COLLEGE = low associative strength Study Strategy (property of Subjects): Maintenance rehearsal: Repeat it over & over Elaborative rehearsal: Relate the two words These are both categorical variables! How should we code them? 2 x 2 design where we re interested in the main effect of elaborative rehearsal (averaging over assoc. strength) & vice versa Hint: We expect High AssocStrength & Elaborative Strategy to be better
47 cuedrecall.csv Let s model our cued recall data with glmer() 120 Subjects, all see the same 36 WordPairs AssocStrength (property of WordPairs): Two words have Low or High relation in meaning VIKING HELMET = high associative strength VIKING COLLEGE = low associative strength Study Strategy (property of Subjects): Maintenance rehearsal: Repeat it over & over Elaborative rehearsal: Relate the two words These are both categorical variables! How should we code them? contrasts(cuedrecall$assocstrength) <-???? contrasts(cuedrecall$strategy) <-????
48 cuedrecall.csv Let s model our cued recall data with glmer() 120 Subjects, all see the same 36 WordPairs AssocStrength (property of WordPairs): Two words have Low or High relation in meaning VIKING HELMET = high associative strength VIKING COLLEGE = low associative strength Study Strategy (property of Subjects): Maintenance rehearsal: Repeat it over & over Elaborative rehearsal: Relate the two words These are both categorical variables! How should we code them? contrasts(cuedrecall$assocstrength) <- c(???,???) contrasts(cuedrecall$strategy) <- c(???,???)
49 cuedrecall.csv Let s model our cued recall data with glmer() 120 Subjects, all see the same 36 WordPairs AssocStrength (property of WordPairs): Two words have Low or High relation in meaning VIKING HELMET = high associative strength VIKING COLLEGE = low associative strength Study Strategy (property of Subjects): Maintenance rehearsal: Repeat it over & over Elaborative rehearsal: Relate the two words These are both categorical variables! How should we code them? contrasts(cuedrecall$assocstrength) <- c(0.5, -0.5) contrasts(cuedrecall$strategy) <- c(0.5, -0.5)
50 cuedrecall.csv Let s model our cued recall data with glmer() 120 Subjects, all see the same 36 WordPairs AssocStrength (property of WordPairs): Two words have Low or High relation in meaning VIKING HELMET = high associative strength VIKING COLLEGE = low associative strength Study Strategy (property of Subjects): Maintenance rehearsal: Repeat it over & over Elaborative rehearsal: Relate the two words Model with maximal random effects structure: model1 <- glmer(recalled ~ 1 + AssocStrength * Strategy + (1 + AssocStrength Subject) + (1 + Strategy WordPair), data=cuedrecall, family=binomial) Random slope of AssocStrength by subjects because it s a within-subjects variable. AssocStrength effect could be different for each subject.
51 cuedrecall.csv Let s model our cued recall data with glmer() 120 Subjects, all see the same 36 WordPairs AssocStrength (property of WordPairs): Two words have Low or High relation in meaning VIKING HELMET = high associative strength VIKING COLLEGE = low associative strength Study Strategy (property of Subjects): Maintenance rehearsal: Repeat it over & over Elaborative rehearsal: Relate the two words Model with maximal random effects structure: model1 <- glmer(recalled ~ 1 + AssocStrength * Strategy + (1 + AssocStrength Subject) + (1 + Strategy WordPair), data=cuedrecall, family=binomial) No random slope of Strategy subjects because it s betweensubjects. Each subject has only 1 strategy. We can t calculate a strategy effect separately for each subject.
52 Can You Spot the Differences? What an lmer() model looked like
53 Can You Spot the Differences? Fit by Laplace estimation (don t need to worry about REML vs ML) Binomial family with logit link No residual error variance. Trial outcome can only be recalled or forgotten, so each prediction is either correct or incorrect. Wald z test: p values automatically given by Laplace estimation, don t need lmertest() But, likelihood ratio test still better for small sample sizes
54 Week 8: Categorical Outcomes! Distributed Practice! Generalized Linear Mixed Effects Models! Problems with Over Proportions! Introduction to Generalized LMEMs! Implementation in R! Parameter Interpretation for Logit Models! Main effects! Confidence intervals! Interactions! Coding the Dependent Variable! Other Families
55 Parameter Interpretation Effect of AssocStrength has a positive sign
 to reorder Forgotten listed first, so it s the miss Remembered listed second, so it s the hit So, +")
56 Parameter Interpretation Results are always framed in terms of what predicts hits glmer s rule: If a numerical variable, 0s are considered misses and 1s are considered hits If a two-level categorical variable, the first category is considered a miss and the second is a hit Could use relevel() to reorder Forgotten listed first, so it s the miss Remembered listed second, so it s the hit So, + effect of associative strength means better recall
57 Parameter Interpretation Effect of AssocStrength has a positive sign It has a positive effect on recall But how should we interpret the parameter estimates?
 \" e??? = 0.25 = ¼ Multiply 2 * 3, then take the log Find log(2) and log(3), then add them Things that are multiplications become additive in log world!")
58 Logarithm Review log(10) = 2.30 because e 2.30 = 10 The power to which we raise e ( 2.72) to get 10. Natural log (now standard meaning of log) What are? log(1) " e??? = 1 log(4) " e??? = 4 log(0.25) " e??? = 0.25 = ¼ Multiply 2 * 3, then take the log Find log(2) and log(3), then add them Things that are multiplications become additive in log world! Because e a * e b = e a+b log(1) = 0 log(4) = 1.39 log(0.25) = x +
 with exp() exp(3) means Raise e to the exponent of 3 exp(log(3))")
 Log World turned multiplication into addition; exp() turns additions back into")
59 exp() Help! Get me out of log world! We can undo log() with exp() exp(3) means Raise e to the exponent of 3 exp(log(3)) Find the power to which we raise e to get 3 and then raise e to that power (giving us 3) Log World turned multiplication into addition; exp() turns additions back into multiplications exp(2+3) = exp(2) * exp(3) x log() + exp()
60 Parameter Interpretation Our model is all about logits (log odds) What is average performance here? 0.50 logits One statistically correct way to interpret the model but not easy to understand in real-world terms

 Average odds of recall")
61 Parameter Interpretation Let s go from log odds back to regular odds exp() exp() Average odds of recall are 1.65 So, not quite 2:1
62 Parameter Interpretation Our model is all about logits (log odds) What about the effect of study strategy? On average, difference between elaborative and maintenance rehearsal = 0.73 logits
 Effects that were additive in log odds become multiplicative in odds Elaborative")

63 Parameter Interpretation Let s go from log odds back to regular odds exp() x exp() Effects that were additive in log odds become multiplicative in odds Elaborative rehearsal increases odds by 2.08 times When we study COFFEE-TEA with maintenance rehearsal, our odds of recall are 3:1. What if we use elaborative rehearsal? Initial odds of 3 x 2.08 increase = 6.24 (NOT 5.08!)
64 Parameter Interpretation ODDS ARE NOT PROBABILITIES ODDS ARE NOT PROBABILITIES ODDS ARE NOT PROBABILITIES even if you use exp() Right description: On average, elaborative rehearsal increased the odds of correct recall by 2.08 times. Wrong description: Elaborative rehearsal increased the probability of correct recall by 2.08 times.
65 Parameter Interpretation Our model is all about logits (log odds) Describe the effect of associative strength
66 Parameter Interpretation Our model is all about logits (log odds) Describe the effect of associative strength exp(0.32) = 1.38 High associative strength increases the odds of recall by 1.38 times
67 Week 8: Categorical Outcomes! Distributed Practice! Generalized Linear Mixed Effects Models! Problems with Over Proportions! Introduction to Generalized LMEMs! Implementation in R! Parameter Interpretation for Logit Models! Main effects! Confidence intervals! Interactions! Coding the Dependent Variable! Other Families
68 Confidence Intervals Both our estimates and standard errors are in terms of log odds Thus, so is our confidence interval 95% confidence interval for AssocStrength effect in terms of log odds Estimate +/- (1.96 * standard error) /- (1.96 *.10) /-.20 [0.12, 0.52] Estimate is 0.32 change in logits. 95% CI around that estimate is [0.12, 0.52]
69 Confidence Intervals Both our estimates and standard errors are in terms of log odds Thus, so is our confidence interval 95% confidence interval for AssocStrength effect in terms of log odds Estimate is 0.32 change in logits. 95% CI around that estimate is [0.12, 0.52] But, log odds hard to understand. Let s use exp() to turn the endpoints of the confidence interval into odds 95% CI is exp(c(0.12, 0.52)) = [1.13, 1.68]
70 Confidence Intervals For confidence intervals around log odds As usual, we care about whether the confidence interval contains 0 Adding or subtracting 0 to the log odds doesn t change it. It s the null effect. So, we re interested in whether the estimate of the effect significantly differs from 0. When we transform to the odds Now, we care about whether the CI contains 1 Remember, effects on odds are multiplicative. Multiplying by 1 is the null effect we test against. A CI that contains 0 in log odds will always contain 1 when we transform to odds (and vice versa).
71 Confidence Intervals Compute the 95% confidence interval for Strategy effect in terms of log odds Then, convert it a CI on the odds
72 Confidence Intervals Compute the 95% confidence interval for Strategy effect in terms of log odds Estimate +/- (1.96 * standard error) /- (1.96 *.08) /-.16 [0.57, 0.89] Then, convert it a CI on the odds
73 Confidence Intervals Compute the 95% confidence interval for Strategy effect in terms of log odds Estimate +/- (1.96 * standard error) /- (1.96 *.08) /-.16 [0.57, 0.89] Then, convert it a CI on the odds exp(c(0.57, 0.89)) = [1.77, 2.44]
74 Asymmetric Confidence Intervals Confidence interval for Strategy effect: Our estimate is 2.08 Compare the distance to 1.77 vs. the distance to 2.44 Confidence intervals are numerically asymmetric once turned back into odds
75 Asymmetric Confidence Intervals Odds changes quickly at higher logits ODDS of recall Value of the odds changes slowly when logit is small LOG ODDS of recall We re more certain about the odds for smaller/ lower logits
76 Week 8: Categorical Outcomes! Distributed Practice! Generalized Linear Mixed Effects Models! Problems with Over Proportions! Introduction to Generalized LMEMs! Implementation in R! Parameter Interpretation for Logit Models! Main effects! Confidence intervals! Interactions! Coding the Dependent Variable! Other Families
77 Interactions Associative strength has a + effect on recall Study time has a + effect on recall But, their interaction has a - coefficient Interpretation?: With elaborative rehearsal, associative strength matters less If pair has high associative strength, it matters less how you study it (another way of saying the same thing)

78 Interactions We now understand the sign of the interaction What about the specific numeric estimate? What does mean in this context? Descriptive stats: Log odds in each condition Not something you have to do when running your own model this is just to understand where the numbers come from Low associative strength pair: Elaborative rehearsal -> Increase of 0.97 logits High associative strength pair: Elaborative rehearsal -> Increase of 0.49 logits

 = exp(-0.48) = 0.")
79 Interactions Low associative strength pair: Elaborative rehearsal -> Increase of 0.97 logits High associative strength pair: Elaborative rehearsal -> Increase of 0.49 logits We can compute a difference in log odds: = Or an odds ratio in terms of the odds: exp(.49) = exp(-0.48) = 0.62 exp(.97)
80 Interactions Low associative strength pair: Elaborative rehearsal -> Increase of 0.97 logits High associative strength pair: Elaborative rehearsal -> Increase of 0.49 logits An odds ratio in terms of the odds: exp(.49) = exp(-0.48) = 0.62 exp(.97) The ratio between the odds of recalling pairs with elaborative versus maintenance rehearsal was 0.62 times smaller for high associative strength items.
81 Week 8: Categorical Outcomes! Distributed Practice! Generalized Linear Mixed Effects Models! Problems with Over Proportions! Introduction to Generalized LMEMs! Implementation in R! Parameter Interpretation for Logit Models! Main effects! Confidence intervals! Interactions! Coding the Dependent Variable! Other Families
 and an error as a 0 ( miss ) We re looking at things that predict")
82 Coding the Dependent Variable So far, positive numbers in the results meant better recall That s because we treat correct recall as a 1 ( hit ) and an error as a 0 ( miss ) We re looking at things that predict recall
83 Coding the Dependent Variable I don t trust these results. What if we d coded it the other way, with forgotten as 1 and remembered as 0? Things might be totally different! This is also a totally plausible coding scheme Variable that tracks whether you forgot something! Let s see if Evil Scott is right: Step 1: Create a new variable that codes things the way Evil Scott wants Step 2: Re-run the model Step 3:??? Step 4: PROFIT!
84 Coding the Dependent Variable I don t trust these results. What if we d coded it the other way, with forgotten as 1 and remembered as 0? Things might be totally different! This is also a totally plausible coding scheme Variable that tracks whether you forgot something! Let s see if Evil Scott is right: Step 1: Create a new variable that codes things the way Evil Scott wants cuedrecall$forgotten <- ifelse(cuedrecall $Recalled == 'Forgotten', 1, 0) Step 2: Re-run the model Step 3:??? Step 4: PROFIT!

85 Model of recall Hits and Misses Let s try running our model with the new coding: All we ve done is flip the signs Anything that increases remembering decreases forgetting (and vice versa) Remember how logits equally distant from even odds have the same absolute value? Won t affect pattern of significance Conclusion: What we code as 1 vs 0 doesn t affect our conclusions (good!!) Choose the coding that makes sense for your research question. Do you want to talk about what predicts graduation or what predicts dropping out? Model of forgetting
86 Week 8: Categorical Outcomes! Distributed Practice! Generalized Linear Mixed Effects Models! Problems with Over Proportions! Introduction to Generalized LMEMs! Implementation in R! Parameter Interpretation for Logit Models! Main effects! Confidence intervals! Interactions! Coding the Dependent Variable! Other Families
87 One More Thing glmer() supports other non-normal distributions family=poisson For count data Example: Number of solutions you brainstormed for a problem Counts range from 0 to positive infinity Link is log(count) Probability Count
Why Mixed Effects Models?
 Why Mixed Effects Models? Mixed Effects Models Recap/Intro Three issues with ANOVA Multiple random effects Categorical data Focus on fixed effects What mixed effects models do Random slopes Link functions
7 Statistical Issues that Researchers Shouldn t Worry (So Much) About
 About") 7 Statistical Issues that Researchers Shouldn t Worry (So Much) About By Karen Grace-Martin Founder & President About the Author Karen Grace-Martin is the founder and president of The Analysis Factor.
7 Statistical Issues that Researchers Shouldn t Worry (So Much) About By Karen Grace-Martin Founder & President About the Author Karen Grace-Martin is the founder and president of The Analysis Factor.
3 CONCEPTUAL FOUNDATIONS OF STATISTICS
 3 CONCEPTUAL FOUNDATIONS OF STATISTICS In this chapter, we examine the conceptual foundations of statistics. The goal is to give you an appreciation and conceptual understanding of some basic statistical
Week 12: Missing Data
 Week 12: Missing Data! Rank Deficiency! Linear Combinations! Incomplete Designs! Empirical Logit! Missing Data (NA values)! Intro! Types of Missingness! Non-Ignorable! Ignorable! Summary! Possible Solutions!
Reflection Questions for Math 58B
 Reflection Questions for Math 58B Johanna Hardin Spring 2017 Chapter 1, Section 1 binomial probabilities 1. What is a p-value? 2. What is the difference between a one- and two-sided hypothesis? 3. What
15.301/310, Managerial Psychology Prof. Dan Ariely Recitation 8: T test and ANOVA
 15.301/310, Managerial Psychology Prof. Dan Ariely Recitation 8: T test and ANOVA Statistics does all kinds of stuff to describe data Talk about baseball, other useful stuff We can calculate the probability.
One-Way ANOVAs t-test two statistically significant Type I error alpha null hypothesis dependant variable Independent variable three levels;
 1 One-Way ANOVAs We have already discussed the t-test. The t-test is used for comparing the means of two groups to determine if there is a statistically significant difference between them. The t-test
Stepwise method Modern Model Selection Methods Quantile-Quantile plot and tests for normality
 Week 9 Hour 3 Stepwise method Modern Model Selection Methods Quantile-Quantile plot and tests for normality Stat 302 Notes. Week 9, Hour 3, Page 1 / 39 Stepwise Now that we've introduced interactions,
Review and Wrap-up! ESP 178 Applied Research Methods Calvin Thigpen 3/14/17 Adapted from presentation by Prof. Susan Handy
 Review and Wrap-up! ESP 178 Applied Research Methods Calvin Thigpen 3/14/17 Adapted from presentation by Prof. Susan Handy Final Proposals Read instructions carefully! Check Canvas for our comments on
Assignment 4: True or Quasi-Experiment
 Assignment 4: True or Quasi-Experiment Objectives: After completing this assignment, you will be able to Evaluate when you must use an experiment to answer a research question Develop statistical hypotheses
A Guide to Help You Reduce and Stop Using Tobacco
 Let s Talk Tobacco A Guide to Help You Reduce and Stop Using Tobacco Congratulations for taking this first step towards a healthier you! 1-866-710-QUIT (7848) albertaquits.ca It can be hard to stop using
Ordinary Least Squares Regression
 Ordinary Least Squares Regression March 2013 Nancy Burns (nburns@isr.umich.edu) - University of Michigan From description to cause Group Sample Size Mean Health Status Standard Error Hospital 7,774 3.21.014
What makes us special? Ages 3-5
 What makes us special? Ages 3-5 Pudsey s learning aims I can think about how we are different and how we are the same. I can think about how we are special and what makes us unique. Key Words Special Unique
Unit 1 Exploring and Understanding Data
 Unit 1 Exploring and Understanding Data Area Principle Bar Chart Boxplot Conditional Distribution Dotplot Empirical Rule Five Number Summary Frequency Distribution Frequency Polygon Histogram Interquartile
Chapter Eight: Multivariate Analysis
 Chapter Eight: Multivariate Analysis Up until now, we have covered univariate ( one variable ) analysis and bivariate ( two variables ) analysis. We can also measure the simultaneous effects of two or
Why Is It That Men Can t Say What They Mean, Or Do What They Say? - An In Depth Explanation
 Why Is It That Men Can t Say What They Mean, Or Do What They Say? - An In Depth Explanation It s that moment where you feel as though a man sounds downright hypocritical, dishonest, inconsiderate, deceptive,
STAT 113: PAIRED SAMPLES (MEAN OF DIFFERENCES)
") STAT 113: PAIRED SAMPLES (MEAN OF DIFFERENCES) In baseball after a player gets a hit, they need to decide whether to stop at first base, or try to stretch their hit from a single to a double. Does the
STAT 113: PAIRED SAMPLES (MEAN OF DIFFERENCES) In baseball after a player gets a hit, they need to decide whether to stop at first base, or try to stretch their hit from a single to a double. Does the
Political Science 15, Winter 2014 Final Review
 Political Science 15, Winter 2014 Final Review The major topics covered in class are listed below. You should also take a look at the readings listed on the class website. Studying Politics Scientifically
The Logic of Data Analysis Using Statistical Techniques M. E. Swisher, 2016
 The Logic of Data Analysis Using Statistical Techniques M. E. Swisher, 2016 This course does not cover how to perform statistical tests on SPSS or any other computer program. There are several courses
Chapter 1 Introduction
 Chapter 1 Introduction Chapter 1-1 Chapter Highlights 1. This Manual is for You 2. What is Scleroderma? 3. Who gets Scleroderma? 4. What are the Early Symptoms of Scleroderma? 5. Is All Scleroderma the
Chapter Eight: Multivariate Analysis
 Chapter Eight: Multivariate Analysis Up until now, we have covered univariate ( one variable ) analysis and bivariate ( two variables ) analysis. We can also measure the simultaneous effects of two or
Measuring association in contingency tables
 Measuring association in contingency tables Patrick Breheny April 8 Patrick Breheny Introduction to Biostatistics (171:161) 1/25 Hypothesis tests and confidence intervals Fisher s exact test and the χ
NEXTGEN ICD10 TIPS DEMONSTRATION
 NEXTGEN ICD10 TIPS DEMONSTRATION This demonstration reviews some of the changes you ll see in NextGen after ICD10 goes into effect October 1, 2015. Details of the workflow will likely vary somewhat, depending
Inferential Statistics
 Inferential Statistics and t - tests ScWk 242 Session 9 Slides Inferential Statistics Ø Inferential statistics are used to test hypotheses about the relationship between the independent and the dependent
Simple Linear Regression One Categorical Independent Variable with Several Categories
 Simple Linear Regression One Categorical Independent Variable with Several Categories Does ethnicity influence total GCSE score? We ve learned that variables with just two categories are called binary
Clincial Biostatistics. Regression
 Regression analyses Clincial Biostatistics Regression Regression is the rather strange name given to a set of methods for predicting one variable from another. The data shown in Table 1 and come from a
Welcome to this series focused on sources of bias in epidemiologic studies. In this first module, I will provide a general overview of bias.
 Welcome to this series focused on sources of bias in epidemiologic studies. In this first module, I will provide a general overview of bias. In the second module, we will focus on selection bias and in
Find the slope of the line that goes through the given points. 1) (-9, -68) and (8, 51) 1)
 (-9, -68) and (8, 51) 1)") Math 125 Semester Review Problems Name Find the slope of the line that goes through the given points. 1) (-9, -68) and (8, 51) 1) Solve the inequality. Graph the solution set, and state the solution set
Math 125 Semester Review Problems Name Find the slope of the line that goes through the given points. 1) (-9, -68) and (8, 51) 1) Solve the inequality. Graph the solution set, and state the solution set
Attention and Concentration Problems Following Traumatic Brain Injury. Patient Information Booklet. Talis Consulting Limited
 Attention and Concentration Problems Following Traumatic Brain Injury Patient Information Booklet Talis Consulting Limited What are Attention and Concentration? Attention and concentration are two skills
Study Guide #2: MULTIPLE REGRESSION in education
 Study Guide #2: MULTIPLE REGRESSION in education What is Multiple Regression? When using Multiple Regression in education, researchers use the term independent variables to identify those variables that
Choosing Life: Empowerment, Action, Results! CLEAR Menu Sessions. Substance Use Risk 2: What Are My External Drug and Alcohol Triggers?
 Choosing Life: Empowerment, Action, Results! CLEAR Menu Sessions Substance Use Risk 2: What Are My External Drug and Alcohol Triggers? This page intentionally left blank. What Are My External Drug and
Progress Monitoring Handouts 1
 Progress Monitoring Handouts Teacher Administration Scripts, Teacher Sheets, and Student Sheets Reading Letter Sound Fluency (LSF)..2 Word Identification Fluency (WIF)...5 Passage Reading Fluency (PRF)
STAT 200. Guided Exercise 4
 STAT 200 Guided Exercise 4 1. Let s Revisit this Problem. Fill in the table again. Diagnostic tests are not infallible. We often express a fale positive and a false negative with any test. There are further
The t-test: Answers the question: is the difference between the two conditions in my experiment "real" or due to chance?
 The t-test: Answers the question: is the difference between the two conditions in my experiment "real" or due to chance? Two versions: (a) Dependent-means t-test: ( Matched-pairs" or "one-sample" t-test).
Table of Contents FOREWORD THE TOP 7 CAUSES OF RUNNING INJURIES 1) GET IN SHAPE TO RUN... DON T RUN TO GET IN SHAPE.
 GET IN SHAPE TO RUN... DON T RUN TO GET IN SHAPE.") Table of Contents FOREWORD THE TOP 7 CAUSES OF RUNNING INJURIES 1) GET IN SHAPE TO RUN... DON T RUN TO GET IN SHAPE. 2) A PROPER WARMUP IS WORTH YOUR TIME. NO RUN IS WORTH AN INJURY. ) THE ARCH WAS NOT
Table of Contents FOREWORD THE TOP 7 CAUSES OF RUNNING INJURIES 1) GET IN SHAPE TO RUN... DON T RUN TO GET IN SHAPE. 2) A PROPER WARMUP IS WORTH YOUR TIME. NO RUN IS WORTH AN INJURY. ) THE ARCH WAS NOT
Problem Situation Form for Parents
 Problem Situation Form for Parents Please complete a form for each situation you notice causes your child social anxiety. 1. WHAT WAS THE SITUATION? Please describe what happened. Provide enough information
Stress is different for everyone While what happens in the brain and the body is the same for all of us, the precipitating factors are very
 1 Stress is different for everyone While what happens in the brain and the body is the same for all of us, the precipitating factors are very individual. What one person experiences as stressful might
Business Statistics Probability
 Business Statistics The following was provided by Dr. Suzanne Delaney, and is a comprehensive review of Business Statistics. The workshop instructor will provide relevant examples during the Skills Assessment
Chi Square Goodness of Fit
 index Page 1 of 24 Chi Square Goodness of Fit This is the text of the in-class lecture which accompanied the Authorware visual grap on this topic. You may print this text out and use it as a textbook.
Student Performance Q&A:
 Student Performance Q&A: 2009 AP Statistics Free-Response Questions The following comments on the 2009 free-response questions for AP Statistics were written by the Chief Reader, Christine Franklin of
The Wellbeing Course. Resource: Mental Skills. The Wellbeing Course was written by Professor Nick Titov and Dr Blake Dear
 The Wellbeing Course Resource: Mental Skills The Wellbeing Course was written by Professor Nick Titov and Dr Blake Dear About Mental Skills This resource introduces three mental skills which people find
DAY 2 RESULTS WORKSHOP 7 KEYS TO C HANGING A NYTHING IN Y OUR LIFE TODAY!
 H DAY 2 RESULTS WORKSHOP 7 KEYS TO C HANGING A NYTHING IN Y OUR LIFE TODAY! appy, vibrant, successful people think and behave in certain ways, as do miserable and unfulfilled people. In other words, there
Results & Statistics: Description and Correlation. I. Scales of Measurement A Review
 Results & Statistics: Description and Correlation The description and presentation of results involves a number of topics. These include scales of measurement, descriptive statistics used to summarize
Test Anxiety: The Silent Intruder, William B. Daigle, Ph.D. Test Anxiety The Silent Intruder
 Test Anxiety The Silent Intruder Resources; St. Gerard Majella Catholic School, March 6, 2010 William B. Daigle, Ph.D. 8748 Quarters Lake Road Baton Rouge, LA 70809 (225) 922-7767 225) 922-7768 fax williambdaiglephd@hotmail.com
MODEL I: DRINK REGRESSED ON GPA & MALE, WITHOUT CENTERING
 Interpreting Interaction Effects; Interaction Effects and Centering Richard Williams, University of Notre Dame, https://www3.nd.edu/~rwilliam/ Last revised February 20, 2015 Models with interaction effects
Simple Sensitivity Analyses for Matched Samples Thomas E. Love, Ph.D. ASA Course Atlanta Georgia https://goo.
 Goal of a Formal Sensitivity Analysis To replace a general qualitative statement that applies in all observational studies the association we observe between treatment and outcome does not imply causation
Regression CHAPTER SIXTEEN NOTE TO INSTRUCTORS OUTLINE OF RESOURCES
 CHAPTER SIXTEEN Regression NOTE TO INSTRUCTORS This chapter includes a number of complex concepts that may seem intimidating to students. Encourage students to focus on the big picture through some of
Problem #1 Neurological signs and symptoms of ciguatera poisoning as the start of treatment and 2.5 hours after treatment with mannitol.
 Ho (null hypothesis) Ha (alternative hypothesis) Problem #1 Neurological signs and symptoms of ciguatera poisoning as the start of treatment and 2.5 hours after treatment with mannitol. Hypothesis: Ho:
A response variable is a variable that. An explanatory variable is a variable that.
 Name:!!!! Date: Scatterplots The most common way to display the relation between two quantitative variable is a scatterplot. Statistical studies often try to show through scatterplots, that changing one
Testing for. Prostate Cancer
 Testing for Prostate Cancer Who this booklet is for: This booklet is to help men who do not have any symptoms decide if they want to be tested. Prostate cancer affects many men. There are tests to find
t-test for r Copyright 2000 Tom Malloy. All rights reserved
 t-test for r Copyright 2000 Tom Malloy. All rights reserved This is the text of the in-class lecture which accompanied the Authorware visual graphics on this topic. You may print this text out and use
UNDERSTANDING MEMORY
 Communication Chain UNDERSTANDING MEMORY HEARING EXPRESSION thoughts/ ideas ATTENTION select words to use speech production FEEDBACK Hello, how are you? Communication Chain The Communication Chain picture
Introduction to Multilevel Models for Longitudinal and Repeated Measures Data
 Introduction to Multilevel Models for Longitudinal and Repeated Measures Data Today s Class: Features of longitudinal data Features of longitudinal models What can MLM do for you? What to expect in this
SPSS output for 420 midterm study
 Ψ Psy Midterm Part In lab (5 points total) Your professor decides that he wants to find out how much impact amount of study time has on the first midterm. He randomly assigns students to study for hours,
Psychology Research Process
 Psychology Research Process Logical Processes Induction Observation/Association/Using Correlation Trying to assess, through observation of a large group/sample, what is associated with what? Examples:
How to Work with the Patterns That Sustain Depression
 How to Work with the Patterns That Sustain Depression Module 2.1 - Transcript - pg. 1 How to Work with the Patterns That Sustain Depression How to Break the Depression-Rigidity Loop with Lynn Lyons, LICSW;
THE STATSWHISPERER. Introduction to this Issue. Binary Logistic Regression: The Rock Star of Regression
 Spri ng 2 01 3, V o l u m e 3, I s su e 1 + THE STATSWHISPERER The StatsWhisperer Newsletter is published by Dr. William Bannon and the staff at StatsWhisperer. For other resources in learning statistics
IAPT: Regression. Regression analyses
 Regression analyses IAPT: Regression Regression is the rather strange name given to a set of methods for predicting one variable from another. The data shown in Table 1 and come from a student project
Probability, Statistics, Error Analysis and Risk Assessment. 30-Oct-2014 PHYS 192 Lecture 8 1
 Probability, Statistics, Error Analysis and Risk Assessment 30-Oct-2014 PHYS 192 Lecture 8 1 An example online poll Rate my professor link What can we learn from this poll? 30-Oct-2014 PHYS 192 Lecture
One-Way Independent ANOVA
 One-Way Independent ANOVA Analysis of Variance (ANOVA) is a common and robust statistical test that you can use to compare the mean scores collected from different conditions or groups in an experiment.
Two-sample Categorical data: Measuring association
 Two-sample Categorical data: Measuring association Patrick Breheny October 27 Patrick Breheny University of Iowa Biostatistical Methods I (BIOS 5710) 1 / 40 Introduction Study designs leading to contingency
Observer OPTION 5 Manual
 Observer OPTION 5 Manual Measuring shared decision making by assessing recordings or transcripts of encounters from clinical settings. Glyn Elwyn, Stuart W Grande, Paul Barr The Dartmouth Institute for
This is lesson 12 Self-Administration.
 Welcome to the Pennsylvania Department of Public Welfare (DPW), Office of Developmental Programs (ODP) Medication Administration Course for life sharers. This course was developed by the ODP Office of
Section 4 - Dealing with Anxious Thinking
 Section 4 - Dealing with Anxious Thinking How do we challenge our unhelpful thoughts? Anxiety may decrease if we closely examine how realistic and true our unhelpful/negative thoughts are. We may find
Chapter 12: Analysis of covariance, ANCOVA
 Chapter 12: Analysis of covariance, ANCOVA Smart Alex s Solutions Task 1 A few years back I was stalked. You d think they could have found someone a bit more interesting to stalk, but apparently times
Subliminal Programming
 Subliminal Programming Directions for Use Common Questions Background Information Session Overview These sessions are a highly advanced blend of several mind development technologies. Your mind will be
Moments of Joy: It s What YOU Choose to Do as a Caregiver. Teepa Snow
 Moments of Joy: It s What YOU Choose to Do as a Caregiver Teepa Snow Laughing VS Surviving My goal for you Understanding of what s happening with the person with dementia Support so you can survive Insight
Patrick Breheny. January 28
 Confidence intervals Patrick Breheny January 28 Patrick Breheny Introduction to Biostatistics (171:161) 1/19 Recap Introduction In our last lecture, we discussed at some length the Public Health Service
AP Statistics Practice Test Ch. 3 and Previous
 AP Statistics Practice Test Ch. 3 and Previous Name Date Use the following to answer questions 1 and 2: A researcher measures the height (in feet) and volume of usable lumber (in cubic feet) of 32 cherry
Correlation and regression
 PG Dip in High Intensity Psychological Interventions Correlation and regression Martin Bland Professor of Health Statistics University of York http://martinbland.co.uk/ Correlation Example: Muscle strength
Preliminary Report on Simple Statistical Tests (t-tests and bivariate correlations)
") Preliminary Report on Simple Statistical Tests (t-tests and bivariate correlations) After receiving my comments on the preliminary reports of your datasets, the next step for the groups is to complete
Preliminary Report on Simple Statistical Tests (t-tests and bivariate correlations) After receiving my comments on the preliminary reports of your datasets, the next step for the groups is to complete
1 Simple and Multiple Linear Regression Assumptions
 1 Simple and Multiple Linear Regression Assumptions The assumptions for simple are in fact special cases of the assumptions for multiple: Check: 1. What is external validity? Which assumption is critical
Chapter 7: Correlation
 Chapter 7: Correlation Smart Alex s Solutions Task 1 A student was interested in whether there was a positive relationship between the time spent doing an essay and the mark received. He got 45 of his
Dan Byrd UC Office of the President
 Dan Byrd UC Office of the President 1. OLS regression assumes that residuals (observed value- predicted value) are normally distributed and that each observation is independent from others and that the
Why Is Mommy Like She Is?
 Why Is Mommy Like She Is? A Book For Kids About PTSD Deployment Edition Patience H. C. Mason Patience Press High Springs, Florida PP Patience Press 2010 by Patience Mason All rights reserved. No part of
SCAF Workshop Project Cost Control
 The following presentation was given at: SCAF Workshop Project Cost Control Tuesday 2nd February 2016 The Royal Institution of Naval Architects, London Released for distribution by the Author www.scaf.org.uk/library
Measuring association in contingency tables
 Measuring association in contingency tables Patrick Breheny April 3 Patrick Breheny University of Iowa Introduction to Biostatistics (BIOS 4120) 1 / 28 Hypothesis tests and confidence intervals Fisher
You Can Treat OCD. Treatment of OCD. ReidWilson, PhD. NoiseInYourHead.com 1. Objectives. BriefTherapy Conference December 9, 2018.
 BriefTherapy Conference December 9, 2018 You Can Treat OCD ReidWilson, PhD Chapel Hill, NC, USA drwilson@anxieties.com www.anxieties.com NoiseInYourHead.com 1 Objectives 1. Defend the importance of altering
(2) In each graph above, calculate the velocity in feet per second that is represented.
 In each graph above, calculate the velocity in feet per second that is represented.") Calculus Week 1 CHALLENGE 1-Velocity Exercise 1: Examine the two graphs below and answer the questions. Suppose each graph represents the position of Abby, our art teacher. (1) For both graphs above, come
Calculus Week 1 CHALLENGE 1-Velocity Exercise 1: Examine the two graphs below and answer the questions. Suppose each graph represents the position of Abby, our art teacher. (1) For both graphs above, come
Step 2 Challenging negative thoughts "Weeding"
 Managing Automatic Negative Thoughts (ANTs) Step 1 Identifying negative thoughts "ANTs" Step 2 Challenging negative thoughts "Weeding" Step 3 Planting positive thoughts 'Potting" Step1 Identifying Your
MS&E 226: Small Data
 MS&E 226: Small Data Lecture 10: Introduction to inference (v2) Ramesh Johari ramesh.johari@stanford.edu 1 / 17 What is inference? 2 / 17 Where did our data come from? Recall our sample is: Y, the vector
Describe what is meant by a placebo Contrast the double-blind procedure with the single-blind procedure Review the structure for organizing a memo
 Business Statistics The following was provided by Dr. Suzanne Delaney, and is a comprehensive review of Business Statistics. The workshop instructor will provide relevant examples during the Skills Assessment
Discover Simple Neuroscience Body Hacks that Easily Increase Personal Performance, Accelerate Physical Results and Relieve Pain
 Discover Simple Neuroscience Body Hacks that Easily Increase Personal Performance, Accelerate Physical Results and Relieve Pain Welcome to the Z-Health Neuroscience Body Hacks Webinar! Because our webinar
Chapter 9: Comparing two means
 Chapter 9: Comparing two means Smart Alex s Solutions Task 1 Is arachnophobia (fear of spiders) specific to real spiders or will pictures of spiders evoke similar levels of anxiety? Twelve arachnophobes
Centering Predictors
 Centering Predictors Longitudinal Data Analysis Workshop Section 3 University of Georgia: Institute for Interdisciplinary Research in Education and Human Development Section 3: Centering Covered this Section
Problem 1) Match the terms to their definitions. Every term is used exactly once. (In the real midterm, there are fewer terms).
 Match the terms to their definitions. Every term is used exactly once. (In the real midterm, there are fewer terms).") Problem 1) Match the terms to their definitions. Every term is used exactly once. (In the real midterm, there are fewer terms). 1. Bayesian Information Criterion 2. Cross-Validation 3. Robust 4. Imputation
Problem 1) Match the terms to their definitions. Every term is used exactly once. (In the real midterm, there are fewer terms). 1. Bayesian Information Criterion 2. Cross-Validation 3. Robust 4. Imputation
Talking about Mental Health A Narrative Approach Marla Lipscomb, MSW, LCSW Saint Alphonsus CARE Maternal Child Health Program Boise, Idaho
 Background Talking about Mental Health A Narrative Approach Marla Lipscomb, MSW, LCSW Saint Alphonsus CARE Maternal Child Health Program Boise, Idaho Refugee populations have experienced extensive, compound
IF YOU RE SICK OF: YOU RE READY TO QUIT! Hint: Quitting chewing tobacco and snuff is a lot like
 IF YOU RE SICK OF: Coughing all the time Spending your money on cigarettes Smelling like an ashtray People hassling you about smoking Hurting your health Cigarettes screwing up your life... YOU RE READY
Look to see if they can focus on compassionate attention, compassionate thinking and compassionate behaviour. This is how the person brings their
 Compassionate Letter Writing Therapist Notes The idea behind compassionate mind letter writing is to help people engage with their problems with a focus on understanding and warmth. We want to try to bring
9 INSTRUCTOR GUIDELINES
 STAGE: Ready to Quit You are a clinician in a family practice group and are seeing 16-yearold Nicole Green, one of your existing patients. She has asthma and has come to the office today for her yearly
appstats26.notebook April 17, 2015
 Chapter 26 Comparing Counts Objective: Students will interpret chi square as a test of goodness of fit, homogeneity, and independence. Goodness of Fit A test of whether the distribution of counts in one
Midterm STAT-UB.0003 Regression and Forecasting Models. I will not lie, cheat or steal to gain an academic advantage, or tolerate those who do.
 Midterm STAT-UB.0003 Regression and Forecasting Models The exam is closed book and notes, with the following exception: you are allowed to bring one letter-sized page of notes into the exam (front and
GENETIC DRIFT & EFFECTIVE POPULATION SIZE
 Instructor: Dr. Martha B. Reiskind AEC 450/550: Conservation Genetics Spring 2018 Lecture Notes for Lectures 3a & b: In the past students have expressed concern about the inbreeding coefficient, so please
How to CRITICALLY APPRAISE
 How to CRITICALLY APPRAISE an RCT in 10 minutes James McCormack BSc(Pharm), Pharm D Professor Faculty of Pharmaceutical Sciences, UBC Vancouver, BC, Canada medicationmythbusters.com CRITICAL APPRAISAL
FINDING THE RIGHT WORDS IN ADVANCED AND METASTATIC BREAST CANCER (ABC/MBC)
") FINDING THE RIGHT WORDS IN ADVANCED AND METASTATIC BREAST CANCER (ABC/MBC) Real people. Real communication. Making a real difference. 000989_NOV19_Breast_Cancer_Language_Guide_HCPs_V4_CL.indd 1 What do
FINDING THE RIGHT WORDS IN ADVANCED AND METASTATIC BREAST CANCER (ABC/MBC) Real people. Real communication. Making a real difference. 000989_NOV19_Breast_Cancer_Language_Guide_HCPs_V4_CL.indd 1 What do
Why we get hungry: Module 1, Part 1: Full report
 Why we get hungry: Module 1, Part 1: Full report Print PDF Does Anyone Understand Hunger? Hunger is not simply a signal that your stomach is out of food. It s not simply a time when your body can switch
Next Level Practitioner
 Next Level Practitioner - Fear Week 115, Day 4 - Dan Siegel, MD - Transcript - pg. 1 Next Level Practitioner Week 115: Fear in the Brain and Body Day 4: How to Work with Fear That Feels Irrational with
Complex Regression Models with Coded, Centered & Quadratic Terms
 Complex Regression Models with Coded, Centered & Quadratic Terms We decided to continue our study of the relationships among amount and difficulty of exam practice with exam performance in the first graduate
Living My Best Life. Today, after more than 30 years of struggling just to survive, Lynn is in a very different space.
 Living My Best Life Lynn Allen-Johnson s world turned upside down when she was 16. That s when her father and best friend died of Hodgkin s disease leaving behind her mom and six kids. Lynn s family was
Setting up a Mental Health Support Group
 Setting up a Mental Health Support Group Colleague Toolkit Practical help from the Co-op Here at the Co-op we recognise that we all have a role to play in supporting each other s wellbeing. This toolkit