Assignment D: Stock and flow diagramming with System Dynamics (SD) Nikki Doorhof ( )
|
|
|
- Cory Hardy
- 5 years ago
- Views:
Transcription
1 Assignment D: Stock and flow diagramming with System Dynamics (SD) Nikki Doorhof ( ) Introduction The goal of system dynamics is to explain behaviour by providing a causal theory (Lane, 2008). This theory will then be used as the basis to change the system structure and the resulting behaviour and improve performance. System dynamics is created by Jay W. Forrester at MIT in the late 1950s. There are two main diagramming techniques that are used in system dynamics: causal loop diagrams (CLDs) and stock/flow diagrams (SFDs). In this paper I will provide a description and examples of the latter technique, based on the article of Lane (2008) about system dynamics. The procedure of developing a model with system dynamics starts with a problem. In most cases people have established a set of causal assumptions about the problem. They have already developed a mental model of the dynamic system (MMODS). The main purpose of diagrams is to develop a presentation of the mental model in order to communicate the underlying assumptions. This way they can be discussed and possibly changed in order to improve performance of the system. This communication can have two different forms. The diagram can be used to represent an existing model in order to explain its behaviour, which is called model exposition. In the other case, the diagram is used for model conceptualization. The diagram serves as a tool to understand the problem and its underlying assumptions and eventually develop a simulation model. Figure 1. Illustration of the bathtub analogy (Lane,2008) As described by Lane (2008) there are three types of variables and two types of causal links in system dynamics. The bathtub analogy can be used to explain the elements in a system dynamics model (see figure 1). The first variable type is the state variable, or stocks in the case of a stock/flow diagram. In the model (figure 2) represented by rectangles. The quantity of this variable can only be affected by the flow variable, valve or regulator symbol in the model. This variable represents the value that is added or subtracted from the state variable. In the example of the bathtub, the water flow adds value to the water volume. The third type is the ordinary variable (indicated in the model by a circle), which does not directly influence the state variables. The link between the stock and flow is called the conserved flow, in the model indicated by a double or thick arrow. The other causal link is the information link, which passes information back to the flow
2 variable about the level of the stock variable. Feedback about the water volume can influence the tap angle and thereby influences the water flow. An important part of the model is the polarity of the causal links: this link can be a positive effect (+ or s) or a negative effect (- or o). Figure 2. Stock/flow diagram of the bathtub analogy (Lane, 2008) Example Stock/flow diagramming can be used on a wide variation of topics. It is used in science but also in psychology and environmental sustainability, which I will discuss at the section Related literature. As an example I would like to use a SFD of the rabbit and lynx population (Bosque & Salvador, 2010), which is shown in figure 3. The lynx is the predator and the rabbit is the prey. This makes that the first underlying assumption is that the crowding of the rabbits influences the food supply of the lynx. As the number of rabbits decreases the food supply of the lynx also decreases. This relation is indicated by number 1 in the model. Further the model communicates that the rabbit population is depended on two conserved flows, the birth rate of rabbits (which increases the stock) and the death rate of rabbits (which decreases the stock). The birth rate is affected by the value of the rabbit population and also the rabbit birth fraction is taken into account. There are two explanations for the increase the death rate of rabbits: starvation and diseases. Both are caused by the growth of the rabbit population, which naturally increases the number of rabbits with diseases and lowers the food supply which leads to starvation. The population of the lynx is highly dependent on the population of the rabbit. The death rate of the lynx is motivated by the starvation of the lynx, caused by a declining food supply. Both the death rate of the lynx and the rabbit are naturally influenced by their life expectancy.
3 1 Figure 3. Stock/flow diagram of the rabbit and lynx population
4 PDD
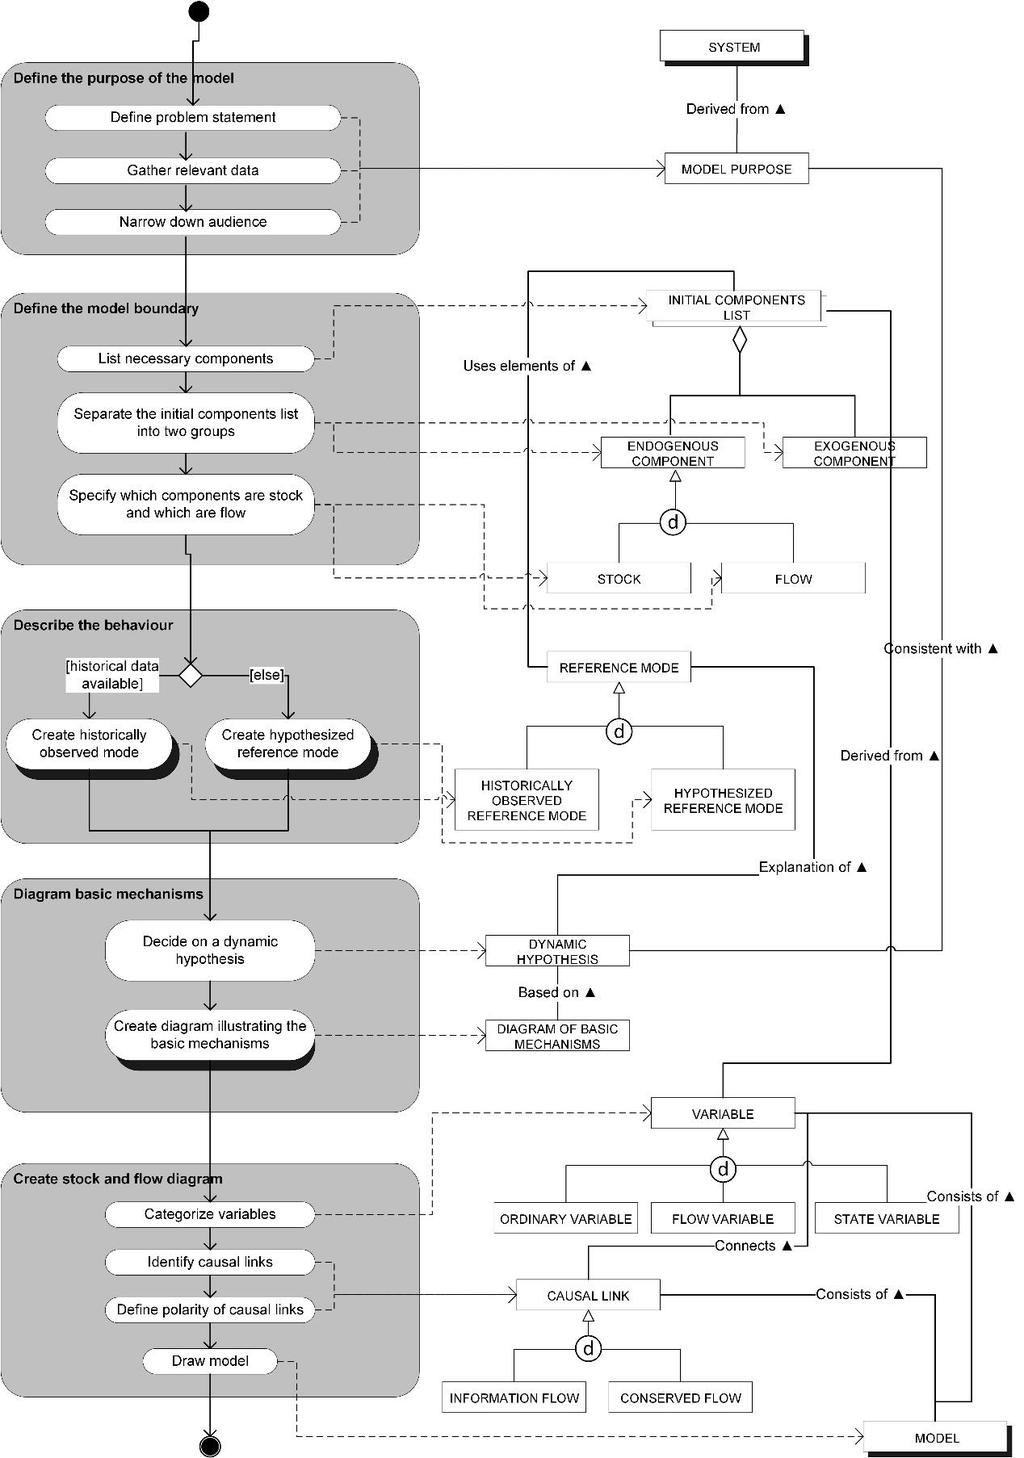
5 Activity table Activity Sub-Activity Description Define the purpose of the model Define the model boundary Describe the behaviour Diagram basic mechanisms Create stock and flow diagram Define problem statement Gather relevant data Narrow down audience List necessary components Separate the initial components into two groups Specify which components are stock and which are flow Create historically observed mode Create hypothesized reference mode Decide on a dynamic hypothesis Create diagram illustrating the basic mechanisms Categorize variables Identify causal links Define the underlying problem of the SYSTEM that creates a need for additional knowledge and understanding of the system. The modeller must gather data relevant to the problem statement. The MODEL s structure and behaviour should be understandable for the audience. Create the INITIAL COMPONENTS LIST. Divide the INITIAL COMPONENTS LIST in two lists. One containing the ENDOGENOUS COMPONENTS and the other containing the EXOGENOUS COMPONENTS. Divide the ENDOGENOUS COMPONENTS into STOCKS and FLOWS. The models constructs such a REFERENCE MODE to check for the existence of some phenomenon or behaviour worth modelling. This sub-task results in a HISTORICALLY OBSERVED REFERENCE MODE. The models constructs such a REFERENCE MODE to check for the existence of some phenomenon or behaviour worth modelling. This sub-task results in a HYPOTHESIZED REFENCE MODE. It is used to draw out and test the consequences of the feedback loops and results in a DYNAMIC HYPOTHESIS. Creating a DIAGRAM OF BASIC MECHANISMS is used to better understand feedback loops of the system. The VARIABLES derived from the INTITIAL COMPONENT LIST should be categorized. There are three types of VARIABLES. The CAUSAL LINKS should be divided into two types.
6 Define polarity of causal links Draw model The polarity of a CAUSAL LINK defines if the link has a positive effect (+) or a negative effect (-). The modeller constructs the model which consists of the VARIABLES and the CAUSAL LINKS between them. Concept table Concept SYSTEM MODEL PURPOSE INITIAL COMPONENTS LIST ENDOGENOUS COMPONENT EXOGENOUS COMPONENT STOCK FLOW REFERENCE MODE HISTORICALLY OBSERVED REFERENCE MODE HYPOTHESIZED REFERENCE MODE DYNAMIC HYPOTHESIS DIAGRAM OF BASIC MECHANISMS Description A system of forces that have created a problem continue to sustain it. A definition of the underlying problem in a SYSTEM, the MODEL s primary audience and the gathered relevant data. All components the modeller sees as necessary for creating a MODEL of the SYSTEM. Dynamic variables involved in the feedback loops of the SYSTEM. Components whose values are not directly affected by the SYSTEM. These will usually be constants or time varying constants, and not stock or flows. A value that can be visualized and measured (e.g. population), or an abstract idea (e.g. reputation). Changed in STOCKS, defined as rates and measured in units of STOCK over time (e.g. birth rate). A plot of the behaviour of key variables (components of the INITIAL COMPONENTS LIST) of a system over time. The graph has time on the horizontal axis and units of the variables on the vertical axis. It roughly simulates the mental model of the SYSTEM. This type of REFERENCE MODE is used when there is historical data available. It is used to generate knowledge about possible causes or solutions to the SYSTEM s problem. When there is no historical data available, the modeller must create a hypothesized reference mode. It consists of a simplified curve, typically drawn by hand, capturing the key features of the behaviour pattern of the important system components. An explanation of the REFERENCE MODE behaviour and should be consistent with the MODEL PURPOSE. The basic mechanisms represent the smallest set of realistic cause-andeffect relations capable of generating the REFERENCE MODE, i.e. the feedback loops in the MODEL.
7 VARIABLE STATE VARIABLE FLOW VARIABLE ORDINARY VARIABLE CAUSAL LINK CONSERVED FLOW INFORMATION FLOW MODEL There are three types of variables. This type of VARIABLE is only changed by the accumulation into them, or draining out of them, of some quantity. This type of VARIABLE is the quantity of the accumulating or draining process that effects the STATE VARIABLES. This type of VARIABLE does not directly influence the STATE VARIABLES. There are two types of causal links between VARIABLES. The type of CAUSAL LINK between a FLOW VARIABLE and a STATE VARIABLE The type of CAUSAL LINK between ORDINARY VARIABLES and FLOW VARIABLES. The final stock and flow diagram. Related literature System Dynamics can be used for quantitative modelling as well as qualitative modelling (Wolstenholme, 1999). Quantitative modelling was originally used as a computer simulation method to represent the structure of a system. Later on it was used in a qualitative way as a thinking tool in problem solving, with the aim to provide insight into the issue rather than quantify it. Wolstenholme (1999) concludes his paper with the statement that qualitative and quantitative can be blended as they both have important contributions to management thinking. Coyle (2000) reviews the debate between quantitative and qualitative modelling. He discusses the problems of quantification. One problem is the relation of the model to the real problem, which is sometimes insufficient in quantitative models. In these cases qualitative modelling (for example causal-loop diagrams) can be more effective. But in paper by Richardson from 1976 (edited and published by John Sterman in 1986), the problems of these qualitative modelling technique are discussed. These problems arise from the fact that these models are simplified models and make no distinction between information links and conserved flows. The technique of stock/flow diagramming can be used in a wide range of topics. It is often used when creating models about environmental issues. I have selected a couple papers that serve as an example. System Dynamics modelling is used to forecast municipal solid waste generation in a fastgrowing urban region (Dyson & Change, 2005). They used a case study to research the impact and used a simulation tool, Stella, to generate multiple models. The modelling results are used to plan the capacity and locations of material recovery facilities needed to process the generated solid waste. System dynamics is also used to create a model to analyse a hospital waste management system in a developing country (Chaerul et al., 2008). This research also used a case study and the Stella software package, and came to the same conclusion that system of waste production should be adjusted. In some cases models are used to increase public understanding of an (environmental) issue. In a study by Stave (2001) the purpose of the model was to make people aware of the importance of water conservation management in Las Vegas. The developed model effectively showed this and contributed to the understanding of management decision making in this field. In
8 the paper about environmental sustainability in an agriculture (Saysel et al., 2002) a model is developed and extensively analysed, which has led to improvements in the agricultural policies. References Albin, S., Forrester, J. W., & Breierova, L. (2001). Building a System Dynamics Model: Part 1: Conceptualization. MIT. Bosque, M. D. & N. R. Salvador (2010) Rabbits and Lynx in Northern Canada. Retrieved from Chaerul, M., Tanaka, M., & Shekdar, A. V. (2008). A system dynamics approach for hospital waste management. Waste Management, 28(2), Coyle, G. (2000). Qualitative and quantitative modelling in system dynamics: some research questions. System Dynamics Review, 16(3), 225. Dyson, B., & Chang, N. B. (2005). Forecasting municipal solid waste generation in a fast-growing urban region with system dynamics modeling.waste management, 25(7), Kainz, D., & Ossimitz, G. (2002). Can students learn stock-flow-thinking? An empirical investigation. In Proceedings of the 20th international conference of the system dynamics society. Lane, D. C. (2000). Diagramming conventions in system dynamics. The Journal of the Operational Research Society, 51(2), Lane, D. C. (2008). The emergence and use of diagramming in system dynamics: a critical account. Systems Research and Behavioral Science,25(1), Richardson, G. P. (1986). Problems with causal loop diagrams. System dynamics review, 2(2), Saysel, A. K., Barlas, Y., & Yenigün, O. (2002). Environmental sustainability in an agricultural development project: a system dynamics approach. Journal of Environmental Management, 64(3), Stave, K. A. (2003). A system dynamics model to facilitate public understanding of water management options in Las Vegas, Nevada. Journal of Environmental Management, 67(4), Wolstenholme, E. F. (1999). Qualitative vs quantitative modelling: the evolving balance. Journal of the Operational Research Society,
Stocks & Flows 2: First Order Delays & Aging Chains
 Stocks & Flows 2: First Order Delays & Aging Chains Nathaniel Osgood CMPT 858 FEBRUARY 1, 2011 Example Model: Stocks Example Model: Flows Key Component: Stock & Flow Flow + Stock Flow Stock Structure &
Introduction to Stocks & Flows
 Introduction to Stocks & Flows Nathaniel Osgood (osgood@cs.usask.ca) CMPT 858 State of the System: Stocks ( Levels, State Variables, Compartments ) Stocks (Levels) represent accumulations These capture
Causal Loop Diagrams
 Causal Loop Diagrams A causal loop diagram (CLD) is a qualitative method for visualizing how different variables in a system are interrelated and how they influence each other to create system dynamics.
Causal Modeling of the Glucose-Insulin System in Type-I Diabetic Patients J. Fernandez, N. Aguilar, R. Fernandez de Canete, J. C.
 Causal Modeling of the Glucose-Insulin System in Type-I Diabetic Patients J. Fernandez, N. Aguilar, R. Fernandez de Canete, J. C. Ramos-Diaz Abstract In this paper, a simulation model of the glucoseinsulin
DENGUE OUTBREAK: A SYSTEM DYNAMICS APPROACH
 Journal of Technology Management and Business (ISSN: 89-74) Vol 5, No, Special Edition, 8 DENGUE OUTBREAK: A SYSTEM DYNAMICS APPROACH Amira Natasha Subyan, Nur Fatin Afifi Abdul Jabar, Che Rohayu Darlynie
Content Scope & Sequence
 Content Scope & Sequence GRADE 2 scottforesman.com (800) 552-2259 Copyright Pearson Education, Inc. 0606443 1 Counting, Coins, and Combinations Counting, Coins, and Combinations (Addition, Subtraction,
Write your identification number on each paper and cover sheet (the number stated in the upper right hand corner on your exam cover).
.") STOCKHOLM UNIVERSITY Department of Economics Course name: Empirical methods 2 Course code: EC2402 Examiner: Per Pettersson-Lidbom Number of credits: 7,5 credits Date of exam: Sunday 21 February 2010 Examination
STOCKHOLM UNIVERSITY Department of Economics Course name: Empirical methods 2 Course code: EC2402 Examiner: Per Pettersson-Lidbom Number of credits: 7,5 credits Date of exam: Sunday 21 February 2010 Examination
Systems Thinking Rubrics
 Systems Thinking Rubrics Systems Thinking Beginner (designed for instructor use), pages 1-2 These rubrics were designed for use with primary students and/or students who are just beginning to learn systems
Group Assignment #1: Concept Explication. For each concept, ask and answer the questions before your literature search.
 Group Assignment #1: Concept Explication 1. Preliminary identification of the concept. Identify and name each concept your group is interested in examining. Questions to asked and answered: Is each concept
Insight Assessment Measuring Thinking Worldwide
 California Critical Thinking Skills Test (CCTST). The CCTST measures the reasoning skills human beings use in the process of reflectively deciding what to believe or what to do. Skill/Attribute Name SE
Chapter 1: Explaining Behavior
 Chapter 1: Explaining Behavior GOAL OF SCIENCE is to generate explanations for various puzzling natural phenomenon. - Generate general laws of behavior (psychology) RESEARCH: principle method for acquiring
The Research Roadmap Checklist
 1/5 The Research Roadmap Checklist Version: December 1, 2007 All enquires to bwhitworth@acm.org This checklist is at http://brianwhitworth.com/researchchecklist.pdf The element details are explained at
Carrying out an Empirical Project
 Carrying out an Empirical Project Empirical Analysis & Style Hint Special program: Pre-training 1 Carrying out an Empirical Project 1. Posing a Question 2. Literature Review 3. Data Collection 4. Econometric
The Regression-Discontinuity Design
 Page 1 of 10 Home» Design» Quasi-Experimental Design» The Regression-Discontinuity Design The regression-discontinuity design. What a terrible name! In everyday language both parts of the term have connotations
WDHS Curriculum Map Probability and Statistics. What is Statistics and how does it relate to you?
 WDHS Curriculum Map Probability and Statistics Time Interval/ Unit 1: Introduction to Statistics 1.1-1.3 2 weeks S-IC-1: Understand statistics as a process for making inferences about population parameters
Research Methodology in Social Sciences. by Dr. Rina Astini
 Research Methodology in Social Sciences by Dr. Rina Astini Email : rina_astini@mercubuana.ac.id What is Research? Re ---------------- Search Re means (once more, afresh, anew) or (back; with return to
A DYNAMIC MODEL OF COCAINE PREVALENCE
 A DYNAMIC MODEL OF COCAINE PREVALENCE Jack B. Homer Homer Consulting, New Jersey, USA Keywords: Cocaine, marijuana Contents 1. Background 2. Data Sources and Trends 1976 1990 3. Model Structure and Parameters
Key Ideas. Explain how science is different from other forms of human endeavor. Identify the steps that make up scientific methods.
 Key Ideas Explain how science is different from other forms of human endeavor. Identify the steps that make up scientific methods. Analyze how scientific thought changes as new information is collected.
PLANNING THE RESEARCH PROJECT
 Van Der Velde / Guide to Business Research Methods First Proof 6.11.2003 4:53pm page 1 Part I PLANNING THE RESEARCH PROJECT Van Der Velde / Guide to Business Research Methods First Proof 6.11.2003 4:53pm
Acceptance and Usage of Innovative Healthcare Service for the Elderly People: A System Dynamics Modeling Approach
 2012 2 nd International Conference on Economics, Trade and Development IPEDR vol.36 (2012) (2012) IACSIT Press, Singapore Acceptance and Usage of Innovative Healthcare Service for the Elderly People: A
Investigations in Number, Data, and Space, Grade 4, 2nd Edition 2008 Correlated to: Washington Mathematics Standards for Grade 4
 Grade 4 Investigations in Number, Data, and Space, Grade 4, 2nd Edition 2008 4.1. Core Content: Multi-digit multiplication (Numbers, Operations, Algebra) 4.1.A Quickly recall multiplication facts through
Teaching STEM with Systems Tools. Christopher DiCarlo, Rachel Henry, Katharine Hinkle, Ashley Young
 Teaching STEM with Systems Tools Christopher DiCarlo, Rachel Henry, Katharine Hinkle, Ashley Young Overview Introductions Project Presentations Coastal Erosion-Habits of a Systems Thinker Body Systems
Framework for Comparative Research on Relational Information Displays
 Framework for Comparative Research on Relational Information Displays Sung Park and Richard Catrambone 2 School of Psychology & Graphics, Visualization, and Usability Center (GVU) Georgia Institute of
STP226 Brief Class Notes Instructor: Ela Jackiewicz
 CHAPTER 2 Organizing Data Statistics=science of analyzing data. Information collected (data) is gathered in terms of variables (characteristics of a subject that can be assigned a numerical value or nonnumerical
Chapter 4: Scatterplots and Correlation
 Chapter 4: Scatterplots and Correlation http://www.yorku.ca/nuri/econ2500/bps6e/ch4-links.pdf Correlation text exr 4.10 pg 108 Ch4-image Ch4 exercises: 4.1, 4.29, 4.39 Most interesting statistical data
Prediction--the Quintessential Policy Model Validation Test. Wayne Wakeland Systems Science Seminar Presenation 10/9/15
 Prediction--the Quintessential Policy Model Validation Test Wayne Wakeland Systems Science Seminar Presenation 10/9/15 1 Assertion Models must, of course, be well suited to their intended application Thus,
Feedback Mechanisms and Self-Regulatory Processes in the Social Sciences
 Feedback Mechanisms and Self-Regulatory Processes in the Social Sciences Beginning in the 1940s, the engineer s concept of feedback entered the social sciences. The essence of the concept is a circle of
Scientific Method. Earth Systems
 Scientific Method Earth Systems What is Science? Scienceis a method for studying the natural world. Scientists use a specific process to investigate their observations. This process is called the scientific
The Epidemic Model 1. Problem 1a: The Basic Model
 The Epidemic Model 1 A set of lessons called "Plagues and People," designed by John Heinbokel, scientist, and Jeff Potash, historian, both at The Center for System Dynamics at the Vermont Commons School,
Medical Statistics 1. Basic Concepts Farhad Pishgar. Defining the data. Alive after 6 months?
 Medical Statistics 1 Basic Concepts Farhad Pishgar Defining the data Population and samples Except when a full census is taken, we collect data on a sample from a much larger group called the population.
Unit 4 Structure, Function and Information Processing
 Use argument based on empirical evidence and scientific reasoning to support an explanation for how characteristic animal behaviors and specialized plant structures affect the probability of successful
Data and Statistics 101: Key Concepts in the Collection, Analysis, and Application of Child Welfare Data
 TECHNICAL REPORT Data and Statistics 101: Key Concepts in the Collection, Analysis, and Application of Child Welfare Data CONTENTS Executive Summary...1 Introduction...2 Overview of Data Analysis Concepts...2
Using System-Dynamics-Based simulations for HIV/AIDs Prevalence in Thailand
 Using System-Dynamics-Based simulations for HIV/AIDs Prevalence in Thailand Abstract The main objective of this paper is to present the system dynamics simulation for /HIVAIDs prevalence in Thailand. The
Year Area Grade 1/2 Grade 3/4 Grade 5/6 Grade 7+ K&U Recognises basic features of. Uses simple models to explain objects, living things or events.
 Assessment Criteria: Science Year 7 (page 1 of 2) K&U Recognises basic features of Uses simple models to explain objects, living things or events. scientific ideas. Makes a comment about scientific Represents
PSYCHOLOGY 300B (A01) One-sample t test. n = d = ρ 1 ρ 0 δ = d (n 1) d
 One-sample t test. n = d = ρ 1 ρ 0 δ = d (n 1) d") PSYCHOLOGY 300B (A01) Assignment 3 January 4, 019 σ M = σ N z = M µ σ M d = M 1 M s p d = µ 1 µ 0 σ M = µ +σ M (z) Independent-samples t test One-sample t test n = δ δ = d n d d = µ 1 µ σ δ = d n n = δ
PSYCHOLOGY 300B (A01) Assignment 3 January 4, 019 σ M = σ N z = M µ σ M d = M 1 M s p d = µ 1 µ 0 σ M = µ +σ M (z) Independent-samples t test One-sample t test n = δ δ = d n d d = µ 1 µ σ δ = d n n = δ
Models of Information Retrieval
 Models of Information Retrieval Introduction By information behaviour is meant those activities a person may engage in when identifying their own needs for information, searching for such information in
SUPPLEMENTAL MATERIAL
 1 SUPPLEMENTAL MATERIAL Response time and signal detection time distributions SM Fig. 1. Correct response time (thick solid green curve) and error response time densities (dashed red curve), averaged across
Chapter 3 Tools for Practical Theorizing: Theoretical Maps and Ecosystem Maps
 Chapter 3 Tools for Practical Theorizing: Theoretical Maps and Ecosystem Maps Chapter Outline I. Introduction A. Understanding theoretical languages requires universal translators 1. Theoretical maps identify
Business Statistics Probability
 Business Statistics The following was provided by Dr. Suzanne Delaney, and is a comprehensive review of Business Statistics. The workshop instructor will provide relevant examples during the Skills Assessment
Organizing Data. Types of Distributions. Uniform distribution All ranges or categories have nearly the same value a.k.a. rectangular distribution
 Organizing Data Frequency How many of the data are in a category or range Just count up how many there are Notation x = number in one category n = total number in sample (all categories combined) Relative
A Correlation of. to the. Common Core State Standards for Mathematics Grade 2
 A Correlation of 2012 to the Introduction This document demonstrates how in Number, Data, and Space 2012 meets the indicators of the,. Correlation references are to the unit number and are cited at the
Six Sigma Glossary Lean 6 Society
 Six Sigma Glossary Lean 6 Society ABSCISSA ACCEPTANCE REGION ALPHA RISK ALTERNATIVE HYPOTHESIS ASSIGNABLE CAUSE ASSIGNABLE VARIATIONS The horizontal axis of a graph The region of values for which the null
Experimental Psychology
 Title Experimental Psychology Type Individual Document Map Authors Aristea Theodoropoulos, Patricia Sikorski Subject Social Studies Course None Selected Grade(s) 11, 12 Location Roxbury High School Curriculum
Unit 1 Exploring and Understanding Data
 Unit 1 Exploring and Understanding Data Area Principle Bar Chart Boxplot Conditional Distribution Dotplot Empirical Rule Five Number Summary Frequency Distribution Frequency Polygon Histogram Interquartile
Understanding Science Conceptual Framework
 1 Understanding Science Conceptual Framework This list of conceptual understandings regarding the nature and process of science are aligned across grade levels to help instructors identify age-appropriate
Introduction to System Dynamics. Healthcare Systems Engineering Institute Northeastern University, Boston, MA 06/11/2015
 Introduction to System Dynamics Northeastern University, Boston, MA 06/11/201 System Dynamics A modeling and simulation approach to understand the behaviors of complex dynamic systems 2 System Dynamics
7.014 Problem Set 7 Solutions
 MIT Department of Biology 7.014 Introductory Biology, Spring 2005 7.014 Problem Set 7 Solutions Question 1 Part A Antigen binding site Antigen binding site Variable region Light chain Light chain Variable
Principles of Sociology
 Principles of Sociology DEPARTMENT OF ECONOMICS ATHENS UNIVERSITY OF ECONOMICS AND BUSINESS [Academic year 2017/18, FALL SEMESTER] Lecturer: Dimitris Lallas Principles of Sociology 4th Session Sociological
Control Chart Basics PK
 Control Chart Basics Primary Knowledge Unit Participant Guide Description and Estimated Time to Complete Control Charts are one of the primary tools used in Statistical Process Control or SPC. Control
How was your experience working in a group on the Literature Review?
 Journal 10/18 How was your experience working in a group on the Literature Review? What worked? What didn t work? What are the benefits of working in a group? What are the disadvantages of working in a
Research Strategies. What We Will Cover in This Section. Research Purposes. Overview. Research techniques. Literature Reviews. Basic research.
 Research Strategies 9/2/2006 P767 Research Strategies.ppt 1 What We Will Cover in This Section Overview. Research techniques. Literature Reviews. 9/2/2006 P767 Research Strategies.ppt 2 Research Purposes
INTERVIEWS II: THEORIES AND TECHNIQUES 5. CLINICAL APPROACH TO INTERVIEWING PART 1
 INTERVIEWS II: THEORIES AND TECHNIQUES 5. CLINICAL APPROACH TO INTERVIEWING PART 1 5.1 Clinical Interviews: Background Information The clinical interview is a technique pioneered by Jean Piaget, in 1975,
Computer Science 101 Project 2: Predator Prey Model
 Computer Science 101 Project 2: Predator Prey Model Real-life situations usually are complicated and difficult to model exactly because of the large number of variables present in real systems. Computer
2012 Course: The Statistician Brain: the Bayesian Revolution in Cognitive Sciences
 2012 Course: The Statistician Brain: the Bayesian Revolution in Cognitive Sciences Stanislas Dehaene Chair of Experimental Cognitive Psychology Lecture n 5 Bayesian Decision-Making Lecture material translated
Lauren DiBiase, MS, CIC Associate Director Public Health Epidemiologist Hospital Epidemiology UNC Hospitals
 Lauren DiBiase, MS, CIC Associate Director Public Health Epidemiologist Hospital Epidemiology UNC Hospitals Statistics Numbers that describe the health of the population The science used to interpret these
Paper Airplanes & Scientific Methods
 Paper Airplanes & Scientific Methods Scientific Inquiry refers to the many different ways in which scientists investigate the world. Scientific investigations are done to answer questions and solve problems.
Describe what is meant by a placebo Contrast the double-blind procedure with the single-blind procedure Review the structure for organizing a memo
 Business Statistics The following was provided by Dr. Suzanne Delaney, and is a comprehensive review of Business Statistics. The workshop instructor will provide relevant examples during the Skills Assessment
V. Gathering and Exploring Data
 V. Gathering and Exploring Data With the language of probability in our vocabulary, we re now ready to talk about sampling and analyzing data. Data Analysis We can divide statistical methods into roughly
Unit 2, Lesson 5: Teacher s Edition 1. Unit 2: Lesson 5 Understanding Vaccine Safety
 Unit 2, Lesson 5: Teacher s Edition 1 Unit 2: Lesson 5 Understanding Vaccine Safety Lesson Questions: o What are the main issues regarding vaccine safety? o What is the scientific basis for issues regarding
Frequency distributions
 Applied Biostatistics distributions Martin Bland Professor of Health Statistics University of York http://www-users.york.ac.uk/~mb55/ Types of data Qualitative data arise when individuals may fall into
DesCartes (Combined) Subject: Concepts and Processes Goal: Processes of Scientific Inquiry
 Subject: Concepts and Processes Goal: Processes of Scientific Inquiry") DesCartes (Combined) Subject: Concepts and Processes Goal: Processes of Scientific Inquiry Subject: Concepts and Processes Goal Strand: Processes of Scientific Inquiry RIT Score Range: Below 181 Skills
DesCartes (Combined) Subject: Concepts and Processes Goal: Processes of Scientific Inquiry Subject: Concepts and Processes Goal Strand: Processes of Scientific Inquiry RIT Score Range: Below 181 Skills
BOOTSTRAPPING CONFIDENCE LEVELS FOR HYPOTHESES ABOUT QUADRATIC (U-SHAPED) REGRESSION MODELS
 REGRESSION MODELS") BOOTSTRAPPING CONFIDENCE LEVELS FOR HYPOTHESES ABOUT QUADRATIC (U-SHAPED) REGRESSION MODELS 12 June 2012 Michael Wood University of Portsmouth Business School SBS Department, Richmond Building Portland
BOOTSTRAPPING CONFIDENCE LEVELS FOR HYPOTHESES ABOUT QUADRATIC (U-SHAPED) REGRESSION MODELS 12 June 2012 Michael Wood University of Portsmouth Business School SBS Department, Richmond Building Portland
A to Z OF RESEARCH METHODS AND TERMS APPLICABLE WITHIN SOCIAL SCIENCE RESEARCH
 A to Z OF RESEARCH METHODS AND TERMS APPLICABLE WITHIN SOCIAL SCIENCE RESEARCH QUANTATIVE RESEARCH METHODS Are concerned with trying to quantify things; they ask questions such as how long, how many or
MODELLING THE SPREAD OF PNEUMONIA IN THE PHILIPPINES USING SUSCEPTIBLE-INFECTED-RECOVERED (SIR) MODEL WITH DEMOGRAPHIC CHANGES
 MODEL WITH DEMOGRAPHIC CHANGES") MODELLING THE SPREAD OF PNEUMONIA IN THE PHILIPPINES USING SUSCEPTIBLE-INFECTED-RECOVERED (SIR) MODEL WITH DEMOGRAPHIC CHANGES Bill William M. Soliman 1, Aldous Cesar F. Bueno 2 1, 2 Philippine Science
MODELLING THE SPREAD OF PNEUMONIA IN THE PHILIPPINES USING SUSCEPTIBLE-INFECTED-RECOVERED (SIR) MODEL WITH DEMOGRAPHIC CHANGES Bill William M. Soliman 1, Aldous Cesar F. Bueno 2 1, 2 Philippine Science
Some Similarities between the Spread of Infectious Disease and Population Growth 1
 Some Similarities between the Spread of Infectious Disease and Population Growth 1 The Spread of Infectious Disease 1. An infectious disease is any disease caused by germs such as viruses or bacteria.
COMP 516 Research Methods in Computer Science. COMP 516 Research Methods in Computer Science. Research Process Models: Sequential (1)
") COMP 516 Research Methods in Computer Science Dominik Wojtczak Department of Computer Science University of Liverpool COMP 516 Research Methods in Computer Science Lecture 9: Research Process Models Dominik
COMP 516 Research Methods in Computer Science Dominik Wojtczak Department of Computer Science University of Liverpool COMP 516 Research Methods in Computer Science Lecture 9: Research Process Models Dominik
EPSRC Centre for Doctoral Training in Industrially Focused Mathematical Modelling
 EPSRC Centre for Doctoral Training in Industrially Focused Mathematical Modelling Uncertainty Quantification through multilevel Monte Carlo simulation in FEniCS Matteo Croci Contents 1. Introduction...
Still important ideas
 Readings: OpenStax - Chapters 1 13 & Appendix D & E (online) Plous Chapters 17 & 18 - Chapter 17: Social Influences - Chapter 18: Group Judgments and Decisions Still important ideas Contrast the measurement
Goal-Oriented Measurement plus System Dynamics A Hybrid and Evolutionary Approach
 Goal-Oriented Measurement plus System Dynamics A Hybrid and Evolutionary Approach Dietmar Pfahl Fraunhofer Institute IESE pfahl@iese.fhg.de Günther Ruhe University of Calgary ruhe@ucalgary.ca 1. Aim and
Relationships Between the High Impact Indicators and Other Indicators
 Relationships Between the High Impact Indicators and Other Indicators The High Impact Indicators are a list of key skills assessed on the GED test that, if emphasized in instruction, can help instructors
Doing Quantitative Research 26E02900, 6 ECTS Lecture 6: Structural Equations Modeling. Olli-Pekka Kauppila Daria Kautto
 Doing Quantitative Research 26E02900, 6 ECTS Lecture 6: Structural Equations Modeling Olli-Pekka Kauppila Daria Kautto Session VI, September 20 2017 Learning objectives 1. Get familiar with the basic idea
CSC2130: Empirical Research Methods for Software Engineering
 CSC2130: Empirical Research Methods for Software Engineering Steve Easterbrook sme@cs.toronto.edu www.cs.toronto.edu/~sme/csc2130/ 2004-5 Steve Easterbrook. This presentation is available free for non-commercial
Addendum: Multiple Regression Analysis (DRAFT 8/2/07)
") Addendum: Multiple Regression Analysis (DRAFT 8/2/07) When conducting a rapid ethnographic assessment, program staff may: Want to assess the relative degree to which a number of possible predictive variables
Addendum: Multiple Regression Analysis (DRAFT 8/2/07) When conducting a rapid ethnographic assessment, program staff may: Want to assess the relative degree to which a number of possible predictive variables
Put Your Best Figure Forward: Line Graphs and Scattergrams
 56:8 1229 1233 (2010) Clinical Chemistry Put Your Best Figure Forward: Line Graphs and Scattergrams Thomas M. Annesley * There is an old saying that a picture is worth a thousand words. In truth, only
Readings: Textbook readings: OpenStax - Chapters 1 13 (emphasis on Chapter 12) Online readings: Appendix D, E & F
 Online readings: Appendix D, E & F") Readings: Textbook readings: OpenStax - Chapters 1 13 (emphasis on Chapter 12) Online readings: Appendix D, E & F Plous Chapters 17 & 18 Chapter 17: Social Influences Chapter 18: Group Judgments and Decisions
Readings: Textbook readings: OpenStax - Chapters 1 13 (emphasis on Chapter 12) Online readings: Appendix D, E & F Plous Chapters 17 & 18 Chapter 17: Social Influences Chapter 18: Group Judgments and Decisions
Background Information on Simulation Created for
 Background Information on Simulation Created for Lesson 2: Romeo and Juliet: In Rapturous Oscillation? by Jennifer Andersen and Anne LaVigne in collaboration with the Creative Learning Exchange Permission
Reinforcement Learning : Theory and Practice - Programming Assignment 1
 Reinforcement Learning : Theory and Practice - Programming Assignment 1 August 2016 Background It is well known in Game Theory that the game of Rock, Paper, Scissors has one and only one Nash Equilibrium.
Support for Cognitive Science Experiments
 Support for Cognitive Science Experiments CogSketch as Research Instrument Corpus of stimuli for people Corpus of formally represented stimuli Cognitive Simulation Compare results on variety of tasks Gathering
Analysis of gene expression in blood before diagnosis of ovarian cancer
 Analysis of gene expression in blood before diagnosis of ovarian cancer Different statistical methods Note no. Authors SAMBA/10/16 Marit Holden and Lars Holden Date March 2016 Norsk Regnesentral Norsk
MEA DISCUSSION PAPERS
 Inference Problems under a Special Form of Heteroskedasticity Helmut Farbmacher, Heinrich Kögel 03-2015 MEA DISCUSSION PAPERS mea Amalienstr. 33_D-80799 Munich_Phone+49 89 38602-355_Fax +49 89 38602-390_www.mea.mpisoc.mpg.de
Using Perceptual Grouping for Object Group Selection
 Using Perceptual Grouping for Object Group Selection Hoda Dehmeshki Department of Computer Science and Engineering, York University, 4700 Keele Street Toronto, Ontario, M3J 1P3 Canada hoda@cs.yorku.ca
Lecturer: Dr. Adote Anum, Dept. of Psychology Contact Information:
 Lecturer: Dr. Adote Anum, Dept. of Psychology Contact Information: aanum@ug.edu.gh College of Education School of Continuing and Distance Education 2014/2015 2016/2017 Session Overview The course provides
Natural Selection Simulation: Predation and Coloration
 Name Period Date Natural Selection Simulation: Predation and Coloration This simulation was invented by G. Ledyard Stebbins, a pioneer in the evolution of plants. The purpose of the game is to illustrate
HOW TO IDENTIFY A RESEARCH QUESTION? How to Extract a Question from a Topic that Interests You?
 Stefan Götze, M.A., M.Sc. LMU HOW TO IDENTIFY A RESEARCH QUESTION? I How to Extract a Question from a Topic that Interests You? I assume you currently have only a vague notion about the content of your
THE STAMP PYRAMID: Vertical Thinking for Leverage in a Horizontally Focused World. April 19, 2012 STAMP/STPA Workshop
 THE STAMP PYRAMID: Vertical Thinking for Leverage in a Horizontally Focused World April 19, 2012 STAMP/STPA Workshop William E. Young, Jr. Colonel, USAF PhD Student, Engineering Systems Division Massachusetts
An Escalation Model of Consciousness
 Bailey!1 Ben Bailey Current Issues in Cognitive Science Mark Feinstein 2015-12-18 An Escalation Model of Consciousness Introduction The idea of consciousness has plagued humanity since its inception. Humans
1 Motion. What is motion? Focus Questions: How do we measure it? How do we show it? Name: pd date
 1 Motion Name: pd date Quick Write Focus Question: draw motion use words to describe motion (do not use move, movement, etc) Motion Notes definition symbol formula motion position initial position final
What is analytical sociology? And is it the future of sociology?
 What is analytical sociology? And is it the future of sociology? Twan Huijsmans Sociology Abstract During the last few decades a new approach in sociology has been developed, analytical sociology (AS).
The degree to which a measure is free from error. (See page 65) Accuracy
 Accuracy") Accuracy The degree to which a measure is free from error. (See page 65) Case studies A descriptive research method that involves the intensive examination of unusual people or organizations. (See page
Accuracy The degree to which a measure is free from error. (See page 65) Case studies A descriptive research method that involves the intensive examination of unusual people or organizations. (See page
Human Health and Climate Change: Leverage Points for Adaptation in Urban Environments
 Int. J. Environ. Res. Public Health 2012, 9, 2134-2158; doi:10.3390/ijerph9062134 OPEN ACCESS Article International Journal of Environmental Research and Public Health ISSN 1660-4601 www.mdpi.com/journal/ijerph
Empirical Rule ( rule) applies ONLY to Normal Distribution (modeled by so called bell curve)
 applies ONLY to Normal Distribution (modeled by so called bell curve)") Chapter 2.5 Interpreting Standard Deviation Chebyshev Theorem Empirical Rule Chebyshev Theorem says that for ANY shape of data distribution at least 3/4 of all data fall no farther from the mean than 2
Chapter 2.5 Interpreting Standard Deviation Chebyshev Theorem Empirical Rule Chebyshev Theorem says that for ANY shape of data distribution at least 3/4 of all data fall no farther from the mean than 2
Research Seminar: Introduction to Empirical Science
 Research Seminar: Introduction to Empirical Science Rohit Verma Professor, Service Operations Management School of Hotel Administration Cornell University Ithaca, NY 14850 rv54@cornell.edu Why Empirical
Network Analysis of Toxic Chemicals and Symptoms: Implications for Designing First-Responder Systems
 Network Analysis of Toxic Chemicals and Symptoms: Implications for Designing First-Responder Systems Suresh K. Bhavnani 1 PhD, Annie Abraham 1, Christopher Demeniuk 1, Messeret Gebrekristos 1 Abe Gong
Relational methodology
 Relational methodology Ulisse Di Corpo and Antonella Vannini 1 The discovery of attractors has widened science to the study of phenomena which cannot be caused, phenomena which we can observe, but not
Part III Taking Chances for Fun and Profit
 Part III Taking Chances for Fun and Profit Chapter 8 Are Your Curves Normal? Probability and Why it Counts What You Will Learn in Chapter 8 How probability relates to statistics Characteristics of the
Chapter 02. Basic Research Methodology
 Chapter 02 Basic Research Methodology Definition RESEARCH Research is a quest for knowledge through diligent search or investigation or experimentation aimed at the discovery and interpretation of new
Statistics and Probability
 Statistics and a single count or measurement variable. S.ID.1: Represent data with plots on the real number line (dot plots, histograms, and box plots). S.ID.2: Use statistics appropriate to the shape
Howard Sheth Model. The model claims that a person s purchase decision is often influenced by more than one individuals.
 Howard Sheth Model The Howard Sheth theory of buyer behaviour is a sophisticated integration of the various social, psychological and marketing influences on consumer. The model claims that a person s
3. Diabetes involves defects in the glucose feedback loop moderated by which hormone?
 Topic 3: Does Ben Have Diabetes? 1. Review the introduction, what you will learn, and your task. 2. Click the forward arrow button. 3. What is the role of each hormone in the regulation of blood glucose