BIOSTATISTICS. Mahmoud Al Hussami, PhD., DSc. Associate Professor of Epidemiology
|
|
|
- Tamsin Glenn
- 5 years ago
- Views:
Transcription
1 BIOSTATISTICS Mahmoud Al Hussami, PhD., DSc. Associate Professor of Epidemiology
2 Unit One INTRODUCTION
3 Biostatistics It can be defined as the application of the mathematical tools used in statistics to the fields of biological sciences and medicine. It is a growing field with applications in many areas of biology including epidemiology, medical sciences, health sciences, educational research and environmental sciences. 3
4 Concerns of Biostatistics Biostatistics is concerned with collection, organization, summarization, and analysis of data. We seek to draw inferences about a body of data when only a part of the data is observed. 4
5 Purposes of Statistics To describe and summarize information thereby reducing it to smaller, more meaningful sets of data. To make predictions or to generalize about occurrences based on observations. To identify associations, relationships or differences between the sets of observations.
6 Data Data are numbers which can be measurements or can be obtained by counting. Biostatistics is concerned with the interpretation of the data and the communication of information about the data. 6
7 Sources of data Data are obtained from Analysis of records Surveys Counting Experiments Reports 7
8 Source of knowledge Traditions. It involves the handing down of knowledge from one generation to another. Authority. Experts. Clinical Experience, Trial and Error, and Intuition. Logical reasoning (inductive vs. deductive) Disciplined research (borrowed research).
9 Ways of Knowing There are many ways to obtain information, including sensory experience, agreement with others, expert opinion, logic, and the scientific method. The scientific method is considered by researchers the most likely way to produce reliable and accurate knowledge.
10 Ways of Knowing (continue) The scientific method involves answering questions through systematic data collation and analysis. The scientific research uses empirical data (data gathered through the senses) and is a systematic orderly and objective method of seeking information.
11 Logical Reasoning Is a method of knowing combines experience, intellectual faculties, and formal systems of thought. Inductive Reasoning. Is the process of developing generations from specific observations. E.g., a nurse may observe the anxious behavior of (specific) hospitalized children and conclude that (in general) children's separation from their parents is stressful. Deductive Reasoning. Is the process of developing specific perditions from general principles.
12 Inductive vs. Deductive Inductive : from particular to generalization Deductive : from general to specific, the conclusion are valid not true NO ONE ALONE IS ENOUGH, BOTH ARE A COMPLEMENTARY PARTS.
13 Deductive Reasoning Deductive Reasoning A type of logic in which one goes from a general statement to a specific instance. The classic example All men are mortal. (major premise) Socrates is a man. (minor premise) Therefore, Socrates is mortal. (conclusion)
14 Inductive Reasoning Inductive Reasoning, involves going from a series of specific cases to a general statement. The conclusion in an inductive argument is never guaranteed. Example: What is the next number in the sequence 6, 13, 20, 27, There is more than one correct answer.
15 PHILOSOPHIES OF RESEARCH The word science means knowledge. The word philosophy means wisdom. All research is based on philosophical beliefs about the world world view or paradigm. The perceived view is the basis of naturalistic (qualitative) research; the received view is the basis of empirical analytical (quantitative) research.
16 Paradigms for Health Research Paradigm: Is a world view; a general perspective on the complexities of the real world, with certain assumptions about reality. Paradigms for human inquiry are characterized in terms of the ways in which they respond to basic philosophical questions? Ontology: the nature of reality Epistemology: The relationship between inquirer and that being studied Axiology: role of values in the inquiry Methodology: how to obtain knowledge
17 Major Paradigms Positivism (also modernism, logical positivism) There is a reality out there that can be studies and known Phenomenon is not haphazard or random Highly objective in pursuit of knowledge Rooted in 19 th century thought. Guided by such philosophers as Mill, Newton, & Locke. Naturalism (also phenomenologic, constructive) Putting structures and ideas in a new ways Reality is not fixed Subjectivity is the primary way of understanding the phenomenon of interest. Began as a countermovement to positivism with writers such as Weber & Kant.
18 Assumption: Ontologic what is the nature of reality? Positivist Paradigm Reality exists; there is a real world driven by real natural causes. Naturalistic Paradigm Reality is multiple and subjective, mentally constructed by individuals.
19 Assumption: Epistemologic How is the inquirer related to those being researched? Positivist Paradigm The inquirer is independent from those being researched; findings are not influenced by the researcher. Naturalistic Paradigm The inquirer interacts with those being researched; findings are the creation of the interactive process.
20 Assumption: Axiologic What is the role of values in the inquiry? Positivist Paradigm Values and biases are to be held in check; objectivity is sought. Naturalistic Paradigm Subjectivity and values are inevitable and desirable.
21 Assumption: Methodologic How is knowledge obtained? Positivist Paradigm Deductive processes Emphasis on discrete, specific concepts. Verification of researchers hunches. Fixed design. Tight controls over contexts. Emphasis on measured, quantitative information; statistical analysis. Seeks generalizations. Naturalistic Paradigm Inductive processes. Emphasis on entirely of some phenomenon, holistic. Emerging interpretations grounded in participants experiences. Flexible design. Context-bound. Emphasis on narrative information; qualitative analysis. Seeks patterns.
22 Methods of Research Research methods are the techniques used by researchers to structure a study and to gather and analyze information relevant to the research question. Quantitative research, which is most closely allied with the positivist tradition. Qualitative research, which is most often associated with naturalistic inquiry.
23 Quantitative Research o Associated with positivism. o Use a scientific approach. o Mainly to understand the phenomenon of interest. o Use deductive reasoning to generate hunches that are tested in the real world. o Use mechanisms designed to control the study. o Researchers gather empirical evidence. o Must focus on human beings, who are inherently complex and diverse.
24 Qualitative Research Mainly to understand the human experience. Rich and in-depth information. Flexible. Associated with naturalistic paradigm. Use Inductive reasoning.
25 Variables 1.A variable is an object, characteristic, or property that can have different values. 2.A quantitative variable can be measured in some way. 3.A qualitative variable is characterized by its inability to be measured but it can be sorted into categories. 25
26 Random Variables 1. A random variable is one that cannot be predicted in advance because it arises by chance. Observations or measurements are used to obtain the value of a random variable. 2. Random variables may be discrete or continuous. 26
27 Discrete Random Variable 1. A discrete random variable has gaps or interruptions in the values that it can have. 2. The values may be whole numbers or have spaces between them. 27
28 Continuous Random Variable 1. A continuous random variable does not have gaps in the values it can assume. 2. Its properties are like the real numbers. 28
29 Populations and Samples 1. A population is the collection or set of all of the values that a variable may have. The entire category under consideration. 2. A sample is a part of a population. The portion of the population that is available, or to be made available, for analysis. 29
30 Population and Sampling Sampling: the process of selecting portion of the population. Representativeness: the key characteristic of the sample is close to the population. Sampling bias: excluding any subject without any scientific rational. Or not based on the major inclusion and exclusion criteria.
31 Example Studying the self esteem and academic achievement among college students. Population: all student who are enrolled in any college level. Sample: students college at the University of Jordan.
32 What is sampling? Sampling is the selection of a number of study units/subjects from a defined population.
33 Questions to Consider Reference population to whom are the results going to be applied? What is the group of people from which we want to draw a sample (study population)? How many people do we need in our sample (Sample Size)? How will these people be selected(sampling Method)?
34 Sampling - Populations Reference Population Study Population Sampling Frame Study Subjects
35 Population Is a complete set of persons or objects that possess some common characteristic that is of interest to the researcher. Two groups: The target population The accessible population
36 Target Population The entire group of people or objects to which the researcher wishes to generalize the findings of a study. Target population should meet the criteria of interest to the researcher Example: all people who were admitted to the renal unit for dialysis in Al- Basheer hospital during the period of
37 Accessible Population The group of people or objects that is available to the researcher for a particular study
38 SAMPLING STUDY POPULATION SAMPLE TARGET POPULATION 38
39 Sampling Element: The single member of the population (population element or population member are used interchangeably) Sampling frame is the listing of all elements of a population, i.e., a list of all medical students at the university of Jordan,
40 Sampling Methods Sampling depends on the sampling frame. Sampling frame: is a listing of all the units that compose the study population.
41 Primary vs Secondary Data Primary data. It is the data that has been compiled by the researcher using such techniques as surveys, experiments, depth interviews, observation, focus groups. Types of surveys. A lot of data is obtained using surveys. Each survey type has advantages and disadvantages. Mail: lowest rate of response; usually the lowest cost Personally administered: can probe ; most costly; interviewer effects (the interviewer might influence the response) Telephone: fastest Web: fast and inexpensive
42 Primary vs Secondary Data Secondary data. The data that has been compiled or published elsewhere, e.g., census data. The trick is to find data that is useful. The data was probably collected for some purpose other than helping to solve the researcher s problem at hand. Advantages: It can be gathered quickly and inexpensively. It enables researchers to build on past research. Problems: Data may be outdated. Variation in definition of terms. Different units of measurement. May not be accurate (e.g., census undercount).
43 Survey Errors Response Errors. Data errors that arise from issues with survey responses. subject lies question may be too personal or subject tries to give the socially acceptable response (example: Have you ever used an illegal drug? Have you even driven a car while intoxicated? ) subject makes a mistake subject may not remember the answer (e.g., How much money do you have invested in the stock market? interviewer makes a mistake in recording or understanding subject s response interviewer cheating interviewer wants to speed things up so s/he makes up some answers and pretends the respondent said them. interviewer effects vocal intonation, age, sex, race, clothing of interviewer may influence response. An elderly woman dressed very conservatively asking young people about usage of illegal drugs may get different responses than young interviewer wearing jeans with tattoos on her body and a nose ring.
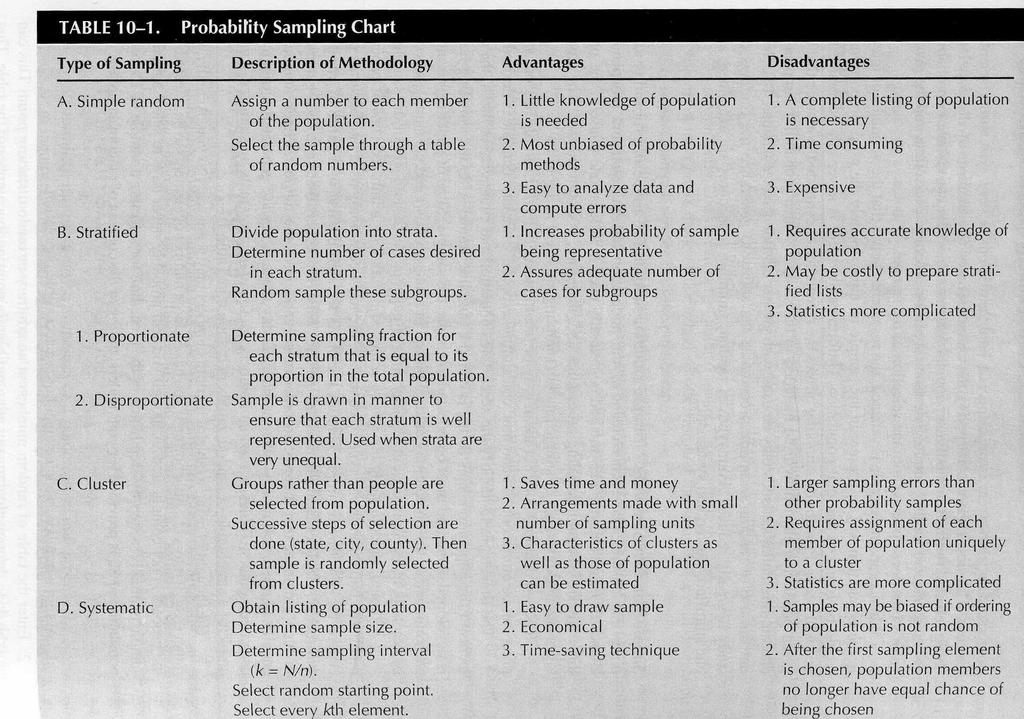
44 Types of Sampling Methods Probability Sampling Methods. Involves the use of random selection process to select a sample from members or elements of a populations. Simple Random Sampling Systematic sampling. Stratified sampling. Multistage sampling. Cluster sampling.
45 Probability Sampling Methods Involves random selection procedures to ensure that each unit of the sample is chosen on the basis of chance All units of the study population should have an equal or at least a known chance of being included in the sample Requires a sampling frame Listing of all study units
46 Simple Random Sampling This is the simplest of probability sampling Make a numbered list of all units in the population Decide on the sample size Select the required number of sampling units using the lottery method or a random number table
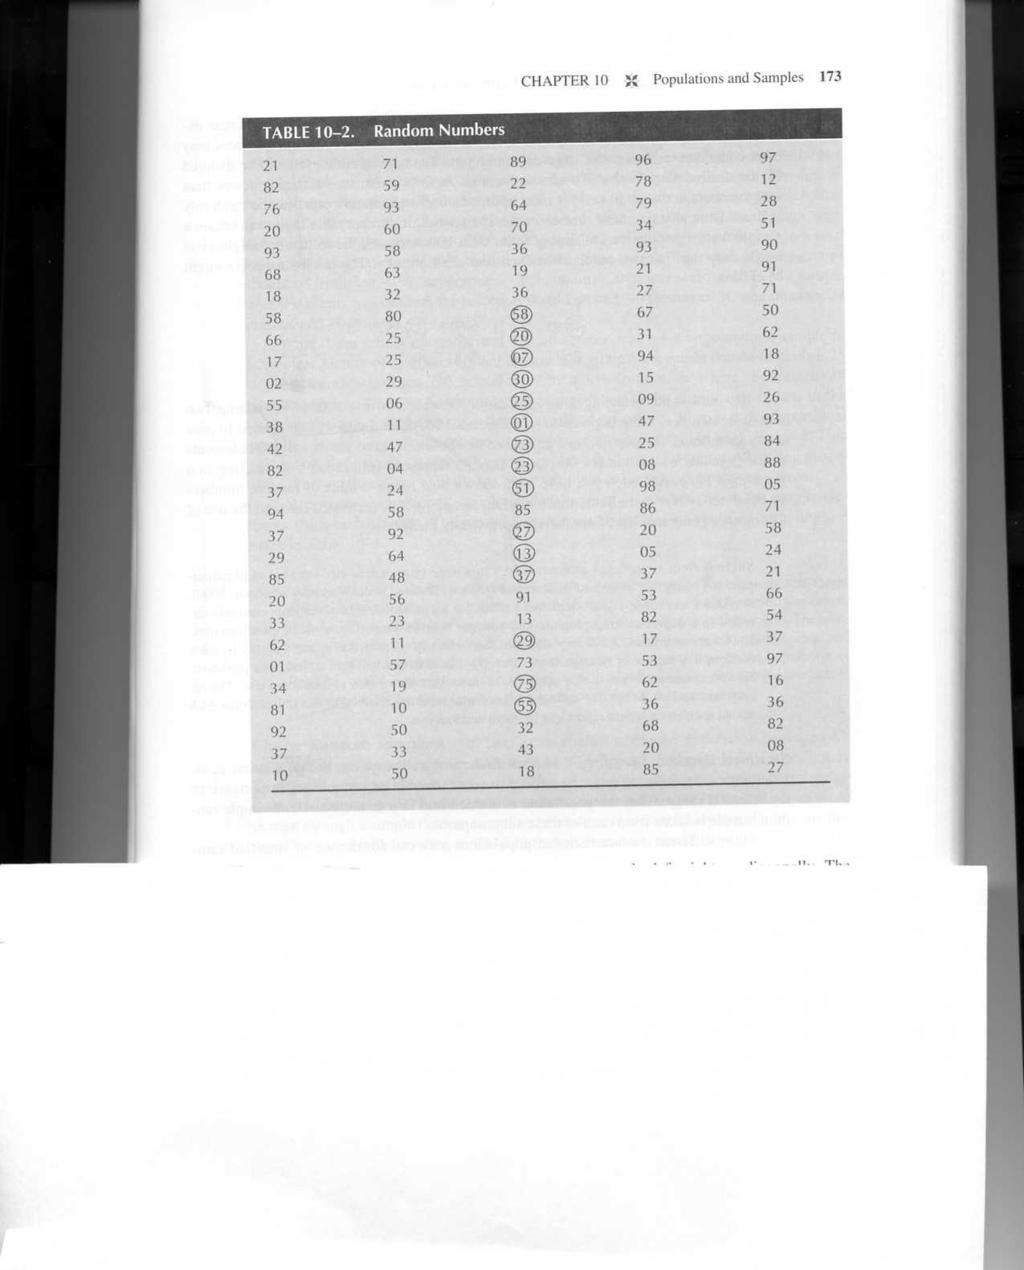
47
48 Systematic Sampling Individuals are chosen at regular intervals from the sampling frame Ideally we randomly select a number to tell us the starting point every 5th household every 10th women attending ANC Sampling fraction = Sample size Study population Interval size= study population Sample size
49 Stratified Sampling If we have study units with different characteristics which we want to include in the study then the sampling frame needs to be divided into strata according to these characteristics Ensures that proportions of individuals with certain characteristics in the sample will be the same as those in the whole study population Random or systematic samples of predetermined sample size will have to be obtained from each stratum based on a sampling fraction for each stratum
50 Multistage Sampling Involves more than one sampling method Is therefore carried out in phases Does not require a initial sampling frame of whole population NEED TO KNOW SAMPLING FRAME OF CLUSTERS E.G. PROVINCES Require sampling frames of final clusters final clusters Applicable to community based studies e.g. interviewing people from different villages selected from different areas, selected from different districts, provinces
51 Cluster Sampling Selection of study units (clusters) instead of the selection of individuals All subjects/units in the cluster who meet the criteria will be sampled. Clusters often geographic units e.g. schools, villages etc Usually used in interventional studies E.g. assessing immunization coverage Advantages sampling frame is not required in this case Sampling study population scattered over a large area
52
53 Nonprobability Sampling Methods Nonprobability sampling: the sample elements are chosen from the population by nonrandom methods. More likely to produce a biased sample than the random sampling. This restricts the generalization of the study findings. Most frequent reasons for use of nonprobability samples involve convenience and the desire to use available subjects.
54 Types of Sampling Methods Nonprobability Sampling Methods: Convenience sampling. Snowball sampling. Quota sampling. Purposive sampling.
55 Convenience sampling (Accidental or incidental sampling): People may or may not be typical of the population, no accurate way to determine their representativeness Most frequently used in health research Advantages: Saves time and money
56 Snowball sampling: a method by which the study subjects assist in obtaining other potential subjects (networking) Useful in topics of research where the subjects are reluctant to make their identity known, Drug users, Aids patients, etc.
57 Quota sampling Similar to stratified sampling in that the first step involves dividing the population into homogeneous strata and selecting sample elements from each of these strata In Stratified random sampling the sample is done by random selection (a percentage of each strata selected randomly) In quota sampling, the sample is selected by convenience (the first 50% of males and 50% of females) A mean for securing potential subjects from these strata
58 In a quota sampling variables of interest to the researcher (include subject attributes), such as age, gender, educational background are included in the sample
59 Purposive sampling (handpicking, judgmental): Subjects are chosen because they are typical or representative of the accessible population, or because they are experts (more knowledgeable) in the field of research topic. Qualitative researchers use Purposive sampling
60 Variables represent information that must be collected in order to meet the objectives of a study Measurable characteristic of a person, object or phenomenon which can take on different values Weight Distance Monthly income Number of children Color Outcome of disease Types of food Sex Variables allow clear definition of the core problem and influencing factors by introducing the concept of value
61 Types of Variables Continuous (e.g., height) Discrete (e.g., number of children) Categorical (e.g., marital status) Dichotomous (e.g., gender) Attribute variable vs. Active variable Attribute Variable: Preexisting characteristics which researcher simply observes and measures. E.g. blood type. Active Variable: Researcher creates or manipulates this. E.g. experimental drug.
62 Types of Variables (cont.) Independent variable the presumed cause (of a dependent variable) Dependent variable the presumed effect (of an independent variable) Example: Smoking (IV) Lung cancer (DV)
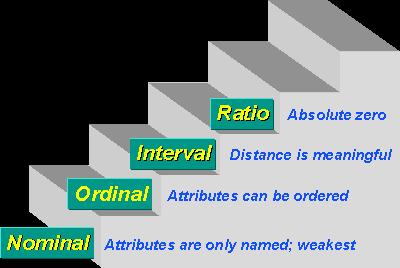
63 Levels of Measurement Nominal Ordinal Interval Ratio

64 Levels of Measurement
65 Nominal Level of Measurement Categories that are distinct from each other such as gender, religion, marital status. They are symbols that have no quantitative value. Lowest level of measurement. Many characteristics can be measured on a nominal scale: race, marital status, and blood type. Dichotomous. Appropriate statistics: mode, frequency We cannot use an average. It would be meaningless here.
66 Ordinal Level of Measurement The exact differences between the ranks cannot be specified such as it indicates order rather than exact quantity. Involves using numbers to designate ordering on an attribute. Example: anxiety level: mild, moderate, severe. Statistics used involve frequency distributions and percentages. Appropriate statistics: same as those for nominal data, plus the median; but not the mean.
67 Interval level of Measurement They are real numbers and the difference between the ranks can be specified. Equal intervals, but no true zero. Involves assigning numbers that indicate both the ordering on an attribute, and the distance between score values on the attribute They are actual numbers on a scale of measurement. Example: body temperature on the Celsius thermometer as in 36.2, 37.2 etc. means there is a difference of 1.0 degree in body temperature. Appropriate statistics same as for nominal same as for ordinal plus, the mean
68 Ratio level of Measurement Is the highest level of data where data can categorized, ranked, difference between ranks can be specified and a true or natural zero point can be identified. A zero point means that there is a total absence of the quantity being measured. All scales, whether they measure weight in kilograms or pounds, start at 0. The 0 means something and is not arbitrary (SUBJECTIVE). Example: total amount of money.
69 What Type of Data To collect? The goal of the researcher is to use the highest level of measurement possible. Example: Two ways of asking about Smoking behavior. Which is better, A or B? (A) Do you smoke? Yes No (B)How many cigarettes did you smoke in the last 3 days (72 hours)? (A) Is nominal, so the best we can get from this data are frequencies. (B) is ratio, so we can compute: mean, median, mode, frequencies.
70 Parameter and Statistic Parameter is a descriptive measure computed from the data of the population. The population mean, μ, and the population standard deviation, σ, are two examples of population parameters. If you want to determine the population parameters, you have to take a census of the entire population. Taking a census is very costly. Parameters are numerical descriptive measures corresponding to populations. Since the population is not actually observed, the parameters are considered unknown constants. Statistic is a descriptive measure computed from the data of the sample. For example, the sample mean, x, and the standard deviation, s, are statistics. They are used to estimate the population parameters.
71 Statistics It is a branch of applied mathematics that deals with collecting, organizing, & interpreting data using welldefined procedures in order to make decisions. The term parameter is used when describing the characteristics of the population. The term statistics is used to describe the characteristics of the sample. Types of Statistics: Descriptive Statistics. It involves organizing, summarizing & displaying data to make them more understandable. Inferential Statistics. It reports the degree of confidence of the sample statistic that predicts the value of the population parameter
72 Descriptive Statistics Those statistics that summarize a sample of numerical data in terms of averages and other measures for the purpose of description, such as the mean and standard deviation. Descriptive statistics, as opposed to inferential statistics, are not concerned with the theory and methodology for drawing inferences that extend beyond the particular set of data examined, in other words from the sample to the entire population. All that we care about are the summary measurements such as the average (mean). This includes the presentation of data in the form of graphs, charts, and tables.
73 Descriptive Statistics Measures of Location Measures of Central Tendency: Mean Median Mode Measures of noncentral Tendency-Quantiles: Quartiles. Quintiles. Percentiles. Measure of Dispersion (Variability): Range Interquartile range Variance Standard Deviation Coefficient of variation Measures of Shape: Mean > Median-positive or right Skewness Mean = Median- symmetric or zero Skewness Mean < Median-Negative of left Skewness
74 Statistical Inference Is the procedure used to reach a conclusion about a population based on the information derived from a sample that has been drawn from that population. 74
75 Inferential Statistics Inferential statistics are used to test hypotheses (prediction) about relationship between variables in the population. A relationship is a bond or association between variables. It consists of a set of statistical techniques that provide prediction about population characteristics based on information in a sample from population. An important aspect of statistical inference involves reporting the likely accuracy, or of confidence of the sample statistic that predicts the value of the population parameter.
76 Inferential Statistics Bivariate Parametric Tests: One Sample t test (t) Two Sample t test (t) Analysis of Variance/ANOVA (F). Pearson s Product Moment Correlations (r). Nonparametric statistical tests: Nominal Data: Chi-Square Goodness-of-Fit Test Chi-Square Test of Independence Nonparametric statistical tests: Ordinal Data: Mann Whitney U Test (U Kruskal Wallis Test (H)
77 Research Hypothesis A tentative prediction or explanation of the relationship between two or more variables It s a translation of research question into a precise prediction of the expected outcomes In some way it s a proposal for solution/s In qualitative research, there is NO hypothesis
78 Research Hypothesis States a prediction Must always involve at least two variables Must suggest a predicted relationship between the independent variable and the dependent variable Must contain terms that indicate a relationship (e.g., more than, different from, associated with)
79 Hypotheses Criteria Written in a declarative form. Written in present tense. Contain the population Contain variables. Reflects problem statement or purpose statement. Empirically testable.
80 A hypothesis is made about the value of a parameter, but the only facts available to estimate the true parameter are those provided by the sample. If the statistic differs (and of course it will) from the hypothesis stated about the parameter, a decision must be made as to whether or not this difference is significant. If it is, the hypothesis is rejected. If not, it cannot be rejected. H 0 : The null hypothesis. This contains the hypothesized parameter value which will be compared with the sample value. H 1 : The alternative hypothesis. This will be accepted only if H 0 is rejected. Technically speaking, we never accept H 0 What we actually say is that we do not have the evidence to reject it. 80


81 Two types of errors may occur: α (alpha) and β (beta). The α error is often referred to as a Type I error and β error as a Type II error. You are guilty of an alpha error if you reject H 0 when it really is true. You commit a beta error if you accept H 0 when it is false. 81
82 Types of Errors If You Reject the null hypothesis Reject the null hypothesis Accept the null hypothesis Accept the null hypothesis When the Null Hypothesis is True (there really are no difference) False (there really are difference) False (there really are difference) True (there really are no difference) Then You Have. Made a Type I Error Made Type II Error
83 TRADEOFF! 1. There is a tradeoff between the alpha and beta errors. We cannot simply reduce both types of error. As one goes down, the other rises. 2. As we lower the error, the β error goes up: reducing the error of rejecting H 0 (the error of rejection) increases the error of Accepting H 0 when it is false (the error of acceptance). 83
84 Quality Control. A. A company purchases chips for its smart phones, in batches of 50,000. The company is willing to live with a few defects per 50,000 chips. How many defects? B. If the firm randomly samples 100 chips from each batch of 50,000 and rejects the entire shipment if there are ANY defects, it may end up rejecting too many shipments (error of rejection). If the firm is too liberal in what it accepts and assumes everything is sampling error, it is likely to make the error of acceptance. C. This is why government and industry generally work with an alpha error of.05 84
85 1. Formulate H 0 and H 1. H 0 is the null hypothesis, a hypothesis about the value of a parameter, and H 1 is an alternative hypothesis. e.g., H 0 : µ=12.7 years; H 1 : µ 12.7 years 2. Specify the level of significance (α) to be used. This level of significance tells you the probability of rejecting H 0 when it is, in fact, true. (Normally, significance level of 0.05 or 0.01 are used) 3. Select the test statistic: e.g., Z, t, F, etc. 4. Establish the critical value or values of the test statistic needed to reject H 0. DRAW A PICTURE! 5. Determine the actual value (computed value) of the test statistic. 6. Make a decision: Reject H 0 or Do Not Reject H 0. 85

86 I Hope This Will Help
BIOSTATISTICS. Dr. Hamza Aduraidi
 BIOSTATISTICS Dr. Hamza Aduraidi Unit One INTRODUCTION Biostatistics It can be defined as the application of the mathematical tools used in statistics to the fields of biological sciences and medicine.
Introduction to Statistics. Mahmoud Alhussami, DSc., PhD.
 Introduction to Statistics Mahmoud Alhussami, DSc., PhD. Course Objectives Understand the basic statistical concepts and their application to health care research Differentiate between parametric and nonparametric
Psychology Research Process
 Psychology Research Process Logical Processes Induction Observation/Association/Using Correlation Trying to assess, through observation of a large group/sample, what is associated with what? Examples:
Psychology Research Process
 Psychology Research Process Logical Processes Induction Observation/Association/Using Correlation Trying to assess, through observation of a large group/sample, what is associated with what? Examples:
9 research designs likely for PSYC 2100
 9 research designs likely for PSYC 2100 1) 1 factor, 2 levels, 1 group (one group gets both treatment levels) related samples t-test (compare means of 2 levels only) 2) 1 factor, 2 levels, 2 groups (one
INTRODUCTION TO STATISTICS SORANA D. BOLBOACĂ
 INTRODUCTION TO STATISTICS SORANA D. BOLBOACĂ OBJECTIVES Definitions Stages of Scientific Knowledge Quantification and Accuracy Types of Medical Data Population and sample Sampling methods DEFINITIONS
Describe what is meant by a placebo Contrast the double-blind procedure with the single-blind procedure Review the structure for organizing a memo
 Please note the page numbers listed for the Lind book may vary by a page or two depending on which version of the textbook you have. Readings: Lind 1 11 (with emphasis on chapters 10, 11) Please note chapter
TOPIC: Introduction to Statistics WELCOME TO MY CLASS!
 TOPIC: Introduction to Statistics WELCOME TO MY CLASS! Two statisticians were traveling in an airplane from Los Angeles to New York City. About an hour into the flight, the pilot announced that although
Unit 1 Exploring and Understanding Data
 Unit 1 Exploring and Understanding Data Area Principle Bar Chart Boxplot Conditional Distribution Dotplot Empirical Rule Five Number Summary Frequency Distribution Frequency Polygon Histogram Interquartile
Prepared by: Assoc. Prof. Dr Bahaman Abu Samah Department of Professional Development and Continuing Education Faculty of Educational Studies
 Prepared by: Assoc. Prof. Dr Bahaman Abu Samah Department of Professional Development and Continuing Education Faculty of Educational Studies Universiti Putra Malaysia Serdang At the end of this session,
STATISTICS AND RESEARCH DESIGN
 Statistics 1 STATISTICS AND RESEARCH DESIGN These are subjects that are frequently confused. Both subjects often evoke student anxiety and avoidance. To further complicate matters, both areas appear have
Still important ideas
 Readings: OpenStax - Chapters 1 11 + 13 & Appendix D & E (online) Plous - Chapters 2, 3, and 4 Chapter 2: Cognitive Dissonance, Chapter 3: Memory and Hindsight Bias, Chapter 4: Context Dependence Still
Chapter 02. Basic Research Methodology
 Chapter 02 Basic Research Methodology Definition RESEARCH Research is a quest for knowledge through diligent search or investigation or experimentation aimed at the discovery and interpretation of new
Describe what is meant by a placebo Contrast the double-blind procedure with the single-blind procedure Review the structure for organizing a memo
 Business Statistics The following was provided by Dr. Suzanne Delaney, and is a comprehensive review of Business Statistics. The workshop instructor will provide relevant examples during the Skills Assessment
Funnelling Used to describe a process of narrowing down of focus within a literature review. So, the writer begins with a broad discussion providing b
 Accidental sampling A lesser-used term for convenience sampling. Action research An approach that challenges the traditional conception of the researcher as separate from the real world. It is associated
Still important ideas
 Readings: OpenStax - Chapters 1 13 & Appendix D & E (online) Plous Chapters 17 & 18 - Chapter 17: Social Influences - Chapter 18: Group Judgments and Decisions Still important ideas Contrast the measurement
Statistical Techniques. Masoud Mansoury and Anas Abulfaraj
 Statistical Techniques Masoud Mansoury and Anas Abulfaraj What is Statistics? https://www.youtube.com/watch?v=lmmzj7599pw The definition of Statistics The practice or science of collecting and analyzing
Business Statistics Probability
 Business Statistics The following was provided by Dr. Suzanne Delaney, and is a comprehensive review of Business Statistics. The workshop instructor will provide relevant examples during the Skills Assessment
Introduction to statistics Dr Alvin Vista, ACER Bangkok, 14-18, Sept. 2015
 Analysing and Understanding Learning Assessment for Evidence-based Policy Making Introduction to statistics Dr Alvin Vista, ACER Bangkok, 14-18, Sept. 2015 Australian Council for Educational Research Structure
Empirical Knowledge: based on observations. Answer questions why, whom, how, and when.
 INTRO TO RESEARCH METHODS: Empirical Knowledge: based on observations. Answer questions why, whom, how, and when. Experimental research: treatments are given for the purpose of research. Experimental group
Readings: Textbook readings: OpenStax - Chapters 1 13 (emphasis on Chapter 12) Online readings: Appendix D, E & F
 Online readings: Appendix D, E & F") Readings: Textbook readings: OpenStax - Chapters 1 13 (emphasis on Chapter 12) Online readings: Appendix D, E & F Plous Chapters 17 & 18 Chapter 17: Social Influences Chapter 18: Group Judgments and Decisions
Readings: Textbook readings: OpenStax - Chapters 1 13 (emphasis on Chapter 12) Online readings: Appendix D, E & F Plous Chapters 17 & 18 Chapter 17: Social Influences Chapter 18: Group Judgments and Decisions
Quantitative Methods in Computing Education Research (A brief overview tips and techniques)
") Quantitative Methods in Computing Education Research (A brief overview tips and techniques) Dr Judy Sheard Senior Lecturer Co-Director, Computing Education Research Group Monash University judy.sheard@monash.edu
Quantitative Methods in Computing Education Research (A brief overview tips and techniques) Dr Judy Sheard Senior Lecturer Co-Director, Computing Education Research Group Monash University judy.sheard@monash.edu
CHAPTER 3 METHOD AND PROCEDURE
 CHAPTER 3 METHOD AND PROCEDURE Previous chapter namely Review of the Literature was concerned with the review of the research studies conducted in the field of teacher education, with special reference
Statistics Guide. Prepared by: Amanda J. Rockinson- Szapkiw, Ed.D.
 This guide contains a summary of the statistical terms and procedures. This guide can be used as a reference for course work and the dissertation process. However, it is recommended that you refer to statistical
Vocabulary. Bias. Blinding. Block. Cluster sample
 Bias Blinding Block Census Cluster sample Confounding Control group Convenience sample Designs Experiment Experimental units Factor Level Any systematic failure of a sampling method to represent its population
Six Sigma Glossary Lean 6 Society
 Six Sigma Glossary Lean 6 Society ABSCISSA ACCEPTANCE REGION ALPHA RISK ALTERNATIVE HYPOTHESIS ASSIGNABLE CAUSE ASSIGNABLE VARIATIONS The horizontal axis of a graph The region of values for which the null
Readings: Textbook readings: OpenStax - Chapters 1 11 Online readings: Appendix D, E & F Plous Chapters 10, 11, 12 and 14
 Readings: Textbook readings: OpenStax - Chapters 1 11 Online readings: Appendix D, E & F Plous Chapters 10, 11, 12 and 14 Still important ideas Contrast the measurement of observable actions (and/or characteristics)
RESEARCH METHODOLOGY-NET/JRF EXAMINATION DECEMBER 2013 prepared by Lakshmanan.MP, Asst Professor, Govt College Chittur
 RESEARCH METHODOLOGY-NET/JRF EXAMINATION DECEMBER 2013 prepared by Lakshmanan.MP, Asst Professor, Govt College Chittur For answer key mail request to mpl77lic@gmail.com 1 The research process is best described
Describe what is meant by a placebo Contrast the double-blind procedure with the single-blind procedure Review the structure for organizing a memo
 Please note the page numbers listed for the Lind book may vary by a page or two depending on which version of the textbook you have. Readings: Lind 1 11 (with emphasis on chapters 5, 6, 7, 8, 9 10 & 11)
The Institute of Chartered Accountants of Sri Lanka
 The Institute of Chartered Accountants of Sri Lanka Postgraduate Diploma in Business Finance and Strategy Quantitative Methods for Business Studies Handout 01: Basic Statistics What is Statistics? Statistics
HOW STATISTICS IMPACT PHARMACY PRACTICE?
 HOW STATISTICS IMPACT PHARMACY PRACTICE? CPPD at NCCR 13 th June, 2013 Mohamed Izham M.I., PhD Professor in Social & Administrative Pharmacy Learning objective.. At the end of the presentation pharmacists
Biostatistics. Donna Kritz-Silverstein, Ph.D. Professor Department of Family & Preventive Medicine University of California, San Diego
 Biostatistics Donna Kritz-Silverstein, Ph.D. Professor Department of Family & Preventive Medicine University of California, San Diego (858) 534-1818 dsilverstein@ucsd.edu Introduction Overview of statistical
Lecture (chapter 1): Introduction
: Introduction") Lecture (chapter 1): Introduction Ernesto F. L. Amaral January 17, 2018 Advanced Methods of Social Research (SOCI 420) Source: Healey, Joseph F. 2015. Statistics: A Tool for Social Research. Stamford:
Lecture (chapter 1): Introduction Ernesto F. L. Amaral January 17, 2018 Advanced Methods of Social Research (SOCI 420) Source: Healey, Joseph F. 2015. Statistics: A Tool for Social Research. Stamford:
Chapter 1: Explaining Behavior
 Chapter 1: Explaining Behavior GOAL OF SCIENCE is to generate explanations for various puzzling natural phenomenon. - Generate general laws of behavior (psychology) RESEARCH: principle method for acquiring
POST GRADUATE DIPLOMA IN BIOETHICS (PGDBE) Term-End Examination June, 2016 MHS-014 : RESEARCH METHODOLOGY
 Term-End Examination June, 2016 MHS-014 : RESEARCH METHODOLOGY") No. of Printed Pages : 12 MHS-014 POST GRADUATE DIPLOMA IN BIOETHICS (PGDBE) Term-End Examination June, 2016 MHS-014 : RESEARCH METHODOLOGY Time : 2 hours Maximum Marks : 70 PART A Attempt all questions.
No. of Printed Pages : 12 MHS-014 POST GRADUATE DIPLOMA IN BIOETHICS (PGDBE) Term-End Examination June, 2016 MHS-014 : RESEARCH METHODOLOGY Time : 2 hours Maximum Marks : 70 PART A Attempt all questions.
Chapter Three: Sampling Methods
 Chapter Three: Sampling Methods The idea of this chapter is to make sure that you address sampling issues - even though you may be conducting an action research project and your sample is "defined" by
Political Science 15, Winter 2014 Final Review
 Political Science 15, Winter 2014 Final Review The major topics covered in class are listed below. You should also take a look at the readings listed on the class website. Studying Politics Scientifically
Ch 1.1 & 1.2 Basic Definitions for Statistics
 Ch 1.1 & 1.2 Basic Definitions for Statistics Objective A : Basic Definition A1. Definition What is Statistics? Statistics is the science of collecting, organizing, summarizing, and analyzing data to draw
Chapter-2 RESEARCH DESIGN
 Chapter-2 RESEARCH DESIGN 33 2.1 Introduction to Research Methodology: The general meaning of research is the search for knowledge. Research is also defined as a careful investigation or inquiry, especially
Formulating Research Questions and Designing Studies. Research Series Session I January 4, 2017
 Formulating Research Questions and Designing Studies Research Series Session I January 4, 2017 Course Objectives Design a research question or problem Differentiate between the different types of research
ISC- GRADE XI HUMANITIES ( ) PSYCHOLOGY. Chapter 2- Methods of Psychology
 PSYCHOLOGY. Chapter 2- Methods of Psychology") ISC- GRADE XI HUMANITIES (2018-19) PSYCHOLOGY Chapter 2- Methods of Psychology OUTLINE OF THE CHAPTER (i) Scientific Methods in Psychology -observation, case study, surveys, psychological tests, experimentation
ISC- GRADE XI HUMANITIES (2018-19) PSYCHOLOGY Chapter 2- Methods of Psychology OUTLINE OF THE CHAPTER (i) Scientific Methods in Psychology -observation, case study, surveys, psychological tests, experimentation
DOING SOCIOLOGICAL RESEARCH C H A P T E R 3
 DOING SOCIOLOGICAL RESEARCH C H A P T E R 3 THE RESEARCH PROCESS There are various methods that sociologists use to do research. All involve rigorous observation and careful analysis These methods include:
CHAPTER 3. Methodology
 CHAPTER 3 Methodology The purpose of this chapter is to provide the research methodology which was designed to achieve the objectives of this study. It is important to select appropriate method to ensure
What you should know before you collect data. BAE 815 (Fall 2017) Dr. Zifei Liu
 Dr. Zifei Liu") What you should know before you collect data BAE 815 (Fall 2017) Dr. Zifei Liu Zifeiliu@ksu.edu Types and levels of study Descriptive statistics Inferential statistics How to choose a statistical test
What you should know before you collect data BAE 815 (Fall 2017) Dr. Zifei Liu Zifeiliu@ksu.edu Types and levels of study Descriptive statistics Inferential statistics How to choose a statistical test
On the purpose of testing:
 Why Evaluation & Assessment is Important Feedback to students Feedback to teachers Information to parents Information for selection and certification Information for accountability Incentives to increase
MBA 605 Business Analytics Don Conant, PhD. GETTING TO THE STANDARD NORMAL DISTRIBUTION
 MBA 605 Business Analytics Don Conant, PhD. GETTING TO THE STANDARD NORMAL DISTRIBUTION Variables In the social sciences data are the observed and/or measured characteristics of individuals and groups
Survey Research Methodology
 Survey Research Methodology Prepared by: Praveen Sapkota IAAS, TU, Rampur Chitwan, Nepal Social research Meaning of social research A social research is a systematic method of exploring, analyzing and
PTHP 7101 Research 1 Chapter Assignments
 PTHP 7101 Research 1 Chapter Assignments INSTRUCTIONS: Go over the questions/pointers pertaining to the chapters and turn in a hard copy of your answers at the beginning of class (on the day that it is
Statistics is the science of collecting, organizing, presenting, analyzing, and interpreting data to assist in making effective decisions
 Readings: OpenStax Textbook - Chapters 1 5 (online) Appendix D & E (online) Plous - Chapters 1, 5, 6, 13 (online) Introductory comments Describe how familiarity with statistical methods can - be associated
CHAPTER 3 DATA ANALYSIS: DESCRIBING DATA
 Data Analysis: Describing Data CHAPTER 3 DATA ANALYSIS: DESCRIBING DATA In the analysis process, the researcher tries to evaluate the data collected both from written documents and from other sources such
AP Psych - Stat 2 Name Period Date. MULTIPLE CHOICE. Choose the one alternative that best completes the statement or answers the question.
 AP Psych - Stat 2 Name Period Date MULTIPLE CHOICE. Choose the one alternative that best completes the statement or answers the question. 1) In a set of incomes in which most people are in the $15,000
SPRING GROVE AREA SCHOOL DISTRICT. Course Description. Instructional Strategies, Learning Practices, Activities, and Experiences.
 SPRING GROVE AREA SCHOOL DISTRICT PLANNED COURSE OVERVIEW Course Title: Basic Introductory Statistics Grade Level(s): 11-12 Units of Credit: 1 Classification: Elective Length of Course: 30 cycles Periods
Choosing the Correct Statistical Test
 Choosing the Correct Statistical Test T racie O. Afifi, PhD Departments of Community Health Sciences & Psychiatry University of Manitoba Department of Community Health Sciences COLLEGE OF MEDICINE, FACULTY
Bijay Lal Pradhan, M Sc Statistics, FDPM (IIMA) 2
 2") Bijay Lal Pradhan Measurement and Scaling 1) Definition of measurement and scale 2) Type of Physical scale i. Nominal Scale iii. Interval scale ii. Ordinal Scale iv. Ratio Scale 3) Need of scaling 4) Criteria
Bijay Lal Pradhan Measurement and Scaling 1) Definition of measurement and scale 2) Type of Physical scale i. Nominal Scale iii. Interval scale ii. Ordinal Scale iv. Ratio Scale 3) Need of scaling 4) Criteria
Student Name: XXXXXXX XXXX. Professor Name: XXXXX XXXXXX. University/College: XXXXXXXXXXXXXXXXXX
 1 Student Name: XXXXXXX XXXX Professor Name: XXXXX XXXXXX University/College: XXXXXXXXXXXXXXXXXX Knowledge Research Assessment Philosophy Research Philosophical research, even before it had a name, existed
WDHS Curriculum Map Probability and Statistics. What is Statistics and how does it relate to you?
 WDHS Curriculum Map Probability and Statistics Time Interval/ Unit 1: Introduction to Statistics 1.1-1.3 2 weeks S-IC-1: Understand statistics as a process for making inferences about population parameters
Communication Research Practice Questions
 Communication Research Practice Questions For each of the following questions, select the best answer from the given alternative choices. Additional instructions are given as necessary. Read each question
Student name: SOCI 420 Advanced Methods of Social Research Fall 2017
 SOCI 420 Advanced Methods of Social Research Fall 2017 EXAM 1 RUBRIC Instructor: Ernesto F. L. Amaral, Assistant Professor, Department of Sociology Date: October 12, 2017 (Thursday) Section 903: 9:35 10:50am
NORTH SOUTH UNIVERSITY TUTORIAL 1
 NORTH SOUTH UNIVERSITY TUTORIAL 1 REVIEW FROM BIOSTATISTICS I AHMED HOSSAIN,PhD Data Management and Analysis AHMED HOSSAIN,PhD - Data Management and Analysis 1 DATA TYPES/ MEASUREMENT SCALES Categorical:
Understandable Statistics
 Understandable Statistics correlated to the Advanced Placement Program Course Description for Statistics Prepared for Alabama CC2 6/2003 2003 Understandable Statistics 2003 correlated to the Advanced Placement
Analysis and Interpretation of Data Part 1
 Analysis and Interpretation of Data Part 1 DATA ANALYSIS: PRELIMINARY STEPS 1. Editing Field Edit Completeness Legibility Comprehensibility Consistency Uniformity Central Office Edit 2. Coding Specifying
Introduction to Statistical Data Analysis I
 Introduction to Statistical Data Analysis I JULY 2011 Afsaneh Yazdani Preface What is Statistics? Preface What is Statistics? Science of: designing studies or experiments, collecting data Summarizing/modeling/analyzing
KOM 5113: Communication Research Methods (First Face-2-Face Meeting)
") KOM 5113: Communication Research Methods (First Face-2-Face Meeting) Siti Zobidah Omar, Ph.D zobidah@putra.upm.edu.my Second Semester (January), 2011/2012 1 What is research? Research is a common activity
KOM 5113: Communication Research Methods (First Face-2-Face Meeting) Siti Zobidah Omar, Ph.D zobidah@putra.upm.edu.my Second Semester (January), 2011/2012 1 What is research? Research is a common activity
Chapter 1: The Nature of Probability and Statistics
 Chapter 1: The Nature of Probability and Statistics Diana Pell Section 1.1: Descriptive and Inferential Statistics Statistics is the science of conducting studies to collect, organize, summarize, analyze,
The Logic of Data Analysis Using Statistical Techniques M. E. Swisher, 2016
 The Logic of Data Analysis Using Statistical Techniques M. E. Swisher, 2016 This course does not cover how to perform statistical tests on SPSS or any other computer program. There are several courses
Sample Size, Power and Sampling Methods
 Sample Size, Power and Sampling Methods Mary Ann McBurnie, PhD Senior Investigator, Kaiser Permanente Center for Health Research Steering Committee Chair, Community Health Applied Research Network (CHARN)
Methodological skills
 Methodological skills rma linguistics, week 3 Tamás Biró ACLC University of Amsterdam t.s.biro@uva.nl Tamás Biró, UvA 1 Topics today Parameter of the population. Statistic of the sample. Re: descriptive
Descriptive Statistics Lecture
 Definitions: Lecture Psychology 280 Orange Coast College 2/1/2006 Statistics have been defined as a collection of methods for planning experiments, obtaining data, and then analyzing, interpreting and
Statistics is the science of collecting, organizing, presenting, analyzing, and interpreting data to assist in making effective decisions
 Readings: OpenStax Textbook - Chapters 1 5 (online) Appendix D & E (online) Plous - Chapters 1, 5, 6, 13 (online) Introductory comments Describe how familiarity with statistical methods can - be associated
MBA SEMESTER III. MB0050 Research Methodology- 4 Credits. (Book ID: B1206 ) Assignment Set- 1 (60 Marks)
 Assignment Set- 1 (60 Marks)") MBA SEMESTER III MB0050 Research Methodology- 4 Credits (Book ID: B1206 ) Assignment Set- 1 (60 Marks) Note: Each question carries 10 Marks. Answer all the questions Q1. a. Differentiate between nominal,
MBA SEMESTER III MB0050 Research Methodology- 4 Credits (Book ID: B1206 ) Assignment Set- 1 (60 Marks) Note: Each question carries 10 Marks. Answer all the questions Q1. a. Differentiate between nominal,
I. Introduction and Data Collection B. Sampling. 1. Bias. In this section Bias Random Sampling Sampling Error
 I. Introduction and Data Collection B. Sampling In this section Bias Random Sampling Sampling Error 1. Bias Bias a prejudice in one direction (this occurs when the sample is selected in such a way that
Medical Statistics 1. Basic Concepts Farhad Pishgar. Defining the data. Alive after 6 months?
 Medical Statistics 1 Basic Concepts Farhad Pishgar Defining the data Population and samples Except when a full census is taken, we collect data on a sample from a much larger group called the population.
Review and Wrap-up! ESP 178 Applied Research Methods Calvin Thigpen 3/14/17 Adapted from presentation by Prof. Susan Handy
 Review and Wrap-up! ESP 178 Applied Research Methods Calvin Thigpen 3/14/17 Adapted from presentation by Prof. Susan Handy Final Proposals Read instructions carefully! Check Canvas for our comments on
Student name: SOCI 420 Advanced Methods of Social Research Fall 2017
 SOCI 420 Advanced Methods of Social Research Fall 2017 EXAM 1 RUBRIC Instructor: Ernesto F. L. Amaral, Assistant Professor, Department of Sociology Date: October 12, 2017 (Thursday) Section 904: 2:20 3:35pm
VARIABLES AND MEASUREMENT
 ARTHUR SYC 204 (EXERIMENTAL SYCHOLOGY) 16A LECTURE NOTES [01/29/16] VARIABLES AND MEASUREMENT AGE 1 Topic #3 VARIABLES AND MEASUREMENT VARIABLES Some definitions of variables include the following: 1.
Data and Statistics 101: Key Concepts in the Collection, Analysis, and Application of Child Welfare Data
 TECHNICAL REPORT Data and Statistics 101: Key Concepts in the Collection, Analysis, and Application of Child Welfare Data CONTENTS Executive Summary...1 Introduction...2 Overview of Data Analysis Concepts...2
Scientific Research. The Scientific Method. Scientific Explanation
 Scientific Research The Scientific Method Make systematic observations. Develop a testable explanation. Submit the explanation to empirical test. If explanation fails the test, then Revise the explanation
Experimental Research in HCI. Alma Leora Culén University of Oslo, Department of Informatics, Design
 Experimental Research in HCI Alma Leora Culén University of Oslo, Department of Informatics, Design almira@ifi.uio.no INF2260/4060 1 Oslo, 15/09/16 Review Method Methodology Research methods are simply
The Current State of Our Education
 1 The Current State of Our Education 2 Quantitative Research School of Management www.ramayah.com Mental Challenge A man and his son are involved in an automobile accident. The man is killed and the boy,
Research Methodology in Social Sciences. by Dr. Rina Astini
 Research Methodology in Social Sciences by Dr. Rina Astini Email : rina_astini@mercubuana.ac.id What is Research? Re ---------------- Search Re means (once more, afresh, anew) or (back; with return to
Study Guide for the Final Exam
 Study Guide for the Final Exam When studying, remember that the computational portion of the exam will only involve new material (covered after the second midterm), that material from Exam 1 will make
A Probability Puzzler. Statistics, Data and Statistical Thinking. A Probability Puzzler. A Probability Puzzler. Statistics.
 Statistics, Data and Statistical Thinking FREC 408 Dr. Tom Ilvento 213 Townsend Hall Ilvento@udel.edu A Probability Puzzler Pick a number from 2 to 9. It can be 2 or it can be 9, or any number in between.
What Is Statistics. Chapter 1
 What Is Statistics Chapter 1 Learning Objectives Explain why we study statistics. Explain what is meant by descriptive statistics and inferential statistics. Distinguish between a quantitative variable
AP Psych - Stat 1 Name Period Date. MULTIPLE CHOICE. Choose the one alternative that best completes the statement or answers the question.
 AP Psych - Stat 1 Name Period Date MULTIPLE CHOICE. Choose the one alternative that best completes the statement or answers the question. 1) In a set of incomes in which most people are in the $15,000
Lecture Start
 Lecture -- 5 -- Start Outline 1. Science, Method & Measurement 2. On Building An Index 3. Correlation & Causality 4. Probability & Statistics 5. Samples & Surveys 6. Experimental & Quasi-experimental Designs
Glossary of Research Terms Compiled by Dr Emma Rowden and David Litting (UTS Library)
") Glossary of Research Terms Compiled by Dr Emma Rowden and David Litting (UTS Library) Applied Research Applied research refers to the use of social science inquiry methods to solve concrete and practical
Glossary of Research Terms Compiled by Dr Emma Rowden and David Litting (UTS Library) Applied Research Applied research refers to the use of social science inquiry methods to solve concrete and practical
Sheila Barron Statistics Outreach Center 2/8/2011
 Sheila Barron Statistics Outreach Center 2/8/2011 What is Power? When conducting a research study using a statistical hypothesis test, power is the probability of getting statistical significance when
Research Questions, Variables, and Hypotheses: Part 2. Review. Hypotheses RCS /7/04. What are research questions? What are variables?
 Research Questions, Variables, and Hypotheses: Part 2 RCS 6740 6/7/04 1 Review What are research questions? What are variables? Definition Function Measurement Scale 2 Hypotheses OK, now that we know how
STA630 Research Methods Solved MCQs By
 STA630 Research Methods Solved MCQs By http://vustudents.ning.com 31-07-2010 Quiz # 1: Question # 1 of 10: A one tailed hypothesis predicts----------- The future The lottery result The frequency of the
Quantitative Research Methods and Tools
 Quantitative Research Methods and Tools Fraser Health Authority, 2011 The Fraser Health Authority ( FH ) authorizes the use, reproduction and/or modification of this publication for purposes other than
What Is Statistics. Learning Objectives. Definition. Who Uses Statistics? 12/9/2015
 Learning Objectives What Is Statistics Chapter 1 Explain why we study statistics. Explain what is meant by descriptive statistics and inferential statistics. Distinguish between a quantitative variable
Sta 309 (Statistics And Probability for Engineers)
") Instructor: Prof. Mike Nasab Sta 309 (Statistics And Probability for Engineers) Chapter (1) 1. Statistics: The science of collecting, organizing, summarizing, analyzing numerical information called data
Instructor: Prof. Mike Nasab Sta 309 (Statistics And Probability for Engineers) Chapter (1) 1. Statistics: The science of collecting, organizing, summarizing, analyzing numerical information called data
Qualitative and Quantitative Approaches Workshop. Comm 151i San Jose State U Dr. T.M. Coopman Okay for non-commercial use with attribution
 Qualitative and Quantitative Approaches Workshop Comm 151i San Jose State U Dr. T.M. Coopman Okay for non-commercial use with attribution This Workshop This is a research skill workshop. This workshop
CONCEPTUAL FRAMEWORK, EPISTEMOLOGY, PARADIGM, &THEORETICAL FRAMEWORK
 CONCEPTUAL FRAMEWORK, EPISTEMOLOGY, PARADIGM, &THEORETICAL FRAMEWORK CONCEPTUAL FRAMEWORK: Is the system of concepts, assumptions, expectations, beliefs, and theories that supports and informs your research.
Choosing an Approach for a Quantitative Dissertation: Strategies for Various Variable Types
 Choosing an Approach for a Quantitative Dissertation: Strategies for Various Variable Types Kuba Glazek, Ph.D. Methodology Expert National Center for Academic and Dissertation Excellence Outline Thesis
Chapter 1 Thinking Critically with Psychological Science
 Myers PSYCHOLOGY (7th Ed) Chapter 1 Thinking Critically with James A. McCubbin, PhD Clemson University Worth Publishers The Need for Psychologists, like all scientists, use the scientific method to construct
Theory. = an explanation using an integrated set of principles that organizes observations and predicts behaviors or events.
 Definition Slides Hindsight Bias = the tendency to believe, after learning an outcome, that one would have foreseen it. Also known as the I knew it all along phenomenon. Critical Thinking = thinking that
The Scientific Method. Philosophy of Science. Philosophy of Science. Epistemology: the philosophy of knowledge
 The Scientific Method Philosophy of Science Epistemology: the philosophy of knowledge Methodology: the specific approach we use to try to understand our world Philosophy of Science Positivism: the goal
STATISTICS 8 CHAPTERS 1 TO 6, SAMPLE MULTIPLE CHOICE QUESTIONS
 STATISTICS 8 CHAPTERS 1 TO 6, SAMPLE MULTIPLE CHOICE QUESTIONS Circle the best answer. This scenario applies to Questions 1 and 2: A study was done to compare the lung capacity of coal miners to the lung