ENTROPY OF ELECTROENCEPHALOGRAM (EEG) SIGNALS CHANGES WITH SLEEP STATE
|
|
|
- Penelope Laureen Owen
- 6 years ago
- Views:
Transcription

1 University of Kentucky UKnowledge University of Kentucky Master's Theses Graduate School 2006 ENTROPY OF ELECTROENCEPHALOGRAM (EEG) SIGNALS CHANGES WITH SLEEP STATE Blesy Anu Mathew University of Kentucky, Click here to let us know how access to this document benefits you. Recommended Citation Mathew, Blesy Anu, "ENTROPY OF ELECTROENCEPHALOGRAM (EEG) SIGNALS CHANGES WITH SLEEP STATE" (2006). University of Kentucky Master's Theses This Thesis is brought to you for free and open access by the Graduate School at UKnowledge. It has been accepted for inclusion in University of Kentucky Master's Theses by an authorized administrator of UKnowledge. For more information, please contact
2 ABSTRACT OF THESIS ENTROPY OF ELECTROENCEPHALOGRAM (EEG) SIGNALS CHANGES WITH SLEEP STATE We hypothesized that temporal features of EEG are altered in sleep apnea subjects compared to normal subjects. The initial aim was to develop a measure to discriminate sleep stages in normals. The longer-term goal was to apply these methods to identify differences in EEG activity in sleep apnea subjects from normals. We analyzed the C3A2 EEG and an electrooculogram (EOG) recorded from 9 normal adults awake and in rapid eye movement (REM) and non-rem sleep. The EEG signals were filtered to remove EOG contamination. Two measures of the irregularity of EEG signals, Sample Entropy (SpEn) and Tsallis Entropy, were evaluated for their ability to discriminate sleep stages. SpEn changes with sleep state, being largest in Wake. Stage 3/4 had the smallest SpEn (0.57±0.11) normalized to Wake values, followed by Stage 2 (0.72±0.09), REM (0.75±0.1) and Stage 1 (0.89±0.05). This pattern was consistent in all the polysomnogram records analyzed. Similar pattern was observed in lead O1A2 as well. We conclude that SpEn may be useful as part of a montage for assessing sleep state. We analyzed data from sleep apnea subjects having obstructive and central apnea events and have made some preliminary observations; the SpEn values were more similar across sleep stages and also high correlation with oxygen saturation was observed. KEYWORDS: EEG temporal features, EOG contamination, Sample Entropy, Tsallis Entropy, Apnea Blesy Anu Mathew 07/11/06
3 ENTROPY OF ELECTROENCEPHALOGRAM (EEG) SIGNALS CHANGES WITH SLEEP STATE By Blesy Anu Mathew Dr. Eugene Bruce Director of Thesis Dr. Abhijit Patwardhan Director of Graduate Studies
4 RULES FOR THE USE OF THESIS Unpublished thesis submitted to the Master s degree and deposited in the University of Kentucky Library are as a rule open for inspection, but are to be used only with due regard to the rights of the author. Bibliographical references may be noted, but quotations or summaries of parts may be published only with the permission of the author, and with the usual scholarly acknowledgements. Extensive copying or publication of the thesis in whole or part also requires the consent of the Dean of the Graduate School of the University of Kentucky.
5 THESIS Blesy Anu Mathew The Graduate School University of Kentucky 2006
6 ENTROPY OF ELECTROENCEPHALOGRAM (EEG) SIGNALS CHANGES WITH SLEEP STATE THESIS A thesis submitted in partial fulfillment of the requirements for the degree of Master of Science in Biomedical Engineering in the Graduate School at the University of Kentucky By Blesy Anu Mathew Lexington, Kentucky Thesis Advisor: Dr. Eugene Bruce Lexington, Kentucky 2006
7 Acknowledgments This work, though an individual work, benefited from the insights of several people. My thesis advisor, Dr. Eugene Bruce has been a wonderful teacher and the force behind my research work. I am also very grateful to Dr. Peggy Bruce for her inputs and guiding me through the various hurdles encountered during my work. Next I also want to thank my thesis committee members: Dr. Abhijit Patwardhan and Dr. Donohue for helping me improve and release a better finished product. In addition, I would also want to thank my friends and family for their support and believing in me and my work. vi
8 TABLE OF CONTENTS Page No. Acknowledgements...vi List of Figures.ix List of Files.xi Chapter One: Introduction...1 Chapter Two: Background...4 EEG Basics 4 Polysomnogram and electrode placement.7 Contamination form other channels (e.g. EOG) 8 Entropy..9 Sleep Apnea..12 Chapter Three: Methods...14 Subject Description...14 Data...14 Signal Analysis.17 Chapter Four: Results.22 Chapter Five: Discussion Chapter Six: Conclusions 44 Appendix Appendix A Appendix B Appendix C. 65 vii
9 References...79 Vita...83 viii
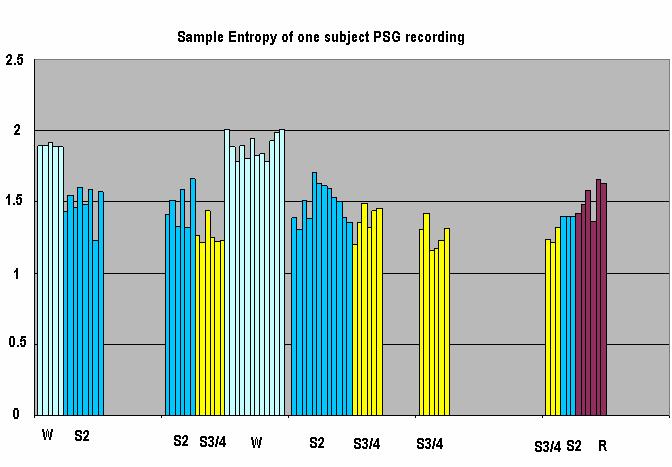
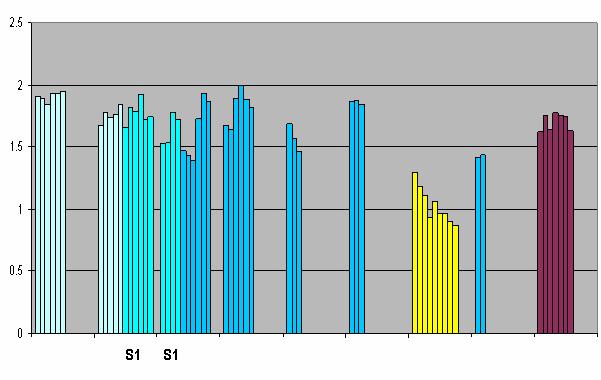
10 List of Figures Figure 1, Different Brain regions 7 Page No. Figure 2, Sample Entropy Computation 11 Figure 3, Data segment from a polysomnogram record.. 16 Figure 4, Data segment from a polysomnogram record with an artifact...17 Figure 5, MMSE Filter Design...19 Figure 6, Coherence plot between EEGF and EOGF, Correlated EOG.26 and EEGF, and EOGF and filtered EEG Figure 7, Plot of signals before and after EOG contamination...27 Figure 8, Plot of 30s segments from a polysomnogram record..28 after EOG contamination removal in the various sleep stages along with their Sample entropy values. Figure 9, Sample entropy variations after analysis of a PSG record...29 Figure 10, Normalized SpEn A variations in 9 PSG records 30 Figure 11, Plot of unnormalized SpEn of O1A2 and SpEn of C3A2 31 Figure 12, Normalized SpEn A variations in 7 sleep apnea PSG records 32 Figure 13, 10s Sample entropy variation in 450s long segment.33 along with simultaneously recorded respiration signal ix
11 Figure 14, Plot of 10sec SpEn along with the corresponding oxygen 34 saturation signal Figure 15, Plot of Cross Correlation between SpEn and oxygen saturation..35 Figure 16, 5sec sample entropy variations from Wake and Stage during OA Figure 17, The pair wise probability values.37 x
12 List of files 1. Blesy-Thesis.pdf xi
13 Chapter One: Introduction This study is based on the hypothesis that temporal features of EEG signals are altered in subjects with sleep apnea compared to normal subjects. In sleep apnea, subjects have intermittent cessation of breathing during the night. We believe that the reason behind these altered EEG features is that certain brain centers or the communication between these centers are affected. Our first objective was to develop an EEG measure that could identify differences in these temporal EEG features among sleep stages in normal subjects. Our second objective was to determine whether this technique would be able to identify differences in temporal features of EEG signals between normal subjects and sleep apnea subjects and, if necessary, to modify the technique to achieve this goal. This second goal was only partly achieved in this study due to a delay in acquiring appropriate sleep apnea data. The sleep apnea data sent to us by two other sleep laboratories lacked information critical to our study. A large sleep apnea data set satisfying our criteria was obtained from the Sleep Heart Health Study only about 3 months before this thesis was submitted. The interactions among the thalamus, cortex and the pons are responsible for EEG activity detected by EEG scalp electrodes. The interactions among these three brain regions vary among sleep stages and in this study a technique to quantify this variation in EEG among sleep stages in individual subjects has been developed. The acetylcholinergic reticular activating system (RAS), which is a portion of the reticular formation, on activation passes nerve impulses to widespread areas of the cerebral cortex directly and via the thalamus. During wakefulness, the RAS inhibits the reticular nucleus and excites the neurons of the sensory thalamus. This activation results in an uninhibited flow of signal from the lower areas of the brain to the cerebral cortex. Two types of waves are associated with wake stage, beta waves and alpha waves. Beta waves are higher in frequency (> 13Hz) and lower in amplitude than alpha waves. Beta waves are not very regular, i.e. they are desynchronous in their pattern. The brain waves become slower and increase in amplitude during relaxed wakefulness. These alpha waves (> 8Hz to 13Hz) are more synchronous in their pattern. The transition from wake to Stage 1 is characterized by an increase in the rhythmicity or regularity of the EEG. This rhythmicity is dependent on interactions between the cortex and thalamus. The first stage of sleep is characterized by theta waves (> 4 Hz to 8 Hz), which are greater in 1
14 amplitude than the alpha waves. In Stage 2, theta activity continues interspersed by two phenomena, sleep spindles, observed as a transient increase in frequency, and K complexes, observed as a transient increase in amplitude. The thalamus is very insensitive to sensory stimuli during deep sleep but when hyperpolarized in deep sleep, it shows slow intrinsic waves of activity. Thus Stage 3/4 is characterized by delta waves ( 0.5 to 4 Hz), which have a higher amplitude than alpha, beta, or theta waves. During REM sleep the acetylcholinergic RAS is again made active. The brain waves during REM are similar to wakefulness in that alpha and beta waves are predominant in both stages. The varying degree of regularity combined with the aperiodic interruptions in the lighter sleep stages, which we will describe as the complexity of the EEG, is diagnostic for clinical sleep staging. Various measures have been used to quantify and better understand EEG complexity which differs not only among the various sleep stages, but also varies within a sleep stage. Spectral power calculation using Fourier transform has been used for sleep stage analysis [17]. Spectral power estimation has also been done to study changes in EEG frequency bands in sleep apnea subjects [23, 24, 29]. In these studies multiple frequency bands and their normalized band powers [24] and ratios of the frequency bands [29] are computed. The different frequency bands were normalized and/or ratios were taken due to lack of a reference threshold to detect any changes in frequency content. Approximate entropy (ApEn (m, r, N)) has been proposed as a measure for quantifying complexity. ApEn (m, r, N) measures the logarithmic likelihood that two data sequences of m contiguous observations that are pairwise close (within r), remain close (within the same tolerance width r) on subsequent comparisons of m+1 observations. A low value of ApEn indicates predictability and regularity in a time series whereas a high value indicates random variation. ApEn has been used in short and noisy data sets [3] and has also been applied in the analysis of sleep stages [4]. Acharya, et al. showed that the group means ApEn values in each sleep stage from 8 normal subjects differed among some sleep stages [4]. However, ApEn behavior during sleep stage analysis in the individual subjects was not addressed. The first goal of the present study was to develop a method sensitive enough to measure the difference in complexity of EEG signals among sleep stages in individual subjects. This goal was achieved. Our approach also addresses the limitations of ApEn. ApEn requires each sequence on comparison to contribute a defined, non-zero probability. This requirement is met as the ApEn 2
15 algorithm counts each sequence as matching itself, avoiding the occurrence of ln (0) in the calculations [2]. This bias of ApEn makes it highly dependent on record length and is uniformly lower than expected for short records. Sample Entropy (SpEn (m, r, N)) calculates the negative logarithm of a probability associated with the time series as a whole, thereby avoiding the bias in ApEn. One of the major challenges in EEG analysis and interpretation is the identification and removal of non-cerebral potentials from the EEG. Movement of the eyes causes the electric field around the eyes to change. As this field propagates over the scalp, it is picked up and appears in the EEG as artifacts. Various techniques have been used to remove these ocular artifacts from EEG signals [9, 10]. However, removal of ocular artifacts prior to entropy calculation has not been done [4, 6]. In this work we designed an optimal, least squares, noise cancellation filter to remove the component of EEG coherent with EOG [7]. In summary, the first objective of this study was to develop a technique to discriminate temporal changes in EEG activity among sleep stages. To accomplish this objective, it was also necessary to remove contamination by EOG and ECG signals that would affect EEG analysis. This objective was approached by analyzing EEG data from 9 normal subjects. The second objective was to identify any differences between apnea and normal subjects. This objective was approached by analyzing the data from a severely apneic subject followed by analysis of 7 sleep apnea subjects. 3
16 Chapter Two: Background EEG Basics: EEG activity observed on the scalp is generated by the postsynaptic summated potentials of the underlying neurons. There are inhibitory and excitatory postsynaptic potentials. These potentials are caused by impulses arriving at the neurons from other nearby neurons. These impulses will cause release of neurotransmitters which will pass through the synaptic cleft to the receptor neurons. The interaction produces a change in the permeability of membranes to ions. During excitatory post synaptic potential (EPSP) the interaction reduces the resting potential (i.e. depolarizes the cells) and usually leads to increased permeability of ions. But in the case of an inhibitory post synaptic potential (IPSP), the interaction increases the resting potential thus hyperpolarizing the cells. The net contribution from these potentials arriving at the cortex is the recorded EEG. Fisch suggested another mechanism in addition to postsynaptic potentials that might contribute to the recorded EEG [8]. Intrinsic cellular currents mediated by ionic currents can produce long duration, high amplitude extracellular potentials. These intrinsic currents are produced by neocortical cells which undergoes burst firing after a prolonged hyperpolarization. It is likely that these extracellular potential appear in the recorded scalp EEG. The EEG activity recorded during the various stages of sleep vary in regularity. The thalamus, cortex and pons are the three main brain centers responsible for the EEG activity during sleep. The cerebrum consists of an outer layer of gray matter and deep inside the gray matter is the white matter. The outer rim of the gray matter is the cerebral cortex. The thalamus consists of a pair of oval masses of gray matter, organized into nuclei and interspersed with tracts of white matter [12]. The thalamus is the major relay station for most sensory impulses that reach the primary sensory areas of the cortex from the spinal cord, brain stem and midbrain. The thalamus contributes to the regulation of autonomic activities and the maintenance of consciousness. The axons that connect the thalamus to the cerebral cortex pass through an internal capsule, which is a thick band of white matter lateral to the thalamus. The internal medullary lamina divides the gray matter into the right and left sides of the thalamus. There are seven thalamic nuclei on 4
17 each side of the thalamus depending on the position and function. For this study, the reticular nucleus that surrounds the lateral aspect of the thalamus is worth mentioning. This nucleus monitors, filters, and integrates activities of other thalamic nuclei. According to a study conducted by McCormick, et al., several neurotransmitters that are released from the brainstem, hypothalamus, basal forebrain and cortex depolarize the thalamocortical and thalamic reticular neurons leading to an enhanced excitability of the cortical pyramidal cells. These neurotransmitters include acetylcholine (ACh), norepinephrine, serotonin, histamine, and glutamate. [14]. This enhanced excitability suppresses sleep and leads to an active state. When the thalamocortical cells are depolarized, the recorded EEG activity has low amplitude and high frequency. But when these cells are hyperpolarized, delta oscillations (0.2 4 Hz) are more prominent. Delta oscillations are also synchronized; this is achieved by recruitment of thalamic cells. Figure 1 displays the different brain regions along with certain neurotransmitters [30]. The brainstem is composed of clusters of cell bodies (gray matter) interspersed with axons (white matter). The broad region of white matter and gray matter exhibits a netlike arrangement known as the reticular formation. This extends from the upper part of the spinal cord, throughout the brainstem, and into the lower part of the diencephalon. Neurons within the reticular formation have both sensory and motor functions. Part of the reticular formation called the reticular activating system (RAS), which consists of the sensory axons, projects to the cortex. The brainstem consists of three regions: 1) the medulla oblongata, 2) pons, and 3) midbrain. The pons consists of nuclei and tracts and acts like a bridge that connects one part of the brain with one another. These connections are provided by bundles of axons. Some of these axons connect the left and right sides of the cerebellum while some are part of the ascending sensory tracts and descending motor tracts. The pons is also responsible for triggering REM sleep. The Pons-Geniculate-Occipital (PGO) waves send signals that activate eye movements. They also send signals to the spinal cord to inhibit motor activity associated with large muscles. Sleep is divided into Wake, Stage 1, Stage 2, Stage 3/4 and REM stages. NREM is composed of Stage 1, Stage 2 and Stage 3/4. Sleep consists of alternating cycles of NREM-REM cycles. Wake EEG is highly desynchronous in its pattern and contains high 5
18 frequency rhythms namely, beta waves (> 13 Hz) and alpha waves (> 8Hz to 13Hz). In Stage 1, alpha rhythm disappears and theta waves (> 4 Hz to 8 Hz) appear. Alpha waves may also recur briefly in this Stage 1 [8]. Stage 2 is characterized by theta waves interspersed with spindles and K complexes. Sleep Spindles (12-14 Hz) are characterized by a transient increase in frequency while K complexes are characterized by a transient increase in amplitude. Stage 1 and Stage 2 are also known as lighter sleep stages. Stage 3 is characterized by very low frequency waves called delta waves in the 0.5 to 4 Hz range. These waves are the most regular and have the highest amplitude than the other waves. Stage 4 is similar to Stage 3 except that Stage 4 has more delta waves present. In this study, EEG recordings in Stage 3 and Stage 4 are grouped together and referred to as Stage 3/4. REM sleep is characterized by low voltage EEG activity, rapid eye movements and reduced muscle activity. Although the EEG activity in REM appears similar to that in Wake stage, it is difficult to arouse a person from REM, suggestive of a deeper sleep stage. Sleep architecture refers to the relative amounts of time spent in the various sleep stages. Usually as sleep progresses, the duration spent in REM sleep increases while the duration spent in NREM decreases. Redline et al reported that sleep architecture varies with age, sex, ethnicity and sleep disordered breathing (SDB). They also found that men have lighter sleep compared to females and that older men have poorer sleep than older women [11]. 6

19 Figure 1: The Cortex, Thalamus and the Pons are the three main regions responsible for the different sleep stages Polysomnogram and electrode placement: A polysomnogram is an overnight test done to diagnose and evaluate sleep disorders. Various variables are recorded during this test including electroencephalogram (EEG), electrooculogram (EOG), chin electromyogram (EMG), respiratory movements (thorax and abdomen), nasal airflow, electrocardiogram (ECG), and measurements of oxygen saturation. Sleep stage classification is done using EEG, EOG, and EMG. C3A2 / C4A1 are the standard cerebral montages used for sleep stage classification. Sleep staging is done following the guidelines of Rechstchaffen and Kales [1]. 7
20 For EEG recording, electrodes are placed on the scalp of the patient. The standard electrode placement system followed is the International Electrode System [27]. Normally the frontal and/or the occipital electrodes are used for EEG recording during a polysomnogram along with the central electrodes. EEG can be recorded as a potential difference between two electrodes (known as bipolar EEG) or can be recorded at one electrode position with one or both ear electrodes as the reference. For EOG recording, one electrode is placed above one eye while the other electrode is placed below the other eye, this is done in order to record both the horizontal and vertical eye movements. Three electrodes are placed for recording the EMG activity, one in front and center of the chin and the other two underneath and on the jaw bone. This placement of electrodes gives information about the patient s movements and is also used in evaluating artifacts in other channels. Contamination for other channels (e.g. EOG): The recorded EEG is sometimes contaminated by other signals, namely ECG and/or EOG. The main contamination observed was EOG contamination. We need to first understand what the EOG is actually recording. The eye forms an electric dipole, in which case the cornea is positive and the retina is negative. When the eye moves, the electric field around the eye changes, producing an electric signal known as the EOG. As this signal propagates across the scalp, this signal appears in the recorded EEG as noise or artifacts. This contamination is a serious problem and affects EEG analysis and interpretations. Various methods have been developed to remove the ocular artifacts [9, 10]. He et al. describe a noise cancellation method based on adaptive filtering for removal of ocular artifacts. In this study a non-adaptive filter employing a least squares approach is used to remove the EOG contamination [9]. Jung et al. suggests using Independent Component analysis (ICA) for removal of eye artifacts. But in this study an optimal filter using minimum mean squared error (MMSE) approach worked satisfactorily in EOG contamination removal. Also in this study, cerebral montage C3A2 was used as the EEG recording and left EOG was used as the EOG recording for removal of contamination. These recordings were selected because C3A2 recordings were available in all the 8
21 polysomnogram recordings and also since the electrode is on the left hemisphere, it is located closer to the left EOG and hence the contamination will be more compared to that from right EOG. Entropy: Entropy is a measure of rate of information generation; usually a high value corresponds to increased irregularity or unpredictability while a low value corresponds to high regularity. In this study two types of entropy were computed, Sample entropy and Tsallis entropy. Sample entropy is a measure of the time correlation of a time series while Tsallis entropy is a measure of the probability distribution of the amplitude of a time series: Sample Entropy Richman, et al. define Sample entropy (SpEn(m, r, N)) as the negative natural logarithm of the conditional probability that two sequences similar for m points remain similar at the next point within a tolerance width r, where self matches are not included in the calculating the probability [2]. It is the bias involved in Approximate entropy (ApEn (m, r, N) computation that led to the development of Sample entropy. The calculation of ApEn (m, r, N) is done as follows [3]: For a time series of N points, { u( j) :1 j N} form N-m-1 vectors, x m (i) for { i :1 i N m + 1} where x m (i) = { u( i + k) : 0 k m 1} is the vector of m data points from u (i) to u (i+m-1) m is the length of the sequences to be compared, here m=2 is used The distance between two such vectors is defined to be d[x(i), x(j)]=max{ u(i+k) u(j+k) :0 k m-1 }, which is the maximum difference between corresponding elements of the two vectors. Let x (i) be the template vector and since the conditional probability of x(j) falling within a tolerance width of x(i) is computed, we define x(j) as the conditional vector. 9
22 Figure 2 gives an illustration of the steps above that are involved in ApEn calculation. Here, m=1 is used and we are considering i=260, so x 1 (260) is the template vector, indicated with a red circle. The conditional vector shown in the figure is indicated with a green circle (which corresponds to x (j)). The dashed line corresponds to r (which is 20% of standard deviation), and the lines above and below this line correspond to x(260)± r, respectively. Hence we compute the number of conditional vectors that fall within this tolerance width with respect to the template vector by taking the distance between the vectors. We define B m i (r) as: [Number of times x m (i) within r of x m (j) (N-m+1) -1 ], In this project r was made equal to 20% of the standard deviation of the data set And we define A m i (r) as: [Number of times x m+1 (i) within r of x m+1 (j) (N-m) -1 ], And ApEn is defined as ApEn = ( N m) N m 1 i= 1 [ln( A m i ( r) / B m i ( r))] Each sequence is counted as matching itself in order to avoid the occurrence of ln (0) in the calculations. Sample entropy was developed from ApEn to avoid this bias caused by ln (0) terms. Sample entropy is given by the following formula: N = m 1 SpEn ( N m) ln ( Ai i= 1 m ( r) / B m i ( r)) ApEn has been applied for EEG analysis in several studies [4, 5, 6]. In the study conducted by Diambra et al., ApEn was used to characterize different types of epileptic seizures (ES) [5]. In their study 8 subjects (6 males and 2 females) were studied. From the 8 subjects, 3 had a clinical history of partial seizure, 2 had generalized seizure and 3 had partial seizure turning into generalized seizure. They used data segments that were 1s long and concluded that ApEn is a good measure for temporal localization which decreased during ES, indicative of increased EEG regularity. And in the study conducted 10
![by Abasolo et al., ApEn was used in analyze EEG regularity in 10 Alzheimer s disease (AD) subjects [6].](/docs-images/74/71160547/images/23-0.jpg "They concluded that ApEn decreased (increased EEG regularity) in AD subjects on comparison with normal subjects. Acharya, et al.")
23 by Abasolo et al., ApEn was used in analyze EEG regularity in 10 Alzheimer s disease (AD) subjects [6]. They concluded that ApEn decreased (increased EEG regularity) in AD subjects on comparison with normal subjects. Acharya, et al., showed that the mean ApEn values in each sleep stage from 8 normal subjects differed among sleep stages [4]. Also in this study, various non-linear methods, Correlation Dimension (CD), Largest Lyapunov Exponent (LLE), Hurst exponent (H), and Fractal Dimension (FD), were computed for quantifying EEG complexity variation among sleep stages. They concluded that ApEn could be used as a measure of cortical activity in the various sleep stages. ApEn decreased from Wake stage to deeper sleep stage and increased in REM stage. However, ApEn behavior during sleep stage analysis in the individual subjects was not addressed. Figure 2. Illustration of the computation of Sample entropy using a template vector x(260) indicated with the red circle and the green circle indicates the conditional vector. Tsallis Entropy 11
24 Tsallis Entropy calculation is described below [25]: Let s(t) denote the temporal evolution of the EEG signals and consider a discrete-time set of amplitude values D={s(t) k,k=1,2,.k}. Let the amplitude domain D be partitioned into L equidistant boxes or disjoint amplitude intervals I v (v=1,2,3,...l) covering the space between the maximum and minimum amplitude of the EEG segment. If s o =min [D] =min{s (k), k=1, 2,.K}, s L =max [D] =max{s (k), k=1, 2,.K}, and s o <s 1, s 2. <s L Then there is set of disjoint boxes {I v = [s v-1, s v ], v=1, 2,.L} such that D = L I v v=1 Then Tsallis entropy P( I ) Where v is the probability that s (k) is in interval I v The q parameter makes Tsallis entropy unique. A low value of q (q<1) focuses on long range rhythms while bursts or spikes are detected with high values of q (q >1). In this study we used q=2. Bezerianos et al. used Tsallis entropy to study EEG activity following brain ischemia. Tsallis entropy was calculated with parameters M = 8 and q = 3. They concluded that this entropy measure is useful in characterizing local irregularity caused by spike during recovery from brain injury [26]. Sleep Apnea: An apnea was defined by Redline et al. as a complete or almost complete cessation of airflow (<25% of baseline), lasting 10 seconds or longer, while hypopnea was defined as 12
25 a decrease in the amplitude of flow or volume to less than 70% of the baseline breathing for 10s or longer without meeting the criterion for an apnea [11]. Two studies have looked into EEG spectral changes in subjects with apnea. Dingle et al., [24] detected EEG spectral changes at the termination of an apnea/hypopnea. Power spectrum and power spectral density were calculated with Fourier transform using the Welch technique. They reported that theta power decreased at the termination of an apnea/hypopnea accompanied by an increase in high frequencies. In another study conducted by Svanborg et al, [23] EEG frequency changes during apnea were studied. They reported an increase in delta band 13 sec after onset of apnea in NREM while this was not seen in REM apneas. Meadows et al., [28] reported that the response of the cerebral vasculature is drastically reduced in sleep apnea subjects compared to healthy subjects during sleep. Since hypoxia is characteristic of sleep apnea, the failure to increase cerebral blood flow in the face of hypoxia might lead to tissue hypoxia and neuronal injury. Since the scalp EEG is the net neuronal potential at the cortex, neuronal injury in sleep apnea would be expected to alter the EEG signals compared to those of normal subjects. In this study the goal is to develop a technique to discriminate any differences in the scalp EEG between normal and sleep apnea subjects. 13
26 Chapter Three: Methods Subject description: This study used data from nine healthy subjects -- 7 young female subjects (21-34yrs), one older female (49yrs), and one middle-aged male (34 yrs) -- acquired from overnight polysomnography studies done in clinical sleep labs. In two of the female subjects, their polysomnograms (PSG) from two consecutive nights (nights one and two) were analyzed. This brings the total number of PSG records analyzed to 11. The EEG, EOG, electrocardiogram (ECG), chin electromyogram (EMG) and respiratory movements were recorded. Sleep staging was done at 30s intervals based on the Rechtschaffen and Kales criteria [1]. Part of the data was obtained from the control part of a 6-degree head-down bed rest (HDBR) NASA study at the University of Kentucky (UK). Sleep staging for this data set was done by a scorer in the Neurology Department at UK. The rest of the data was obtained from the Division of Sleep Disorders Medicine at Henry Ford Hospital, Detroit, MI. Sleep staging was already done upon receipt of this data set. Sleep apnea data also was received from the Sleep Heart Health Study (SHHS) for 108 subjects satisfying the following criteria: 1) females, 2) yrs, 3) Caucasian, 4) Respiratory Disturbance Index at 4% oxygen desaturation = 15-30, 5) Body Mass Index < 30, and 6) no history of smoking or stoke. Data: Cerebral montage C3A2 was used for EEG analysis with an additional simultaneous sampling of O1A2 from four of the 11 PSG records. EEG records that were visually free from respiratory or movement artifacts and noise and had minimal EMG activity were selected. Figure 3, displays a segment that has no visual artifacts and would be selected for analysis. Figure 4 displays a segment from a polysomnogram record, with the EMG, EKG, EEG, and the thorax (respiratory motion) channels, which includes a movement artifact. This artifact shows up in all the channels and is due to the subject moving in bed. During this artifact, we can observe activity in the EMG channel, an increased heart rate, some burst activity in the EEG and saturation of the respiration signal. During data selection, the section with the artifact would not be considered. Hence the EMG, EOG, 14
27 ECG, EEG, and thorax signals would be displayed as an aid in selection of appropriate data for analysis. For each subject, one or more 30s segments of simultaneous EEG and EOG were selected from each of the different sleep stages. In situations where ECG contamination was visible in the EEG, the ECG signal was also selected. The 30s segments were extracted until the end of the first REM stage of the night. All segments that we could possibly get without artifacts were selected. The EEG and EOG records were digitized at 50Hz. The digitized EEG and EOG records were then imported into MATLAB for further analysis. A total of 270 min of data were analyzed from 11 PSGs including 32 min from Wake, 18 min from stage 1, 111 min from stage 2, 74 min from stage 3/4 and 35 min from REM stage. The average data length per subject was min. Seven of the apnea subjects obtained from SHHS were analyzed. Segments not marked as an apnea event and with oxygen saturation >90 were selected. 15

, EKG and Thorax")
28 Sampling Frequency = 250 Hz Window width ~ 95sec EOG EMG EEG EKG Thorax Figure 3: The selection of artifact-free data from a polysomnogram record. Five channels namely, EOG, EMG, C3A2 (EEG), EKG and Thorax are displayed for segment selection. 16

 was low pass filtered using a")
29 EMG Sampling frequency = 250 Hz Window width ~ 95 sec EKG EEG Thorax Figure 4: The identification of an artifact in data from a polysomnogram record. Notice the presence of a movement artifact which is evident in the EMG, EKG, EEG and Thorax channels. Signal Analysis: Preprocessing Each 30s EEG and EOG segment (sampled at 50 Hz) was low pass filtered using a Hamming-window based finite impulse response filter with a cut off at 25 Hz. These 17
30 segments were then wavelet decomposed using Daubechies wavelet of order 4 (using the MATLAB Wavelet Toolbox). A MMSE filter for noise cancellation [7] was designed for removing EOG contamination of EEG as follows: After wavelet decomposition, the EEG and EOG components below Hz, which will be referred to as EEGF and EOGF respectively from now on, were extracted as the approximation components at the appropriate decomposition level. A non-adaptive optimal noise-removal filter with EOGF as input and EEGF as output (Figure 4) was designed using the following relation: F = R -1 g where F are the filter coefficients, let us consider the filter length as p, so F= [f (0), f (1), f (2) f (p-1)] T Here, T stands for transpose, R is the autocorrelation matrix of EOGF, and g is the cross correlation vector between EEGF and EOGF. This was calculated for p+1 lags. Here elements in R and g are computed by generating a convolution matrix (provided by M. H. Hayes [22]). Each element in R and g is normalized by dividing by the total number of elements in the input signal. The number of filter coefficients were chosen after considering a number of factors: firstly, the magnitude and phase response of the filter, again the main focus was on the magnitude and phase in the 0-3 Hz range; secondly, the filter impulse response, by checking that the values of the filter coefficients decreased as the number of the filter coefficients increased.; and lastly, the coherence plot, this was done to observe the extent of reduction of EOG-EEG coherence with the designed filter. Coherence was estimated between: 1) EEGF and EOGF 2) EEGF and correlated EOG 3) EOGF and Filtered EEG where the correlated EOG is the EOG contamination signal that was removed from EEG. Filtered EEG is the signal obtained after correlated EOG is subtracted from EEGF (Figure 5). A coherence value of 0 corresponds to no temporal correlations between the two signals while a coherence value of 1 means maximum correlation. A low coherence value 18
31 is preferred between EOG-free EEG and EOGF after application of filter in the Hz region. The final EEG component (Filtered EEG) was added to the EEG detail components above Hz to form the 30s data segment used for entropy calculation. Figure 5. MMSE filter design Wavelet decomposition was done with two motives in mind, firstly, to reduce the amount of relevant EEG signal being removed during the contamination removal process. For this purpose EOG and EEG signal components below Hz were used and we assume that any correlations seen between the two signals above Hz is due to EEG power in EOG and not the other way round. Secondly, wavelet decomposition performs orthonormal decomposition, thus making it easy to add the EEG signal component below Hz back to the component above Hz after contamination removal. At times when ECG contamination was also present in the EEG signal, it was removed using the procedure similar to that for removing EOG contamination. However, wavelet decomposition of the ECG and EEG was not done at the Hz level before removing it since the ECG contains components above Hz.. 19
32 Entropy Calculation There are no guidelines for choosing the values for m and r, however the number of matches for entropy calculation can be increased by reducing m (shorter template) and increasing r (wider tolerance), but there are penalties for relaxing these criteria. In many physiological studies [4, 6, 20], the values used for m and r were 1 or 2, and 0.1 to 0.25 times the standard deviation (SD), respectively. The parameter r is set as a fraction of the SD of the data, so this helps in comparing data sets of different amplitudes. We tested Sample entropy for different values of r, e.g., for r = 0.1, 0.15, and 0.2 of the SD, and decided on r = 0.2 for analyzing the data sets. SpEn (m, r, N) was computed with m = 2, r = 20% of the standard deviation of the 30s-long EOG-free EEG. For each subject, the SpEn values in a given sleep stage were averaged. From here on, SpEn A refers to the averaged SpEn value in a sleep state. For Tsallis entropy, the maximum and minimum values for the interval (I) were defined using the maximum and minimum from the stage 3/4 data in each subject. Also, values of q=2 and M=6 were used. In the description of Tsallis entropy, it was mentioned that q>1 is to be used for observing frequent events. Since EEG is a complex signal with frequent events occurring (e.g. high frequency bursts), the parameter q was given a value >1. The parameter M was fixed after computing Tsallis entropy with varying values of M (ranging from 4 to ~100) applied to different sleep stages (e.g. Wake, REM, Stage2), and it was concluded that a value of M=6 was to be used since beyond that value for M, the Tsallis entropy of a given 30s segment stabilized. Statistical Analysis (i) ANOVA for inter stage comparisons: Wake stage had the highest SpEn A value; therefore the SpEn A values from each stage were normalized to the Wake SpEn A value in each subject. When SpEn A is normalized to Wake SpEn A, then it would be explicitly mentioned. Differences between sleep stages (i.e. Stage 1, Stage 2, Stage 3/4 and REM) were tested with analysis of variance (ANOVA) followed by a Tukey test. This was done using SYSTAT 9. Statistical significance was assessed for p <
33 (ii) A 2 factor ANOVA was also done where one factor was the 2 groups of subjects (i.e. normals and apnea) and the other factor was the four sleep stages. (iii) Paired Sample t-test for inter lead comparisons: To test for statistical significance between the SpEn A derived from the two sets of EEG leads, C3A2 and O1A2, a paired sample t-test of the SpEn A values from four subjects was done. Statistical significance was tested for p < Analysis of Sleep Apnea data The first data set received had no annotation information indicating any events (i.e. obstructive apnea (OA), central apnea (CA), or oxygen saturation information), neither was the sleep stage information provided at that point. Sample entropy for this data set was computed for 10 sec-long segments. A shorter EEG segment was used since events related to apnea occur at a smaller time scale than 30 sec. For an event to be termed as an apnea, at least 10 sec of cessation of breathing should occur [11]. Seven sleep apnea records were analyzed; these subjects (females: 46-49yrs) had a Respiratory Disturbance Index (RDI) at 5% oxygen desaturation ranging from 0 to Entropy of the sleep apnea data from SHHS was analyzed following the same methods as used for analysis of 30sec segments from normals. The motive behind this analysis was to check for differences between sleep apnea data and control data. Sample entropy was also computed in 5 sec segments in various sleep stages in a subject to understand the entropy variations occurring during an apnea event. 21
34 Chapter Four: Results Tsallis entropy values: Changes of Tsallis entropy with sleep state followed a pattern opposite to that followed by SpEn [Appendix A] and, in general, did not seem as consistent as SpEn. Also the results varied depending on the chosen values of M, q, and maximum and minimum of the interval. Hence, the Tsallis entropy computation was later discontinued and the values obtained will not be mentioned in the Results section. EOG contamination removal: The MMSE noise cancellation filter performed well in the removal of EOG contamination. Figure 6 displays the coherence plot between the various signals. Here the number of filter coefficients used was 41. The number of filter coefficients varied from 5 to 47 (0.1 sec to 0.94 sec respectively) for the various data segments. The number of filter coefficients were based on: 1) the coherence plot: the coherence between Filtered EEG and EOGF must be low 2) the impulse response of the filter: when the filter coefficient s value decreases with increase of the number of coefficients then we can settle on the number of filter coefficients. When the number of filter coefficients sufficient to model the data has been reached, then increasing the number of filter coefficients will not contribute much and they will have values close to zero. 3) the frequency response of the filter: we need to check for a decreasing gain with frequency increase and minimal phase shift introduced in the 0-3 Hz range by the filter as we want to keep any distortion introduced by the filter to the minimum. At times, though, deciding on the number of filter coefficients became difficult because the last filter coefficient was much greater than zero for all tested filter lengths. In certain segments, filter coefficients had numerous alternating cycles, and the number of filter coefficients was chosen where one period of the filter coefficients was completed. Data segments from two PSGs records had to be excluded due to the difficulty of adequate EOG contamination removal. Figure 7 displays EEGF, EOGF, Correlated EOG and Filtered EEG as a function of time. After EOG contamination 22
35 removal, the EEG segment was added to the remaining detail components and Sample entropy was computed. Sample Entropy values: Figure 8 exhibits single 30 sec segments of EEG signals from a subject in Wake, Stage 2, Stage 3/4 and REM, along with the corresponding Sample entropy values. Examination of all the 30 sec segments selected from a PSG data of any subject indicates that there is a systematic decrease in SpEn A values from Wake stage to NREM stages 1, 2, 3/4 followed by an increase in REM stage to a value close to Stage 2. Figure 9 displays the Sample entropy variations of the 30 sec segments selected from the various sleep states in one subject during one overnight recording. The pattern followed by SpEn A ( where SpEn A is the averaged SpEn value in each sleep stage) was consistent in all the 11 records. It was not possible to obtain more than 30 sec of artifact-free wake EEG and EOG signals from one female subject. Hence this subject was excluded for the statistical analysis. Also, due to the reported differences between sleep architecture of males and females [11], the male subject was excluded from the statistical analysis. The SpEn A values calculated from the remaining 9 data sets in each of the sleep stage were normalized to wake values for each subject. Figure 10 displays the normalized SpEn A variation in these 9 data sets. The means of the normalized SpEn A values in each of the sleep stages are as follows: NREM Stage 1: 0.89 ± 0.05; Stage 2: 0.72 ± 0.09; Stage 3/4: 0.57 ± 0.11; and REM: 0.75 ± The individual values for each subject are presented in Appendix B. Statistical analysis of SpEn values: The analysis of variance of normalized SpEn A values of sleep stages indicated nonequal means among the sleep stages (n=9, p<0.001). Post-hoc testing showed that normalized SpEn A of Stage 3/4 was significantly lower than the other stages (p < 0.01). In addition, normalized SpEn A was greater in Stage 1 than in Stage 2 and REM (p < 0.04). However, Stage 2 was not significantly differently from REM. 23
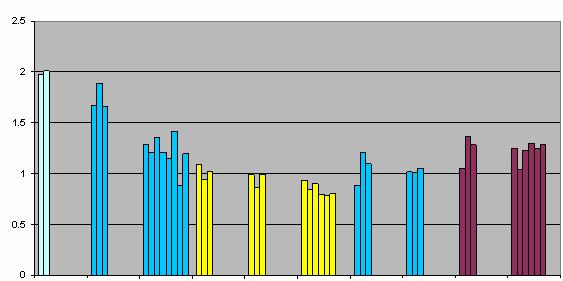
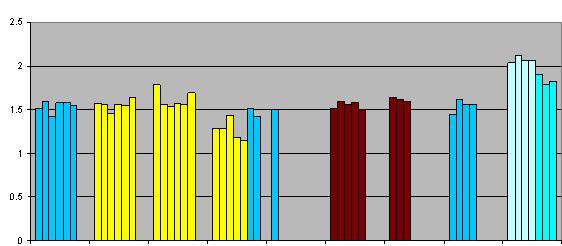
36 SpEn Interlead values: For 4 subjects data were also available from O1A2 EEG leads. To determine whether the observed variations of SpEn A with sleep stage were unique to the C3A2 leads, SpEn A was compared between the 2 sets of leads. SpEn A values calculated from O1A2 leads also follow a systematic pattern similar to that observed in SpEn A values calculated from C3A2 (Figure 11). The slope and intercept of the regression line between the SpEn A values of the C3A2 and O1A2 leads were 1.07 and -0.04, respectively. The paired t-test indicated significant differences between the SpEn A values, implying that the two pairs of leads follow similar patterns (p=0.816) of SpEn variation with sleep stages. Sample Entropy in Sleep apnea data: The SpEn A (averaged entropy value in each sleep stage from each subject) values were normalized to W. The mean normalized SpEn A values are as follows Stage 1: 0.96± 0.1, Stage 2: 0.83± 0.06, Stage 3/4: 0.75 ± 0.06 and REM: 0.91 ± Figure 12 displays the normalized SpEn A in each of the seven subjects along with the mean normalized SpEn A. On comparing the mean normalized SpEn A values obtained from the normals and sleep apnea subjects, we notice that these values in sleep apneics are higher compared to normal subjects. The plots of the Sample entropy values in each of the 7 subjects are displayed in Appendix [C]. This technique was applied and entropy computed for shorter segments in: (1) a severe sleep apnea subject with periodic-breathing-with-apnea (Figure 13), and (2) a sleep apnea subject during Wake and Stage 2 (Figure 16). From Figure 11 it can be observed that the average entropy increases as ventilation goes from being periodic to periodic-breathingwith-apnea. Also, a slight periodicity resembling the periodicity in ventilation is seen in the entropy values calculated from the EEG. Figure 14 is a plot of the 10sec SpEn values along with the oxygen saturation values corresponding to that time. Figure 15 displays the cross correlation between SpEn and the simultaneously recorded oxygen saturation from Figure (14), for lags up to 30. This result indicates the presence of a periodicity in 24
37 SpEn A that is correlated with the oscillation in oxygen saturation. Also to be mentioned here is that entropy was computed for 10s long segments. Figure 16 displays entropy values of 5s data segments in a sleep apnea subject obtained from SHHS. Here each cluster of bars is composed of at least one Obstructive apnea (OA) event lasting for a minimum of 20sec. In Figure 16 we notice that the average entropy values in Wake and Stage 2 are approximately the same. In normal subjects we noticed that Stage 2 entropy value was lower than in the Wake stage. Statistical Analysis of results from normals and Sleep apnea data: The analysis of variance of normalized SpEnA values from the two groups of subjects normals and sleep apneics - indicated non-equal means among the two groups (p<0.001). Post-hoc testing showed that normalized SpEn A of Stage 3/4 and REM of the apnea data were statistically different from the normals. Table 1 gives the pair wise comparison probabilities between the two groups in the various sleep stages. In apnea data only Stage 3/4 was statistically different from REM and Stage 1. 25
38 Figure 6: The coherence plot between EEGF and EOGF, EEGF and Correlated EOG and EOGF and filtered EEG. Notice that the coherence is reduced after EOG contamination has been removed and EEG was filtered. Here coherence between 0-5 hz has been displayed. 26
39 Figure 7: An example of signals before and after EOG contamination removal. Notice the EEGF and Filtered EEG with EOGF and Correlated EOG at the locations indicated by the arrows. 27

40 Figure 8: The Sample entropy value for 30s segments from a polysomnogram record after EOG contamination removal in the various sleep stages. All data jnnnare from one subject. 28

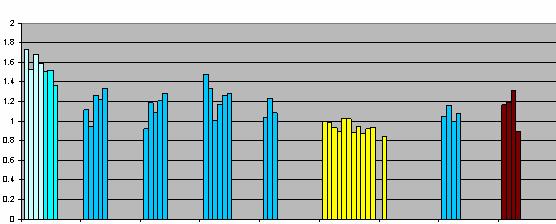
41 19min 24min 4min 24min 33min 76min 18min 35min 7min Figure 9: The Sample entropy values in the various sleep states from a single polysomnogram record. Each bar corresponds to 30s data segment. The bars that are plotted together are consecutive in time with a maximum separation of 7 mins while the separations in time of the gaps between the bars are indicated. W =Wake; R=REM. 29
42 NORMALIZED SpEn WAKE S 1 S 2 S 3/4 REM STAGES Figure 10: The individual normalized SpEn A values for each subject normalized to awake SpEn A values (thin lines) and the mean SpEn A values normalized to mean awake SpEn A values (solid line), are plotted as a function of sleep stages. 30
43 Figure 11: Plot of SpEnA of O1A2 and SpEn of C3A2. Solid line is the linear regression line. Each star symbol indicates average sample entropy from one of the 4 subjects in one sleep state. 31
44 Figure 12: The individual normalized SpEn A values for each of the seven sleep apnea subjects normalized to awake SpEn A values (dashed lines) and the mean SpEn A values normalized to mean awake SpEn A values (solid line), are plotted as a function of sleep stages. 32

45 Figure 13: 10s Sample entropy computation on 450s of continuous EEG data in a subject with severe sleep apnea. Note the simultaneously recorded respiration signal with ~ 280s of periodic breathing followed by periodic-breathing-with-apnea. 33

46 Figure 14. Displays the 10sec entropy values along with the corresponding oxygen saturation signal (uncalibrated). 34
47 Cross Correlation between SpEn and oxygen saturation Lags Figure 15: Notice the high, and periodic, normalized cross correlation between SpEn and oxygen saturation (in Figure 14) 35
 value. RDI is the number of abnormal respiratory events /hr. 36")
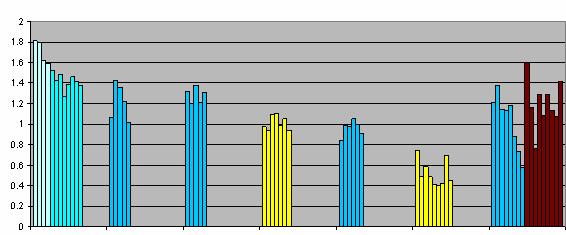
48 9 mins 190 mins Figure 16: 5s Sample entropy computed on a subject with sleep apnea. Notice the comparable average value in Wake and Stage 2. The bars placed together are consecutive in time. Each cluster contains at least one OA event at 5% oxygen desaturation indicates the Respiratory Disturbance Index (RDI) value. RDI is the number of abnormal respiratory events /hr. 36
 of the two groups. Here N refers to Normal subjects and A refers to Apnea subject.")
49 Figure 17, Table 1; The pairwise comparison probabilities between the various sleep stages from the two groups of data (9 normals and 7 sleep apnea records) are given. This is obtained from a post hoc test performed after ANOVA analysis (p<0.001) of the two groups. Here N refers to Normal subjects and A refers to Apnea subject. Notice that Stage 3/4 and REM are statistically different from the two groups. 37
50 Chapter Five: Discussion In this chapter we will try to understand and interpret our results by providing physiological explanations. Also the limitations of this study will be discussed here. The technique proposed in this study involving Sample entropy is shown to be sensitive to differences in the temporal structure of the EEG signals in the various sleep stages. Furthermore, the qualitative differences in SpEn among sleep stages were highly consistent in individual subjects after removing EOG contamination from the EEG signals. Although the data were not shown, this consistency was not seen without EOG removal. This systematic variation of SpEn among sleep stages was also observed in leads O1A2. Tsallis entropy did not vary with sleep state as consistently as Sample entropy, and its value was highly dependent on the values chosen for the parameters. For a couple of reasons Tsallis entropy was not used in this study as a means to quantify EEG complexity. Firstly, the maximum and minimum values of the amplitude intervals used in calculating Tsallis entropy were fixed based on the largest and the lowest amplitudes respectively, obtained from the segments selected. These segments were processed and contamination removed prior to finding the maximum and minimum values. This fixing of the limits is known as a fixed partitioning approach [16]. An adaptive partitioning can also be done, during which the maximum and minimum would vary depending on each 30s segment. Fixed partitioning tracks the energy change in the segment while the adaptive partitioning tracks transient events [16]. Hence, the entropy value varied depending on the approach. Secondly, depending on q, burst activity or long range rhythms can be detected, so the value of q chosen had an influence on the result observed. For this study an integrative measure of the alteration of EEG complexity with sleep states is required. Hence, due to the above reasons, the interpretation of Tsallis entropy became difficult and was no longer used in this study. Certain factors or limitations need to be mentioned before attempting to interpret the results in this study. Firstly, it was difficult at times to fix on the number of filter coefficients for the optimal filter; this made adequate removal of EOG contamination impossible. The number of filter coefficients varied from 5 to 47 (0.1 sec sec). 38
51 However when EOG contamination was not able to be removed (decided by looking at coherence plot and filter response, etc.), the 30s segment was not considered for entropy computation. Secondly, the optimal noise cancellation filter designed here takes into consideration only the linear correlation between the EEG and EOG, so any nonlinear correlations will not be removed. Thirdly, here we are assuming that left EOG will have the maximum correlation with C3A2 as the leads are placed closer to the C3A2 electrodes than the right EOG electrodes are. Also, by not considering the right EOG for EOG contamination removal we are assuming that both the electrodes are equal in magnitude but opposite in direction considering the manner in which the EOG electrodes are placed. This linear relation between the two EOG electrodes might not be the case in reality. Fourthly, to avoid much of EEG power from being removed, EOG contamination removal was limited to Hz range where the concentration of EOG power is highest. With this constraint, the EOG contamination at frequencies higher than Hz is not considered for removal. Fifthly, the data set from the HDBR study done at UK included both first night and second night PSG records. Curcio et. al conducted a study involving PSG from two consecutive nights to study the first night effect. They performed a spectral analysis of the EEG and concluded that there was a decreased sleep quality, with more Stage 1 and Wake in the first night sleep [19]. But, in another study conducted by Touissant et al., they reported that there are no differences between the first and second night and suggested that the first night data can be used for sleep analysis [21]. Curcio et al. also reported an increase in EEG complexity (increased delta power and beta power in the different brain locations) in the first night [19]. We believe that poor sleep quality is not reason enough for excluding the first night data from the analysis. In Sample entropy the high entropy in Wake stage is mainly due to the desynchronous EEG activity. The EEG becomes more regular as the subject enters into deeper NREM sleep stages (i.e. Stage 1 to Stage 3/4) causing SpEn to fall. Stage 3/4, also known as deep sleep, had predominantly delta waveforms. EEG activity is most regular in Stage 3/4. This regularity of Stage 3/4 leads to a low entropy value that we obtain. This method 39
52 was able to indicate a significant difference between REM and Stage 1. This difference hints at a possibility of some EEG signal component that is distinguishable between these stages. But, in this study no significant difference was obtained between REM and Stage 2. A possible explanation could be due to the fact that a REM cycle is almost always preceded by a Stage 2. Hence certain characteristics of Stage 2 might be present in REM which makes it difficult to find a statistical difference between them. In a study conducted by Fell et al., eight different EEG measures were calculated: spectral measures such as relative delta power, spectral edge, spectral entropy and first spectral moment, and nonlinear measures such as correlation dimension (CD), largest Lyapunov exponent (LLE) and approximated Kolmogorov entropy (K2) [17]. They concluded that the nonlinear measures performed better in discriminating sleep Stage 1 and 2, whereas spectral measures discriminated Stage 2 and 3. Therefore, no measure alone, nonlinear or spectral, was able to differentiate among the sleep states. In another study conducted by Acharya, et al., various nonlinear measures such as CD, fractal dimension, LLE, ApEn, Hurst Exponent, phase space plots and recurrence plot were used to quantify cortical function in different sleep stages [4]. Their ApEn findings were similar to ours in the sense that average ApEn decreased during the transition from Wake to NREM 1, 2 and 3/4. However, these authors did not perform post-hoc testing to determine which sleep stages had different ApEn values, and the reproducibility of the mean responses in individual subjects was not discussed. Furthermore, EOG contamination was not removed from their EEG signals. In addition, the data segment in each subject from a sleep stage was as short as 8 sec, whereas we analyzed at least 30s of data from each subject in each sleep stage. Since SpEn variations are present within a sleep state, a longer segment would provide a better estimate of SpEn of the sleep state. In a study conducted by Ferrara et al., topographical differences were found in EEG band powers between the frontal and occipital brain locations [18]. The EEG power over the time course in the first 30 min of sleep exhibited anterior-posterior gradient with maximal power at the frontal region. Normalizing each lead to itself can compensate for this sort of gradient difference. With the technique proposed in this study, this systematic 40
53 variation of SpEn among sleep stages was also observed in leads O1A2 as well as C3A2, raising the possibility of observing similar patterns on other cerebral montages. Since Sample entropy is an integrative measure of the frequencies present, it is likely that changes in certain EEG bands might not affect the entropy computation much. It might be worth seeing how the frontal EEG leads behave on application of this technique. Sample entropy variations are also seen within sleep states (Figure 9), implying that there are some brief transient alterations in the EEG properties which are picked up by Sample entropy. One possible explanation is that during a sleep state, though a net number of neurons are hyperpolarized or depolarized depending whether in sleep or wake stage respectively, there are transient changes brought about in neuron activation voltage. The mechanism(s) responsible for these transient changes is still not fully understood. It is also possible that alterations in these short-lived changes could be altered which might be indicative of some sleep disorder. This possibility is what led to the computation of Sample entropy for segments shorter than 30s in subjects with SDB. The observations and discussions with sleep apnea data are preliminary but some tentative conclusions can be drawn based on the results of ANOVA analyses. Only Stage 3/4 was statistically different from REM and Stage 1; all other stages were statistically similar. Hence SpEn across sleep stages in sleep apnea subjects were more similar compared to normal subjects. Further validation of these results is necessary, as discussed later under the suggestions for future studies. An interpretation of the observations made from the 7 SHHS sleep apnea records analyzed is complicated by the following concerns: 1) though the subjects were apneics, initially no apnea events were present in the segments selected also oxygen saturation level was 90, hence a conclusion cannot be drawn with the results obtained from analyzing data from normal subjects, 2) the age difference between the two groups is large. Hence further analysis requires a control group in the age range (40-50yrs) and an apnea group with segments containing apnea events. On applying this technique on a severely sleep apnea subject with segments of periodic breathing and periods of periodic-breathing-with-apnea, we noticed an increase in the 41
54 average entropy value in the apnea segment. Now this increase was observed on comparing an EEG data segment corresponding to periodic breathing and with a segment corresponding to periodic-breathing-with-apnea within one subject. Another observation made in our study was a possible periodicity in entropy during the periodic-breathingwith-apnea. A possible explanation could be that, due to the activity of the respiratory center in the brainstem, during hyperventilation the neurons that project upwards towards the cortex are modulated. This modulation of the neurons shows up in the EEG activity measured at the cortex. It is still not clear whether ventilation drives the entropy changes or the EEG changes drive the ventilation. But it is also possible that a third signal drives them both. It would be interesting to see how entropy behaves on comparing sleep apnea subject with a healthy control subject. Abasolo et al., [6] studied EEG activity in Alzheimer s disease (AD) subjects and reported a decrease in ApEn in AD subjects compared to a (healthy) control group. Hence a neuronal disorder (due to AD) caused a change in the EEG activity recorded at the scalp and a decrease in ApEn. This decrease in ApEn observed in AD subjects might also be true for subjects with sleep apnea. Since hypoxia is characteristic of sleep apnea, a neuronal disorder might occur causing a similar change in the EEG activity observed. A significant difference was seen only at the parietal electrode. However, the variation of ApEn within a subject was not mentioned Another possible explanation could be that the partial pressure of oxygen is affected as the oxygen saturation falls and rises during periodic-breathing-with-apnea. This affects the PO 2 (pressure of oxygen in a mixture) in the brain which then alters the firing of the neurons. Since the activation potentials of the brain neurons are affected, the EEG activity measured at the scalp is altered. Also, on applying the techniques discussed in this work in a subject with occasional apnea but without periodic breathing (a less severe case of apnea), we observed an increase in the average entropy value such that both stages (Wake and Stage 2) had comparable SpEn. One possible explanation of this rise in average entropy value among sleep stages could be the following: In an apnea subject, the centers of the brain responsible for inducing deeper sleep and inhibiting high frequency EEG activity are 42
55 suppressed. This causes the brain to stay in an alert state and very rarely enters into deeper sleep stages. The lighter sleep stages (Stage 1 and Stage 2) occur when the sleep inducing centers attempt to get the patient into deep sleep but are not successful as its functions are still suppressed. This leads to an entropy value close to Wake stage. To understand how this average entropy value described compares to a healthy subject, we hypothesize that a decrease in entropy might be seen in apnea subjects compared to normal subjects because of the following reason: apnea subjects rarely enter into deep sleep in night, hence they are drowsy and sleepy during daytime (a possible compensation mechanism due to the suppression of deep sleep in the night). This sleepiness and drowsiness appears in the EEG and causes the entropy to be lower compared to a normal subject s Wake stage (as they are more alert). Then in apnea subjects, the entropy of the remaining sleep stages averages closer to the Wake stage entropy value. 43
56 Chapter Six: Conclusions 1 Sample Entropy is sensitive to differences in the temporal structure of the EEG signals in the various sleep stages. 2 Sample Entropy follows a systematic pattern of variation with sleep state in individual normal subjects. As sleep progresses from Wake, there is a steady decrease in SpEn in Stage 1, through Stage 2, into Stage 3/4 and then an increase in REM to a value close to Stage 2 3 This pattern was also observed in EEG signals from O1A2 leads as well as C3A2 leads. It is possible that this pattern can be seen in other leads also. 4 SpEn in each sleep stage was statistically different from that in other sleep stages, except that SpEn in Stage 2 and REM were not different. 5 This technique can be used as an aid in sleep stage identification but SpEn would not be sufficient, by itself, to determine sleep stage. 6 Preliminary results from sleep apnea data show that SpEn is more similar across sleep stages in apneics and is correlated with oscillations in ventilation/oxygen saturation in a limited sample of subjects. Hence this technique can be used in further understanding EEG activity in apnea subjects 44
57 Suggested Future Directions: 1) Intra stage variations within a sleep state were observed during analysis of normal records. Maybe these transient variations are not present or inhibited in subjects with apnea. Hence it would be of interest to understand or identify any pattern, if present, followed by sample entropy computed in shorter segments. I suggest further exploring Markov Modeling and its application in this purpose. Data from normal subjects and also subjects with sleep apnea might be used. 2) Based on the comparable average entropy value within a subject with sleep apnea between sleep Stage 2 and Wake, I suggest confirming whether this is observed in sleep apnea subjects in general. We could start by comparing average SpEn in the various sleep stage in a number of subjects. Since the subjects in SHHS are from a higher age group (40-50yrs), it is also essential to form a control group in the same age group for comparison. 3) Based on the rise of entropy within a subject when ventilation changed from periodic breathing to periodic-breathing-with-apnea, I would suggest confirming this rise in entropy by applying in more than one subject. We can check whether entropy is able to detect the alteration in EEG activity during all apnea events in at any levels of oxygen saturation. 45

58 Appendix A Sample and Tsallis entropy variations in the various sleep stages from a PSG record. Notice the generally opposite pattern followed by the two entropies. W = Wake, S1 = Stage 1, S2 = Stage 2, S 3/4 = Stage 3/4, R = REM 46
59 Appendix B The entropy variation in the various sleep stages in the data selected from 11 PSG recording are given below. Record # 1, Q76A Given below is the table containing the entropy values belonging to the various sleep stages. Also Cluster 1 is followed by Cluster 2 then Cluster 3, 4 and finally 5. The plot of the entropy values in given below the table Cluster 1 Cluster 2 Cluster 3 Cluster 4 Cluster 5 Stage Ent Stage Ent Stage Ent Stage Ent Stage Ent W S S S3/ S3/ W S S S3/ S3/ W S S S3/ S3/ W S S S3/ S2 1.4 W S S S3/ S2 1.4 S S S S3/ S S S3/4 1.3 S R 1.42 S S3/ S R 1.48 S S3/ S R 1.57 S S3/ S R 1.36 S S3/ S R 1.65 S S3/ S R 1.63 S W 2.01 S3/ W 1.96 S3/ W 1.78 S3/ W 1.94 S3/ W 1.81 S3/ W 1.94 S3/ W 1.83 W 1.83 W 1.79 W 1.93 W 1.99 W
60 48
61 Record # 2, COB0304 Cluster 1 Cluster 2 Cluster 3 Cluster 4 Cluster 5 Stage Ent Stage Ent Stage Ent Stage Ent Stage Ent W 1.91 W 1.67 S S S W W 1.78 S S S W W 1.74 S S S W 1.93 W 1.76 S S W W 1.84 S S W S S S S S S S S S S S S Cluster 6 Cluster 7 Cluster 8 Cluster 9 Stage Ent Stage Ent Stage Ent Satge Ent S S3/ S R S S3/ S R S S3/ R S3/ R S3/ R S3/ R S3/ R S3/ S3/
62 50

63 Record # 3, Q74A Cluster 1 Cluster 2 Cluster 3 Cluster 4 Stage Ent Stage Ent Stage Ent Stage Ent W S S3/ S3/ S S S3/ S3/ S S S3/ S3/ S S3/ S S S S3/ S S S S3/ S S S S3/ S R S S3/ S R S S3/ S R S S3/ S3/ R S3/ S3/ R S3/ S3/ R
64 Record # 4, Q77B Cluster 1 Cluster 2 Cluster 3 Cluster 4 Cluster 5 Stage Ent Stage Ent Stage Ent Stage Ent Stage Ent W S S S3/ S3/ W S S S3/ S3/ S S S3/ S3/ S S S S S Cluster 6 Cluster 7 Cluster 8 Cluster 9 Cluster 10 Stage Ent Stage Ent Stage Ent Stage Ent Stage Ent S3/ S S R R S3/ S S R R S3/ S S R R S3/ R S3/ R S3/ R
65 53

66 Record # 5, Q75B Cluster 1 Cluster 2 Cluster 3 Cluster 4 Cluster 5 Stage Ent Stage Ent Stage Ent Stage Ent Stage Ent W W S S S W W S S S W W S S S W W S3/ S3/ S W W S3/ S3/ R W S3/ S3/ R S S3/ S3/ R S S3/ S3/ R S S3/ R S S R S
67 Record # 6, Q71B Cluster 1 Cluster 2 Cluster 3 Cluster 4 Cluster 5 Stage Ent Stage Ent Stage Ent Stage Ent Stage Ent S S3/ S3/ S/ S S S3/ S3/ S3/ S S3/ S3/ S3/ S S3/ S3/ S3/ S S3/ S3/ S3/ S S3/ S3/ S S Cluster 6 Cluster 7 Cluster 8 Cluster 9 Stage Ent Stage Ent Stage Ent Satge Ent R R S W R R S W R R S W R S W R S S S
68 56
69 Record # 7, Q74B Cluster 1 Cluster 2 Cluster 3 Cluster 4 Cluster 5 Stage Ent Stage Ent Stage Ent Stage Ent Stage Ent W S S S S W S S S S W S S S S S S S S S S S S S S S Cluster 6 Cluster 7 Cluster 8 Cluster 9 Stage Ent Stage Ent Stage Ent Satge Ent S3/ S3/ S R S3/ S R S3/ S R S3/ S S3/ S3/ S3/ S3/ S3/ S3/ S3/
70 58

71 Record # 8, Q78B Cluster 1 Cluster 2 Cluster 3 Cluster 4 Cluster 5 Cluster 6 Cluster 7 Stage Ent Stage Ent Stage Ent Stage Ent Stage Ent Stage Ent Stage Ent W 1.49 S S S3/ S2 0.9 S R 1.36 W 1.78 S S S3/ S R 1.29 W 1.74 S2 1.5 S S3/ R 1.42 W 1.76 S S3/ S R 1.29 W 1.81 S S3/ S R 1.39 S S3/ S R 1.52 S3/ S3/4 0.8 S3/ S3/ S3/ S3/
72 Record # 9, COBO321 Cluster 1 Cluster 2 Cluster 3 Cluster 4 Cluster 5 Cluster 6 Cluster 7 Stage Ent Stage Ent Stage Ent Stage Ent Stage Ent Stage Ent Stage Ent W S S S3/ S S3/ S W S S S3/ S S3/ S W S S S3/ S S3/ S W S S S3/ S S3/ S S S S S3/ S S3/ S S S3/ S S3/ S S S3/ S3/ S S S3/ S S S3/ R S R S R S R R R R R
73 61
74 Record # 10, Q75A Cluster 1 Cluster 2 Cluster 3 Cluster 4 Cluster 5 Cluster 6 Stage Ent Stage Ent Stage Ent Stage Ent Stage Ent Stage Ent W S3/ S S3/ S R S S3/ S S3/ S R S S3/ S S3/ S R S S3/ S S R S S3/ S S R S S3/ S S R S S3/ S S S S3/ S S S S3/ S S S S S S S S S
75 63

76 Record # 11, COB0311 Cluster 1 Cluster 2 Cluster 3 Cluster 4 Cluster 5 Stage Ent Stage Ent Stage Ent Stage Ent Stage Ent W S S S S W S3/ S S S W S3/ S S R W S3/ S R S S3/ S R S S3/ S3/ S S3/ S S3/ S S S S S
77 Appendix C Analysis of Sleep apnea data from SHHS Also given below each plot are the normalized SpEn A values Record # , Age=48yrs, oxy. Desat = Cluster 1, 2, 3, 4, 5, 6, 7 belong to the seven clusters of bars. Given below is a table, of the sleep stages and the corresponding entropy values Cluster 1 Cluster 2 Cluster 3 Cluster 4 Cluster 5 Cluster 6 Cluster 7 Stage Ent Stag Ent Stag Ent Stag Ent Stag Ent Stag Ent Stage Ent W S S S3/ S S R W S S3/ S S R W S S3/ S2 1.5 R W S2 1.7 S3/ R W S3/ W S3/ W S3/ S3/ S3/ S3/ S3/ S3/

78 Here W=Wake, S1=Stage1, S2=Stage 2, S3/4=Stage 3/4, R=REM. The subsequent graphs have the corresponding stages in the same shades of gray. S1 S2 S3/4 R
79 Record # , Age=48yrs, oxy. Desat= The plot of the sleep stages given below along with the entropy values are given in the next page. As a function of time Cluster 1 is followed by Cluster 2, then Cluster 3, Cluster 4 and finally Cluster 5. Cluster 1 Cluster 2 Cluster 3 Cluster 4 Cluster 5 Stage Ent Stage Ent Stage Ent Stage Ent Stage Ent W W S3/ S3/ R W 1.91 W S3/ S3/ R W S W R S S S S S S S S S S S S S S S S S

80 S1 S2 S3/4 R
81 Record # , age=46, 5% oxy. Desat= 5.69 Here there are 11 Clusters of bars and they are placed in 2 tables Cluster 1 Cluster 2 Cluster 3 Cluster 4 Stage Ent Stage Ent Stage Ent Stage Ent W S S S3/ W S S S3/ W S S S3/ W S S3/ W S S3/ W S S3/ W S W S W W W W W W W W W W W Cluster 5 Cluster 6 Cluster 7 Cluster 8 Cluster 9 Cluster 10 Cluster 11 Stage Ent Stage Ent Stage Ent Stage Ent Stage Ent Stage Ent Stage Ent S S3/ R S S3/ S R S S3/ R S S3/ S R S S3/ R S3/ S3/ S R S S3/ R S3/ S3/ S R S3/ R S R S3/ R S R S R R R


82 The sleep stages in the graph above is followed by the second graph placed below S1 S2 S3/4 R
83 Record # , Age= 47, 5 % oxy. Desat= 0 Cluster 1 Cluster 2 Cluster 3 Cluster 4 Stage Ent Stage Ent Stage Ent Stage Ent W S3/ S3/ R W S3/ S3/ R W S3/ S3/ R W S3/ S3/ R W S3/ S3/ R W S3/ S3/ R W S3/ S3/ R W S3/ S3/ R W S3/ S3/ R W S3/ S3/ R W S S3/ R W S S3/ R W S3/ R S S3/ R S S3/ R S R S R S R S R R R R

84 S1 S2 S3/4 R
85 Record # , Age= 49yrs, 5% oxy. Desat=9.189 Cluster 1 Cluster 2 Cluster 3 Cluster 4 Cluster 5 Cluster 6 Stage Ent Stage Ent Stage Ent Stage Ent Stage Ent Stage Ent W W S S R R W W S S R R S S S R S S S R S S S R S S S S S S S S S S S S S S S S S S S S S S S S

86 S1 S2 S3/4 R
87 Record # , Age=49yrs, oxy. Desat=0 Cluster 1 Cluster 2 Cluster 3 Cluster 3 (continued) Stage Ent Stage Ent Stage Ent Stage Ent W S S S3/ W S S S3/ W S S S3/ W S S S3/ W S S S3/ W S S S3/ W S S3/ W S3/ S3/ W S3/ S3/ W S3/ S W S3/ S W S3/ S W S3/ R W S3/ R W S3/ R W S3/ R W S3/ R W S3/ R W S R S R S S3/

88 S1 S2 S3/4 R
89 Record # , age=45, 5% oxy. Desat= Here normalization was done to a W stage after the first NREM/REM cycle, due to unavailability of W without an apnea event before the first cycle. Cluster 1 Cluster 2 Cluster 3 Cluster 4 Cluster 5 Cluster 6 Cluster 7 Stage Ent Stage Ent Stage Ent Stage Ent Stage Ent Stage Ent Stage Ent S S3/ S R R 1.45 R W S S3/ S R R 1.69 R W S S3/ S R R 1.61 R W S S3/ S R R 1.73 R W S S3/ S R R 1.66 R W S S3/ S R R 1.68 R W S S3/4 1.1 S R R 1.66 R S S3/4 1.3 S R R 1.83 R S S3/ S R R S3/ S R R S R R S R R R R R

90 S1 S2 S3/4 R
AGING AND SLEEP STAGE EFFECTS ON ENTROPY OF ELECTROENCEPHALOGRAM SIGNALS
 University of Kentucky UKnowledge University of Kentucky Master's Theses Graduate School 2008 AGING AND SLEEP STAGE EFFECTS ON ENTROPY OF ELECTROENCEPHALOGRAM SIGNALS Swetha Vennelaganti University of
CHAPTER 6 INTERFERENCE CANCELLATION IN EEG SIGNAL
 116 CHAPTER 6 INTERFERENCE CANCELLATION IN EEG SIGNAL 6.1 INTRODUCTION Electrical impulses generated by nerve firings in the brain pass through the head and represent the electroencephalogram (EEG). Electrical
Physiology Unit 2 CONSCIOUSNESS, THE BRAIN AND BEHAVIOR
 Physiology Unit 2 CONSCIOUSNESS, THE BRAIN AND BEHAVIOR In Physiology Today What the Brain Does The nervous system determines states of consciousness and produces complex behaviors Any given neuron may
Lesson 14. The Nervous System. Introduction to Life Processes - SCI 102 1
 Lesson 14 The Nervous System Introduction to Life Processes - SCI 102 1 Structures and Functions of Nerve Cells The nervous system has two principal cell types: Neurons (nerve cells) Glia The functions
The AASM Manual for the Scoring of Sleep and Associated Events
 The AASM Manual for the Scoring of Sleep and Associated Events Summary of Updates in Version 2.1 July 1, 2014 The American Academy of Sleep Medicine (AASM) is committed to ensuring that The AASM Manual
Physiology Unit 2 CONSCIOUSNESS, THE BRAIN AND BEHAVIOR
 Physiology Unit 2 CONSCIOUSNESS, THE BRAIN AND BEHAVIOR What the Brain Does The nervous system determines states of consciousness and produces complex behaviors Any given neuron may have as many as 200,000
Neurons, Synapses and Signaling. Chapter 48
 Neurons, Synapses and Signaling Chapter 48 Warm Up Exercise What types of cells can receive a nerve signal? Nervous Organization Neurons- nerve cells. Brain- organized into clusters of neurons, called
CHAPTER 48: NERVOUS SYSTEMS
 CHAPTER 48: NERVOUS SYSTEMS Name I. AN OVERVIEW OF NERVOUS SYSTEMS A. Nervous systems perform the three overlapping functions of sensory input, integration, and motor output B. Networks of neurons with
Introduction to EEG del Campo. Introduction to EEG. J.C. Martin del Campo, MD, FRCP University Health Network Toronto, Canada
 Introduction to EEG J.C. Martin, MD, FRCP University Health Network Toronto, Canada What is EEG? A graphic representation of the difference in voltage between two different cerebral locations plotted over
Neural Communication. Central Nervous System Peripheral Nervous System. Communication in the Nervous System. 4 Common Components of a Neuron
 Neural Communication Overview of CNS / PNS Electrical Signaling Chemical Signaling Central Nervous System Peripheral Nervous System Somatic = sensory & motor Autonomic = arousal state Parasympathetic =
states of brain activity sleep, brain waves DR. S. GOLABI PH.D. IN MEDICAL PHYSIOLOGY
 states of brain activity sleep, brain waves DR. S. GOLABI PH.D. IN MEDICAL PHYSIOLOGY introduction all of us are aware of the many different states of brain activity, including sleep, wakefulness, extreme
Neural Basis of Motor Control
 Neural Basis of Motor Control Central Nervous System Skeletal muscles are controlled by the CNS which consists of the brain and spinal cord. Determines which muscles will contract When How fast To what
CONTROL OF MOVEMENT BY THE BRAIN A. PRIMARY MOTOR CORTEX:
 CONTROL OF MOVEMENT BY THE BRAIN A. PRIMARY MOTOR CORTEX: - responsible for - like somatosensory cortex, primary motor cortex show (motor homunculus) - amount of cortex devoted to different parts of body
A. PRIMARY MOTOR CORTEX: - responsible for - like somatosensory cortex, primary motor cortex show (motor homunculus) - amount of cortex devoted to
 - amount of cortex devoted to") CONTROL OF MOVEMENT BY THE BRAIN A. PRIMARY MOTOR CORTEX: - responsible for - like somatosensory cortex, primary motor cortex show (motor homunculus) - amount of cortex devoted to different parts of body
CONTROL OF MOVEMENT BY THE BRAIN A. PRIMARY MOTOR CORTEX: - responsible for - like somatosensory cortex, primary motor cortex show (motor homunculus) - amount of cortex devoted to different parts of body
STRUCTURAL ORGANIZATION OF THE NERVOUS SYSTEM
 STRUCTURAL ORGANIZATION OF THE NERVOUS SYSTEM STRUCTURAL ORGANIZATION OF THE BRAIN The central nervous system (CNS), consisting of the brain and spinal cord, receives input from sensory neurons and directs
EEG and some applications (seizures and sleep)
") EEG and some applications (seizures and sleep) EEG: stands for electroencephalography and is a graphed representation of the electrical activity of the brain. EEG is the recording of electrical activity
EEG and some applications (seizures and sleep) EEG: stands for electroencephalography and is a graphed representation of the electrical activity of the brain. EEG is the recording of electrical activity
Chapter 17. Nervous System Nervous systems receive sensory input, interpret it, and send out appropriate commands. !
 Chapter 17 Sensory receptor Sensory input Integration Nervous System Motor output Brain and spinal cord Effector cells Peripheral nervous system (PNS) Central nervous system (CNS) 28.1 Nervous systems
EEG Arousals: Scoring Rules and Examples. A Preliminary Report from the Sleep Disorders Atlas Task Force of the American Sleep Disorders Association
 EEG Arousals: Scoring Rules and Examples A Preliminary Report from the Sleep Disorders Atlas Task Force of the American Sleep Disorders Association Sleep in patients with a number of sleep disorders and
NEURAL MECHANISMS OF SLEEP (p.1) (Rev. 3/21/07)
 (Rev. 3/21/07)") NEURAL MECHANISMS OF SLEEP (p.1) (Rev. 3/21/07) 1. Revisitation of Bremer s 1936 Isolated Brain Studies Transected the brain: a. Cut between the medulla and the spinal cord ( encephale isole ) Note: recall
NEURAL MECHANISMS OF SLEEP (p.1) (Rev. 3/21/07) 1. Revisitation of Bremer s 1936 Isolated Brain Studies Transected the brain: a. Cut between the medulla and the spinal cord ( encephale isole ) Note: recall
Basics of Polysomnography. Chitra Lal, MD, FCCP, FAASM Assistant professor of Medicine, Pulmonary, Critical Care and Sleep, MUSC, Charleston, SC
 Basics of Polysomnography Chitra Lal, MD, FCCP, FAASM Assistant professor of Medicine, Pulmonary, Critical Care and Sleep, MUSC, Charleston, SC Basics of Polysomnography Continuous and simultaneous recording
Guided Reading Activities
 Name Period Chapter 28: Nervous Systems Guided Reading Activities Big idea: Nervous system structure and function Answer the following questions as you read modules 28.1 28.2: 1. Your taste receptors for
EEG Sleep Circadian rhythms Learning Objectives: 121, 122
 EEG Sleep Circadian rhythms Learning Objectives: 121, 122 Zoltán Lelkes Electroencenphalography Hans Berger pen time amplifier electrodes 1 The waves of the EEG gamma > 30 Hz beta: 13-30 Hz Mental activity:
Nervous System and Brain Review. Bio 3201
 Nervous System and Brain Review Bio 3201 Dont worry about: glial cells Oligodendrocytes Satelite cells etc Nervous System - Vital to maintaining homeostasis in organisms - Comprised of : brain, spinal
Lecture 8. Arousal & Sleep. Cogs17 * UCSD
 Lecture 8 Arousal & Sleep Cogs17 * UCSD Arousal in the Brain Stimulated by sensory input Initiated, maintained endogenously Basal Forebrain Delivers ACh throughout cortex Arousal in the Brain Lateral Hypothalamus
Sleep stages. Awake Stage 1 Stage 2 Stage 3 Stage 4 Rapid eye movement sleep (REM) Slow wave sleep (NREM)
 Slow wave sleep (NREM)") Sleep stages Awake Stage 1 Stage 2 Stage 3 Stage 4 Rapid eye movement sleep (REM) Slow wave sleep (NREM) EEG waves EEG Electrode Placement Classifying EEG brain waves Frequency: the number of oscillations/waves
Sleep stages Awake Stage 1 Stage 2 Stage 3 Stage 4 Rapid eye movement sleep (REM) Slow wave sleep (NREM) EEG waves EEG Electrode Placement Classifying EEG brain waves Frequency: the number of oscillations/waves
Practical 3 Nervous System Physiology 2 nd year English Module. Dept. of Physiology, Carol Davila University of Medicine and Pharmacy
 Electroencephalography l h (EEG) Practical 3 Nervous System Physiology 2 nd year English Module Dept. of Physiology, Carol Davila University of Medicine and Pharmacy What is EEG EEG noninvasively records
EEG Electrode Placement
 EEG Electrode Placement Classifying EEG brain waves Frequency: the number of oscillations/waves per second, measured in Hertz (Hz) reflects the firing rate of neurons alpha, beta, theta, delta Amplitude:
biological psychology, p. 40 The study of the nervous system, especially the brain. neuroscience, p. 40
 biological psychology, p. 40 The specialized branch of psychology that studies the relationship between behavior and bodily processes and system; also called biopsychology or psychobiology. neuroscience,
pdf NIH Overview Back to Course Schedule (The material below on the neuron is adapted from:
 1 of 8 6/20/2012 10:25 AM Sleep and Dreams Sleep and the Brain pdf NIH Overview 3.2-3.3 Some Basic Background: Back to Course Schedule (The material below on the neuron is adapted from: http://vv.carleton.ca/~neil/neural/neuron-a.html)
-Ensherah Mokheemer. -Amani Nofal. -Loai Alzghoul
 -1 -Ensherah Mokheemer -Amani Nofal -Loai Alzghoul 1 P a g e Today we will start talking about the physiology of the nervous system and we will mainly focus on the Central Nervous System. Introduction:
Nervous System C H A P T E R 2
 Nervous System C H A P T E R 2 Input Output Neuron 3 Nerve cell Allows information to travel throughout the body to various destinations Receptive Segment Cell Body Dendrites: receive message Myelin sheath
Sleep-Wake Cycle I Brain Rhythms. Reading: BCP Chapter 19
 Sleep-Wake Cycle I Brain Rhythms Reading: BCP Chapter 19 Brain Rhythms and Sleep Earth has a rhythmic environment. For example, day and night cycle back and forth, tides ebb and flow and temperature varies
Organization of the nervous system. [See Fig. 48.1]
![Organization of the nervous system. [See Fig. 48.1]](/thumbs/90/103926552.jpg "Organization of the nervous system. [See Fig. 48.1]") Nervous System [Note: This is the text version of this lecture file. To make the lecture notes downloadable over a slow connection (e.g. modem) the figures have been replaced with figure numbers as found
Nervous System [Note: This is the text version of this lecture file. To make the lecture notes downloadable over a slow connection (e.g. modem) the figures have been replaced with figure numbers as found
Restoring Communication and Mobility
 Restoring Communication and Mobility What are they? Artificial devices connected to the body that substitute, restore or supplement a sensory, cognitive, or motive function of the nervous system that has
CSE 599E Lecture 2: Basic Neuroscience
 CSE 599E Lecture 2: Basic Neuroscience 1 Today s Roadmap The neuron doctrine (or dogma) Neuronal signaling The electrochemical dance of ions Action Potentials (= spikes) Synapses and Synaptic Plasticity
Sincerely, Ms. Paoloni and Mrs. Whitney
 Dear Students, Welcome to AP Psychology! We will begin our course of study focusing on the nervous system with a particular emphasis on how the brain and neurotransmitters influence our behaviors. In preparation
EPILEPTIC SEIZURE DETECTION USING WAVELET TRANSFORM
 EPILEPTIC SEIZURE DETECTION USING WAVELET TRANSFORM Sneha R. Rathod 1, Chaitra B. 2, Dr. H.P.Rajani 3, Dr. Rajashri khanai 4 1 MTech VLSI Design and Embedded systems,dept of ECE, KLE Dr.MSSCET, Belagavi,
Neural Basis of Motor Control. Chapter 4
 Neural Basis of Motor Control Chapter 4 Neurological Perspective A basic understanding of the physiology underlying the control of voluntary movement establishes a more comprehensive appreciation and awareness
Analysis of the Effect of Cell Phone Radiation on the Human Brain Using Electroencephalogram
 ORIENTAL JOURNAL OF COMPUTER SCIENCE & TECHNOLOGY An International Open Free Access, Peer Reviewed Research Journal Published By: Oriental Scientific Publishing Co., India. www.computerscijournal.org ISSN:
Circadian rhythm and Sleep. Radwan Banimustafa MD
 Circadian rhythm and Sleep Radwan Banimustafa MD Homeostasis Maintenance of equilibrium by active regulation of internal states: Cardiovascular function (blood pressure, heart rate) Body temperature Food
Warm-up. Warm-up. Warm-up. Chapter 48. Why do animals need a nervous system? 3/9/2012. Nervous System
 Warm-up Objective: Explain how membrane potentials arise from differences in ion concentrations between cells' content and the extracellular fluid. Warm-up: Cells from this structure migrate to other parts
Body control systems. Nervous system. Organization of Nervous Systems. The Nervous System. Two types of cells. Organization of Nervous System
 Body control systems Nervous system Nervous system Quick Sends message directly to target organ Endocrine system Sends a hormone as a messenger to the target organ Slower acting Longer lasting response
Omar Sami. Muhammad Abid. Muhammad khatatbeh
 10 Omar Sami Muhammad Abid Muhammad khatatbeh Let s shock the world In this lecture we are going to cover topics said in previous lectures and then start with the nerve cells (neurons) and the synapses
Ch 13: Central Nervous System Part 1: The Brain p 374
 Ch 13: Central Nervous System Part 1: The Brain p 374 Discuss the organization of the brain, including the major structures and how they relate to one another! Review the meninges of the spinal cord and
Acetylcholine (ACh) Action potential. Agonists. Drugs that enhance the actions of neurotransmitters.
 Action potential. Agonists. Drugs that enhance the actions of neurotransmitters.") Acetylcholine (ACh) The neurotransmitter responsible for motor control at the junction between nerves and muscles; also involved in mental processes such as learning, memory, sleeping, and dreaming. (See
Acetylcholine (ACh) The neurotransmitter responsible for motor control at the junction between nerves and muscles; also involved in mental processes such as learning, memory, sleeping, and dreaming. (See
Separation Of,, & Activities In EEG To Measure The Depth Of Sleep And Mental Status
 Separation Of,, & Activities In EEG To Measure The Depth Of Sleep And Mental Status Shah Aqueel Ahmed 1, Syed Abdul Sattar 2, D. Elizabath Rani 3 1. Royal Institute Of Technology And Science, R. R. Dist.,
The Nervous System. Neuron 01/12/2011. The Synapse: The Processor
 The Nervous System Neuron Nucleus Cell body Dendrites they are part of the cell body of a neuron that collect chemical and electrical signals from other neurons at synapses and convert them into electrical
Principles of Anatomy and Physiology
 Principles of Anatomy and Physiology 14 th Edition CHAPTER 14 The Brain and Cranial Nerves Introduction The purpose of the chapter is to: 1. Understand how the brain is organized, protected, and supplied
The Nervous System. B. The Components: 1) Nerve Cells Neurons are the cells of the body and are specialized to carry messages through an process.
 Nerve Cells Neurons are the cells of the body and are specialized to carry messages through an process.") The Nervous System A. The Divisions: 1) The Central Nervous System includes the and. The brain contains billions of nerve cells called, and trillions of support cells called. 2) The Peripheral Nervous
The Nervous System A. The Divisions: 1) The Central Nervous System includes the and. The brain contains billions of nerve cells called, and trillions of support cells called. 2) The Peripheral Nervous
THE CENTRAL NERVOUS SYSTEM. The Brain & Spinal Cord
 THE CENTRAL NERVOUS SYSTEM The Brain & Spinal Cord Review: Nervous System Parallel Distributed Processing Composition of the CNS Nuclei: Clusters of neurons in the CNS ( neighborhoods ) Fiber Tracts/Pathways:
Page 1. Neurons Transmit Signal via Action Potentials: neuron At rest, neurons maintain an electrical difference across
 Chapter 33: The Nervous System and the Senses Neurons: Specialized excitable cells that allow for communication throughout the body via electrical impulses Neuron Anatomy / Function: 1) Dendrites: Receive
Primary Functions. Monitor changes. Integrate input. Initiate a response. External / internal. Process, interpret, make decisions, store information
 NERVOUS SYSTEM Monitor changes External / internal Integrate input Primary Functions Process, interpret, make decisions, store information Initiate a response E.g., movement, hormone release, stimulate/inhibit
Chapter 9. Nervous System
 Chapter 9 Nervous System Central Nervous System (CNS) vs. Peripheral Nervous System(PNS) CNS Brain Spinal cord PNS Peripheral nerves connecting CNS to the body Cranial nerves Spinal nerves Neurons transmit
Name: Period: Chapter 2 Reading Guide The Biology of Mind
 Name: Period: Chapter 2 Reading Guide The Biology of Mind The Nervous System (pp. 55-58) 1. What are nerves? 2. Complete the diagram below with definitions of each part of the nervous system. Nervous System
Chapter 11 Introduction to the Nervous System and Nervous Tissue Chapter Outline
 Chapter 11 Introduction to the Nervous System and Nervous Tissue Chapter Outline Module 11.1 Overview of the Nervous System (Figures 11.1-11.3) A. The nervous system controls our perception and experience
Human Nervous System. The nervous system has three functions
 Chapter 37 Human Nervous System The nervous system has three functions 1) Receive sensory input from both external and internal stimuli 2) Perform integration. (Coordinating all of the various inputs of
Exclusion criteria and outlier detection
 1 Exclusion criteria and outlier detection 1 2 Supplementary Fig. 1 31 subjects complied with the inclusion criteria as tested during the familiarization session. The upper part of the figure (ovals) indicates
All questions below pertain to mandatory material: all slides, and mandatory homework (if any).
.") ECOL 182 Spring 2008 Dr. Ferriere s lectures Lecture 6: Nervous system and brain Quiz Book reference: LIFE-The Science of Biology, 8 th Edition. http://bcs.whfreeman.com/thelifewire8e/ All questions below
ECOL 182 Spring 2008 Dr. Ferriere s lectures Lecture 6: Nervous system and brain Quiz Book reference: LIFE-The Science of Biology, 8 th Edition. http://bcs.whfreeman.com/thelifewire8e/ All questions below
THE NERVOUS SYSTEM CONCEPT 2: THE VERTEBRATE BRAIN IS REGIONALLY SPECIALIZED
 THE NERVOUS SYSTEM CONCEPT 2: THE VERTEBRATE BRAIN IS REGIONALLY SPECIALIZED Images of the human brain in popular culture almost always focus on the cerebrum, the part of the brain whose surface lies just
Physiological and Physical Basis of Functional Brain Imaging 6. EEG/MEG. Kâmil Uludağ, 20. November 2007
 Physiological and Physical Basis of Functional Brain Imaging 6. EEG/MEG Kâmil Uludağ, 20. November 2007 Course schedule 1. Overview 2. fmri (Spin dynamics, Image formation) 3. fmri (physiology) 4. fmri
Physiology of Sleep. Dr Nervana
 Physiology of Sleep Dr Nervana Objectives: 1. Explain the difference between sleep and coma. 2. Define NREM (non-rapid eye movement, SWS) and REM (rapid eye movement) sleep. 3. Describe how NREM and REM
Topic/Objective: Identify the structures and functions of
 Cornell Notes Textbook Diagrams Video notes Topic/Objective: Identify the structures and functions of the human nervous system. Name: Class/Period: Date: Essential Question: How does the nervous system
Emotion Detection Using Physiological Signals. M.A.Sc. Thesis Proposal Haiyan Xu Supervisor: Prof. K.N. Plataniotis
 Emotion Detection Using Physiological Signals M.A.Sc. Thesis Proposal Haiyan Xu Supervisor: Prof. K.N. Plataniotis May 10 th, 2011 Outline Emotion Detection Overview EEG for Emotion Detection Previous
Unit 3: The Biological Bases of Behaviour
 Unit 3: The Biological Bases of Behaviour Section 1: Communication in the Nervous System Section 2: Organization in the Nervous System Section 3: Researching the Brain Section 4: The Brain Section 5: Cerebral
Simplest method: Questionnaires. Retrospective: past week, month, year, lifetime Daily: Sleep diary What kinds of questions would you ask?
 Spencer Dawson Simplest method: Questionnaires Retrospective: past week, month, year, lifetime Daily: Sleep diary What kinds of questions would you ask? Did you nap during the day? Bed time and rise time
Organization of the nervous system. The withdrawal reflex. The central nervous system. Structure of a neuron. Overview
 Overview The nervous system- central and peripheral The brain: The source of mind and self Neurons Neuron Communication Chemical messengers Inside the brain Parts of the brain Split Brain Patients Organization
Visualizing Psychology
 Visualizing Psychology by Siri Carpenter & Karen Huffman PowerPoint Lecture Notes Presentation Chapter 2: Neuroscience and Biological Foundations Siri Carpenter, Yale University Karen Huffman, Palomar
Supplementary Appendix
 Supplementary Appendix This appendix has been provided by the authors to give readers additional information about their work. Supplement to: Brown EN, Lydic R, Schiff ND, et al. General anesthesia, sleep,
III. Studying The Brain and Other Structures
 III. Studying The Brain and Other Structures 1. Accidents (case study) In 1848, a railroad worker named Phineas Gage was involved in an accident that damaged the front part of his brain. Gage s doctor
Chapter 6 Section 1. The Nervous System: The Basic Structure
 Chapter 6 Section 1 The Nervous System: The Basic Structure Essential Question: How does studying the biology of the brain give us an understanding of our behavior? Draw or type 2 things you already know
The Nervous System. Functions of the Nervous System input gathering To monitor occurring inside and outside the body Changes =
 The Nervous System Functions of the Nervous System input gathering To monitor occurring inside and outside the body Changes = To process and sensory input and decide if is needed output A response to integrated
Chapter 11: Functional Organization of Nervous Tissue
 Chapter 11: Functional Organization of Nervous Tissue I. Functions of the Nervous System A. List and describe the five major nervous system functions: 1. 2. 3. 4. 5. II. Divisions of the Nervous System
Electroencephalography
 The electroencephalogram (EEG) is a measure of brain waves. It is a readily available test that provides evidence of how the brain functions over time. The EEG is used in the evaluation of brain disorders.
Parts of the Brain. Hindbrain. Controls autonomic functions Breathing, Heartbeat, Blood pressure, Swallowing, Vomiting, etc. Upper part of hindbrain
 Parts of the Brain The human brain is made up of three main parts: 1) Hindbrain (or brainstem) Which is made up of: Myelencephalon Metencephalon 2) Midbrain Which is made up of: Mesencephalon 3) Forebrain
Practice test 1 spring 2011 copy
 Practice test 1 spring 2011 copy Student: 1. The fundamental units of the nervous system are nerve cells, called: A. axons B. glial cells C. neurons D. neurotransmitters 2. Which of the following is NOT
Embryological origin of thalamus
 diencephalon Embryological origin of thalamus The diencephalon gives rise to the: Thalamus Epithalamus (pineal gland, habenula, paraventricular n.) Hypothalamus Subthalamus (Subthalamic nuclei) The Thalamus:
The Central Nervous System I. Chapter 12
 The Central Nervous System I Chapter 12 The Central Nervous System The Brain and Spinal Cord Contained within the Axial Skeleton Brain Regions and Organization Medical Scheme (4 regions) 1. Cerebral Hemispheres
Composed of gray matter and arranged in raised ridges (gyri), grooves (sulci), depressions (fissures).
, grooves (sulci), depressions (fissures).") PSYC1020 Neuro and Pysc Notes Structure Description Major Functions Brainstem Stemlike portion of the brain, continuous with diencephalon above and spinal cord below. Composed of midbrain, pons, medulla
PSYC1020 Neuro and Pysc Notes Structure Description Major Functions Brainstem Stemlike portion of the brain, continuous with diencephalon above and spinal cord below. Composed of midbrain, pons, medulla
The Nervous System PART B
 7 The Nervous System PART B PowerPoint Lecture Slide Presentation by Jerry L. Cook, Sam Houston University ESSENTIALS OF HUMAN ANATOMY & PHYSIOLOGY EIGHTH EDITION ELAINE N. MARIEB The Reflex Arc Reflex
Biological Rhythms, Sleep, and Dreaming. Elaine M. Hull
 Biological Rhythms, Sleep, and Dreaming Elaine M. Hull Rhythms of Waking and Sleeping Animals generate 24 hour cycles of wakefulness and sleep. Some animals generate endogenous circannual rhythms (yearly
Chapter 7. The Nervous System: Structure and Control of Movement
 Chapter 7 The Nervous System: Structure and Control of Movement Objectives Discuss the general organization of the nervous system Describe the structure & function of a nerve Draw and label the pathways
Chapter 7. Objectives
 Chapter 7 The Nervous System: Structure and Control of Movement Objectives Discuss the general organization of the nervous system Describe the structure & function of a nerve Draw and label the pathways
Bursting dynamics in the brain. Jaeseung Jeong, Department of Biosystems, KAIST
 Bursting dynamics in the brain Jaeseung Jeong, Department of Biosystems, KAIST Tonic and phasic activity A neuron is said to exhibit a tonic activity when it fires a series of single action potentials
Ameen Alsaras. Ameen Alsaras. Mohd.Khatatbeh
 9 Ameen Alsaras Ameen Alsaras Mohd.Khatatbeh Nerve Cells (Neurons) *Remember: The neural cell consists of: 1-Cell body 2-Dendrites 3-Axon which ends as axon terminals. The conduction of impulse through
14 - Central Nervous System. The Brain Taft College Human Physiology
 14 - Central Nervous System The Brain Taft College Human Physiology Development of the Brain The brain begins as a simple tube, a neural tube. The tube or chamber (ventricle) is filled with cerebrospinal
I: To describe the pyramidal and extrapyramidal tracts. II: To discuss the functions of the descending tracts.
 Descending Tracts I: To describe the pyramidal and extrapyramidal tracts. II: To discuss the functions of the descending tracts. III: To define the upper and the lower motor neurons. 1. The corticonuclear
1. Processes nutrients and provides energy for the neuron to function; contains the cell's nucleus; also called the soma.
 1. Base of brainstem; controls heartbeat and breathing 2. tissue destruction; a brain lesion is a naturally or experimentally caused destruction of brain tissue 3. A thick band of axons that connects the
Neurons. Pyramidal neurons in mouse cerebral cortex expressing green fluorescent protein. The red staining indicates GABAergic interneurons.
 Neurons Pyramidal neurons in mouse cerebral cortex expressing green fluorescent protein. The red staining indicates GABAergic interneurons. MBL, Woods Hole R Cheung MSc Bioelectronics: PGEE11106 1 Neuron
PD233: Design of Biomedical Devices and Systems
 PD233: Design of Biomedical Devices and Systems (Lecture-7 Biopotentials- 2) Dr. Manish Arora CPDM, IISc Course Website: http://cpdm.iisc.ac.in/utsaah/courses/ Electromyogram (EMG) Skeletal muscles are
Chapter 45: Synapses Transmission of Nerve Impulses Between Neurons. Chad Smurthwaite & Jordan Shellmire
 Chapter 45: Synapses Transmission of Nerve Impulses Between Neurons Chad Smurthwaite & Jordan Shellmire The Chemical Synapse The most common type of synapse used for signal transmission in the central
Normal EEG of wakeful resting adults of years of age. Alpha rhythm. Alpha rhythm. Alpha rhythm. Normal EEG of the wakeful adult at rest
 Normal EEG of wakeful resting adults of 20-60 years of age Suthida Yenjun, M.D. Normal EEG of the wakeful adult at rest Alpha rhythm Beta rhythm Mu rhythm Vertex sharp transients Intermittent posterior
The Nervous System. The right half of the brain controls the left half of the body. This means that only left handed people are in their right mind.
 The Nervous System The right half of the brain controls the left half of the body. This means that only left handed people are in their right mind. Central Nervous System Made up of brain and spinal cord
Sleep. No longer think of sleep as an isolated block of time at the end of the day. Sleep is not just the absence of wakefulness,
 Sleep Neil B. Kavey, MD Columbia Presbyterian Medical Center No longer think of sleep as an isolated block of time at the end of the day. Sleep is not just the absence of wakefulness, It is an active physiologic
2/22/2012. Cerebrum CNS
 Chapter 8 outline CNS: Consists of???? Structural organization of the brain Cerebrum Diencephalon Midbrain and hindbrain Spinal cord tracts Cranial and spinal nerves Receives input from???? neurons Directs
EEG Instrumentation, Montage, Polarity, and Localization
 EEG Instrumentation, Montage, Polarity, and Localization 2 Krikor Tufenkjian The Source of EEG The source of the EEG potentials recorded from the scalp is the excitatory and inhibitory postsynaptic potentials
To understand AD, it is important to
 To understand AD, it is important to know a bit about the brain. This part of Unraveling the Mystery gives an inside view of the normal brain, how it works, and what happens during aging. The brain is
Neuroscience Optional Lecture. The limbic system the emotional brain. Emotion, behaviour, motivation, long-term memory, olfaction
 Neuroscience Optional Lecture The limbic system the emotional brain Emotion, behaviour, motivation, long-term memory, olfaction Emotion Conscious experience intense mental activity and a certain degree
EEG, ECG, EMG. Mitesh Shrestha
 EEG, ECG, EMG Mitesh Shrestha What is Signal? A signal is defined as a fluctuating quantity or impulse whose variations represent information. The amplitude or frequency of voltage, current, electric field
The Sonification of Human EEG and other Biomedical Data. Part 3
 The Sonification of Human EEG and other Biomedical Data Part 3 The Human EEG A data source for the sonification of cerebral dynamics The Human EEG - Outline Electric brain signals Continuous recording