BIOSTATISTICS. Lecture 1 Data Presentation and Descriptive Statistics. dr. Petr Nazarov
|
|
|
- Emmeline Cole
- 5 years ago
- Views:
Transcription


1 Genomcs Research Unt BIOSTATISTICS Lecture 1 Data Presentaton and Descrptve Statstcs dr. Petr Nazarov petr.nazarov@lh.lu
 Fnal examnaton (tasks n Excel) Goal: your FINAL knowledge and sklls n bologcal data analyss!")
2 COURSE OVERVIEW Organzaton: 60h = 12 days Theoretcal course (30h) Theory Explanatons to all Common work Practcal course (30h) Indvdual work Indvdual explanatons Fnal examnaton (questons) 3 ntermedate tests scored 0-3 (9 ponts n total) Fnal examnaton (tasks n Excel) Goal: your FINAL knowledge and sklls n bologcal data analyss! not markng of your work Data Mcrosoft Excel Software wth Data Analyss Add-In nstalled moodle, & 2

3 COURSE OVERVIEW Recommended Lterature presentaton methodology 3


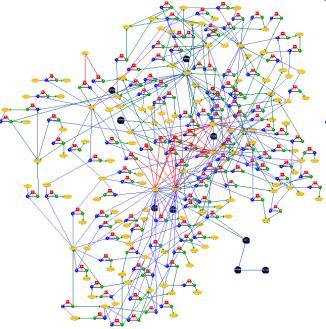
4 COURSE OVERVIEW Introducton Drug dscovery Any bologcal study where numbers are measured or reported BIOSTATISTICS: why and where? Genomcs and systems bology Publc health 4
5 OUTLINE Lecture 1 Data and statstc elements, varables and observaton types of data (qualtatve and quanttatve) and scales (nomnal, ordnal, nterval, rato) Descrptve statstcs: tabular and graphcal presentaton frequency dstrbuton pe, bar chart and hstogram representaton cumulatve dstrbutons crosstabulaton and scatter dagram Descrptve statstcs: numercal measures measures of locaton: mean, mode, medan, quantles/quartles/percentles measure of varablty: varance, standard devaton, MAD, coeffcent of varaton other measures: skewness of dstrbuton z-score. Chebyshev's theorem. Detecton of outlers. Exploratory analyss. 5 number summary box plot Measure of assocaton between two varables covarance and correlaton coeffcent nterpretaton of correlaton coeffcent 5
6 DATA AND STATISTICS Elements, varables, and observatons, data scales and types 6
 Age Source Internet Fame Score Wllam Gates III 1 M 40 53 Mcrosoft 9.5 Warren Buffett 2 M 37 79 Berkshre Hathaway 6.")

7 observaton DATA AND STATISTICS Data: Elements, Varables, and Observatons Data The facts and fgures collected, analyzed, and summarzed for presentaton and nterpretaton. elements varables Person Place Gender Net Worth ($BIL) Age Source Internet Fame Score Wllam Gates III 1 M Mcrosoft 9.5 Warren Buffett 2 M Berkshre Hathaway 6.6 Carlos Slm Helu 3 M telecom 2.1 Lawrence Ellson 4 M Oracle 2.8 Ingvar Kamprad 5 M IKEA 2.4 Karl Albrecht 6 M Ald 3.6 Mukesh Amban 7 M petrochemcals 4.4 Lakshm Mttal 8 M steel 5.4 Theo Albrecht 9 M Ald 1.5 Amanco Ortega 10 M Zara 1.9 Jm Walton 11 M Wal-Mart 3.9 Alce Walton 12 F Wal-Mart 2.9 Can we consder the Place as element? IFS 3 log10 N 4.5 7


8 Quanttatve Qualtatve DATA AND STATISTICS Data Scales and Types Data scales: Nomnal scale data use labels or names to dentfy an attrbute of an element. Ex.1: Ex.2: Male, Female Rooms #: 101, 102, 103, Ordnal scale data exhbt the propertes of nomnal data and the order or rank of the data s meanngful. Ex.1: Ex.2: Wnners: The 1 st, 2 nd, 3 rd places Marks: A, B, C, Interval scale data demonstrate the propertes of ordnal data and the nterval between values s expressed n terms of a fxed unt of measure Ex.1: Examnaton score Ex.2: Internet fame score Rato scale data demonstrate all the propertes of nterval data and the rato of two values s meanngful. Ex.1: Ex.2: Weght Prce 8


9 DATA AND STATISTICS Task: Defne the Scales Person Place Gender Net Worth ($BIL) Age Source Internet Fame Score Wllam Gates III 1 M Mcrosoft 9.5 Warren Buffett 2 M Berkshre Hathaway 6.6 Carlos Slm Helu 3 M telecom 2.1 Lawrence Ellson 4 M Oracle 2.8 Ingvar Kamprad 5 M IKEA 2.4 Karl Albrecht 6 M Ald 3.6 Mukesh Amban 7 M petrochemcals 4.4 Lakshm Mttal 8 M steel 5.4 Theo Albrecht 9 M Ald 1.5 Amanco Ortega 10 M Zara 1.9 Jm Walton 11 M Wal-Mart 3.9 Alce Walton 12 F Wal-Mart 2.9 IFS 3 log10 N 4.5? 9
10 TABULAR AND GRAPHICAL PRESENTATION Frequency dstrbuton, bar and pe charts, hstogram, cumulatve frequency dstrbuton, scatter plot 10
11 TABULAR AND GRAPHICAL PRESENTATION Frequency Dstrbuton Frequency dstrbuton A tabular summary of data showng the number (frequency) of tems n each of several nonoverlappng classes. Marks A B C B A B B A B C Frequency dstrbuton: Mark Frequency A 3 B 5 C 2 Total 10 Relatve frequency dstrbuton: Mark Frequency A 0.3 B 0.5 C 0.2 Total 1 In MS Excel use the followng functons: Percent frequency dstrbuton: Mark Frequency A 30% B 50% C 20% Total 100% =COUNTIF(data,element) to get number of elements found n the data area =SUM(data) to get the sum of the values n the data area 11
12 TABULAR AND GRAPHICAL PRESENTATION pancreatts.xls Example: Pancreatts Study The role of smokng n the etology of pancreatts has been recognzed for many years. To provde estmates of the quanttatve sgnfcance of these factors, a hosptal-based study was carred out n eastern Massachusetts and Rhode Island between 1975 and patents who had a hosptal dscharge dagnoss of pancreatts were ncluded n ths unmatched case-control study. The control group conssted of 217 patents admtted for dseases other than those of the pancreas and blary tract. Rsk factor nformaton was obtaned from a standardzed ntervew wth each subject, conducted by a traned ntervewer. adapted from Chap T. Le, Introductory Bostatstcs Pancreatts patents: Smokers Ex-smokers Ex-smokers Smokers Smokers Smokers Ex-smokers Smokers Smokers Smokers Smokers Smokers Ex-smokers Smokers Smokers Ex-smokers Smokers Smokers Ex-smokers Ex-smokers Smokers Ex-smokers Smokers Smokers Never Smokers Ex-smokers Ex-smokers Smokers Ex-smokers Smokers Smokers Ex-smokers Smokers Smokers Smokers Smokers Smokers Ex-smokers Smokers Smokers Smokers Smokers Smokers Smokers Smokers Smokers Smokers Smokers Never Smokers Smokers Smokers 12


13 FREQUENCY DISTRIBUTION Relatve Frequency Dstrbuton Frequency dstrbuton A tabular summary of data showng the number (frequency) of tems n each of several nonoverlappng classes. Relatve frequency dstrbuton A tabular summary of data showng the fracton or proporton of data tems n each of several nonoverlappng classes. Sum of all values should gve 1 Estmaton of probablty dstrbuton When number of experments n, R.F.D. P.D. pancreatts.xls Frequency dstrbuton: Smokng Cases Controls Never 2 56 Ex-smokers Smokers Total Relatve frequency dstrbuton: Smokng Cases Controls Never Ex-smokers Smokers Total 1 1 In Excel use the followng functons: =COUNTIF(data,element) to get number of elements found n the data area =SUM(data) to get the sum of the values n the data area 13

14 TABULAR AND GRAPHICAL PRESENTATION Crosstabulaton pancreatts.xls Dsease Smokng other pancreatts Total Ex-smokers Never Smokers Total Dsease Smokng other pancreatts Total Ex-smoker Never Smoker Total In Excel use the followng steps: Insert Pvot Table Set the range, ncludng the headers of the data Select output and set layout by drag-and-droppng the names nto the table 14
15 Percentage TABULAR AND GRAPHICAL PRESENTATION Bar and Pe Charts pancreatts.xls other Smokng Influence on Pancreatts other pancreatts Never Ex-smoker Smoker pancreatts Never Ex-smoker Smoker Never Ex-smoker Smoker Smokng In MS Excel use the followng steps: Try to avod usng n scentfc reports. For publc/busness presentatons only! Insert Column Set data range (both columns of Percent freq. dstrbuton) Insert Pe Set data range (one columns of Percent freq. dstrbuton) 15


16 TABULAR AND GRAPHICAL PRESENTATION Example: Mce Data Seres Tordoff MG, Bachmanov AA Survey of calcum & sodum ntake and metabolsm wth bone and body composton data Project symbol: Tordoff3 Accesson number: MPD:103 mce.xls 790 mce from dfferent strans parameter Startng age Endng age Startng weght Endng weght Weght change Bleedng tme Ionzed Ca n blood Blood ph Bone mneral densty Lean tssues weght Fat weght 16

17 TABULAR AND GRAPHICAL PRESENTATION The followng are weghts n grams for 970 mce: Hstogram mce.xls Sorted weghts show that the values are n the grams. Let us dvde the weght nto the bns bns Weght,g Frequency >= More 0 17
18 TABULAR AND GRAPHICAL PRESENTATION Now, let us use bn-sze = 1 gram Hstogram Bn Frequency More 0 Frequency Hstogram 10 In Excel use the followng steps: Specfy the column of bns (nterval) upper-lmts Data Data Analyss Hstrogram select the nput data, bns, and output (Analyss ToolPak should be nstalled) use Chart Wzard Columns to vsualze the results Weght, g 18
19 Endng weght TABULAR AND GRAPHICAL PRESENTATION Scatter Plot mce.xls Let us look on mutual dependency of the Startng and Endng weghts. 60 Scatter plot In Excel use the followng steps: Select the data regon Use Insert XY (Scatter) Startng weght 19
20 NUMERICAL MEASURES Populaton and sample, measures of locaton, quantles, quartles and percentles, measures of varablty, z-score, detecton of outlers, exploraton data analyss, box plot, covaraton, correlaton 20
 POPULATION µ mean 2 varance N number of elements (usually N= ) SAMPLE x m, mean s 2 varance n number of elements Sample statstc A numercal value")


21 NUMERICAL MEASURES Populaton and Sample Populaton parameter A numercal value used as a summary measure for a populaton (e.g., the populaton mean, varance 2, standard devaton ) POPULATION µ mean 2 varance N number of elements (usually N= ) SAMPLE x m, mean s 2 varance n number of elements Sample statstc A numercal value used as a summary measure for a sample (e.g., the sample mean m, the sample varance s 2, and the sample standard devaton s) mce.xls 790 mce from dfferent strans All exstng laboratory Mus musculus ID Stran Sex Startng age Endng age Startng weght Endng weght Weght change Bleedng tme Ionzed Ca n blood Blood ph Bone mneral densty Lean tssues weght Fat weght 1 129S1/SvImJ f S1/SvImJ f S1/SvImJ f S1/SvImJ f S1/SvImJ f S1/SvImJ f S1/SvImJ f S1/SvImJ f S1/SvImJ f S1/SvImJ f S1/SvImJ m S1/SvImJ m S1/SvImJ m S1/SvImJ m S1/SvImJ m S1/SvImJ m S1/SvImJ m S1/SvImJ m S1/SvImJ m


22 NUMERICAL MEASURES Measures of Locaton Mean A measure of central locaton computed by summng the data values and dvdng by the number of observatons. Medan A measure of central locaton provded by the value n the mddle when the data are arranged n ascendng order. Mode A measure of locaton, defned as the value that occurs wth greatest frequency. x p m x N x n n x true Weght Mode = 23 Medan = 23.5 Mean =
23 NUMERICAL MEASURES Measures of Locaton mce.xls Hstogram and p.d.f. approxmaton medanmean mode Female proporton p f = Densty weght, g Bleedng tme In Excel use the followng functons: = AVERAGE(data) = MEDIAN(data) = MODE(data) Densty medan = 55 mean = 61 mode = N = 760 Bandwdth =
% of the observatons are greater than or equal to ths value.")
, and thrd quartle,")
24 NUMERICAL MEASURES Quantles, Quartles and Percentles Percentle A value such that at least p% of the observatons are less than or equal to ths value, and at least (100-p)% of the observatons are greater than or equal to ths value. The 50- th percentle s the medan. Quartles The 25th, 50th, and 75th percentles, referred to as the frst quartle, the second quartle (medan), and thrd quartle, respectvely. In Excel use the followng functons: =PERCENTILE(data,p) Weght Q 1 = 21 Q 2 = 23.5 Q 3 = 39 24


25 NUMERICAL MEASURES Measures of Varablty Interquartle range (IQR) A measure of varablty, defned to be the dfference between the thrd and frst quartles. Varance A measure of varablty based on the squared devatons of the data values about the mean. Standard devaton A measure of varablty computed by takng the postve square root of the varance. IQR Q 3 Q 1 populaton sample s 2 N x 2 2 x m n 1 2 Sample standard devaton s Populaton standard devaton 2 s 2 Weght IQR = 18 Varance = St. dev. = 17.9 In Excel use the followng functons: =VAR(data) =STDEV(data) =STDEV.S(data) 25
 MAD s a robust measure of the varablty of a unvarate sample of quanttatve data.")
26 NUMERICAL MEASURES Measures of Varablty Coeffcent of varaton A measure of relatve varablty computed by dvdng the standard Standard devaton devaton by the mean. 100% Weght Mean CV = 57% Medan absolute devaton (MAD) MAD s a robust measure of the varablty of a unvarate sample of quanttatve data. MAD medan x medan x Set 1 Set Set 1 Set 2 Mean Medan St.dev MAD

27 NUMERICAL MEASURES Measures of Varablty Skewness A measure of the shape of a data dstrbuton. Data skewed to the left result n negatve skewness; a symmetrc data dstrbuton results n zero skewness; and data skewed to the rght result n postve skewness. Skewness n n 1 n 2 s x m 3 adapted from Anderson et al Statstcs for Busness and Economcs 27

28 NUMERICAL MEASURES Measure of Assocaton between 2 Varables Covarance A measure of lnear assocaton between two varables. Postve values ndcate a postve relatonshp; negatve values ndcate a negatve relatonshp. xy populaton x x y y N s xy sample x xy y n 1 mce.xls Endng weght vs. Startng weght Endng weght Startng weght In Excel use functon: =COVAR(data) s xy = 39.8 hard to nterpret 28
29 NUMERICAL MEASURES Measure of Assocaton between 2 Varables Correlaton (Pearson product moment correlaton coeffcent) A measure of lnear assocaton between two varables that takes on values between -1 and +1. Values near +1 ndcate a strong postve lnear relatonshp, values near -1 ndcate a strong negatve lnear relatonshp; and values near zero ndcate the lack of a lnear relatonshp. populaton x x y y xy xy N x y x y r xy s s x xy s y sample x x y y s s n 1 x y Endng weght In Excel use functon: =CORREL(data) r xy = Startng weght mce.xls 29
30 NUMERICAL MEASURES Correlaton Coeffcent If we have only 2 data ponts n x and y datasets, what values would you expect for correlaton b/w x and y? Wkpeda 30
31 NUMERICAL MEASURES z-score and Detecton of Outlers z-score A value computed by dvdng the devaton about the mean (x x) by the standard devaton s. A z-score s referred to as a standardzed value and denotes the number of standard devatons x s from the mean. Chebyshev s theorem For any data set, at least (1 1/z 2 ) of the data values must be wthn z standard devatons from the mean, where z any value > 1. z x m s Weght z-score For ANY dstrbuton: At least 75 % of the values are wthn z = 2 standard devatons from the mean At least 89 % of the values are wthn z = 3 standard devatons from the mean At least 94 % of the values are wthn z = 4 standard devatons from the mean At least 96% of the values are wthn z = 5 standard devatons from the mean 31

32 NUMERICAL MEASURES Detecton of Outlers For bell-shaped dstrbutons: Approxmately 68 % of the values are wthn 1 st.dev. from mean Approxmately 95 % of the values are wthn 2 st.dev. from mean Almost all data ponts are nsde 3 st.dev. from mean Outler An unusually small or unusually large data value. For bell-shaped dstrbutons data ponts wth z >3 can be consdered as outlers. Example: Gaussan dstrbuton Weght z-score

33 NUMERICAL MEASURES Task: Detecton of Outlers mce.xls Usng Excel, try to dentfy outler mce on the bass of Weght change varable z x m s For bell-shaped dstrbutons data ponts wth z >3 can be consdered as outlers. In Excel use the followng functons: = AVERAGE(data) - mean, m = STDEV(data) - standard devaton, s = abs(data) - absolute value sort by z-scale to dentfy outlers 33
34 DETECTION OF OUTLIERS Iglewcz-Hoagln Method Iglewcz-Hoagln method: modfed Z-score These authors recommend that modfed Z-scores wth an absolute value of greater than 3.5 be labeled as potental outlers. z x MAD medan z >3.5 outler medan( x) MAD( x) x medan x Bors Iglewcz and Davd Hoagln (1993), "Volume 16: How to Detect and Handle Outlers", The ASQC Basc References n Qualty Control: Statstcal Technques, Edward F. Mykytka, Ph.D., Edtor More methods are at: 34

35 NUMERICAL MEASURES Exploraton Data Analyss Fve-number summary An exploratory data analyss technque that uses fve numbers to summarze the data: smallest value, frst quartle, medan, thrd quartle, and largest value chldren.xls Mn. : 12 Q 1 : 25 Medan: 32 Q 3 : 46 Max. : 79 In Excel use: Data Data Analyss Descrptve Statstcs Box plot A graphcal summary of data based on a fve-number summary Mn Q 2 Q 1 Box Qplot 3 Max 1.5 IQR 35
36 NUMERICAL MEASURES Box-Plot n Excel Example Buld a box plot for endng weghts of male and female mce mce.xls 5-num. sum. FEMALE MALE Mn Q Q2 (medan) Q Max box szes FEMALE MALE box 1 hdden = Q1 box 2 lower = Q2 - Q1 box 3 uper = Q3 - Q2 1. Buld 5 number summares for males and females and calculate boxes sze + whskers 2. Calculate the szes of the boxes and whskers (here smplfed whskers are used) 3. Show Stacked Columns, swtch rows/columns 4. Make hdden box transparent 5. Add custom error bars whskers wsker top = MAX - Q3 whsker bot = Q1 - MIN See Contextures Inc. tutoral 36

37 NUMERICAL MEASURES Weghted mean The mean obtaned by assgnng each observaton a weght that reflects ts mportance Weghted Mean m w x w As an example of the need of weghted mean, consder the followng sample of fve purchases of a raw materal over several months Note that the cost per pound vares from $2.80 to $3.40, and quantty purchased has vared from 500 to Suppose that manager asked for nformaton about the mean cost per pound of the raw materal. If we would use a smple mean of the cost p.p.: we overestmate the average cost! Anderson et al Statstcs for Busness and Economcs 37

38 NUMERICAL MEASURES Grouped Mean Grouped data Data avalable n class ntervals as summarzed by a frequency dstrbuton. Indvdual values of the orgnal data are not avalable. chldren.xls Bn Frequency More 0 Mean for grouped data m k f n M Varance for grouped data s 2 k f M n 1 m 2 38
39 QUESTIONS? Thank you for your attenton to be contnued 39
BIOSTATISTICS. Lecture 1 Data Presentation and Descriptive Statistics. dr. Petr Nazarov
 Mcroarray Center BIOSTATISTICS Lecture 1 Data Presentaton and Descrptve Statstcs dr. Petr Nazarov 22-02-2012 petr.nazarov@crp-sante.lu COURSE OVERVIEW Organzaton Theoretcal course (30h) Theory Explanatons
310 Int'l Conf. Par. and Dist. Proc. Tech. and Appl. PDPTA'16
 310 Int'l Conf. Par. and Dst. Proc. Tech. and Appl. PDPTA'16 Akra Sasatan and Hrosh Ish Graduate School of Informaton and Telecommuncaton Engneerng, Toka Unversty, Mnato, Tokyo, Japan Abstract The end-to-end
Joint Modelling Approaches in diabetes research. Francisco Gude Clinical Epidemiology Unit, Hospital Clínico Universitario de Santiago
 Jont Modellng Approaches n dabetes research Clncal Epdemology Unt, Hosptal Clínco Unverstaro de Santago Outlne 1 Dabetes 2 Our research 3 Some applcatons Dabetes melltus Is a serous lfe-long health condton
Copy Number Variation Methods and Data
 Copy Number Varaton Methods and Data Copy number varaton (CNV) Reference Sequence ACCTGCAATGAT TAAGCCCGGG TTGCAACGTTAGGCA Populaton ACCTGCAATGAT TAAGCCCGGG TTGCAACGTTAGGCA ACCTGCAATGAT TTGCAACGTTAGGCA
Parameter Estimates of a Random Regression Test Day Model for First Three Lactation Somatic Cell Scores
 Parameter Estmates of a Random Regresson Test Day Model for Frst Three actaton Somatc Cell Scores Z. u, F. Renhardt and R. Reents Unted Datasystems for Anmal Producton (VIT), Hedeweg 1, D-27280 Verden,
THE NORMAL DISTRIBUTION AND Z-SCORES COMMON CORE ALGEBRA II
 Name: Date: THE NORMAL DISTRIBUTION AND Z-SCORES COMMON CORE ALGEBRA II The normal dstrbuton can be used n ncrements other than half-standard devatons. In fact, we can use ether our calculators or tables
International Journal of Emerging Technologies in Computational and Applied Sciences (IJETCAS)
") Internatonal Assocaton of Scentfc Innovaton and Research (IASIR (An Assocaton Unfyng the Scences, Engneerng, and Appled Research Internatonal Journal of Emergng Technologes n Computatonal and Appled Scences
Internatonal Assocaton of Scentfc Innovaton and Research (IASIR (An Assocaton Unfyng the Scences, Engneerng, and Appled Research Internatonal Journal of Emergng Technologes n Computatonal and Appled Scences
The Effect of Fish Farmers Association on Technical Efficiency: An Application of Propensity Score Matching Analysis
 The Effect of Fsh Farmers Assocaton on Techncal Effcency: An Applcaton of Propensty Score Matchng Analyss Onumah E. E, Esslfe F. L, and Asumng-Brempong, S 15 th July, 2016 Background and Motvaton Outlne
Using the Perpendicular Distance to the Nearest Fracture as a Proxy for Conventional Fracture Spacing Measures
 Usng the Perpendcular Dstance to the Nearest Fracture as a Proxy for Conventonal Fracture Spacng Measures Erc B. Nven and Clayton V. Deutsch Dscrete fracture network smulaton ams to reproduce dstrbutons
INITIAL ANALYSIS OF AWS-OBSERVED TEMPERATURE
 INITIAL ANALYSIS OF AWS-OBSERVED TEMPERATURE Wang Yng, Lu Xaonng, Ren Zhhua, Natonal Meteorologcal Informaton Center, Bejng, Chna Tel.:+86 684755, E-mal:cdcsjk@cma.gov.cn Abstract From, n Chna meteorologcal
Modeling the Survival of Retrospective Clinical Data from Prostate Cancer Patients in Komfo Anokye Teaching Hospital, Ghana
 Internatonal Journal of Appled Scence and Technology Vol. 5, No. 6; December 2015 Modelng the Survval of Retrospectve Clncal Data from Prostate Cancer Patents n Komfo Anokye Teachng Hosptal, Ghana Asedu-Addo,
WHO S ASSESSMENT OF HEALTH CARE INDUSTRY PERFORMANCE: RATING THE RANKINGS
 WHO S ASSESSMENT OF HEALTH CARE INDUSTRY PERFORMANCE: RATING THE RANKINGS ELLIOTT PARKER and JEANNE WENDEL * Department of Economcs, Unversty of Nevada, Reno, NV, USA SUMMARY Ths paper examnes the econometrc
Price linkages in value chains: methodology
 Prce lnkages n value chans: methodology Prof. Trond Bjorndal, CEMARE. Unversty of Portsmouth, UK. and Prof. José Fernández-Polanco Unversty of Cantabra, Span. FAO INFOSAMAK Tangers, Morocco 14 March 2012
A GEOGRAPHICAL AND STATISTICAL ANALYSIS OF LEUKEMIA DEATHS RELATING TO NUCLEAR POWER PLANTS. Whitney Thompson, Sarah McGinnis, Darius McDaniel,
 A GEOGRAPHICAL AD STATISTICAL AALYSIS OF LEUKEMIA DEATHS RELATIG TO UCLEAR POWER PLATS Whtney Thompson, Sarah McGnns, Darus McDanel, Jean Sexton, Rebecca Pettt, Sarah Anderson, Monca Jackson ABSTRACT:
Incorrect Beliefs. Overconfidence. Types of Overconfidence. Outline. Overprecision 4/22/2015. Econ 1820: Behavioral Economics Mark Dean Spring 2015
 Incorrect Belefs Overconfdence Econ 1820: Behavoral Economcs Mark Dean Sprng 2015 In objectve EU we assumed that everyone agreed on what the probabltes of dfferent events were In subjectve expected utlty
NUMERICAL COMPARISONS OF BIOASSAY METHODS IN ESTIMATING LC50 TIANHONG ZHOU
 NUMERICAL COMPARISONS OF BIOASSAY METHODS IN ESTIMATING LC50 by TIANHONG ZHOU B.S., Chna Agrcultural Unversty, 2003 M.S., Chna Agrcultural Unversty, 2006 A THESIS submtted n partal fulfllment of the requrements
Arithmetic Average: Sum of all precipitation values divided by the number of stations 1 n
 Char of ssgnment Suggested soluton PRCIPITTION Task (Charactersaton of the study area) rea: 43.3 km 2 Rver length: 0.296 km Hghest pont: 346 m a.s.l. Lowest pont (staton elevaton): 668 m a.s.l. Domnant
Estimating the distribution of the window period for recent HIV infections: A comparison of statistical methods
 Research Artcle Receved 30 September 2009, Accepted 15 March 2010 Publshed onlne n Wley Onlne Lbrary (wleyonlnelbrary.com) DOI: 10.1002/sm.3941 Estmatng the dstrbuton of the wndow perod for recent HIV
Insights in Genetics and Genomics
 Insghts n Genetcs and Genomcs Research Artcle Open Access New Score Tests for Equalty of Varances n the Applcaton of DNA Methylaton Data Analyss [Verson ] Welang Qu Xuan L Jarrett Morrow Dawn L DeMeo Scott
FAST DETECTION OF MASSES IN MAMMOGRAMS WITH DIFFICULT CASE EXCLUSION
 computng@tanet.edu.te.ua www.tanet.edu.te.ua/computng ISSN 727-6209 Internatonal Scentfc Journal of Computng FAST DETECTION OF MASSES IN MAMMOGRAMS WITH DIFFICULT CASE EXCLUSION Gábor Takács ), Béla Patak
Economic crisis and follow-up of the conditions that define metabolic syndrome in a cohort of Catalonia,
 Economc crss and follow-up of the condtons that defne metabolc syndrome n a cohort of Catalona, 2005-2012 Laa Maynou 1,2,3, Joan Gl 4, Gabrel Coll-de-Tuero 5,2, Ton Mora 6, Carme Saurna 1,2, Anton Scras
Normal variation in the length of the luteal phase of the menstrual cycle: identification of the short luteal phase
 Brtsh Journal of Obstetrcs and Gvnaecologjl July 1984, Vol. 9 1, pp. 685-689 Normal varaton n the length of the luteal phase of the menstrual cycle: dentfcaton of the short luteal phase ELIZABETH A. LENTON,
I I I I I I I I I I I I 60
 EFFECT OF AGE, STAGE OF LACTATON, MLK YELD AND HEALTH EVENTS ON LENGTH OF PRODUCTVE LFE N SWEDSH DARY CATTLE ASSESSED BY SURVVAL ANALYSS. P.A. Oltenacu l, J. Carvalhera, U. Emanuelson 2 and V. Ducrocq
Project title: Mathematical Models of Fish Populations in Marine Reserves
 Applcaton for Fundng (Malaspna Research Fund) Date: November 0, 2005 Project ttle: Mathematcal Models of Fsh Populatons n Marne Reserves Dr. Lev V. Idels Unversty College Professor Mathematcs Department
THIS IS AN OFFICIAL NH DHHS HEALTH ALERT
 THIS IS AN OFFICIAL NH DHHS HEALTH ALERT Dstrbuted by the NH Health Alert Network Health.Alert@dhhs.nh.gov August 26, 2016 1430 EDT (2:30 PM EDT) NH-HAN 20160826 Recommendatons for Accurate Dagnoss of
Physical Model for the Evolution of the Genetic Code
 Physcal Model for the Evoluton of the Genetc Code Tatsuro Yamashta Osamu Narkyo Department of Physcs, Kyushu Unversty, Fukuoka 8-856, Japan Abstract We propose a physcal model to descrbe the mechansms
An Introduction to Modern Measurement Theory
 An Introducton to Modern Measurement Theory Ths tutoral was wrtten as an ntroducton to the bascs of tem response theory (IRT) modelng and ts applcatons to health outcomes measurement for the Natonal Cancer
Statistical Analysis on Infectious Diseases in Dubai, UAE
 Internatonal Journal of Preventve Medcne Research Vol. 1, No. 4, 015, pp. 60-66 http://www.ascence.org/journal/jpmr Statstcal Analyss on Infectous Dseases 1995-013 n Duba, UAE Khams F. G. 1, Hussan H.
CONSTRUCTION OF STOCHASTIC MODEL FOR TIME TO DENGUE VIRUS TRANSMISSION WITH EXPONENTIAL DISTRIBUTION
 Internatonal Journal of Pure and Appled Mathematcal Scences. ISSN 97-988 Volume, Number (7), pp. 3- Research Inda Publcatons http://www.rpublcaton.com ONSTRUTION OF STOHASTI MODEL FOR TIME TO DENGUE VIRUS
Reconstruction of gene regulatory network of colon cancer using information theoretic approach
 Reconstructon of gene regulatory network of colon cancer usng nformaton theoretc approach Khald Raza #1, Rafat Parveen * # Department of Computer Scence Jama Mlla Islama (Central Unverst, New Delh-11005,
Richard Williams Notre Dame Sociology Meetings of the European Survey Research Association Ljubljana,
 Rchard Wllams Notre Dame Socology rwllam@nd.edu http://www.nd.edu/~rwllam Meetngs of the European Survey Research Assocaton Ljubljana, Slovena July 19, 2013 Comparng Logt and Probt Coeffcents across groups
Association between cholesterol and cardiac parameters.
 Short communcaton http://www.alledacademes.org/cholesterol-and-heart-dsease/ Assocaton between cholesterol and cardac parameters. Rabndra Nath Das* Department of Statstcs, The Unversty of Burdwan, Burdwan,
ARTICLE IN PRESS Neuropsychologia xxx (2010) xxx xxx
 xxx xxx") Neuropsychologa xxx (200) xxx xxx Contents lsts avalable at ScenceDrect Neuropsychologa journal homepage: www.elsever.com/locate/neuropsychologa Storage and bndng of object features n vsual workng memory
Neuropsychologa xxx (200) xxx xxx Contents lsts avalable at ScenceDrect Neuropsychologa journal homepage: www.elsever.com/locate/neuropsychologa Storage and bndng of object features n vsual workng memory
Study and Comparison of Various Techniques of Image Edge Detection
 Gureet Sngh et al Int. Journal of Engneerng Research Applcatons RESEARCH ARTICLE OPEN ACCESS Study Comparson of Varous Technques of Image Edge Detecton Gureet Sngh*, Er. Harnder sngh** *(Department of
What Determines Attitude Improvements? Does Religiosity Help?
 Internatonal Journal of Busness and Socal Scence Vol. 4 No. 9; August 2013 What Determnes Atttude Improvements? Does Relgosty Help? Madhu S. Mohanty Calforna State Unversty-Los Angeles Los Angeles, 5151
Optimal Planning of Charging Station for Phased Electric Vehicle *
 Energy and Power Engneerng, 2013, 5, 1393-1397 do:10.4236/epe.2013.54b264 Publshed Onlne July 2013 (http://www.scrp.org/ournal/epe) Optmal Plannng of Chargng Staton for Phased Electrc Vehcle * Yang Gao,
Biased Perceptions of Income Distribution and Preferences for Redistribution: Evidence from a Survey Experiment
 DISCUSSION PAPER SERIES IZA DP No. 5699 Based Perceptons of Income Dstrbuton and Preferences for Redstrbuton: Evdence from a Survey Experment Gullermo Cruces Rcardo Pérez Trugla Martn Tetaz May 2011 Forschungsnsttut
The effect of salvage therapy on survival in a longitudinal study with treatment by indication
 Research Artcle Receved 28 October 2009, Accepted 8 June 2010 Publshed onlne 30 August 2010 n Wley Onlne Lbrary (wleyonlnelbrary.com) DOI: 10.1002/sm.4017 The effect of salvage therapy on survval n a longtudnal
A MIXTURE OF EXPERTS FOR CATARACT DIAGNOSIS IN HOSPITAL SCREENING DATA
 Journal of Theoretcal and Appled Informaton Technology 2005 ongong JATIT & LLS ISSN: 1992-8645 www.jatt.org E-ISSN: 1817-3195 A MIXTURE OF EXPERTS FOR CATARACT DIAGNOSIS IN HOSPITAL SCREENING DATA 1 SUNGMIN
Are National School Lunch Program Participants More Likely to be Obese? Dealing with Identification
 Are Natonal School Lunch Program Partcpants More Lkely to be Obese? Dealng wth Identfcaton Janet G. Peckham Graduate Student, Clemson Unversty (jgemml@clemson.edu) Jaclyn D. Kropp Assstant Professor, Clemson
The Limits of Individual Identification from Sample Allele Frequencies: Theory and Statistical Analysis
 The Lmts of Indvdual Identfcaton from Sample Allele Frequences: Theory and Statstcal Analyss Peter M. Vsscher 1 *, Wllam G. Hll 2 1 Queensland Insttute of Medcal Research, Brsbane, Australa, 2 Insttute
Heart Rate Variability Analysis Diagnosing Atrial Fibrillation
 X-ray PIV Measurements of Velocty Feld of Blood Flows Volume 5, umber 2: 46-52, October 2007 Internatonal Journal of Vascular Bomedcal Engneerng Heart Rate Varablty Analyss Dagnosng Atral Fbrllaton Jnho
INTEGRATIVE NETWORK ANALYSIS TO IDENTIFY ABERRANT PATHWAY NETWORKS IN OVARIAN CANCER
 INTEGRATIVE NETWORK ANALYSIS TO IDENTIFY ABERRANT PATHWAY NETWORKS IN OVARIAN CANCER LI CHEN 1,2, JIANHUA XUAN 1,*, JINGHUA GU 1, YUE WANG 1, ZHEN ZHANG 2, TIAN LI WANG 2, IE MING SHIH 2 1The Bradley Department
A Meta-Analysis of the Effect of Education on Social Capital
 A Meta-Analyss of the Effect of Educaton on Socal Captal Huang Jan ** "Scholar" Research Center for Educaton and Labor Market Department of Economcs, Unversty of Amsterdam and Tnbergen Insttute by Henrëtte
EXAMINATION OF THE DENSITY OF SEMEN AND ANALYSIS OF SPERM CELL MOVEMENT. 1. INTRODUCTION
 JOURNAL OF MEDICAL INFORMATICS & TECHNOLOGIES Vol.3/00, ISSN 64-6037 Łukasz WITKOWSKI * mage enhancement, mage analyss, semen, sperm cell, cell moblty EXAMINATION OF THE DENSITY OF SEMEN AND ANALYSIS OF
Natural Image Denoising: Optimality and Inherent Bounds
 atural Image Denosng: Optmalty and Inherent Bounds Anat Levn and Boaz adler Department of Computer Scence and Appled Math The Wezmann Insttute of Scence Abstract The goal of natural mage denosng s to estmate
EVALUATION OF BULK MODULUS AND RING DIAMETER OF SOME TELLURITE GLASS SYSTEMS
 Chalcogende Letters Vol. 12, No. 2, February 2015, p. 67-74 EVALUATION OF BULK MODULUS AND RING DIAMETER OF SOME TELLURITE GLASS SYSTEMS R. EL-MALLAWANY a*, M.S. GAAFAR b, N. VEERAIAH c a Physcs Dept.,
Bimodal Bidding in Experimental All-Pay Auctions
 Bmodal Bddng n Expermental All-Pay Auctons Chrstane Ernst and Chrstan Thön August 2009 Dscusson Paper no. 2009-25 Department of Economcs Unversty of St. Gallen Edtor: Publsher: Electronc Publcaton: Martna
Analysis of Correlated Recurrent and Terminal Events Data in SAS Li Lu 1, Chenwei Liu 2
 Statstcs & Analyss Analyss of Correlated Recurrent and ermnal Events Data n SAS L Lu 1, Chenwe Lu 2 1 he EMMES Corporaton, Rockvlle, MD 2 Core Genotypng Faclty, Dvson of Cancer Epdemology and Genetcs,
Validation of the Gravity Model in Predicting the Global Spread of Influenza
 Int. J. Envron. Res. Publc Health 2011, 8, 3134-3143; do:10.3390/jerph8083134 OPEN ACCESS Internatonal Journal of Envronmental Research and Publc Health ISSN 1660-4601 www.mdp.com/journal/jerph Artcle
Non-parametric Survival Analysis for Breast Cancer Using nonmedical
 IOSR Journal Of Humantes And Socal Scence (IOSR-JHSS) Volume 1, Issue 5, Ver. 1 (May. 16) PP -34 e-issn: 79-837, p-issn: 79-845. www.osrjournals.org Non-parametrc Survval Analyss for Breast Cancer Usng
PSI Tuberculosis Health Impact Estimation Model. Warren Stevens and David Jeffries Research & Metrics, Population Services International
 PSI Tuberculoss Health Impact Estmaton Model Warren Stevens and Davd Jeffres Research & Metrcs, Populaton Servces Internatonal June 2009 Ths document may be freely revewed, quoted, reproduced or translated,
NHS Outcomes Framework
 NHS Outcomes Framework Doman 1 Preventng people from dyng prematurely Indcator Specfcatons Verson: 1.21 Date: May 2018 Author: Clncal Indcators Team NHS Outcomes Framework: Doman 1 Preventng people from
This article appeared in a journal published by Elsevier. The attached copy is furnished to the author for internal non-commercial research and
 Ths artcle appeared n a journal publshed by Elsever. The attached copy s furnshed to the author for nternal non-commercal research and educaton use, ncludng for nstructon at the authors nsttuton and sharng
ADDITIVE MAIN EFFECTS AND MULTIPLICATIVE INTERACTION (AMMI) ANALYSIS OF GRAIN YIELD STABILITY IN EARLY DURATION RICE ABSTRACT
 ANALYSIS OF GRAIN YIELD STABILITY IN EARLY DURATION RICE ABSTRACT") Bose et al., The Journal of Anmal & Plant Scences, 4(6): 014, Page: J. 1885-1897 Anm. Plant Sc. 4(6):014 ISSN: 1018-7081 ADDITIVE MAIN EFFECTS AND MULTIPLICATIVE INTERACTION (AMMI) ANALYSIS OF GRAIN YIELD
Bose et al., The Journal of Anmal & Plant Scences, 4(6): 014, Page: J. 1885-1897 Anm. Plant Sc. 4(6):014 ISSN: 1018-7081 ADDITIVE MAIN EFFECTS AND MULTIPLICATIVE INTERACTION (AMMI) ANALYSIS OF GRAIN YIELD
Does reporting heterogeneity bias the measurement of health disparities?
 HEDG Workng Paper 06/03 Does reportng heterogenety bas the measurement of health dspartes? Teresa Bago d Uva Eddy Van Doorslaer Maarten Lndeboom Owen O Donnell Somnath Chatterj March 2006 ISSN 1751-1976
4.2 Scheduling to Minimize Maximum Lateness
 4. Schedulng to Mnmze Maxmum Lateness Schedulng to Mnmzng Maxmum Lateness Mnmzng lateness problem. Sngle resource processes one ob at a tme. Job requres t unts of processng tme and s due at tme d. If starts
Working Paper Asymmetric Price Responses of Gasoline Stations: Evidence for Heterogeneity of Retailers
 econstor www.econstor.eu Der Open-Access-Publkatonsserver der ZBW Lebnz-Informatonszentrum Wrtschaft The Open Access Publcaton Server of the ZBW Lebnz Informaton Centre for Economcs Faber, Remer P. Workng
Integration of sensory information within touch and across modalities
 Integraton of sensory nformaton wthn touch and across modaltes Marc O. Ernst, Jean-Perre Brescan, Knut Drewng & Henrch H. Bülthoff Max Planck Insttute for Bologcal Cybernetcs 72076 Tübngen, Germany marc.ernst@tuebngen.mpg.de
Rainbow trout survival and capture probabilities in the upper Rangitikei River, New Zealand
 Ranbow trout survval and capture probabltes n the upper Rangtke Rver, New Zealand Rchard J Barker Department of Mathematcs and Statstcs Unversty of Otago P.O. Box 56 Dunedn, New Zealand Peter H Taylor
x in place of µ in formulas.
 Algebra Notes SOL A.9 Statstcal Varato Mrs. Greser Name: Date: Block: Statstcal Varato Notato/Term Descrpto Example/Notes populato A etre set of data about whch we wsh to ga formato. The heght of every
Saeed Ghanbari, Seyyed Mohammad Taghi Ayatollahi*, Najaf Zare
 DOI:http://dx.do.org/10.7314/APJCP.2015.16.14.5655 and Anthracyclne- Breast Cancer Treatment and Survval n the Eastern Medterranean and Asa: a Meta-analyss RESEARCH ARTICLE Comparng Role of Two Chemotherapy
econstor Make Your Publications Visible.
 econstor Make Your Publcatons Vsble. A Servce of Wrtschaft Centre zbwlebnz-informatonszentrum Economcs Chang, Huan-Cheng; Chang, Pn-Hsang; Tseng, Sung-Chn; Chang, Ch- Chang; Lu, Yen-Chao Artcle A comparatve
Gurprit Grover and Dulumoni Das* Department of Statistics, Faculty of Mathematical Sciences, University of Delhi, Delhi, India.
 Journal of AIDS and HIV Research Vol. 3(), pp. -9, January 20 Avalable onlne http:// academcjournals.org/jahr ISSN 24-2359 20 Academc Journals Full Length Research Paper Decrement table and the estmaton
A Novel artifact for evaluating accuracies of gear profile and pitch measurements of gear measuring instruments
 A Novel artfact for evaluatng accuraces of gear profle and ptch measurements of gear measurng nstruments Sonko Osawa, Osamu Sato, Yohan Kondo, Toshyuk Takatsuj (NMIJ/AIST) Masaharu Komor (Kyoto Unversty)
Estimation of Relative Survival Based on Cancer Registry Data
 Revew of Bonformatcs and Bometrcs (RBB) Volume 2 Issue 4, December 203 www.sepub.org/rbb Estmaton of Relatve Based on Cancer Regstry Data Olaf Schoffer *, Ante Nedostate 2, Stefane J. Klug,2 Cancer Epdemology,
Prediction of Total Pressure Drop in Stenotic Coronary Arteries with Their Geometric Parameters
 Tenth Internatonal Conference on Computatonal Flud Dynamcs (ICCFD10), Barcelona, Span, July 9-13, 2018 ICCFD10-227 Predcton of Total Pressure Drop n Stenotc Coronary Arteres wth Ther Geometrc Parameters
Subject-Adaptive Real-Time Sleep Stage Classification Based on Conditional Random Field
 Subject-Adaptve Real-Tme Sleep Stage Classfcaton Based on Condtonal Random Feld Gang Luo, PhD, Wanl Mn, PhD IBM TJ Watson Research Center, Hawthorne, NY {luog, wanlmn}@usbmcom Abstract Sleep stagng s the
Study on Psychological Crisis Evaluation Combining Factor Analysis and Neural Networks *
 Psychology 2011. Vol.2, No.2, 138-142 Copyrght 2011 ScRes. DOI:10.4236/psych.2011.22022 Study on Psychologcal Crss Evaluaton Combnng Factor Analyss and Neural Networks * Hu Ln 1, Yngb Zhang 1, Hengqng
Encoding processes, in memory scanning tasks
 vlemory & Cognton 1976,4 (5), 501 506 Encodng processes, n memory scannng tasks JEFFREY O. MILLER and ROBERT G. PACHELLA Unversty of Mchgan, Ann Arbor, Mchgan 48101, Three experments are presented that
Evaluation of Literature-based Discovery Systems
 Evaluaton of Lterature-based Dscovery Systems Melha Yetsgen-Yldz 1 and Wanda Pratt 1,2 1 The Informaton School, Unversty of Washngton, Seattle, USA. 2 Bomedcal and Health Informatcs, School of Medcne,
Lateral Transfer Data Report. Principal Investigator: Andrea Baptiste, MA, OT, CIE Co-Investigator: Kay Steadman, MA, OTR, CHSP. Executive Summary:
 Samar tmed c ali ndus t r esi nc 55Fl em ngdr ve, Un t#9 Cambr dge, ON. N1T2A9 T el. 18886582206 Ema l. nf o@s amar t r ol l boar d. c om www. s amar t r ol l boar d. c om Lateral Transfer Data Report
A comparison of statistical methods in interrupted time series analysis to estimate an intervention effect
 Peer revew stream A comparson of statstcal methods n nterrupted tme seres analyss to estmate an nterventon effect a,b, J.J.J., Walter c, S., Grzebeta a, R. & Olver b, J. a Transport and Road Safety, Unversty
Cancer morbidity in ulcerative colitis
 Gut, 982, 2, 49-497 Cancer morbdty n ulceratve colts P PRIOR, S N GYDE, J C ACARNEY, H HOPSON, J A H WAERHOUSE, and R N ALLAN rom the Gastroenterology Unt, General Hosptal, Brmngham, and Cancer Epdemology
Desperation or Desire? The Role of Risk Aversion in Marriage. Christy Spivey, Ph.D. * forthcoming, Economic Inquiry. Abstract
 Desperaton or Desre? The Role of Rsk Averson n Marrage Chrsty Spvey, Ph.D. * forthcomng, Economc Inury Abstract Because of the uncertanty nherent n searchng for a spouse and the uncertanty of the future
Optimal probability weights for estimating causal effects of time-varying treatments with marginal structural Cox models
 Optmal probablty weghts for estmatng causal effects of tme-varyng treatments wth margnal structural Cox models Mchele Santacatterna, Cela García-Pareja Rno Bellocco, Anders Sönnerborg, Anna Ma Ekström
(4) n + 1. n+1. (1) 2n 1 (2) 2 (3) n 1 2 (1) 1 (2) 3 (1) 23 (2) 25 (3) 27 (4) 30
 n + 1. n+1. (1) 2n 1 (2) 2 (3) n 1 2 (1) 1 (2) 3 (1) 23 (2) 25 (3) 27 (4) 30") CHCK YOUR GRASP STATISTICS XRCIS-I Arthmetc mea, weghted mea, Combed mea. Mea of the frst terms of the A.P. a, (a + d), (a + d),... s- a d () ( )d a a + ( ) d a + d. The A.M. of frst eve atural umber s
CHCK YOUR GRASP STATISTICS XRCIS-I Arthmetc mea, weghted mea, Combed mea. Mea of the frst terms of the A.P. a, (a + d), (a + d),... s- a d () ( )d a a + ( ) d a + d. The A.M. of frst eve atural umber s
National Polyp Study data: evidence for regression of adenomas
 5 Natonal Polyp Study data: evdence for regresson of adenomas 78 Chapter 5 Abstract Objectves The data of the Natonal Polyp Study, a large longtudnal study on survellance of adenoma patents, s used for
AUTOMATED DETECTION OF HARD EXUDATES IN FUNDUS IMAGES USING IMPROVED OTSU THRESHOLDING AND SVM
 AUTOMATED DETECTION OF HARD EXUDATES IN FUNDUS IMAGES USING IMPROVED OTSU THRESHOLDING AND SVM Wewe Gao 1 and Jng Zuo 2 1 College of Mechancal Engneerng, Shangha Unversty of Engneerng Scence, Shangha,
Are Drinkers Prone to Engage in Risky Sexual Behaviors?
 Amercan Internatonal Journal of Socal Scence Vol. 2 No. 5; July 2013 Are Drnkers Prone to Engage n Rsky Sexual Behavors? Ana Isabel Gl Lacruz Zaragoza Unversty Department of Busness Organzaton and Management
Human development is deeply embedded in social
 Mejía, S.T., & Hooker, K. (2013). Relatonshp processes wthn the socal convoy: structure, functon, and socal goals. Journals of Gerontology, Seres B: Psychologcal Scences and Socal Scences, 69(3), 376 386,
Assessment of Response Pattern Aberrancy in Eysenck Personality Inventory
 SBORNÍK PRACÍ FILOZOFICKÉ FAKULTY BRNĚNSKÉ UNIVERZITY STUDIA MINORA FACULTATIS PHILOSOPHICAE UNIVERSITATIS BRUNENSIS P 4 / 200 Martn Jelínek, Petr Květon, Dalbor Vobořl Assessment of Response Pattern Aberrancy
Appendix for. Institutions and Behavior: Experimental Evidence on the Effects of Democracy
 Appendx for Insttutons and Behavor: Expermental Evdence on the Effects of Democrac 1. Instructons 1.1 Orgnal sessons Welcome You are about to partcpate n a stud on decson-makng, and ou wll be pad for our
UNIVERISTY OF KWAZULU-NATAL, PIETERMARITZBURG SCHOOL OF MATHEMATICS, STATISTICS AND COMPUTER SCIENCE
 UNIVERISTY OF KWAZULU-NATAL, PIETERMARITZBURG SCHOOL OF MATHEMATICS, STATISTICS AND COMPUTER SCIENCE A COMPLEX SURVEY DATA ANALYSIS OF TB AND HIV MORTALITY IN SOUTH AFRICA By JOIE LEA MURORUNKWERE STUDENT
Introduction ORIGINAL RESEARCH
 ORIGINAL RESEARCH Assessng the Statstcal Sgnfcance of the Acheved Classfcaton Error of Classfers Constructed usng Serum Peptde Profles, and a Prescrpton for Random Samplng Repeated Studes for Massve Hgh-Throughput
Addressing empirical challenges related to the incentive compatibility of stated preference methods
 Addressng emprcal challenges related to the ncentve compatblty of stated preference methods Mkołaj Czajkowsk 1, Chrstan A. Vossler 2,, Wktor Budzńsk 1, Aleksandra Wśnewska 1 and Ewa Zawojska 1 The fnal
A-UNIFAC Modeling of Binary and Multicomponent Phase Equilibria of Fatty Esters+Water+Methanol+Glycerol
 -UNIFC Modelng of Bnary and Multcomponent Phase Equlbra of Fatty Esters+Water+Methanol+Glycerol N. Garrdo a, O. Ferrera b, R. Lugo c, J.-C. de Hemptnne c, M. E. Macedo a, S.B. Bottn d,* a Department of
TTCA: an R package for the identification of differentially expressed genes in time course microarray data
 Albrecht et al. BMC Bonformatcs (2017) 18:33 DOI 10.1186/s12859-016-1440-8 METHODOLOGY ARTICLE Open Access TTCA: an R package for the dentfcaton of dfferentally expressed genes n tme course mcroarray data
Lymphoma Cancer Classification Using Genetic Programming with SNR Features
 Lymphoma Cancer Classfcaton Usng Genetc Programmng wth SNR Features Jn-Hyuk Hong and Sung-Bae Cho Dept. of Computer Scence, Yonse Unversty, 134 Shnchon-dong, Sudaemoon-ku, Seoul 120-749, Korea hjnh@candy.yonse.ac.kr,
[ ] + [3] i 1 1. is the density of the vegetable oil, R is the universal gas constant, T r. is the reduced temperature, and F c
![[ ] + [3] i 1 1. is the density of the vegetable oil, R is the universal gas constant, T r. is the reduced temperature, and F c](/thumbs/72/68055874.jpg "[ ] + [3] i 1 1. is the density of the vegetable oil, R is the universal gas constant, T r. is the reduced temperature, and F c") Densty and Vscosty of Vegetable Ols C.M. Rodenbush a, F.H. Hseh b, and D.S. Vswanath a, * Departments of a Chemcal Engneerng and b Bologcal and Agrcultural Engneerng, Unversty of Mssour-Columba, Columba,
Densty and Vscosty of Vegetable Ols C.M. Rodenbush a, F.H. Hseh b, and D.S. Vswanath a, * Departments of a Chemcal Engneerng and b Bologcal and Agrcultural Engneerng, Unversty of Mssour-Columba, Columba,
Performance Evaluation of Public Non-Profit Hospitals Using a BP Artificial Neural Network: The Case of Hubei Province in China
 Int. J. Envron. Res. Publc Health 2013, 10, 3619-3633; do:10.3390/jerph10083619 OPEN ACCESS Artcle Internatonal Journal of Envronmental Research and Publc Health ISSN 1660-4601 www.mdp.com/journal/jerph
STAGE-STRUCTURED POPULATION DYNAMICS OF AEDES AEGYPTI
 Internatonal Conference Mathematcal and Computatonal Bology 211 Internatonal Journal of Modern Physcs: Conference Seres Vol. 9 (212) 364 372 World Scentfc Publshng Company DOI: 1.1142/S21194512543 STAGE-STRUCTURED
HIV/AIDS AND POVERTY IN SOUTH AFRICA: A BAYESIAN ESTIMATION OF SELECTION MODELS WITH CORRELATED FIXED-EFFECTS
 HIV/AIDS AND POVERTY IN SOUTH AFRICA: A BAYESIAN ESTIMATION OF SELECTION MODELS WITH CORRELATED FIXED-EFFECTS FABRICE MURTIN* AND FEDERICA MARZO Abstract In ths paper, we estmate the causal mpact of human
A New Machine Learning Algorithm for Breast and Pectoral Muscle Segmentation
 Avalable onlne www.ejaet.com European Journal of Advances n Engneerng and Technology, 2015, 2(1): 21-29 Research Artcle ISSN: 2394-658X A New Machne Learnng Algorthm for Breast and Pectoral Muscle Segmentaton
HERMAN AGUINIS University of Colorado at Denver. SCOTT A. PETERSEN U.S. Military Academy at West Point. CHARLES A. PIERCE Montana State University
 ORGANIZATIONAL Aguns et al. / MODERATING RESEARCH EFFECTS METHODS Apprasal of the Homogenety of Error Varance Assumpton and Alternatves to Multple Regresson for Estmatng Moderatng Effects of Categorcal
Key words: carcass, fertility, genotype-by-environment, liver fluke, milk, reaction norm
 Lttle genetc varablty n reslence among cattle exsts for a range of performance trats across herds n Ireland dfferng n Fascola hepatca prevalence 1 Alan J. Twomey, *, Davd A. Graham, Mchael L. Doherty,
Ghebreegziabiher Debrezion Eric Pels Piet Rietveld
 TI 2006-031/3 Tnbergen Insttute Dscusson Paper The Impact of Ral Transport on Real Estate Prces: An Emprcal Analyss of the Dutch Housng Markets Ghebreegzabher Debrezon Erc Pels Pet Retveld Vrje Unverstet
Research Article Statistical Analysis of Haralick Texture Features to Discriminate Lung Abnormalities
 Hndaw Publshng Corporaton Internatonal Journal of Bomedcal Imagng Volume 2015, Artcle ID 267807, 7 pages http://dx.do.org/10.1155/2015/267807 Research Artcle Statstcal Analyss of Haralck Texture Features
Research Article Statistical Segmentation of Regions of Interest on a Mammographic Image
 Hndaw Publshng Corporaton EURASIP Journal on Advances n Sgnal Processng Volume 2007, Artcle ID 49482, 8 pages do:10.1155/2007/49482 Research Artcle Statstcal Segmentaton of Regons of Interest on a Mammographc
Multidimensional Reliability of Instrument for Measuring Students Attitudes Toward Statistics by Using Semantic Differential Scale
 Amercan Journal of Educatonal Research, 05, Vol. 3, No., 49-53 Avalable onlne at http://pubs.scepub.com/educaton/3//0 Scence and Educaton Publshng DOI:0.69/educaton-3--0 Multdmensonal Relablty of Instrument