Cigarette & Electronic Cigarette An Overview
|
|
|
- Abigail Baker
- 6 years ago
- Views:
Transcription
1 PPD 631 Geographic Information Systems for Public Policy, Planning & Development Cigarette & Electronic Cigarette An Overview Status and Trend Fall 2014
2 1. Background The market of electronic cigarette grows fast. According to Bloomberg Industries, with revenue from e-cigarettes expected to double this year to over $1 billion and up to $1.7 billion, the electronic cigarette makers are gradually burning away the $80 billion sales of tobacco, with e- cigarette sales predicted to surpass the traditional cigarette sales by E-cigarette poses both potential opportunities and risks to the nation s public health. Proponents claim these products provide smokers a much safer alternative to conventional cigarettes with the taste and feel of cigarettes, and thus show promise as an avenue to reduce tobacco-related death and diseases. While the critics show concern that these devices could pose unique public health harms: 1. E-cigarettes could promote dual use by serving as an alternative product in places where smoking is prohibited, 2. They could also lure young people into starting to use tobacco and lead to even more dangerous cigarette use. There is a vigorous debate about whether and how to regulate these relatively new tobacco products. FDA is reportedly preparing to regulate the electronic cigarette. While the electronic cigarette makers are putting low price tags and launching advertising campaigns. According to Citigroup s prediction, e-cigarette will have a $3 billion market segment by 2015, which already had a $2 billion market scale in 2013.
 than women (15.8%). The overall smoking prevalence declined from 2005(20.9%) to 2012(18.1%). Map 2.1 Map 2.1 shows the percentage by state.")
3 2. Conventional Cigarette General According to Centers for Disease Control and Prevention (CDC), an estimated 42.1 million people, or 18.1% of all adults in the United States, smoke cigarettes. Cigarette smoking is more common among men (20.5%) than women (15.8%). The overall smoking prevalence declined from 2005(20.9%) to 2012(18.1%). Map 2.1 Map 2.1 shows the percentage by state. And if we look at the prevalence by county (Appendix 1) we can infer that four areas in the U.S. have the highest prevalence, Southern California and Arizona area, Wyoming area, New York area and Washington area (Graph 1.2).


4 Map 2.2 To learn more about the smoking demographics, please refer to Appendix 4 for more details. Market The consumption of cigarette in U.S. has been declining for decades. Figure 2.1 shows the consumption numbers from 2001 to 2010, which declined from billion cigarettes to billion, roughly 25%. There are many reasons for the decline, and two major ones among those are:

5 a. The increasing cost of the cigarette b. The popularity of other tobacco products Figure 2.1 The tobacco tax has been increasing constantly, and the government never stopped pushing the rate higher. For example, the tax hike signed by President Obama in 2009 increased the federal cigarette tax from 39 cents to $1.01 per pack. As a result, 3 million fewer people smoked in the following year Historically, rising taxes on tobacco products, smoking restrictions and mass media and schoolbased educational campaigns have helped push down the smoking rate, says Joshua Yang, a tobacco control researcher at the University of California-San Francisco. Especially for young smokers, the price of cigarettes is a key factor in their cigarette consumption, and according to CDC, a 10% price increase can cut 4% overall cigarette consumption in young adults.

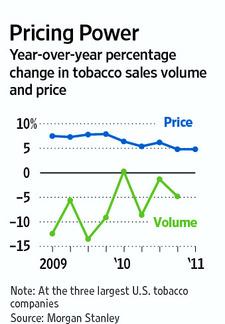
6 Figure 2.2 shows the increase in cigarette tax collection from 2001 to 2010, the tax per pack tripled. Figure 2.2 While the cigarette market is shrinking, the total tobacco market seems to be more stable. The CDC reported that the cigarette consumption fell 2.5% from 2010 to 2011, but the overall drop in tobacco consumption was only 0.8% because of an increase in the sale of other smokable tobacco products like loose tobacco and cigars (the electronic cigarette was not included).

7 Figure 2.3 From figure 2.3 we can infer that, other tobacco product made up for the lost market of cigarette. And if we take electronic cigarette into consideration, the trend would be clearer, which we will talk more in the following part. And regarding to the cigarette tax and cost, we can take a look at Map 2.3 and 2.4 to see the current tobacco tax per pack cigarette and the average price per pack in different states.
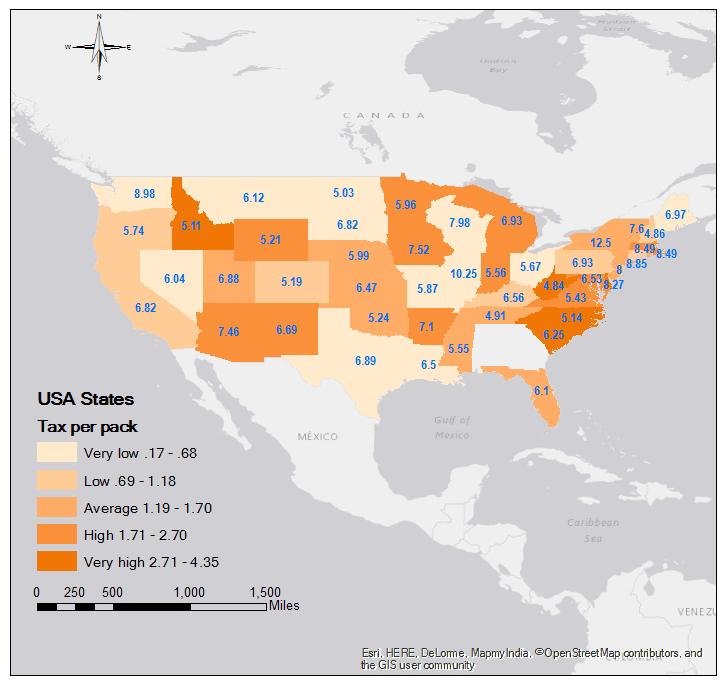
8 Map 2.3

9 Map 2.4 Brands The conventional cigarette market is well established oligopoly market. The top three brands are Altria, Raynolds and Lorillard. Reynolds and Lorillard are planning to merge recently. Three companies together hold 82 percent of the market share.

10 Figure 2.4 A new Gallup poll shows the percentage of smokers who reported smoking more than a pack has declined in recent decades, which peaked at 30 percent in 1978, and below 10 percent in late 1990s. And the number of pack-a-day now is 31 percent and stayed relatively constant. According to the poll, the vast majority said they regretted ever starting to smoke (88%), and 78% said that they would like to quit. The current status and trend of the conventional tobacco shows a sign of declining cigarette use in the United States. And next we will take a look at the electronic cigarette (or vape) market, which has expanded significantly recently. 3. Electronic Cigarette
, flavor additives, and other chemicals.")
11 What are electronic cigarettes? Electronic cigarettes or e-cigarettes are devices that allow users to mimic the ritual of smoking a cigarette while inhaling nicotine. Instead of smoke from burning tobacco, users inhale vapor containing nicotine (with the exception of versions which claim to be free of nicotine), flavor additives, and other chemicals. When users inhale from the end of an e- cigarette, a battery-operated vaporizer heats a liquid solution into a vapor. The fast growth in market share of the e-cigarette draws the public s attention. Table 3.1 And Table 3.1 shows that the market size nearly doubled every year since 2008.

.")
. Map 3.")
12 Brands By January 2014, there were 466 brands already in the US e-cigarette market, and in the last 17 months, there was an increase of 10 brands per month. The market scale of electronic cigarette grew so fast that, from 2012, the traditional tobacco giants started to muscle into the market (Please refer to Appendix 2). Lorillard bought Blu in 2012, Reynolds launched Vuse in 2013 and Altria started MarkTen in Indianna at the same time (Altria also bought Green Smoke-the largest online brand of e-cigarette). Map 3.1 shows the leading e-cigarette brands in convenience stores by zip code. Map 3.1

13 Sales Channels The sales channels are similar to traditional tobacco products: smoke shop, C-stores, gas station, dollar stores, etc. However, there are two game-changing channels. One is the online sales of e-cigarette, and another is the vape shops. Currently, there are over 15,000 vape stores operating in the United States and over 630 in Los Angeles area. Map 3.2 shows the general distribution of the vape stores in United States, and Map 3.3 shows the top rated vape stores on yelp. Map 3.2

14 Map 3.3 From the two graphs, we can tell that similar to the traditional cigarette market, the top regions of the e-cigarette market are also Southern California and Arizona area, New York area, Washington area. The difference is that the southeast and Texas area are hot in c-cigarettes. And in Los Angeles, we can infer that, most famous vape stores are near downtown area, which to some extent indicates the demographic of the e-cigarette users in Los Angeles. Bloomberg industries have predicted that the e-cigarette sales to surpass the traditional cigarette sales by 2047, and Goldman Sachs declared electronic cigarette as one of the top 10 disruptive technologies to watch.
15 4. Correlation Users The conventional cigarette and e-cigarette market currently only share a small portion of customers. According to some e-cigarette research group, the c-cigarette users can be identified into three groups: recreational, ex-smokers and early adopters. Recreational users and early adopters appear to keep themselves away from conventional cigarette. And compared with conventional cigarette users, the e-cigarette users are less sensitive of the price, especially the vapors, reports show that they are more willing to pay extra price for the quality and style. And also, e-cigarette users participate more in social media. Map 4.1 shows the percentage of smokers who are also electronic cigarettes users. We can see the percentage basically falls into 1.5%-3%, and those are the ex-smokers. Prediction by the industry insiders states that this portion will grow to 30%-35% in a decade.

16 Map 4.1 Cost Over the past few years, the conventional cigarette price have increased while e-cigarette prices have declined. In table 4.1, disposables and cartridges are sub-categories of e-cigarette.

17 Table 4.1 And when conventional cigarette tax rate increased, there will be fast response in the e- cigarette market. Table 4.2 and 4.3 shows the market change when Philadelphia s cigarette increased in Oct 1st, From the two tables we can learn that the tax increase will reduce the conventional cigarette s market volume and in the meanwhile give chance to e-cigarette (all data are 7-week moving average). Map 4.2
18 Table 4.2 Table 4.3 Advertising E-cigarette is not regulated as tobacco products currently, which means e-cigarette brands are allowed to advertise anywhere including the TV commercials. According to Legacy s report, in 2013, the e-cigarette advertisers spend 27% ($ 10.7 million) on national and local TV
19 commercials. And Blu, a brand holding over 40% of market share, contribute 82% of the industry s TV advertisement. (See Appendix 6) 5. Limitation Data source The hardest part is to dig for data. When I started this, I thought the data, at least the data for traditional cigarette market, would be easy to get. However, it turned out to be almost impossible to get useful data. I guess the reason is the data I need is not public data, is more about the industry and marketing data. For example, I wanted to know each state s No.1 selling brand of cigarette, or I wanted to know the new port cigarette s regional sales, I couldn t find anything on the website. And also, the data for e-cigarette is hard to get, too. But this situation was expected, the database for e-cigarette and vape still need time to grow. For example, Map 3.2, I searched vape store on google map, and clipped that image, and Map 3.3, I got the location from yelp, and geocoded the locations in the spreadsheet. Comparison and correlation I wanted to compare more about the users characteristics of two markets and find the future market trend in the long term. But the demographics are not enough to support any assumption. And another thing is about the tax per pack and smoking prevalence rate, I wanted to find some correlation between them, and I found out basically they were independent.
20 6. GIS Using GIS is this report is mainly to show the big picture of the national market distribution. And most of the data I gathered are state data. The tobacco use map I got from the GIS online, and Map 3.1 is from an e-cigarette industry report, which I couldn't reach the data. The methods I used in making the maps are basically joining tables to the state shape file, symbology, geocoding, and labeling. Another direction I wanted to go is to study more about the local market place of e-cigarette. For example, the distribution of vape stores in the community, population, traffic and service range. Because the macro comparison is really hard to get some conclusion, however, local study can be completed with more details. 7. Conclusion This project shows the current status and trend of two related markets: conventional cigarette and electronic cigarette. The conventional cigarette market has been declining constantly for decades. However, it is still a huge market, and nearly 20% American adults are smokers. On the other hand, the e- cigarette market is booming, and already has a market cap of around $ 2 billion. As shown in the maps and tables, the market trend of the conventional cigarette market is obvious. And the tobacco giants already started to build their own e-cigarette brands. With the cost of cigarette keep rising, the conventional cigarette consumers will increasingly move to the e-cigarette side. With the advantage in advertising and marketing channels, the potential of the e-cigarette is tremendous, however, it will take a long way to reach the market share comparable to the conventional cigarette market.

21 Appendix 1

22 Appendix 2 Source: Tobacco Control Research Group, University of Bath. August 9, 2014


23 Appendix 3 Source: Gallup, Citi Research, Wells Fargo, Nielsen, WSJ.

24 Appendix 4

25 Appendix 5

26 Appendix 6 Source: LEG-Vaporized-E-cig_Report. May 2014
27 STATE CIGARETTE EXCISE TAX RATES & RANKINGS Overall All States Average: $1.54 per pack Major Tobacco States Average: 48.5 cents per pack Other States Average: $1.68 per pack State Tax Rank Alabama $ th Alaska $ th Arizona $ th Arkansas $ th California $ rd Colorado $ th Connecticut $3.40 4th Delaware $ nd DC $ th Florida $ th Georgia $ th Hawaii $3.20 5th Idaho $ nd Illinois $ th Indiana $ nd Iowa $ th Kansas $ th Kentucky $ th State Tax Rank Louisiana $ th Maine $ th Maryland $ th Massachusetts $3.51 2nd Michigan $ th Minnesota $2.83 7th Mississippi $ th Missouri $ st Montana $ th Nebraska $ th Nevada $ th New Hampshire $ th New Jersey $2.70 9th New Mexico $ st New York $4.35 1st North Carolina $ th North Dakota $ th Ohio $ th State Tax Rank Oklahoma $ st Oregon $ th Pennsylvania $ nd Rhode Island $3.50 3rd South Carolina $ nd South Dakota $ th Tennessee $ th Texas $ th Utah $ th Vermont $2.75 8th Virginia $ th Washington $ th West Virginia $ th Wisconsin $ th Wyoming $ th Puerto Rico $2.23 NA Guam $3.00 NA Northern Marianas $1.75 NA Table shows all cigarette tax rates in effect now. Since 2002, 47 states, DC, and several U.S. territories have increased their cigarette tax rates more than 110 times. The states in bold type have not increased their cigarette tax since 2004 or earlier. Currently, 30 states, DC, Puerto Rico, the Northern Marianas, and Guam have cigarette tax rates of $1.00 per pack or higher; 15 states, DC, and Guam have cigarette tax rates of $2.00 per pack or higher; six states and Guam have cigarette tax rates of $3.00 per pack or higher; and one state (NY) has a cigarette tax rate more than $4.00 per pack. Tobacco states are KY, VA, NC, SC, GA, and TN. States average includes DC, but not Puerto Rico, other U.S. territories, or local cigarette taxes. The median tax rate is $1.36 per pack. AK, MI, MN, MS, UT also have special taxes or fees on brands of manufacturers not participating in the state tobacco lawsuit settlements (NPMs). The highest combined state-local tax rate is $6.16 in Chicago, IL, with New York City second at $5.85 per pack. Other high state-local rates include Evanston, IL at $5.48 and Anchorage, AK at $4.206 per pack. For more on local cigarette taxes, see: Federal cigarette tax is $1.01 per pack. From the beginning of 1998 through 2002, the major cigarette companies increased the prices they charge by more than $1.25 per pack (but also instituted aggressive retail-level discounting for competitive purposes and to reduce related consumption declines). In January 2003, Philip Morris instituted a 65-cent per pack price cut for four of its major brands, to replace its retail-level discounting and fight sales losses to discount brands, and R.J. Reynolds followed suit. In the last several years, the major cigarette companies have increased their product prices by almost $1.00 per pack. The U.S. Centers for Disease Control & Prevention estimates that smokingcaused health costs total $10.47 per pack sold and consumed in the U.S. The average price for a pack of cigarettes nationwide is roughly $6.03 (including statewide sales taxes but not local cigarette or sales taxes, other than NYC s $1.50 per pack cigarette tax), with considerable state-to-state differences because of different state tax rates, and different manufacturer, wholesaler, and retailer pricing and discounting practices. AK, DE, MT, NH & OR have no state retail sales tax at all; OK has a state sales tax, but does not apply it to cigarettes; MN & DC apply a per-pack sales tax at the wholesale level; and AL, GA & MO (unlike the rest of the states) do not apply their state sales tax to that portion of retail cigarette prices that represents the state s cigarette excise tax. Campaign for Tobacco-Free Kids, June 20, 2014 / Ann Boonn For additional information see the Campaign s website at Sources: Orzechowski & Walker, Tax Burden on Tobacco, 2013; media reports; state revenue department websites I Street NW - Suite Washington, DC Phone (202) Fax (202)
28 MAP OF STATE CIGARETTE TAX RATES Average State Cigarette Tax: $1.54 per Pack Average Cigarette Tax in Major Tobacco States: 48.5 cents per Pack Average Cigarette Tax in Non-Tobacco States: $1.68 per Pack Guam: $3.00 No. Marianas Islands: $1.75 WA: $3.025 OR: $1.31 CA: 87 NV: 80 AK: $2.00 ID: 57 UT: $1.70 AZ: $2.00 MT: $1.70 ND: 44 WY: 60 CO: 84 NM: $1.66 SD: $1.53 NE: 64 KS: 79 OK: $1.03 TX $1.41 MN: $2.83 IA: $1.36 WI: $2.52 MO: 17 AR: $1.15 IL: $1.98 MS: 68 LA: 36 MI: $2.00 PA: $1.60 OH: IN: $ WV: 55 VA: 30 KY: 60 NC: 45 TN: 62 SC: 57 AL: 42.5 GA: 37 NH: $1.78 ME: $2.00 VT: $2.75 NY: $4.35 FL: $1.339 NJ: $2.70 DE: $1.60 MD: $2.00 DC: $2.50 MA: $3.51 RI: $3.50 CT: $3.40 HI: $3.20 Puerto Rico: $2.23 Map shows state cigarette tax rates in effect as of July 1, The states that have not increased their cigarette tax rate since 2004 or earlier are marked in bold. Currently, 30 states, DC, Puerto Rico, the Northern Marianas, and Guam have cigarette tax rates of $1.00 per pack or higher; 15 states, DC, Puerto Rico, and Guam have cigarette tax rates of $2.00 per pack or higher; six states and Guam have cigarette tax rates of $3.00 per pack or higher; and one state (NY) has a cigarette tax rate more than $4.00 per pack. The state averages listed above do not include Puerto Rico (with a population larger than those in 20 states) or any of the U.S. territories (such as Guam). The major tobacco states with extensive tobacco farming and, often, cigarette manufacturing, are NC, KY, VA, SC, TN, & GA. Federal cigarette tax is $1.01 per pack. Not shown are the special taxes or fees some states place on cigarettes made by Non-Participating Manufacturers (NPMs), the companies that have not joined the Master Settlement Agreement (MSA) between the states and the major cigarette companies. Some local governments also have their own cigarette taxes, such as Chicago ($1.18), Cook County, IL ($3.00), New York City ($1.50), and Anchorage, AK ($2.206). The U.S. Centers for Disease Control & Prevention estimates that smoking-caused health costs and productivity losses total $10.47 per pack sold. Campaign for Tobacco-Free Kids, June 20, 2014 / Ann Boonn For more information on state cigarette taxes and the benefits from increasing them, see I Street NW Suite 1200 Washington, DC Phone (202) Fax (202)
29 KEY STATE-SPECIFIC TOBACCO-RELATED DATA & RANKINGS Adult Pregnant Smoking Smoking State Rate* Adult Smoking Rank (1=low) Rate Youth Smoking Rate** New Youth Smokers Per Year Annual Adult Smoking Deaths (approx.) Kids Now Alive Who Will Become Smokers Kids Now Alive Who Will Die From Smoking Smoking Caused Cigarette Health Costs 2009 Tax (millions) (per pack) Cigarette Tax Rank (1 = high) FY 2014 Funding for State TC Programs (millions) All States 18.1% /// 10.7% 15.7% 270, , mill. 5.6 mill. $132.5 bill. $1.54 /// $ % Alabama 21.5% 39th 12.1% 18.0% 5,200 8, , ,000 $1.88 bill. $ th $ % Alaska 22.6% 43rd 14.5% 10.6% ,600 14,000 $438 $ th $ % Arizona 16.3% 9th 6.3% 14.1% 5,500 8, , ,000 $2.38 bill. $ th $ % Arkansas 25.9% 49th 16.5% 19.1% 3,300 5, ,700 69,000 $1.21 bill. $ th $ % California 12.5% 2nd NA 10.5% 21,300 40,000 1,376, ,000 $13.29 bill. $ rd $ % Colorado 17.7% 18th 8.8% 15.7% 4,400 5, ,200 91,000 $1.89 bill. $ th $ % Connecticut 15.5% 4th 7.0% 13.5% 2,700 4, ,400 56,000 $2.03 bill. $3.40 4th $ % Delaware 19.6% 30th 12.9% 14.2% 800 1,400 53,700 17,000 $532 $ nd $ % DC 18.8% 23rd 3.9% 12.5% ,300 7,000 $391 $ th $ % Florida 16.8% 14th 7.5% 8.6% 13,100 32, , ,000 $8.64 bill. $ th $ % Georgia 18.8% 23rd 6.5% 12.8% 9,900 11, , ,000 $3.18 bill. $ th $ % Hawaii 13.3% 3rd 5.9% 10.4% 1,000 1,400 67,000 21,000 $526 $3.20 5th $ % Idaho 17.2% 15th 10.5% 12.2% 1,400 1,800 94,300 30,000 $508 $ nd $ % Illinois 18.0% 19th 7.4% 14.1% 11,100 18, , ,000 $5.49 bill. $ th $ % Indiana 21.9% 40th 19.1% 18.1% 7,300 11, , ,000 $2.93 bill. $ nd $ % Iowa 19.5% 29th 16.5% 18.1% 2,600 5, ,100 55,000 $1.28 bill. $ th $ % Kansas 20.0% 32nd 12.7% 10.2% 2,900 4, ,200 61,000 $1.12 bill. $ th $ % Kentucky 26.5% 50th 24.4% 17.9% 5,700 8, , ,000 $1.92 bill. $ th $ % Louisiana 23.5% 45th 10.0% 12.1% 4,700 7, ,400 98,000 $1.89 bill. $ th $ % Maine 20.2% 33rd 14.6% 12.8% 1,300 2,400 84,300 27,000 $811 $ th $ % Maryland 16.4% 10th 6.2% 11.9% 4,400 7, ,900 92,000 $2.71 bill. $ th $ % * Due to changes in CDC s methodology, the 2013 state-specific adult smoking rates cannot be compared to data prior to Pregnant smoking rate in bold type from 2005 and in regular type from Tobacco Prevention Spending % of CDC Target ** Youth smoking rates from most recent years available; in bold type from the Youth Risk Behavioral Surveillance (YRBS); in regular type from Youth Tobacco Surveillance (YTS); and in italics from state- specific su States that have not increased their tax rate since 2004 or before are in bold type. Includes deaths caused by cigarette smoking but not deaths caused by other forms of combustible tobacco or smokeless tobacco products, which are expected to be in the thousands per year. National data include 1400 I Street NW - Suite Washington, DC Phone (202) Fax (202) Adult Pregnant Smoking Smoking State Rate* Adult Smoking Rank (1=low) Rate Youth Smoking Rate** New Youth Smokers Per Year Annual Adult Smoking Deaths (approx.) Kids Now Alive Who Will Become Smokers Kids Now Alive Who Will Die From Smoking Smoking Caused Health Costs 2009 (millions) Cigarette Tax (per pack) Cigarette Tax Rank (1 = high) FY 2014 Funding for State TC Programs (millions) Massachusetts 16.6% 11th 8.1% 10.7% 5,000 9, , ,000 $4.08 bill. $3.51 2nd $ % Michigan 21.4% 38th 13.4% 11.8% 10,300 16, , ,000 $4.59 bill. $ th $ % Minnesota 18.0% 19th 9.5% 18.1% 4,900 5, , ,000 $2.51 bill. $2.83 7th $ % Mississippi 24.8% 48th 12.1% 17.2% 3,300 5, ,900 68,000 $1.23 bill. $ th $ % Missouri 22.1% 42nd 18.2% 14.9% 6,100 11, , ,000 $3.03 bill. $ st $ % Montana 19.0% 25th 19.1% 15.2% 900 1,600 59,000 19,000 $440 $ th $ % Nebraska 18.5% 21st 15.4% 10.9% 1,800 2, ,600 38,000 $795 $ th $ % Nevada 19.4% 28th 10.0% 10.3% 2,000 4, ,700 41,000 $1.08 bill. $ th $ % N. Hampshire 16.2% 8th 14.0% 13.8% 1,000 1,900 67,900 22,000 $729 $ th $ % New Jersey 15.7% 5th 7.8% 12.9% 6,900 11, , ,000 $4.06 bill. $2.70 9th $ % New Mexico 19.1% 27th 7.9% 14.4% 1,900 2, ,500 40,000 $844 $ st $ % New York 16.6% 11th 8.1% 10.6% 13,500 28, , ,000 $10.39 bill. $4.35 1st $ % North Carolina 20.3% 34th 10.0% 15.0% 8,700 14, , ,000 $3.81 bill. $ th $ % North Dakota 21.2% 37th 17.4% 19.0% 600 1,000 43,400 14,000 $326 $ th $ % Ohio 23.4% 44th 18.6% 15.1% 12,500 20, , ,000 $5.64 bill. $ th $ % Oklahoma 23.7% 46th 15.7% 18.5% 4,200 7, ,600 88,000 $1.62 bill. $ st $ % Oregon 17.3% 16th 12.4% 9.4% 3,300 5, ,400 68,000 $1.54 bill. $ th $ % Pennsylvania 21.0% 36th 15.6% 18.4% 11,800 22, , ,000 $6.38 bill. $ nd $ % Rhode Island 17.4% 17th 9.6% 8.0% 700 1,800 48,700 16,000 $640 $3.50 3rd $ % South Carolina 22.0% 41st 15.7% 16.0% 5,000 7, , ,000 $1.90 bill. $ nd $ % South Dakota 19.6% 30th 19.3% 16.5% 1,000 1,300 65,700 21,000 $373 $ th $ % Tennessee 24.3% 47th 17.1% 15.4% 6,000 11, , ,000 $2.67 bill. $ th $ % Texas 15.9% 6th 6.3% 14.1% 24,200 28,000 1,557, ,000 $8.85 bill. $ th $ % Utah 10.3% 1st 5.0% 4.4% 1,800 1, ,800 39,000 $542 $ th $ % Vermont 16.6% 11th 16.7% 13.3% 400 1,000 31,500 10,000 $348 $2.75 8th $ % Virginia 19.0% 25th 7.5% 11.1% 7,300 10, , ,000 $3.11 bill. $ th $ % Washington 16.1% 7th 9.0% 9.5% 5,000 8, , ,000 $2.81 bill. $ th $ % West Virginia 27.3% 51st 29.7% 19.6% 2,200 4, ,900 47,000 $1.00 bill. $ th $ % Wisconsin 18.7% 22nd 14.9% 11.8% 5,100 7, , ,000 $2.66 bill. $ th $ % Wyoming 20.6% 35th 20.7% 17.4% ,800 12,000 $258 $ th $ % Sources for Table Tobacco Prevention Spending % of CDC Target
30 THE COUNCIL OF STATE GOVERNMENTS June 2013 State Cigarette Tax Rates and Tobacco Tax Revenue Cigarette Tax Rates 1 Tobacco Tax Revenue 2 State Tax per pack Rank Total (in millions) Per Capita As Percent of Total Tax Revenue Alabama (a) $ $ $ % Alaska $ $67.38 $ % Arizona $ $ $ % Arkansas $ $ $ % California $ $ $ % Colorado $ $ $ % Connecticut $ $ $ % Delaware $ $ $ % Florida (b) $ $ $ % Georgia $ $ $ % Hawaii $ $ $ % Idaho $ $48.46 $ % Illinois (a) $ $ $ % Indiana $ $ $ % Iowa $ $ $ % Kansas $ $ $ % Kentucky (c) $ $ $ % Louisiana $ $ $ % Maine $ $ $ % Maryland $ $ $ % Massachusetts $ $ $ % Michigan $ $ $ % Minnesota (d) $ $ $ % Mississippi $ $ $ % Missouri (a) $ $ $ % Montana $ $87.15 $ % Nebraska $ $33.73 $ % Nevada $ $ $ % New Hampshire $ $ $ % New Jersey $ $ $ % New Mexico $ $74.80 $ % New York (a) $ $1, $ % North Carolina $ $ $ % North Dakota $ $28.24 $ % Ohio $ $ $ % Oklahoma $ $ $ % Oregon $ $ $ % Pennsylvania $ $1, $ % Rhode Island $ $ $ % South Carolina $ $26.25 $ % South Dakota $ $60.37 $ % Tennessee (a) (e) $ $ $ % Texas $ $1, $ % Utah $ $ $ % Vermont $ $80.23 $ % Virginia (a) $ $ $ % Washington $ $ $ % West Virginia $ $ $ % Wisconsin $ $ $ % Wyoming $ $25.98 $ %
AAll s well that ends well; still the fine s the crown; Whate er the course, the end is the renown. WILLIAM SHAKESPEARE, All s Well That Ends Well
 AAll s well that ends well; still the fine s the crown; Whate er the course, the end is the renown. WILLIAM SHAKESPEARE, All s Well That Ends Well mthree TrEATMENT MODALITIES 7 ž 21 ATLAS OF ESRD IN THE
Prevalence of Self-Reported Obesity Among U.S. Adults by State and Territory. Definitions Obesity: Body Mass Index (BMI) of 30 or higher.
 of 30 or higher.") Prevalence of Self-Reported Obesity Among U.S. Adults by State and Territory Definitions Obesity: Body Mass Index (BMI) of 30 or higher. Body Mass Index (BMI): A measure of an adult s weight in relation
Prevalence of Self-Reported Obesity Among U.S. Adults by State and Territory Definitions Obesity: Body Mass Index (BMI) of 30 or higher. Body Mass Index (BMI): A measure of an adult s weight in relation
Overview of the States Pesticide Registration Process AAPCO Laboratory Committee
 Overview of the States Pesticide Registration Process AAPCO Laboratory Committee Feb 16 th, 2011 Ana Cristina Rodriguez Manager, State Registration/Regulatory Affairs DuPont Crop Protection March 6, 2017
2012 Medicaid and Partnership Chart
 2012 Medicaid and Chart or Alabama $525,000.00 $4,800.00 Minimum: 25,000.00 Alaska $525,000.00 Depends on area of state; Minimum: $113,640 $10,000 in Anchorage $1,656 Minimum:$1838.75 Maximum:$2,841 Minimum:
Exhibit 1. Change in State Health System Performance by Indicator
 Exhibit 1. Change in State Health System Performance by Indicator Indicator (arranged by number of states with improvement within dimension) Access and Affordability 0 Children ages 0 18 uninsured At-risk
STATE RANKINGS REPORT NOVEMBER mississippi tobacco data
 STATE RANKINGS REPORT NOVEMBER 2017 mississippi tobacco data METHODS information about the data sources the youth risk behavior surveillance system The Youth Risk Behavior Surveillance System (YRBSS)
Percent of U.S. State Populations Covered by 100% Smokefree Air Laws April 1, 2018
 Defending your right to breathe smokefree air since 1976 Percent U.S. State Populations Covered by 100% Smokefree Air April 1, 2018 This table lists the percent each state s population covered by air laws
Obesity Trends:
 Obesity Trends: 1985-2014 Compiled by the Centers for Disease Control and Prevention Retrieved from http://www.cdc.gov/obesity/data/prevalencemaps.html Organized into two groupings due to methodological
THREE BIG IMPACT ISSUES
 THREE BIG IMPACT ISSUES Tim McAfee, MD, MPH Director CDC Office on Smoking and Health Presented at the National Cancer Policy Forum Workshop on Reducing Tobacco-Related Cancer Incidence and Mortality June
Women s health status is one of the strongest determinants of how women use the health care system. The
 Women s health status is one of the strongest determinants of how women use the health care system. The poorer their health, the more women need and benefit from high-quality, appropriate care. Overall,
ANNUAL REPORT EXECUTIVE SUMMARY. The full report is available at DECEMBER 2017
 ANNUAL REPORT EXECUTIVE SUMMARY DECEMBER 2017 The full report is available at www.americashealthrankings.org EXECUTIVE SUMMARY OVERVIEW America s Health Rankings presents its 28th Annual Report, providing
Tobacco Control Policy at the State Level. Progress and Challenges. Danny McGoldrick Institute of Medicine Washington, DC June 11, 2012
 Tobacco Control Policy at the State Level Progress and Challenges Danny McGoldrick Institute of Medicine Washington, DC June 11, 2012 The Tools of Tobacco Control Tobacco Taxes Smoke-free Laws Comprehensive
Radiation Therapy Staffing and Workplace Survey 2016
 Radiation Therapy Staffing and Workplace Survey 2016 2016 ASRT. All rights reserved. Reproduction in any form is forbidden without written permission from publisher. TABLE OF CONTENTS Executive Summary...
HIV/AIDS and other Sexually Transmitted Diseases (STDs) in the Southern Region of the United States: Epidemiological Overview
 in the Southern Region of the United States: Epidemiological Overview") HIV/AIDS and other Sexually Transmitted Diseases (STDs) in the Southern Region of the United States: Epidemiological Overview Prepared by The Henry J. Kaiser Family Foundation for Southern States Summit
HIV/AIDS and other Sexually Transmitted Diseases (STDs) in the Southern Region of the United States: Epidemiological Overview Prepared by The Henry J. Kaiser Family Foundation for Southern States Summit
Chapter Two Incidence & prevalence
 Chapter Two Incidence & prevalence Science is the observation of things possible, whether present or past. Prescience is the knowledge of things which may come to pass, though but slowly. LEONARDO da Vinci
The Healthy Indiana Plan
 The Healthy Indiana Plan House Enrolled Act 1678 A Pragmatic Approach Governor Mitch Daniels July 16, 2007 Indiana s Fiscal Health is Good First Back-to-Back Balanced Budget in Eight Years $1,000.0 Revenue
National and Regional Summary of Select Surveillance Components
 - 21-211 Influenza Season Week 9 ending March 5, 211 All data are preliminary and may change as more reports are received. Synopsis: During week 9 (February 27-March 5, 211), influenza activity in the
The indicators studied in this report are shaped by a broad range of factors, many of which are determined by
 Health Care Payments and Workforce The indicators studied in this report are shaped by a broad range of factors, many of which are determined by policies made at the state level. State-level policies help
ACEP National H1N1 Preparedness Survey Results
 1) On a scale from 1 to 10 (10 being totally prepared and 1 being totally unprepared), do you think your hospital is prepared to manage a surge of H1N1 flu patients this fall and winter? (totally prepared)
DISCLAIMER: ECHO Nevada emphasizes patient privacy and asks participants to not share ANY Protected Health Information during ECHO clinics.
 DISCLAIMER: Video will be taken at this clinic and potentially used in Project ECHO promotional materials. By attending this clinic, you consent to have your photo taken and allow Project ECHO to use this
Cirrhosis and Liver Cancer Mortality in the United States : An Observational Study Supplementary Material
 Cirrhosis and Liver Cancer Mortality in the United States 1999-2016: An Observational Study Supplementary Material Elliot B. Tapper MD (1,2) and Neehar D Parikh MD MS (1,2) 1. Division of Gastroenterology
APC by Schneider Electric Channel Sales Territory Directory West
 W APC by Schneider Electric Channel Sales Territory Directory West Key: Click on each state abbreviation to display contact information for the state s inside support, field resource for partner relationship
2017 STATE WELL-BEING RANKINGS
 2017 STATE WELL-BEING RANKINGS 3 1 South Dakota 6 2 Vermont Hawaii 3 1 Minnesota 4 16 5 North Dakota Colorado 6 5 22 7 New Hampshire 18 8 9 Idaho Utah Montana 10 8 Massachusetts 11 14 Florida 12 11 Texas
State Tobacco Control Programs
 State Tobacco Control Programs National Cancer Policy Forum Workshop Reducing Tobacco-Related Cancer Incidence and Mortality Karla S. Sneegas, MPH Chief Program Services Branch CDC Office on Smoking and
National and Regional Summary of Select Surveillance Components
 HHS Surveillance Regions* 2016-2017 Influenza Season 48 ending December 3, 2016 All data are preliminary and may change as more reports are received. Synopsis: During week 48 (November 27-December 3, 2016),
Tobacco Tax & North Dakota
 Tobacco Tax & North Dakota A quick look at the facts and why we should all be working together to raise it Jodi L. Radke Director, Rocky Mountain/Great Plains Region CAMPAIGN FOR TOBACCO-FREE KIDS Jodi
BrokenPromisesTo OurChildren. AState-by-StateLookatthe 1998TobaccoSetlement 20YearsLater
 BrokenPromisesTo OurChildren AState-by-StateLookatthe 1998TobaccoSetlement 20YearsLater December14,2018 Broken Promises to Our Children: A State-by-State Look at the 1998 Tobacco Settlement 20 Years Later
2003 National Immunization Survey Public-Use Data File
 SECTION 1. ID, WEIGHT AND FLAG VARIABLES Section 1 Variable Name SEQNUMC Label UNIQUE CHILD IDENTIFIER Frequency of Missing/Non-missing Values All Data 30930 21310 NON-MISSING CHARACTER STRING 000011 MINIMUM
Part I Cox Online Certificate Course
 Part I Cox Online Certificate Course Alaska AK NOT APPLIED BUT CAN IF REQUESTED Maine ME X never expires PACE Approval #2776 Minnesota MN X never expires PACE Approval #2776 Nevada NV X never expires PACE
2018 HPV Legislative Report Card
 2018 HPV Legislative Report Card This report card is a snapshot of each state s documented efforts to enact or introduce HPV vaccine legislation to improve education and awareness, or provide access to
National Deaf Center on Postsecondary Outcomes. Data Interpretation Guide for State Reports: FAQ
 National Deaf Center on Postsecondary Outcomes Data Interpretation Guide for State Reports: FAQ This document was developed under a grant from the U.S. Department of Education, OSEP #HD326D160001. However,
Peer Specialist Workforce. State-by-state information on key indicators, and links to each state s peer certification program web site.
 Peer Specialist Workforce State-by-state information on key indicators, and links to each state s peer certification program web site. Alabama Peer support not Medicaid-reimbursable 204 peer specialists
% $0 $ % $1,954,710 $177, % $0 $ % $0 $ % $118,444 $59, Mississippi
 ATTACHMENT A Palmetto GBA Hospice Cap Overpayments by State As of May 3, 26 Item State Total % completed Total O/P Average O/P # Code State Providers Completed With O/P with O/P Amount Amount Alabama 4
MAKING WAVES WITH STATE WATER POLICIES. Washington State Department of Health
 MAKING WAVES WITH STATE WATER POLICIES Washington State Department of Health Lead poisoning is a public health problem. Health Effects of Lead Lead Exposures and Pathways HOME Paint Lead pipes Lead solder
Georgina Peacock, MD, MPH
 Autism Activities at CDC Act Early Region IX Summit Sacramento, CA June 8, 2009 Georgina Peacock, MD, MPH National Center on Birth Defects and Developmental Disabilities Autism Activities at CDC Surveillance/Monitoring
CDC activities Autism Spectrum Disorders
 CDC activities Autism Spectrum Disorders Georgina Peacock, MD, MPH Centers for Disease Control and Prevention National Center on Birth Defects and Developmental Disabilities The findings and conclusions
Medical Marijuana Responsible for Traffic Fatalities Alfred Crancer, B.S., M.A.; Phillip Drum, Pharm.D.
 Medical Marijuana Responsible for Traffic Fatalities Alfred Crancer, B.S., M.A.; Phillip Drum, Pharm.D. Abstract In California, where only 25% of the drivers in fatal crashes are tested for drugs, 252
50-STATE REPORT CARD
 JANUARY 2014 The State of Reproductive Health and Rights: 50-STATE REPORT CARD U.S. REPRODUCTIVE HEALTH AND RIGHTS AT A CROSSROADS The status of reproductive health and rights in the U.S. is at an historic
Radiation Therapy Staffing and Workplace Survey 2018
 Radiation Therapy Staffing and Workplace Survey 2018 2018 ASRT. All rights reserved. Reproduction in any form is forbidden without written permission from publisher. Table of Contents Radiation Therapy
It's tick time again! Recognizing black-legged (deer ticks) and measuring the spread of Lyme disease
 and measuring the spread of Lyme disease") It's tick time again! Recognizing black-legged (deer ticks) and measuring the spread of Lyme disease Actual sizes: These guys below (Ixodes scapularis) spread Lyme and other tick born diseases. Ixodes
It's tick time again! Recognizing black-legged (deer ticks) and measuring the spread of Lyme disease Actual sizes: These guys below (Ixodes scapularis) spread Lyme and other tick born diseases. Ixodes
Average Number Citations per Recertification Survey
 10 Average Citations per Recertification Survey 201 201 2017 1Q 8 7.7 7.3 3 3.3 3..2 2 1 0..80.2.0.8.70.8.17.8.1 7.3 SRO SERO NERO NRO WRO WI 1 Source: WI DQA, March 31, 2017 3% Percentage of Recertification
An Unhealthy America: The Economic Burden of Chronic Disease Charting a New Course to Save Lives and Increase Productivity and Economic Growth
 An Unhealthy America: The Economic Burden of Chronic Disease Charting a New Course to Save Lives and Increase Productivity and Economic Growth Ross DeVol Director, Center for Health Economics Director,
Part I Cox Online Certificate Course
 Part I Cox Online Certificate Course Alabama AL X 10/4/2017 700008 Alaska AK NOT APPLIED BUT CAN IF REQUESTED California CA X 9/30/2017 CA A 16 10 12721 Hawaii HI X 12/31/2017 HI 16 039 Maine ME X never
States with Authority to Require Nonresident Pharmacies to Report to PMP
 States with Authority to Require Nonresident Pharmacies to Report to PMP Research current through May 2016. This project was supported by Grant No. G1599ONDCP03A, awarded by the Office of National Drug
Save Lives and Money. Help State Employees Quit Tobacco
 Save Lives and Money Help State Employees Quit Tobacco 2009 Join These 5 Leading States Cover All the Treatments Your State Employees Need To Quit Tobacco 1 2 Follow these leaders and help your state employees
SASI Analysis of Funds Distributed in the United States By the Centers for Disease Control and Prevention (CDC) Pursuant to PS
 Pursuant to PS") SASI Analysis of Funds Distributed in the United States By the Centers for Disease Control and Prevention (CDC) Pursuant to PS17-1704 1 April 13, 2017 INTRODUCTION In the Summer of 2016, the Centers for
SASI Analysis of Funds Distributed in the United States By the Centers for Disease Control and Prevention (CDC) Pursuant to PS17-1704 1 April 13, 2017 INTRODUCTION In the Summer of 2016, the Centers for
Methamphetamines: A National and State Crisis. Research Brief. Prepared by
 Methamphetamines: A National and State Crisis Research Brief Prepared by P. Allison Minugh, Ph.D. Nicoletta A. Lomuto, M.S. Kelly R. Breeden, M.S. Dennis Embry, Ph.D. Headquarters Two Richmond Square Providence,
Autism Activities at CDC: The Public Health Model
 Autism Activities at CDC: The Public Health Model Act Early Region II Summit Bronx, NY March 26, 2009 Marshalyn Yeargin-Allsopp, MD Georgina Peacock, MD, MPH National Center on Birth Defects and Developmental
Supplement to Achieving a State of Healthy Weight
 Composition of Ratings of Practices 0 (Highest to Lowest) Fully Met Partially Met Not Addressed Contradicted IB: Feed infants on cue IA: No cow s milk < yr IB: Hold infant to feed IC: Plan solid introduction
HEALTH OF WOMEN AND CHILDREN REPORT
 HEALTH OF WOMEN AND CHILDREN REPORT MARCH 2018 The full report is available at www.americashealthrankings.org OVERVIEW Promoting the health of women, infants and children is fundamental to keeping our
Cessation and Cessation Measures
 Cessation and Cessation Measures among Adult Daily Smokers: National and State-Specific Data David M. Burns, Christy M. Anderson, Michael Johnson, Jacqueline M. Major, Lois Biener, Jerry Vaughn, Thomas
Using Policy, Programs, and Partnerships to Stamp Out Breast and Cervical Cancers
 Using Policy, Programs, and Partnerships to Stamp Out Breast and Cervical Cancers National Conference of State Legislatures Annual Meeting J August 2006 Christy Schmidt Senior Director of Policy National
Responses to a 2017 Survey on State Policies Regarding Community Health Workers: Home Visiting to Improve the Home Environment
 Responses to a 2017 Survey on State Policies Regarding Community Health Workers: Home Visiting to Improve the Home Environment The National Academy for State Health Policy (NASHP), with support from the
TAX SMOKELESS TOBACCO INPennsylvania
 Winter 2007 Vol. 14, No. 1 Pennsylvania Oral Health Update Providing Access to Dental Care in Pennsylvania Winter 2012 A legislator s guide to oral health care issues, provided by the members of the Pennsylvania
The Rural Health Workforce. Policy Brief Series. Data and Issues for Policymakers in: Washington Wyoming Alaska Montana Idaho
 The Rural Health Workforce Data and Issues for Policymakers in: Washington Wyoming Alaska Montana Idaho Policy Brief Series ISSUE #1: THE RURAL HEALTH WORKFORCE: CHALLENGES AND OPPORTUNITIES ISSUE #2:
Supplementary Online Content
 Supplementary Online Content Swaminathan S, Sommers BD,Thorsness R, Mehrotra R, Lee Y, Trivedi AN. Association of Medicaid expansion with 1-year mortality among patients with end-stage renal disease. JAMA.
State Public Health Autism Resource Center (SPHARC)
") State Public Health Autism Resource Center (SPHARC) Kick-off and Welcome Call September 22, 2014 2:00-3:00 PM, ET Dial for Audio: (888) 394-8197 Passcode: 60259 Brief Housekeeping Notes Press *6 to mute/unmute
State Public Health Autism Resource Center (SPHARC) Kick-off and Welcome Call September 22, 2014 2:00-3:00 PM, ET Dial for Audio: (888) 394-8197 Passcode: 60259 Brief Housekeeping Notes Press *6 to mute/unmute
Peer Specialist Workforce. State-by-state information on key indicators, and links to each state s peer certification program web site.
 Peer Specialist Workforce State-by-state information on key indicators, and links to each state s peer certification program web site. Alabama Peer support not Medicaid-reimbursable 204 peer specialists
NCQA did not add new measures to Accreditation 2017 scoring.
 2017 Accreditation Benchmarks and Thresholds 1 TO: Interested Organizations FROM: Patrick Dahill, Assistant Vice President, Policy DATE: August 2, 2017 RE: 2017 Accreditation Benchmarks and Thresholds
B&T Format. New Measures. Better health care. Better choices. Better health.
 1100 13th Street NW, Third Floor Washington, DC 20005 phone 202.955.3500 fax 202.955.3599 www.ncqa.org TO: Interested Organizations FROM: Patrick Dahill, Assistant Vice President, Policy DATE: August 13,
Instant Drug Testing State Law Guide
 Instant Drug Testing State Law Guide State Alabama Alaska Arizona POCT / Instant Testing Status Comment outside this voluntary law but not by companies that wish to qualify for the WC discount. FDA-cleared
Public Health Federal Funding Request to Address the Opioid Epidemic
 Public Health Federal Funding Request to Address the Opioid Epidemic On December 4, 2017, in response to the President s recent declaration of the opioid epidemic as a public health emergency and the final
Opioid Deaths Quadruple Since 1999
 THE COUNCIL OF STATE GOVERNMENTS CAPITOL RESEARCH AUGUST 2017 HEALTH POLICY Opioid Deaths Quadruple Since 1999 Since 1999, the number of overdose deaths involving opioids (including prescription opioids
Results from the Commonwealth Fund Scorecard on State Health System Performance. Douglas McCarthy. Senior Research Director The Commonwealth Fund
 AIMING HIGHER: Results from the Commonwealth Fund Scorecard on State Health System Performance EDITION APPENDIX David C. Radley Senior Scientist The Commonwealth Fund Douglas McCarthy Senior Research Director
DEPARTMENT OF DEFENSE (AFHSB)
") In NORTHCOM during week 48 Influenza activity continued to increase during week 48 and ranged from minimal to high, depending on the state. The percentage of outpatient visits due to ILI continued to increase
In NORTHCOM during week 48 Influenza activity continued to increase during week 48 and ranged from minimal to high, depending on the state. The percentage of outpatient visits due to ILI continued to increase
Overview of the HHS National Network of Quitlines Initiative
 Overview of the HHS National Network of Quitlines Initiative Prepared for the 2005 National Oral Health Conference 6th Joint Meeting of ASTDD and AAPHD Barbara Z. Park, RDH, MPH May 2, 2005 Background
CDC activities with Autism Spectrum Disorders
 CDC activities with Autism Spectrum Disorders Georgina Peacock, MD, MPH Centers for Disease Control and Prevention National Center on Birth Defects and Developmental Disabilities The findings and conclusions
MetLife Foundation Alzheimer's Survey: What America Thinks
 MetLife Foundation Alzheimer's Survey: What America Thinks May 11, 2006 Conducted by: Harris Interactive 2005, Harris Interactive Inc. All rights reserved. Table of Contents Background and Objectives...
Vocational Rehabilitation Funding for a Power Wheelchair with Power Adjustable Seat Height:
 Vocational Rehabilitation Funding for a Power Wheelchair with Power Adjustable Seat Height: The Americans with Disabilities Act (ADA) was signed into law on July 26, 1990. It is a wide-ranging law intended
Michigan Nutrition Network Outcomes: Balance caloric intake from food and beverages with caloric expenditure.
 DRAFT 1 Obesity and Heart Disease: Fact or Government Conspiracy? Grade Level: High School Grades 11 12 Subject Area: Mathematics (Statistics) Setting: Classroom and/or Computer Lab Instructional Time:
Geographical Accuracy of Cell Phone Samples and the Effect on Telephone Survey Bias, Variance, and Cost
 Geographical Accuracy of Cell Phone Samples and the Effect on Telephone Survey Bias, Variance, and Cost Abstract Benjamin Skalland, NORC at the University of Chicago Meena Khare, National Center for Health
Medical Advisory Board. reviews medical issues for licensure regarding individual drivers. medical conditions. not specified. reporting encouraged,
 State Reporting Regulations for Physicians Adapted from the Physician s Guide to Assessing and Counseling Older Drivers 44 and Madd.org 45 State Physician/Medical Reporting (NOTE MERGED CELLS) Mandatory,
ROAD SAFETY MONITOR. ALCOHOL-IMPAIRED DRIVING IN THE UNITED STATES Results from the 2017 TIRF USA Road Safety Monitor
 Background What is the context of alcohol-impaired driving in the U.S.? According to the National Highway Traffic Safety Administration (NHTSA), alcohol-impaired driving fatalities involving a driver with
Broken Promises to Our Children: A State-by-State Look at the 1998 Tobacco Settlement 19 Years Later
 Br ok enpr omi s est o OurChi l dr en AS t a t eby S t a t el ooka tt he 1998T oba c c os el ement 19Y ea r sl a t er Dec ember13, 2017 Broken Promises to Our Children: A State-by-State Look at the 1998
F as in Fat: How Obesity Threatens. America s Future. Issue Report August 2013
 Issue Report August 2013 F as in Fat: How Obesity Threatens 2013 America s Future Acknowledgements F as in Fat is a collaborative project of the Trust for America's Health and the Robert Wood Johnson Foundation
DEPARTMENT OF DEFENSE (AFHSB)
") DEPARTMENT OF DEFENSE (AFHSB) Seasonal Influenza Surveillance Summary Northern Command -- Week 13 (04 Mar 07 Apr 2018) In NORTHCOM during week 13 Influenza activity was minimal to low for the majority
DEPARTMENT OF DEFENSE (AFHSB) Seasonal Influenza Surveillance Summary Northern Command -- Week 13 (04 Mar 07 Apr 2018) In NORTHCOM during week 13 Influenza activity was minimal to low for the majority
Trends in Lung Cancer Morbidity and Mortality
 Trends in Lung Cancer Morbidity and Mortality American Lung Association Epidemiology and Statistics Unit Research and Program Services Division November 2014 Table of Contents Trends in Lung Cancer Morbidity
National List of Equipment Distribution Programs
 National List of Equipment Distribution Programs ALABAMA Alabama Telecommunications Access Program (ATAP) 205-328-3989 (Voice/TTY) http://www.alabamarelay.com/atap.html ALASKA *Alaska TEDP 3330 Arctic
DEPARTMENT OF DEFENSE (AFHSB)
") DEPARTMENT OF DEFENSE (AFHSB) Seasonal Influenza Surveillance Summary Northern Command -- Week 45 (03 November 10 November 2018) In NORTHCOM during week 45 Influenza activity was minimal to low for most
DEPARTMENT OF DEFENSE (AFHSB) Seasonal Influenza Surveillance Summary Northern Command -- Week 45 (03 November 10 November 2018) In NORTHCOM during week 45 Influenza activity was minimal to low for most
DEPARTMENT OF DEFENSE (AFHSB)
") DEPARTMENT OF DEFENSE (AFHSB) Seasonal Influenza Surveillance Summary Northern Command -- Week 42 (14 October 20 October 2018) In NORTHCOM during week 42 Influenza activity was minimal to low for NORTHCOM,
DEPARTMENT OF DEFENSE (AFHSB) Seasonal Influenza Surveillance Summary Northern Command -- Week 42 (14 October 20 October 2018) In NORTHCOM during week 42 Influenza activity was minimal to low for NORTHCOM,
SUMMARY OF SYNTHETIC CANNABINOID BILLS
 SUMMARY OF SYNTHETIC CANNABINOID BILLS Alabama: H.B. 163, S.B. 235, S.B. 283 indefinitely postponed as of 6/1/2011 - amends existing statute regarding chemical compounds to add JWH-200 and CP 47,497 Alaska:
DEPARTMENT OF DEFENSE (AFHSB) Seasonal Influenza Surveillance Summary Northern Command -- Week 17 (22 Apr 28 Apr 2018)
 Seasonal Influenza Surveillance Summary Northern Command -- Week 17 (22 Apr 28 Apr 2018)") DEPARTMENT OF DEFENSE (AFHSB) Seasonal Influenza Surveillance Summary Northern Command -- Week 17 (22 Apr 28 Apr 2018) In NORTHCOM during week 17 Influenza activity continued to be minimal for the majority
DEPARTMENT OF DEFENSE (AFHSB) Seasonal Influenza Surveillance Summary Northern Command -- Week 17 (22 Apr 28 Apr 2018) In NORTHCOM during week 17 Influenza activity continued to be minimal for the majority
B&T Format. New Measures. 2 CAHPS is a registered trademark of the Agency for Healthcare Research and Quality (AHRQ).
.") TO: Interested Organizations FROM: Patrick Dahill, Assistant Vice President, Policy DATE: February 4, 2018 RE: 2018 Accreditation Benchmarks and Thresholds This document reports national benchmarks and
TO: Interested Organizations FROM: Patrick Dahill, Assistant Vice President, Policy DATE: February 4, 2018 RE: 2018 Accreditation Benchmarks and Thresholds This document reports national benchmarks and
DEPARTMENT OF DEFENSE (AFHSB)
") In NORTHCOM during week 50 DEPARTMENT OF DEFENSE (AFHSB) Seasonal Influenza Surveillance Summary Northern Command -- Week 50 (09 December 15 December 2018) Influenza activity decreased in many states,
In NORTHCOM during week 50 DEPARTMENT OF DEFENSE (AFHSB) Seasonal Influenza Surveillance Summary Northern Command -- Week 50 (09 December 15 December 2018) Influenza activity decreased in many states,
Trends in COPD (Chronic Bronchitis and Emphysema): Morbidity and Mortality. Please note, this report is designed for double-sided printing
: Morbidity and Mortality. Please note, this report is designed for double-sided printing") Trends in COPD (Chronic Bronchitis and Emphysema): Morbidity and Mortality Please note, this report is designed for double-sided printing American Lung Association Epidemiology and Statistics Unit Research
Trends in COPD (Chronic Bronchitis and Emphysema): Morbidity and Mortality Please note, this report is designed for double-sided printing American Lung Association Epidemiology and Statistics Unit Research
DEPARTMENT OF DEFENSE (AFHSB)
") DEPARTMENT OF DEFENSE (AFHSB) Seasonal Influenza Surveillance Summary Northern Command -- Week 16 (15 Apr 21 Apr 2018) In NORTHCOM during week 16 Influenza activity continued to be minimal for the majority
DEPARTMENT OF DEFENSE (AFHSB) Seasonal Influenza Surveillance Summary Northern Command -- Week 16 (15 Apr 21 Apr 2018) In NORTHCOM during week 16 Influenza activity continued to be minimal for the majority
DEPARTMENT OF DEFENSE (AFHSB)
") DEPARTMENT OF DEFENSE (AFHSB) Seasonal Influenza Surveillance Summary Northern Command -- Week 9 ( 02 December 08 December 2018) In NORTHCOM during week 9 Influenza activity remained similar to last week
DEPARTMENT OF DEFENSE (AFHSB) Seasonal Influenza Surveillance Summary Northern Command -- Week 9 ( 02 December 08 December 2018) In NORTHCOM during week 9 Influenza activity remained similar to last week
ADVANCE FOR PHYSICAL THERAPY AND REHAB MEDICINE
 100 Beard Sawmill Road, Sixth Floor Shelton, CT USA 06484-6259 Phone: +1 203.447.2800 Fax: +1 203.447.2900 A not-for-profit organization since 1931, BPA Worldwide is governed by a tripartite board comprised
DEPARTMENT OF DEFENSE (AFHSB)
") DEPARTMENT OF DEFENSE (AFHSB) Seasonal Influenza Surveillance Summary Northern Command -- Week 15 (07 April 2019 013 April 2019) In NORTHCOM during week 15 Influenza activity returned to minimal or continued
DEPARTMENT OF DEFENSE (AFHSB) Seasonal Influenza Surveillance Summary Northern Command -- Week 15 (07 April 2019 013 April 2019) In NORTHCOM during week 15 Influenza activity returned to minimal or continued
Plan Details and Rates. Monthly Premium Rate Schedule
 Basis of Reimbursement Plan Details and Rates MetLife Option 1 (Low) MetLife Option 2 (High) In-Network Out-of-Network In-Network Out-of-Network 70th percentile 70th percentile of Negotiated Negotiated
B&T Format. New Measures. Better health care. Better choices. Better health.
 1100 13th Street NW, Third Floor Washington, DC 20005 phone 202.955.3500 fax 202.955.3599 www.ncqa.org TO: Interested Organizations FROM: Patrick Dahill, Assistant Vice President, Policy DATE: February
Health Care Reform: Colorectal Cancer Screening Expansion, Before and After the Affordable Care Act (ACA)
") University of Arkansas for Medical Sciences From the SelectedWorks of Michael Preston April 9, 2014 Health Care Reform: Colorectal Cancer Screening Expansion, Before and After the Affordable Care Act (ACA)
University of Arkansas for Medical Sciences From the SelectedWorks of Michael Preston April 9, 2014 Health Care Reform: Colorectal Cancer Screening Expansion, Before and After the Affordable Care Act (ACA)
DEPARTMENT OF DEFENSE (AFHSB)
") In NORTHCOM during week 01 Northern Command -- Week 01 (31 Dec 2017 06 Jan 2018) Influenza activity continued to increase with the majority of states still experiencing moderate to high activity. The percentage
In NORTHCOM during week 01 Northern Command -- Week 01 (31 Dec 2017 06 Jan 2018) Influenza activity continued to increase with the majority of states still experiencing moderate to high activity. The percentage
DEPARTMENT OF DEFENSE (AFHSB)
") DEPARTMENT OF DEFENSE (AFHSB) Seasonal Influenza Surveillance Summary Northern Command -- Week 8 (25 November December 1, 2018) In NORTHCOM during week 8 Influenza activity continued to increase throughout
DEPARTMENT OF DEFENSE (AFHSB) Seasonal Influenza Surveillance Summary Northern Command -- Week 8 (25 November December 1, 2018) In NORTHCOM during week 8 Influenza activity continued to increase throughout
Act Against AIDS Healthy Communities Program Partnering and Communicating Together (PACT) to Act Against AIDS
 to Act Against AIDS") Act Against AIDS Healthy Communities Program Partnering and Communicating Together (PACT) to Act Against AIDS Dear LULAC Council: We are thrilled to announce our partnership with the Act Against AIDS campaign
Act Against AIDS Healthy Communities Program Partnering and Communicating Together (PACT) to Act Against AIDS Dear LULAC Council: We are thrilled to announce our partnership with the Act Against AIDS campaign
West Nile virus and other arboviral activity -- United States, 2013 Provisional data reported to ArboNET Tuesday, January 7, 2014
 West Nile virus and other arboviral activity -- United States, 2013 reported to ArboNET Tuesday, This update from the CDC Arboviral Diseases Branch includes provisional data reported to ArboNET for January
VOTERS ACROSS THE COUNTRY EXPRESS STRONG SUPPORT FOR SMOKE-FREE LAWS
 VOTERS ACROSS THE COUNTRY EXPRESS STRONG SUPPORT FOR SMOKE-FREE LAWS The results of numerous ballot initiatives, as well as polls conducted in states and communities throughout the country, show broad
A call to action for individuals and their communities. Annual Report 2017
 A call to action for individuals and their communities Annual Report 217 Behaviors Community & Environment Health Outcomes Policy Clinical Care America s Health Rankings was built upon the World Health