SPECIAL EUROBAROMETER 332. Fieldwork: October 2009 Publication: May 2010
|
|
|
- Cameron Gibbs
- 6 years ago
- Views:
Transcription

1 SPECIAL EUROBAROMETER 332 Special Eurobarometer 332 Tobacco European Commission Tobacco Fieldwork: October 2009 Publication: May 2010 Special Eurobarometer 332 / Wave TNS Opinion & Social This survey was requested by the Directorate General Health and Consumers and coordinated by the Directorate General Communication. This document does not represent 1 the point of view of the European Commission. The interpretations and opinions contained in it are solely those of the authors.
2
3 SPECIAL EUROBAROMETER 332 Tobacco Eurobarometer Tobacco Conducted by TNS Opinion & Social at the request of Directorate General Health and Consumers Survey co-ordinated by Directorate General Communication TNS Opinion & Social Avenue Herrmann Debroux, Brussels Belgium 2
4
5 SPECIAL EUROBAROMETER 332 Tobacco TABLE OF CONTENTS INTRODUCTION TOBACCO AND NICOTINE USE IN THE EU Smoking habits Smokers Ex-smokers Never smokers Evolutions Use of other tobacco and nicotine products Water pipe Non-combustible tobacco Products containing nicotine but not tobacco TOBACCO CONSUMPTION Frequency of using tobacco products Amount per day Number of cigarettes smoked Number of cigars smoked Number of pipes smoked GIVING UP SMOKING Frequency of attempts to give up Duration of latest attempt Aids used in latest attempt Aids used by smokers Aids used by ex-smokers Motivation to quit EXPOSURE TO SECOND-HAND SMOKE Exposure to tobacco smoke in private settings
6 SPECIAL EUROBAROMETER 332 Tobacco Smoking in the house Smoking in the car Exposure to tobacco smoke in public settings In bars and restaurants Exposure to tobacco smoke at work PERCEPTIONS OF CIGARETTES Factors influencing choice The taste The price The tar, nicotine and carbon monoxide levels The package Harmful effects Are all cigarettes equally harmful? Factors indicative of harmful effects TOBACCO PROMOTION AND PURCHASING Awareness of tobacco advertising or promotion Tobacco purchasing Attitudes to tobacco-control policies...96 CONCLUSIONS ANNEX TECHNICAL SPECIFICATIONS QUESTIONNAIRE TABLES 4
7 SPECIAL EUROBAROMETER 332 Tobacco INTRODUCTION The impact of tobacco on public health has been a concern for the European Union for over twenty years, with the first tobacco-control legislation being introduced in the late 1980s. Since then, EU legislation and policy as well as support for cessation and prevention of tobacco use have been further developed with the intention of encouraging tobacco users to quit, preventing tobacco initiation and protecting citizens from second-hand tobacco smoke. Despite the progress achieved, around a third of Europeans continue to smoke. Consequently, about people die each year from smoking related illnesses, of which around half are between years of age, well below their average life expectancy 1. Tobacco consumption remains a considerable concern for the European Union. This survey is the latest in a series of surveys to measure EU citizens behaviour and attitudes towards tobacco. The latest survey was conducted by telephone at the end of However, the most recent comparable survey (using the identical face-toface interviewing methodology) was completed in autumn While the questionnaire has been redesigned since 2006 and there is only one question to which direct comparisons can be made, if possible, parallels with the data from 2006 have been made where elements of the question are similar. The main themes addressed in this survey are: Who uses tobacco and nicotine products Frequency and amount of tobacco used per day Behaviour and attitudes towards giving up smoking Exposure to second-hand smoke in private and public settings Perceptions influencing cigarette choice and perceived indicators of harm Awareness of tobacco promotion, purchasing behaviour and attitudes to tobacco control-policies
8 SPECIAL EUROBAROMETER 332 Tobacco The survey fieldwork was carried out between the 2 nd and the 19 th of October 2009 by TNS Opinion and Social Network. The methodology used was that of the Directorate- General Communication ("Research and Speechwriting" Unit). The technical specifications at the end of the report detail the sample design and confidence intervals for the samples. ***** The Eurobarometer website can be consulted at the following address: We would like to take the opportunity to thank all the respondents across the continent who have given their time to take part in this survey. Without their active participation, this study would not have been possible. 6
9 SPECIAL EUROBAROMETER 332 Tobacco In this report, the countries are represented by their official abbreviations. The abbreviations used in this report correspond to: ABBREVIATIONS EU27 DK/NA BE BG CZ DK DE EE EL ES FR IE IT CY CY (tcc) LT LV LU HU MT NL AT PL PT RO SI SK FI SE UK HR TR MK European Union 27 Member States Don t know / No answer Belgium Bulgaria Czech Republic Denmark Germany Estonia Greece Spain France Ireland Italy Republic of Cyprus* Area not controlled by the government of the Republic of Cyprus Lithuania Latvia Luxembourg Hungary Malta The Netherlands Austria Poland Portugal Romania Slovenia Slovakia Finland Sweden The United Kingdom Croatia Turkey The Former Yugoslav Republic of Macedonia** * Cyprus as a whole is one of the 27 European Union Member States. However, the acquis communautaire is suspended in the part of the country that is not controlled by the government of the Republic of Cyprus. For practical reasons, only the interviews conducted in the part of the country controlled by the government of the Republic of Cyprus are recorded in the category CY and included in the EU27 average. The interviews conducted in the part of the country not controlled by the government of the Republic of Cyprus are recorded in the category CY(tcc) [tcc: Turkish Cypriot Community]. ** Provisional code which does not prejudge in any way the definitive nomenclature for this country, which will be agreed following the conclusion of negotiations currently taking place at the United Nations. 7
10 SPECIAL EUROBAROMETER 332 Tobacco 1 TOBACCO AND NICOTINE USE IN THE EU 1.1 Smoking habits Smokers - A third of EU citizens currently smoke cigarettes, cigars or a pipe - Almost a third of citizens in the European Union (29%) currently smoke either cigarettes, cigars or a pipe. Almost half claim that they have never smoked, while the remainder have given up smoking (22%). Southern Europe countries see the greatest proportion of smokers, specifically Greece, where the proportion of smokers exceeds 40%. Smoking is the next highest in Bulgaria (39%) and Hungary (38%) and Turkey (37%) and the Former Yugoslav Republic of Macedonia (37%). Conversely, in the Northern Member States of Sweden and Finland the proportion of smokers is the lowest at 16% and 21% respectively. 8
11 SPECIAL EUROBAROMETER 332 Tobacco 9
12 SPECIAL EUROBAROMETER 332 Tobacco Socio-demographically, smokers are more likely to be male than female, under 54 years of age and from lower social groups (groups 1-4). In terms of occupation, smokers are more likely to be unemployed, manual workers or self-employed. QD1 Regarding smoking cigarettes, cigars or a pipe, which of the following applies to you? You smoke at the present time EU27 29% Sex Male 35% Female 25% Age % % % % Respondent occupation scale Self- employed 35% Managers 25% Other white collars 32% Manual workers 39% House persons 27% Unemployed 52% Retired 17% Students 23% Self-positioning on the social staircase Low (1-4) 36% Medium (5-6) 29% High (7-10) 26% Smoking is more prevalent among the unemployed than those in work, with slightly over half of those who are unemployed being current smokers. Whereas, amongst the employed, manual workers are the most prevalent smokers with almost four in ten being smokers. 10
13 SPECIAL EUROBAROMETER 332 Tobacco Ex-smokers The Netherlands, Sweden and Denmark have the greatest proportion of respondents who have given up smoking; 33%, 31% and 31% respectively. The countries with the next greatest proportion of ex-smokers are Finland, France and Germany, each with between 26% and 27%. The UK, Slovenia and Austria are not far behind, with between 23% and 25% of respondents who have quit smoking. QD1 Regarding smoking cigarettes, cigars or a pipe, which of the following applies to you? You used to smoke but you have stopped EU27 22% Sex Male 27% Female 17% Age % % % % Respondent occupation scale Self- employed 23% Managers 24% Other white collars 20% Manual workers 22% House persons 15% Unemployed 15% Retired 32% Students 7% Self-positioning on the social staircase Low (1-4) 20% Medium (5-6) 23% High (7-10) 22% The lowest proportions of ex-smokers are in Turkey and the former Yugoslav Republic of Macedonia where only one in ten have given up smoking. Among the Member States, Romania, Portugal and Greece exhibit the lowest proportions of respondents who have given up smoking with 12%, 13% and 14% respectively. There are also four Member States with only 15% of ex-smokers. 11
14 SPECIAL EUROBAROMETER 332 Tobacco People who have given up smoking are more likely to be male and over 55 years of age. As a consequence of being older, they are also more likely to be retired. There is no difference in social group Never smokers Portugal has the greatest proportion of respondents who have never smoked, with almost two thirds (64%) claiming they have never smoked. Malta, Romania and Italy exhibit the next highest levels of those who have never smoked with 59%, 58% and 57% respectively having never smoked. The lowest proportions of those who have never smoked are seen in Denmark and France where only four in ten have never smoked. While there are relatively few respondents in Denmark and France who have never tried smoking it is encouraging that Denmark and France are among the countries with the greatest proportion of exsmokers. In terms of socio-demographics, non-smokers are more likely to be female than male, either under 24 years of age or over 55 years of age and from the higher social groups (groups 7-10). The employment status of those who have never smoked reflects their high social group and they tend to occupy managerial positions rather than manual occupations. As a consequence of being under 24 years, those who have never smoked also tend to be students. 12
15 SPECIAL EUROBAROMETER 332 Tobacco QD1 Regarding smoking cigarettes, cigars or a pipe, which of the following applies to you? You have never smoked EU27 49% Sex Male 38% Female 58% Age % % % % Respondent occupation scale Self- employed 42% Managers 51% Other white collars 48% Manual workers 39% House persons 58% Unemployed 33% Retired 51% Students 70% Self-positioning on the social staircase Low (1-4) 44% Medium (5-6) 48% High (7-10) 52% 13
16 SPECIAL EUROBAROMETER 332 Tobacco Evolutions Whilst the question was not asked in exactly the same way as it was in autumn it is possible to compare results. Compared to autumn 2006 (66.2), the proportion of citizens claiming they have never smoked has increased by two percentage points (49% in 2009) and the proportion of ex-smokers has increased by one percentage point (21% in 2006). On the other hand, the proportion of smokers has declined by three points (from 32% in 2006 to 29% in 2009). A marked decline in the proportion of smokers is recorded in particular in Germany, Italy, the Netherlands, Finland and the United Kingdom, with decreases of five points. On the other hand, a significant rise is observed in Belgium (four points). The greatest increases in the proportion of ex-smokers have been in Slovakia, Finland 5 and Luxembourg where five and six percentage point increases are evident. In addition, there have been increases of at least three percentage points in eight other EU Member States as shown in the table below. The increase in the proportion of those who have never smoked appears to have occurred in fewer countries than the increase in the proportion of ex-smokers. The greatest increases in those who have never smoked are in Sweden 6, Italy and the Czech Republic where there have been increases of seven, six and five percentage points respectively. In addition, only four other EU Member States have shown increases of three percentage points or more. 4 Chewing tobacco/ taking snuff were included in the results of This only impacts results for Sweden (In 2006, 8% of Swedish citizens said they chew tobacco /take snuff), Denmark and Finland (both 1% of chewing /snuffing in 2006). 5 Finnish results should be compared with care due to the inclusion of chewing and snuffing in the question of Swedish results are not comparable due to the inclusion of chewing and snuffing in the question of
17 SPECIAL EUROBAROMETER 332 Tobacco 15
18 SPECIAL EUROBAROMETER 332 Tobacco 1.2 Use of other tobacco and nicotine products - Relatively low usage by EU citizens of other products - Regular usage of tobacco and nicotine products other than cigarettes, cigars or pipes is very low, with only 1% of EU citizens using any of the products listed (water pipe, noncombustible tobacco, nicotine-only products) on a regular basis. One-off/occasional use is somewhat higher for all three products, especially water pipe. - Water pipe is the most used - The water pipe (shisha, hookah) is the most used of the three products, with 12% of EU citizens having tried it at least once. Non-combustible tobacco (such as snuff, snus or chewing tobacco) has been tried by about half as many EU citizens as the water pipe (6%) and products containing nicotine but not tobacco, such as electronic cigarettes and drinks, have been tried by only 3%. QD2.1 Have you ever tried any of the following products? - % EU Total Yes No DK Water pipe (shisha, hookah) 12% 88% Oral tobacco (such as snuff, snus or chewing tobacco) 6% 94% Products containing nicotine but not tobacco (such as electronic cigarettes or nicotine drinks) 3% 96% Regular or one-off/occasional use of multiple other tobacco and nicotine products is greatest in Finland, Sweden and Denmark. In Finland, 9% of respondents are regularly using all three of these products or have tried them at least once. In Sweden and Denmark, regular or one-off/occasional use of two of these products is the highest; 18% and 11% respectively. In the following table, we can observe that the 16

19 SPECIAL EUROBAROMETER 332 Tobacco regular use of oral tobacco is particularly high in Sweden, where one ex-smoker out of five (19%) uses it regularly, and even 7% among never smokers. Regular or one-off/occasional use of other tobacco or nicotine products is lowest in Hungary, Spain, Portugal, Italy, Romania and Malta, and in the non-eu countries of Croatia and the Former Yugoslav Republic of Macedonia. In these countries, at least nine out of ten people are not using or have not tried any of the other tobacco or nicotine products listed Water pipe Regular usage is consistently low across countries (1%). However, one-off/occasional use of the water pipe is considerably higher (11%) and varies considerably between countries. Regular or one-off/occasional use of the water pipe is more than double the EU average in Latvia, Estonia, Denmark, Lithuania, Sweden and Cyprus where it is at its highest. In contrast, regular or one-off/occasional use is less than half the EU average in Ireland, Malta, Portugal, Romania, Spain and Italy and the non-eu countries of Croatia and the Former Yugoslav Republic of Macedonia. 17
20 SPECIAL EUROBAROMETER 332 Tobacco Demographically, water pipe regular or one-off/occasional users are more likely to be male, young (aged years and also to a lesser extent aged years), have some form of higher education (they are either still in education or completed their education over 20 years of age) and from the higher social groups. - Some of those who have never smoked have tried a water pipe - Regular or one-off/occasional use of a water pipe is not exclusive to current smokers or those who have smoked in the past. Whilst regular or one-off/occasional use is more prevalent among current smokers, there are those who have never smoked in the past who have tried a water pipe. 18
21 SPECIAL EUROBAROMETER 332 Tobacco QD2.1 Have you ever tried any of the following products? Water pipe (shisha, hookah) Yes (Total) No DK EU27 12% 88% 0% Sex Male 15% 84% 1% Female 8% 91% 1% Age % 73% 1% % 83% 0% % 90% 1% % 96% 0% Education (End of) 15-4% 95% 1% % 89% 0% % 83% 1% Still studying 25% 74% 1% Respondent occupation scale Self- employed 13% 86% 1% Managers 17% 82% 1% Other white collars 15% 85% 0% Manual workers 12% 87% 1% House persons 5% 94% 1% Unemployed 15% 84% 1% Retired 3% 96% 1% Students 25% 74% 1% Self-positioning on the social staircase Low (1-4) 12% 87% 1% Medium (5-6) 11% 89% 0% High (7-10) 14% 85% 1% 19
22 SPECIAL EUROBAROMETER 332 Tobacco Non-combustible tobacco - Only in Sweden is there significant use of non-combustible tobacco - Regular usage of non-combustible tobacco is consistently low across almost all countries. Sweden is the only country where there is significant regular usage, at 12%, in the other countries regular usage is 3% or less. One-off/occasional use of non-combustible tobacco is also highest in Sweden, with more than a quarter of respondents having tried it. In Finland, one-off/occasional use is the next highest with almost two in ten having tried it. 20
23 SPECIAL EUROBAROMETER 332 Tobacco One-off/occasional use of non-combustible tobacco in Denmark, Austria and Estonia ranks third and is double the EU average. On the other hand, in Malta and Romania and Turkey one-off/occasional use is lowest at 1% or less. - Non-combustible tobacco is being used by some who have never smoked - Non-combustible tobacco is consumed by more males than females, those who continued their education after the age of 20 years and those employed as managers and the self-employed. Smokers and ex-smokers are equally likely to be the main consumers of non-combustible tobacco (9% of smokers use it regularly or have tried it; 10% of ex-smokers use it regularly or have tried it). Notably, non-combustible tobacco is being used by some who have never smoked tobacco (2% of those who have never smoked have tried non-combustible tobacco). QD2.2 Have you ever tried any of the following products? Oral tobacco (such as snuff, snus or chewing tobacco) Yes (Total) No DK EU27 6% 94% 0% Sex Male 9% 90% 1% Female 2% 97% 1% Age % 92% 1% % 92% 1% % 93% 1% % 95% 1% Education (End of) 15-4% 96% 0% % 94% 0% 20+ 8% 91% 1% Still studying 7% 92% 1% Respondent occupation scale Self- employed 9% 90% 1% Managers 10% 90% 0% Other white collars 7% 93% 0% Manual workers 6% 94% 0% House persons 2% 97% 1% Unemployed 5% 94% 1% Retired 4% 95% 1% Students 7% 92% 1% Smokers/ Non-Smokers Smokers 9% 91% 0% Stopped smoking 10% 90% 0% Never smoked 2% 97% 1% 21
24 SPECIAL EUROBAROMETER 332 Tobacco Products containing nicotine but not tobacco - In most countries regular or one-off/occasional use is 5% or less - On average, 3% of Europeans use regularly (1%) or have tried at least once (2%) products containing nicotine but not tobacco. - Regular or one-off/occasional use is in double digits in Finland, Denmark and Sweden - The most notable exceptions are Finland, Denmark and Sweden. In each of these countries, the combination of those who use these products regularly plus those who have tried them at all is in double digits in each country (14%, 13% and 10% respectively). The other countries in which the regular and one-off/occasional use of products containing nicotine but not tobacco exceeds 5% are Slovenia and the UK. In Greece, Spain, Cyprus, Lithuania and Portugal and in the non-eu countries of Croatia, Turkey and the Former Yugoslav Republic of Macedonia regular or oneoff/occasional use of products containing nicotine but not tobacco is lowest at only 1%. 22
25 SPECIAL EUROBAROMETER 332 Tobacco - Products containing nicotine showing some appeal to never smokers - Demographically, products containing nicotine but not tobacco appeal to current smokers more than others; however, these products are not exclusively appealing to smokers or those who have given up smoking. Some respondents who have never smoked have also tried these products containing nicotine but not tobacco but, as with non-combustible tobacco, they are not the main consumers of these products. 23
26 SPECIAL EUROBAROMETER 332 Tobacco QD2.3 Have you ever tried any of the following products? Products containing nicotine but not tobacco (such as electronic cigarettes or nicotine drinks) Yes (Total) No DK EU27 3% 96% 1% Sex Male 4% 96% 0% Female 2% 97% 1% Age % 96% 1% % 95% 0% % 96% 1% 55+ 2% 97% 1% Education (End of) 15-2% 97% 1% % 96% 0% 20+ 4% 95% 1% Still studying 2% 97% 1% Respondent occupation scale Self- employed 5% 95% 0% Managers 3% 96% 1% Other white collars 4% 95% 1% Manual workers 4% 96% 0% House persons 3% 97% 0% Unemployed 4% 96% 0% Retired 2% 97% 1% Students 2% 97% 1% Self-positioning on the social staircase Low (1-4) 3% 96% 1% Medium (5-6) 3% 96% 1% High (7-10) 4% 95% 1% Smokers/ Non-Smokers Smokers 7% 93% 0% Stopped smoking 4% 96% 0% Never smoked 1% 98% 1% 24
27 SPECIAL EUROBAROMETER 332 Tobacco 2 TOBACCO CONSUMPTION 2.1 Frequency of using tobacco products - Manufactured cigarettes are smoked most frequently - QD3a Do you use the following tobacco products every day, occasionally or not at all? - EU (Base: Smokers, n=7851) Yes, every day Yes, occasionally No, not at all Manufactured cigarettes 79% 14% 7% Hand-rolled cigarettes 15% 19% 66% Cigars 12% 87% Water pipe (shisha, hookah) 9% 91% Pipe 4% 95% 25
28 SPECIAL EUROBAROMETER 332 Tobacco Manufactured cigarettes are the most widely used tobacco product in the EU. Amongst current smokers, eight out of ten smoke manufactured cigarettes daily (equivalent to 23% of EU citizens, with an additional 4% smoking them occasionally). Hand-rolled cigarettes, on the other hand, are only smoked every day by one in seven smokers with slightly more smoking them occasionally (4% of EU citizens smoke them daily and 6% smoke them occasionally). Cigars, water pipes and pipes are smoked far less than cigarettes (13%, 9% and 5%, respectively) and all three are used almost exclusively on an occasional basis only. Everyday usage is highest in Bulgaria, Romania, Italy, Austria, Greece, Latvia, Turkey, and the Former Yugoslav Republic of Macedonia and Croatia with over 90% of smokers smoking manufactured cigarettes every day. Bulgaria, Greece, Turkey and the Former Yugoslav Republic of Macedonia are also among those with the highest proportion of smokers, which indicates that these countries are those with a high proportion of relatively frequent smokers. Conversely, in the Netherlands, UK, Belgium, France and Germany smoking of manufactured cigarettes is lower than the EU average (49%, 67%, 68%, 68%, 69% respectively). Hand-rolled cigarettes are smoked by one in three EU smokers. However, at least half of all smokers in the Netherlands, Belgium and the UK smoke hand-rolled cigarettes either every day or occasionally although these countries had lower than average usage of manufactured cigarettes smokers the use of hand-rolled cigarettes appears to be substituting it. Hand-rolled cigarette usage is lowest in Bulgaria and Romania, with one in ten or less smoking them. Socio-demographically, men and the lower social groups (1-4) smoke hand-rolled cigarettes more than others. - Cigars, water pipes and pipes mainly smoked occasionally - Cigars tend to be smoked occasionally rather than daily (12% occasionally versus 1% every day ). Consumption is particularly high in Finland, Austria and the Netherlands, where occasional consumption reaches 27%, 23% and 21% respectively. Conversely, total consumption is relatively low in Bulgaria (4%), Poland (4%), Ireland (7%) and Greece (8%) and in the candidate countries of Croatia (8%) and Turkey (8%). Demographically, cigar smokers tend to be men (21% among men compared with 3% 26
29 SPECIAL EUROBAROMETER 332 Tobacco among women) and from the higher social groups (17% of higher social groups compared with 11% in lower social groups). Water pipe usage among smokers is almost exclusively reserved for occasional use (9% at European level); very few use water pipes daily. Occasional use is significantly higher in the Member States of Latvia (22%), Lithuania (20%), the Czech Republic (20%) and Estonia (19%) and Turkey (23%). On the other hand, usage is low in Ireland (2%), Italy (3%) and Portugal (3%) and in the candidate countries of Croatia (2%) and the Former Yugoslav Republic of Macedonia (3%). Water pipes are used by men more than women (11% and 6% respectively) and by year olds (23%); as a consequence of the younger age profile they are used by students more than others (27%). Pipe usage varies between countries but for the most part it is consistently low (5% at European level). Usage is markedly higher in Lithuania (15%) where overall use is consequently triple the EU average. Pipe usage is lowest in Bulgaria (1%), Greece (1%) and Cyprus (1%) and the candidate country of Croatia (1%). Men smoke pipes more than women (7% and 1% respectively). - Nine out of ten ex-smokers used to smoke manufactured cigarettes - Most ex-smokers recall smoking manufactured cigarettes before they gave up; 69% every day and 21% occasionally. Use of manufactured cigarettes was highest in Malta (99%), Bulgaria (98%), Cyprus (98%), Finland (98%) and Turkey (100%). Conversely, use of manufactured cigarettes was lowest in Romania (80%) and Slovakia (81%). 27
30 SPECIAL EUROBAROMETER 332 Tobacco QD3b Before quitting, did you use the following tobacco products every day, occasionally or not at all? - EU (Base: Ex-smokers, n=5910) Yes, every day Yes, occasionally No, not at all Manufactured cigarettes 69% 21% 10% Hand-rolled cigarettes 8% 17% 75% Cigars 19% 79% Pipe 10% 87% On average, a quarter of ex-smokers report rolling their own cigarettes either every day or occasionally. However, the Dutch recalled the highest levels of rolling their own (52%) and the Bulgarians the lowest (6%). One in five ex-smokers recalled smoking cigars, mainly on an occasional basis. The incidence of cigar smoking was highest among Dutch and Finnish ex-smokers at 37% and 33% respectively, whilst it was lowest among Bulgarians (6%) and the non-eu Croatians (5%). Fewer ex-smokers remembered smoking a pipe (13% either every day or occasionally). The incidence of pipe smoking was highest in Denmark, Finland and Sweden where between 24% and 28% smoked a pipe before quitting. The incidence of pipe smoking was relatively low across countries and was 5% or less in seven of the remaining 24 EU countries and in two of the non-eu countries. 28
31 SPECIAL EUROBAROMETER 332 Tobacco 2.2 Amount per day Number of cigarettes smoked - The country averages range from half a pack to a pack of cigarettes a day - On average EU smokers are smoking 14.4 cigarettes (manufactured or hand-rolled) per day. The average ranges from as few as 10.1 cigarettes per day in Sweden to slightly over 21 in Greece and Cyprus. EU27 average = 14.4 cigarettes per day Base: Cigarettes smokers, n=
32 SPECIAL EUROBAROMETER 332 Tobacco QD4a On average, how many cigarettes do you smoke each day? (IF 'CIGARETTES SMOKER', CODE 1 OR 2 IN QD3a1 OR code 1 OR 2 IN QD3a2) CY EL AT SI LU MT HU IE BG BE PT PL RO DE UK DK EU27 NL ES CZ SK EE LV IT FI LT FR SE CY (tcc) 21.6 HR MK TR The number of cigarettes smoked varies by socio-demographic; men are smoking more than women, younger smokers are smoking less than others, lower social groups tend to smoke more than higher groups, the self-employed are smoking more than others in employment and students are smoking the least. 30
33 SPECIAL EUROBAROMETER 332 Tobacco In addition, those exposed to tobacco smoke at work are smoking more cigarettes per day than those who are not exposed to tobacco smoke at work. Therefore, the implication is that by not being around smoke at work people are smoking fewer cigarettes per day in total. Further research would be needed to understand if people choose to avoid smoke at work or if this restriction is being enforced on them. QD4a On average, how many cigarettes do you smoke each day? (IF 'CIGARETTES SMOKER', CODE 1 OR 2 IN QD3a1 OR code 1 OR 2 IN QD3a2) Average EU Sex Male 15.7 Female 12.8 Age Education (End of) Still studying 9.9 Respondent occupation scale Self- employed 17.1 Managers 13.2 Other white collars 13.4 Manual workers 14.8 House persons 14.2 Unemployed 15.3 Retired 15.2 Students 9.9 Self-positioning on the social staircase Low (1-4) 15.3 Medium (5-6) 14.3 High (7-10) 13.8 Exposure to tobacco at work Yes 16.1 No
34 SPECIAL EUROBAROMETER 332 Tobacco Number of cigars smoked Fewer cigars are smoked per day than cigarettes as would be expected given that cigars tend to be smoked occasionally. The average cigar smoker in the EU smokes 3.4 cigars per day. EU27 average = 3.4 cigars per day Base: Cigars smokers, n=1027 There is a range in the number of cigars smoked per day across countries, from less than one per day in Cyprus and Turkey and the Former Yugoslav Republic of Macedonia to 9.2 per day in Estonia 7. Since cigars are not as widely smoked as cigarettes the respondent base per country is relatively small and so caution should be taken in drawing definitive conclusions per country. Nevertheless, it is evident that cigar smokers in Estonia and Austria and the non-eu country of Croatia are smoking relatively more than others (9.2, 7.1 and 13.2 per day respectively). 7 Please note that the total amount of cigar smokers per country is very low (base for EU27 = 1027 respondents). All analytical reflection between countries should therefore be treated with extreme care. 32
35 SPECIAL EUROBAROMETER 332 Tobacco Number of pipes smoked The number of pipes smoked by pipe smokers per day is of the same magnitude as the number of cigars smoked by cigar smokers, at 3.2 pipes per day. EU27 average = 3.2 pipes per day Base: Pipe smokers, n=354 However, the frequency of pipe smokers is less than half that of cigar smokers since only 5% smoke a pipe either occasionally or every day, whereas 13% smoke a cigar on the same basis. Thus, the bases per country do not permit further country analysis. 33
36 SPECIAL EUROBAROMETER 332 Tobacco 3 GIVING UP SMOKING 3.1 Frequency of attempts to give up - Three out of ten smokers have tried to quit in the last 12 months - On average, almost three out of ten smokers across the EU countries have tried to quit smoking at least once in the last 12 months (28%). Almost half of those who have tried to give up smoking have tried to do so on more than one occasion. 34
37 SPECIAL EUROBAROMETER 332 Tobacco More smokers in Lithuania, Latvia and Estonia have tried to give up than in any of the other countries (47%, 43% and 43% respectively attempting to give up at least once). - In Portugal and Greece only 17% of smokers attempt to give up - In Portugal and Greece the lowest incidence of attempting to quit smoking is seen, with only 17% of smokers in each country trying to give up smoking. - A small fall at European level compared to 2006 conceals very different situations in each country - Whilst the question was not asked in exactly the same way as in autumn 2006, it is possible to compare results. Compared to autumn 2006 (66.2), the proportion of respondents claiming they have tried to quit smoking in the last 12 months has declined by three percentage points (from 31% in 2006 to 28% in 2009). A strong fall in the proportion of smokers trying to quit can be seen above all in Hungary and Portugal (decline of fifteen percentage points), the United Kingdom and Bulgaria (-14) and Greece (-13). On the other hand, some significant increases are observed in the Baltic States of Lithuania, Estonia and Latvia, with increases of 21, 15 and 11 points respectively. 35
38 SPECIAL EUROBAROMETER 332 Tobacco QD10 Have you tried to quit smoking in the last 12 months? * Total Yes Diff EU27 31% 28% -3 BE 34% 28% -6 BG 42% 28% -14 CZ 28% 22% -6 DK 36% 29% -7 DE 27% 25% -2 EE 28% 43% +15 IE 40% 35% -5 EL 30% 17% -13 ES 19% 23% +4 FR 31% 26% -5 IT 22% 23% +1 CY 38% 29% -9 LV 32% 43% +11 LT 26% 47% +21 LU 37% 27% -10 HU 43% 28% -15 MT 36% 33% -3 NL 31% 25% -6 AT 18% 21% +3 PL 34% 40% +6 PT 32% 17% -15 RO 32% 38% +6 SI 24% 29% +5 SK 40% 29% -11 FI 33% 38% +5 SE 32% 34% +2 UK 46% 32% -14 CY (tcc) 29% 35% +6 HR 27% 27% 0 TR NA 24% MK NA 36% * The wording in 2006 was slightly different: "Have you tried to give up smoking in the last 12 months? (IF YES) How many times have you tried to give up smokingin the last 12 months?" 36
39 SPECIAL EUROBAROMETER 332 Tobacco There are few socio-demographics distinguishing a smoker who attempts to quit smoking. Those who try to give up are female rather than male and younger (under 39 years) rather than older smokers. Notably, there is no relevant difference between social groups. QD10 Have you tried to quit smoking in the last 12 months? (IF 'SMOKE AT THE PRESENT TIME', CODE 1 IN QD1) Yes (total) No DK EU27 28% 72% 0% Age % 66% 1% % 72% 0% % 75% 0% % 72% 0% Education (End of) 15-27% 73% 0% % 73% 0% % 70% 1% Still studying 32% 68% 0% Respondent occupation scale Self- employed 21% 79% 0% Managers 29% 71% 0% Other white collars 28% 72% 0% Manual workers 24% 75% 1% House persons 31% 69% 0% Unemployed 35% 64% 1% Retired 28% 71% 1% Students 32% 68% 0% Self-positioning on the social staircase Low (1-4) 29% 71% 0% Medium (5-6) 28% 72% 0% High (7-10) 28% 72% 0% Exposure to tobacco at work Yes 26% 74% 0% No 25% 75% 0% 37

40 SPECIAL EUROBAROMETER 332 Tobacco 3.2 Duration of latest attempt - The duration of the attempt is shorter compared to When smokers try to give up smoking the length of time they are successful for before they smoke again varies. On average, among the respondents who had tried to give up, about half quit for less than a week (51%) whilst the other half (48%) managed to quit for up to 2 months (29%) and longer (19%) before smoking again. The length of time that smokers are able to give up for has changed since autumn 2006 when 66.2 was conducted. In 2006, 27% had given up for more than two months at their last attempt. This is significantly different from the 19% now who claim that their last attempt lasted over 2 months. Inner pie: 66.2 (Autumn 2006) Outer pie: (Autumn 2009) Base: Those who have tried quitting in the last 12 months, n=2174; 66.2, n=
41 SPECIAL EUROBAROMETER 332 Tobacco There are country variations in the differences between 66.2 and now, however the small base sizes mean that definitive country conclusions are unreliable with exception of the following: fewer respondents in the Czech Republic, Slovakia, Hungary, Greece, France, the UK, and Sweden stop for over two months. On the contrary, compared to 2006, a greater proportion of Maltese respondents indicated now that they stopped for over two months. In 2009, Spain is the only country where smokers are able to give up for longer than the EU average, with 64% quitting for more than a week at their last attempt. In Slovakia and Italy smokers are less successful than their counterparts in the EU, with only 24% and 30% respectively quitting for more than a week at their last attempt. 3.3 Aids used in latest attempt Aids used by smokers - 33% of smokers used a quitting aid in their latest attempt - A third of smokers used at least one aid in their last attempt to quit smoking. In Austria, Sweden, Finland, the UK, Denmark, Ireland and Belgium smokers who have attempted to quit but have started smoking again show a higher than average use of quitting aids. Smokers using the fewest aids are those from Germany, where around nine out of ten do not use aids in their attempts to give up smoking. 39
42 SPECIAL EUROBAROMETER 332 Tobacco 40
, the UK (46%), Finland (45%), Denmark (42%) and Ireland (40%).")
43 SPECIAL EUROBAROMETER 332 Tobacco - Nicotine replacement medications are the most popular quitting aid - Nicotine replacement medications are the most popular quitting aid used by smokers (23%). The greatest use of nicotine replacement medications is in Austria (57%), the UK (46%), Finland (45%), Denmark (42%) and Ireland (40%). Notably, Austria, Finland and Denmark are also countries where the use of other nicotine products (water pipe, oral tobacco and other products) is higher than in the rest of Europe. Use is lowest in Greece and East Germany, where it is 3% or less. Second to nicotine replacement medications among smokers who have attempted to give up is advice from doctors and or other health professionals (15%). Advice from doctors and health professionals varies from around 30% in the UK and Belgium to 3% in Estonia. QD12a. At your last quit attempt, did you use any of the following? (Base: Smokers who have tried quitting in the last 12 months) Answer: Yes Please note that the total amount of unsuccessful quitters per country is very low. We have therefore divided countries into 3 groups: countries with a score significantly higher than the EU average, countries at EU average (not shown below) and countries with a score significantly lower than the EU average About one in fifteen used prescription medication in their last quit attempt. Smokers in Belgium, Finland and the UK use prescribed medication the most, whereas conversely 41
44 SPECIAL EUROBAROMETER 332 Tobacco those in Estonia do not use it; this is not surprising given that relatively few Estonian smokers (3%) sought advice from a doctor or health professional when trying to quit. - Quitlines and alternative therapies are among the least popular aids - The use of quitlines and alternative therapies is relatively low among smokers who have failed to quit. Only in Sweden and the UK are there notable country differences. In the UK, 17% are using special stop-smoking services such as clinics or specialists, compared to the EU average of 5%. In Sweden, 25% of smokers used noncombustible tobacco in their last failed attempt compared to the EU average of 2%. Socio-demographically, quitting aids are more likely to be used by smokers aged years; smokers under 24 years are least likely to use them. As a consequence of this age profile, students are also less likely to be users of quitting aids. QD12aT Number of aids used at last quit smoking attempt (IF 'HAS TRIED QUITTING IN THE LAST 12 MONTHS', CODE 1 TO 3 IN QD10) None Average EU27 67% 0.6 Age % % % % 0.6 Education (End of) 15-66% % % 0.8 Still studying 79% 0.3 Self-positioning on the social staircase Low (1-4) 68% 0.5 Medium (5-6) 63% 0.7 High (7-10) 71%
45 SPECIAL EUROBAROMETER 332 Tobacco Aids used by ex-smokers - One in five ex-smokers used a quitting aid when they gave up - Only 20% of ex-smokers used aid when they stopped smoking. Ex-smokers in Austria, Sweden, Ireland and Denmark exhibited the highest use of smoking aids. Use of aids among ex-smokers was lowest in Latvia, Italy and Lithuania, where 90% or more did not use any aids when they gave up smoking. 43

46 SPECIAL EUROBAROMETER 332 Tobacco 44

47 SPECIAL EUROBAROMETER 332 Tobacco Ex-smokers cite advice from the doctor or health professional as being the aid they used most to help them (13%), varying between countries from 1% in Latvia to 26% in Malta. Second among ex-smokers is the use of nicotine replacement medications at 9%, which is highest in Austria and Denmark. Use of nicotine replacement medications is lowest in Bulgaria and Malta. Use of the other aids (such as prescription medication, clinics, alternative therapies and quitlines) among ex-smokers is relatively low overall, with 3% or less using them to quit. The only notable country exceptions are in Sweden and Austria. The use of non-combustible tobacco in Sweden and Austria is 22% and 8% respectively and the use of alternative therapies such as acupuncture or hypnosis in Austria is 13%. QD12b. To quit smoking, did you use any of the following? (Base: Ex-smokers) Answer: Yes Please note that the total amount of unsuccessful quitters per country is very low. We have therefore divided countries into 3 groups: countries with a score significantly higher than the EU average, countries at EU average (not shown below) and countries with a score significantly lower than the EU average 45
48 SPECIAL EUROBAROMETER 332 Tobacco Socio-demographically, ex-smokers who are years of age are more likely to have used a quitting aid when they gave up than other age groups. Those aged years are not likely to have used a quitting aid when they gave up, 87% did not use one compared to the EU average of 80%. QD12bT Number of aids used to stop smoking (IF 'USED TO SMOKE BUT HAS STOPPED', CODE 2 IN QD1) None Average EU27 80% 0.3 Age % % % % 0.3 Education (End of) 15-80% % % 0.3 Still studying 85% 0.3 Self-positioning on the social staircase Low (1-4) 77% 0.3 Medium (5-6) 80% 0.3 High (7-10) 80%
49 SPECIAL EUROBAROMETER 332 Tobacco 3.4 Motivation to quit - Personal health is the main motivator to quit - Personal health is the primary motivator, with around seven out of ten smokers (71%) agreeing that this led them to think about quitting. The incidence of personal health as a motivator is highest among Irish and Finnish smokers, where nine out of ten agreed that it made them think about quitting in the last 12 months. Conversely, the lowest incidence is among Italian smokers, where only 45% felt the same. QD13a. Has any of the following things led you to think about quitting in the last 12 months? - EU (Smokers who have tried quitting in the last 12 months) Answer: Yes Concern about your personal health 71% Family/ partner/ friends 52% The price of tobacco products 47% Concern about the effect of your smoke on non-smokers 35% Advice from a doctor or other health professional Smoking restrictions in public places like bars and restaurants The society disapproves of smoking Smoking restrictions at work Warning labels on tobacco packages A media campaign 21% 20% 19% 16% 14% 11% Free, or lower cost, stop-smoking medication 6% Availability of telephone quitline 2% Second to personal health is family/partner/friends, with about half agreeing that these people made them think about giving up. The impact of family/partner/friends is greatest in Slovakia, with 80% of smokers agreeing that family/partner/friends led them to think about quitting. The lowest incidence of agreement with family/partner/friends is among Italian smokers (38%). 47
50 SPECIAL EUROBAROMETER 332 Tobacco The price of tobacco is close to family/partner/friends, with 47% agreeing that it made them think about quitting. The incidence of price is highest in Slovakia (76%), Hungary (75%) and Ireland (70%). Whilst it is least motivating in Denmark (22%) and Luxembourg (23%). Concern for the effect of smoke on non-smokers ranks fourth, with about a third agreeing that this concern led them to think about quitting. Irish, Macedonian and Croatian smokers are most motivated by the impact of their smoking on others with 50% or more agreeing that this led them to think about quitting. Whilst at the other extreme, only 12% of Swedish smokers feel the same. The advice of a doctor or health professional, society s disapproval of smoking and smoking restrictions in public places are all equally motivating factors that led smokers to think about quitting, with one in five agreeing with each. Smokers in Austria are most motivated by the advice of a doctor or health professional with four in ten agreeing this led them to think about quitting. Those least motivated by the advice of a doctor or health professional are those from Latvia and Lithuania and Croatia; less than 10% in each country agreed the same. Slovakian and Irish smokers are most influenced by society s disapproval of smoking and by smoking restrictions in public places, with four in ten in each country agreeing that both society s disapproval and smoking restrictions made them think about quitting. Slovenian smokers are the least motivated by society s disapproval, with only one in ten agreeing that this led them to think about quitting. 48
 Please note that the total amount of unsuccessful quitters per country is very low.")
51 SPECIAL EUROBAROMETER 332 Tobacco QD13a. Has any of the following things led you to think about quitting in the last 12 months? Answer: Yes (Smokers who have tried quitting in the last 12 months) Please note that the total amount of unsuccessful quitters per country is very low. We have therefore divided countries into 3 groups: countries with a score significantly higher than the EU average, countries at EU average (not shown below) and countries with a score significantly lower than the EU average 49
52 SPECIAL EUROBAROMETER 332 Tobacco Smoking restrictions at work are slightly less motivational that those in public places, with 16% of smokers agreeing that restrictions at work are a factor. Slovakian smokers agreed most that restrictions at work led them to quit (43%) while less than 10% of smokers in Lithuania, Estonia and Slovenia felt the same. Warning labels on the tobacco packages are similarly motivational to smoking restrictions at work (14% agree). A media campaign is the third least likely motivator to quit (11%). Aids to quitting tend not to be one of the reasons why respondents attempt to give up. The availability of stop-smoking medication (6%) and telephone quitlines (2%) are the lowest mentioned reasons. - Socio-demographic differences vary by motivating factor - The socio-demographic differences are dependent upon the factor being considered. The differences of the five most motivating factors are reviewed below. The primary factor, concern for personal health, is most prevalent among 25 to 54 year olds, those who are well educated and managers. Although also concerned with health, advice from a doctor or health professional is more motivational to a different sub-group, being more frequent among those over 55 years of age, the retired and those from lower social groups. The second most motivating factor of family/ partner/ friends is most prevalent among 25 to 54 year olds, managers and lower social groups. The price of tobacco products is most motivational among year olds, those who are self-employed, manual workers and students. Whereas those who are most concerned about the effect of their smoke on non-smokers are more likely to be women, the self-employed, house persons and those in lower social groups. 50
.")
53 SPECIAL EUROBAROMETER 332 Tobacco Calculating the correlation between the factors mentioned by ex-smokers and smokers shows that successful and unsuccessful quitters are motivated by similar factors (the Pearson correlation rate is equal to 0.97, meaning that the correlation between exsmokers and smokers for each factor is very high). The main difference between the two groups is that successful quitters (ex-smokers) are motivated by fewer factors (on average 2.3) than unsuccessful quitters (on average 3.2) factors. 51
54 SPECIAL EUROBAROMETER 332 Tobacco 4 EXPOSURE TO SECOND-HAND SMOKE 4.1 Exposure to tobacco smoke in private settings Smoking in the house - 38% of EU citizens allow smoking inside the home - Smoking in the home is allowed by four in ten EU citizens. Of those who do allow it, the majority restrict it to certain rooms in the house. One in seven EU citizens allow smoking anywhere in their homes. The level of smoking permissiveness is correlated with the proportion of smokers in a given country. Indeed, the proportion of non-smokers is correlated with the percentage who do not allow smoking anywhere in the house (the Pearson correlation rate between the variables non-smokers and not allowing smoking anywhere in the house is equal to 0.77, meaning that these two variables have a strong tendency to evolve in the same way). 52
, at least one in four allow smoking everywhere in the house.")

55 SPECIAL EUROBAROMETER 332 Tobacco - The most permissive countries are those with the highest rates of smoking - In the most permissive Greece, Spain and Cyprus and all of the non-eu countries (Croatia, Turkey and the Former Yugoslav Republic of Macedonia), at least one in four allow smoking everywhere in the house. Notably, among these countries are some of the highest consumers of manufactured cigarettes; specifically Greece and all of the non-eu countries. This is also the case in the Turkish Cypriot Community. Finnish and Swedish respondents are the strictest about smoking in their homes, with 95% and 86% respectively not allowing smoking in the home at all. 53
56 SPECIAL EUROBAROMETER 332 Tobacco Allowing smoking in limited parts of the house is most prevalent in Latvia and Croatia, 42% in each country. Followed by Bulgaria (38%), Estonia (36%), Romania (35%) and Greece (34%) and the Former Yugoslav Republic of Macedonia (37%). - Finnish and Swedish smokers are least permissive of smoking in the house - Smokers are more permissive of smoking inside the house with 70% of smokers allowing smoking somewhere inside the house and only 30% not allowing it anywhere inside the house. Finnish and Swedish smokers are the most notable exceptions to this average, with 87% and 67% respectively not allowing smoking anywhere inside the house. 54
57 SPECIAL EUROBAROMETER 332 Tobacco QD6.1 Which statement best describes smoking situation inside your house? Smokers Smoking is not allowed at all inside the house Smoking is allowed only in certain rooms inside the house Smoking is allowed everywhere inside the house DK EU27 30% 42% 28% FI 87% 8% 5% SE 67% 25% 8% LT 46% 39% 15% SI 45% 38% 17% DE 42% 39% 19% LU 42% 41% 17% MT 41% 37% 22% IE 40% 27% 33% FR 39% 41% 20% SK 38% 51% 11% CZ 34% 48% 18% HU 33% 40% 27% UK 32% 36% 32% EE 31% 59% 10% PT 31% 36% 32% NL 27% 44% 29% IT 26% 45% 28% CY 26% 33% 41% LV 26% 62% 12% BE 25% 45% 29% DK 24% 43% 33% ES 23% 38% 39% PL 19% 47% 33% EL 18% 44% 38% AT 18% 50% 32% RO 17% 56% 27% BG 16% 55% 29% CY (tcc) 35% 31% 33% TR 35% 32% 33% MK 23% 39% 38% HR 17% 45% 38% Base: Smokers, n=7852. Warning: In some countries, bases are very low. 55
58 SPECIAL EUROBAROMETER 332 Tobacco - A quarter of non-smokers are exposed to tobacco smoke at home - Among non-smokers, about one in four allow smoking in their homes and consequently they have the potential to become passive smokers. Within the EU, non-smokers are the most permissive in Cyprus, Greece and Spain, where four to five out of ten nonsmokers are allowing smoking in their homes. However, in all of the non-eu countries non-smokers are more permissive than the EU average, with six out of ten allowing smoking in their homes in Croatia and the Former Yugoslav Republic of Macedonia and four out of ten allowing it in Turkey. 56
59 SPECIAL EUROBAROMETER 332 Tobacco - Those who smoke themselves tend to allow smoking in the home - The main difference between those who allow smoking in the house and those who do not appears to be whether they smoke or not themselves. Those who allow smoking anywhere in the house tend to be smokers whereas those who do not allow it tend to be those who have never smoked. Those who have given up smoking appear to be more tolerant of smoke in their homes than those who have never smoked and allow it in restricted rooms in the house. Demographically, those who allow smoking throughout the house are from lower social group and are from single person households. Those who do not allow smoking in the house tend to be from higher social groups and from households of four or more people. Those where smoking is restricted to certain rooms are also from lower social groups with households around three people in size. QD6.2 Which statement best describes smoking situation inside your house? Smoking is not allowed at all inside the house Smokers Ex-smokers Non-smokers Smoking is Smoking is Smoking is allowed Smoking is Smoking is allowed Smoking is Smoking is allowed only in certain rooms inside the house allowed everywher e inside the house not allowed at all inside the house only in certain rooms inside the house allowed everywher e inside the house not allowed at all inside the house only in certain rooms inside the house Smoking is allowed everywher e inside the house EU27 30% 42% 28% 70% 20% 9% 73% 17% 9% Sex Male 32% 39% 29% 70% 19% 10% 74% 16% 9% Female 28% 46% 26% 71% 20% 8% 73% 17% 8% Household composition 1 14% 40% 46% 65% 19% 14% 71% 15% 12% 2 29% 43% 28% 69% 20% 10% 73% 17% 9% 3 34% 45% 21% 72% 20% 7% 73% 19% 7% 4+ 41% 40% 19% 75% 18% 6% 76% 16% 7% Self-positioning on the social staircase Low (1-4) 24% 41% 35% 62% 23% 14% 67% 21% 11% Medium (5-6) 32% 42% 26% 70% 20% 9% 73% 17% 9% High (7-10) 32% 44% 23% 75% 16% 8% 77% 14% 8% Smoking in the car - Three out of ten car owners allow smoking in the car - Amongst those who have a car, the majority (seven out of ten) do not allow smoking in it at any time. Of the remainder, 12% permit smoking in the car sometimes and 16% allow it all the time. 57


60 EUROBAROMETER SPECIAL 332 Tobacco The Swedish and the Finnish are the least permissive, with nine out of ten not allowing smoking in their cars at anytime. The Slovenians and the Germans are the next most strict with 84% and 83% respectively not allowing smoking in the car. Conversely, the Greeks, Bulgarians and Macedonians are the most permissive with 62% 57% and 52% respectively allowing smoking sometimes or all the time in the car. Those from Spain, Romania and Cyprus, and the Former Yugoslav Republic of Macedonia also allow smoking in the car more than others, with between 46% and 40% permitting smoking sometimes or always. - Smokers tend to allow smoking in their cars - The key difference between those who allow smoking in the car and those who do not is dependent on their personal smoking behaviour. About two thirds of those who currently smoke permit smoking in the car (either sometimes or all the time), while 13% of non-smokers are accepting of smoking in their car although they do not smoke themselves. The majority of non-smokers (87%) never allow smoking in their car. Only a third of smokers (35%) claim they do not allow smoking in their car. 58
61 EUROBAROMETER SPECIAL 332 Tobacco QD7 Do you allow smoking in your car? Smoking is never allowed in my car Smoking is allowed sometimes in my car Smoking is allowed all the time in my car Car owners 72% 12% 16% Car owners and non-smokers 87% 8% 5% Car owners and smokers 35% 23% 42% Base: Car owners, n=17890; Car owners and non-smokers, n=12590; Car owners and smokers, n=
62 EUROBAROMETER SPECIAL 332 Tobacco 4.2 Exposure to tobacco smoke in public settings At the time the survey was conducted, Ireland and the UK had a total smoking ban in all workplaces and public places. In Italy, Malta, Sweden, Latvia, Finland, Slovenia, France and The Netherlands, smoking in public places was allowed only in separate smoking rooms. The other EU Member States offered a partial protection to nonsmokers in public settings In bars and restaurants There appears to be a greater incidence of people smoking inside bars as opposed to eating establishments. Among those who visited bars and eating establishments in the past 6 months, 45% recall that people were smoking inside the bar they visited versus 30% recalling the same about an eating establishment. - The incidence of smoking is lowest in countries with the strictest bans - The incidence of smoking in bars is lowest in Ireland, the UK, Slovenia, Sweden, Italy and Finland where 15% or less claimed that anyone was smoking the last time they visited a bar. In contrast, in Cyprus, Bulgaria and Spain the incidence of smoking in bars was the highest with 98%, 94% and 93% remembering that someone was smoking the last time they were in a bar. Those countries where the incidence of smoking is lowest have the strictest smoking restrictions.. 60
63 EUROBAROMETER SPECIAL 332 Tobacco 61
64 EUROBAROMETER SPECIAL 332 Tobacco The incidence of smoking in eating establishments is lowest in Ireland, Slovenia, the UK, Italy, Lithuania, Sweden and Finland, where at least nine out of ten did not experience smoking on their last visit to an eating establishment. The reverse is the case in Cyprus, Bulgaria and Spain where the incidence of smoking in an eating establishment is highest and around nine out of ten experienced smoking on their last visit. As with the incidence of smoking in bars, the incidence of smoking in eating establishments is lower in countries that have the strictest smoking restrictions. 62
65 EUROBAROMETER SPECIAL 332 Tobacco - Smokers appear to choose smoking venues - There are socio-demographic similarities between those who recall that people were smoking inside the bar and those who recall that people were smoking inside an eating establishment. The main socio-demographic trends are related to smoking behaviour. Smokers tend to experience smoke in bars and eating establishments more than exsmokers and those who have never smoked It is likely that in countries where it is still possible to smoke in public, smokers are choosing venues where they can do so and conversely many non-smokers are consciously avoiding such places, hence the trend in the data. 63
66 EUROBAROMETER SPECIAL 332 Tobacco Exposure to tobacco smoke at work - A quarter of EU citizens are exposed to tobacco smoke at work - Among those who work indoors, a quarter is exposed to tobacco smoke indoors at their workplace. About one in ten are exposed to less than an hour a day. One in twenty is exposed to between one and five hours per day while the remaining one in twenty is exposed to more than five hours of tobacco smoke per day at work. The number of hours of exposure to tobacco smoke in the workplace is largely determined by smoking behaviour, as with exposure to smoke in private and other public settings. Non-smokers tend to be exposed to tobacco smoke at work less frequently (3% more than 5 hours per day, 4% 1-5 hours per day and 11% less than 1 hour per day) than smokers (10% more than 5 hours per day, 11% 1-5 hours per day and 15% less than 1 hour per day). It seems that, at work, smokers form a separate group by the mere fact of smoking together and, when smoking is forbidden at work, by going outside together for the purpose of smoking. As they smoke in group, it may be that there is a social incentive to take a smoking break, so that they smoke even more at work. This is why we can speak of specific group exposure to smoke at work for smokers themselves. QD9 How often are you exposed to tobacco smoke indoors at your workplace? Never or almost never Less than 1 hour a day 1 5 hours a day More than 5 hours a day Total sample 76% 13% 6% 5% Smokers 64% 15% 11% 10% Non-smokers 82% 11% 4% Base: Total sample, n=12764; Smokers, n=4271; Non-smokers, n=8470. Please note that answers Don t know and Non applicable have been excluded from this analysis. 64
67 EUROBAROMETER SPECIAL 332 Tobacco In Sweden, respondents are exposed to the least smoke in the workplace, with 96% stating that they are never or almost never exposed to smoke indoors at work. Respondents are exposed to relatively little smoke at work in Finland, the UK, Denmark and Slovenia with 89% or 88% of respondents stating that they are never or almost never exposed to smoke indoors at work. - Greek employees are exposed to the most tobacco smoke at work - Respondents in Greece are clearly exposed to the most smoke at work, with 17% being exposed for more than one hour per day and 19% being exposed for more than five hours per day. Respondents from Cyprus, Austria, Hungary, Romania, Bulgaria, Poland, Spain and the Former Yugoslav Republic of Macedonia also experience relatively high levels of smoking at work with 20% or more being exposed to more than one hour of tobacco smoke per day. Socio-demographically, the characteristics that differentiate those never exposed to smoke at work from those exposed to smoke at work are linked to smoking status. The socio-demographics of gender, age, education and social group vary in correspondence with the smoker and non-smoker profiles. For example, those never exposed to smoke at work reflect the non-smoker profile, being female, older, more highly educated and in higher social groups. Inversely as is the case with smokers - those heavily exposed to tobacco smoke are more likely to be male, younger, poorly educated and in lower social groups. 65
68 EUROBAROMETER SPECIAL 332 Tobacco QD9 How often are you exposed to tobacco smoke indoors at your workplace? (IF 'CURRENTLY WORK'', CODE 5 TO 18 IN D15a) Never or almost never Less than 1 hour a day 1 5 hours a day More than 5 hours a day EU27 76% 13% 6% 5% Sex Male 72% 14% 8% 6% Female 82% 10% 5% 3% Age % 14% 11% 8% % 14% 6% 6% % 11% 6% 4% % 12% 4% 3% Education (End of) 15-70% 16% 8% 6% % 13% 6% 6% % 12% 5% 3% Respondent occupation scale Self- employed 76% 10% 8% 6% Managers 87% 8% 3% 2% Other white collars 79% 13% 5% 3% Manual workers 71% 14% 8% 7% Self-positioning on the social staircase Low (1-4) 69% 15% 8% 8% Medium (5-6) 76% 13% 6% 5% High (7-10) 80% 11% 6% 3% Please note that answers Don t know and Non applicable have been excluded from this analysis. 66
69 EUROBAROMETER SPECIAL 332 Tobacco 5 PERCEPTIONS OF CIGARETTES 5.1 Factors influencing choice - Taste influences cigarette choice most; followed by price - Of the four factors questioned about, EU smokers believe that taste is the most influential factor with almost eight in ten claiming this influences their choice. Price ranks second, followed by the levels of tar, nicotine and carbon monoxide. The package is the least influential factor, with one in seven smokers claiming that it impacts their choice. Almost a quarter of EU smokers (22%), feel that taste is the only factor that influences their choice of cigarette and nothing else. Whilst only 6% of smokers feel that price is the only factor that influences them and even fewer (2%) feel that the tar, nicotine and carbon monoxide levels are the only factor. No one is influenced by the package alone. Conversely, the cigarette choice for 7% of smokers is influenced by all four of the factors listed. QD5 Do any of the following factors influence your choice of cigarettes? Yes - EU The taste 78% All factors 7% The price 50% Only the Taste 22% The tar, nicotine and monoxide carbon levels 39% Only the price Only the tar, nicotine and monoxide 2% 6% The package 15% Only the package 0% 67

70 EUROBAROMETER SPECIAL 332 Tobacco The taste Across all countries, taste is clearly the most important factor influencing cigarette choice of the four factors listed. In Austria, the Czech Republic and Greece, this is most apparent, with nine out of ten agreeing that taste is influential in their cigarette choice. Base: Cigarettes Smokers n=7637. Given the small country bases, we have divided countries into three groups: Countries with a score that is significantly higher than the EU average (83-100%)/ Countries at EU average (76-82%) / Countries with a score that is significantly lower than the EU average (0-75%). 68
71 EUROBAROMETER SPECIAL 332 Tobacco Conversely, taste is least influential in Croatia and Turkey with six out of ten agreeing that it influences their choice. Nevertheless, in these two countries, there are no other factors that smokers agreed with more strongly than taste. There are few socio-demographic distinctions about those who feel that taste is an influential factor in cigarette choice. The only feature is that more white collar workers (both managers and other white collar workers ) than others agree more strongly that taste is influential over their cigarette choice; this is probably a reflection of the relative affluence of these occupations which enables them to be more discerning on aspects other than price, unlike other occupations. QD5.3 Do any of the following factors influence your choice of cigarettes? The taste (IF 'CIGARETTES SMOKER', CODE 1 OR 2 IN QD3a1 OR code 1 OR 2 IN QD3a2) Yes No DK EU27 78% 21% 1% Respondent occupation scale Self- employed 81% 18% 1% Managers 83% 17% 0% Other white collars 84% 16% 0% Manual workers 79% 20% 1% House persons 71% 28% 1% Unemployed 77% 22% 1% Retired 76% 23% 1% Students 74% 26% 0% 69
72 EUROBAROMETER SPECIAL 332 Tobacco Interestingly, it is the more affluent countries in which taste is the only factor influencing cigarette choice. The Balkans and other south eastern countries exhibit the lowest proportions of smokers who are influenced by taste alone, in these countries price also plays a role. Whereas, in the more prosperous northern/ north western countries more smokers are influenced by taste alone. Base: Cigarettes Smokers n=7637. Given the small country bases, we have divided countries into three groups: Countries with a score that is significantly higher than the EU average (26-100%)/ Countries at EU average (19-25%) / Countries with a score that is significantly lower than the EU average (0-78%). 70

73 EUROBAROMETER SPECIAL 332 Tobacco The price - In some countries price is at parity or more important than taste - Fifty percent of smokers claim that price influences their choice of cigarette. However, this level of influence varies considerably between countries and in Bulgaria, Lithuania, Romania, Turkey and the Former Yugoslav Republic of Macedonia it is at parity or more important that taste. Base: Cigarettes Smokers n=7637. Given the small country bases, we have divided countries into three groups: Countries with a score that is significantly higher than the EU average (55-100%)/ Countries at EU average (45-54%) / Countries with a score that is significantly lower than the EU average (0-44%). 71
74 EUROBAROMETER SPECIAL 332 Tobacco In the Czech Republic, Bulgaria, Lithuania, Hungary, Latvia, Slovakia and Estonia and the Former Yugoslav Republic of Macedonia, more than 70% of smokers believe that price influences their choice of cigarette. Conversely, in the Netherlands, Italy and Luxembourg only a third or less is influenced by price. Not surprisingly, younger smokers are more influenced by price than older people, (15-24 year olds 55% versus over 55 years 47%), the unemployed (66%) more than white collar workers (managers 35% and other white collar workers 46%) and those from lower social groups more than those from higher social groups (66% of groups 1-4 versus 49% of groups 5-6 and 39% of groups 7-10). QD5.1 Do any of the following factors influence your choice of cigarettes? The price (IF 'CIGARETTES SMOKER', CODE 1 OR 2 IN QD3a1 OR code 1 OR 2 IN QD3a2) Yes No DK EU27 50% 49% 1% Age % 45% 0% % 48% 1% % 50% 1% % 52% 1% Respondent occupation scale Self- employed 34% 64% 2% Managers 35% 64% 1% Other white collars 46% 53% 1% Manual workers 54% 45% 1% House persons 55% 44% 1% Unemployed 66% 34% 0% Retired 48% 51% 1% Students 53% 47% 0% Self-positioning on the social staircase Low (1-4) 66% 33% 1% Medium (5-6) 49% 50% 1% High (7-10) 39% 61% 0% Difficulties paying bills Most of the time 73% 27% 0% From time to time 54% 45% 1% Almost never/ never 43% 57% 0% 72
75 EUROBAROMETER SPECIAL 332 Tobacco The tar, nicotine and carbon monoxide levels About four in ten smokers agree that the tar, nicotine and carbon monoxide levels influence their choice of cigarette. Greek, Estonian, Bulgarian, Cypriot and Lithuanian smokers appear to be more influenced by tar, nicotine and carbon monoxide levels than smokers from other countries, with at least seven in ten agreeing that these levels influenced their choice of cigarette. The influence of these levels is at least equal to the influence of taste or price in these countries and in some the influence of tar, nicotine and carbon monoxide is even greater. In Bulgaria and Latvia, tar, nicotine and carbon monoxide levels are equally as influential as price and taste, with 70% or more being influenced by each. In Estonia, Greece and Cyprus, price is the least important, and tar, nicotine and carbon monoxide levels are either equally important to taste or second to taste. Tar, nicotine and carbon monoxide levels are least influential in the Netherlands and France, where only 22% and 26% of smokers claim that they influence their choice of cigarette. 73
76 EUROBAROMETER SPECIAL 332 Tobacco Base: Cigarettes Smokers n=7637. Given the small country bases, we have divided countries into three groups: Countries with a score that is significantly higher than the EU average (44-100%)/ Countries at EU average (34-43%) / Countries with a score that is significantly lower than the EU average (0-33%). Socio-demographically, those most influenced by tar, nicotine and carbon monoxide levels are women as opposed to men (43% women versus 36% men), those with higher education (completed their education over 20 years of age, 44%), house persons (43%), self-employed (44%) and white collar workers (43% managers, 44% other white collar workers). 74
77 EUROBAROMETER SPECIAL 332 Tobacco QD5.4 Do any of the following factors influence your choice of cigarettes? The tar, nicotine and monoxide carbon levels (IF 'CIGARETTES SMOKER', CODE 1 OR 2 IN QD3a1 OR code 1 OR 2 IN QD3a2) Yes No DK EU27 39% 59% 2% Sex Male 36% 62% 2% Female 43% 55% 2% Education (End of) 15-33% 65% 2% % 59% 2% % 55% 1% Still studying 38% 60% 2% Respondent occupation scale Self- employed 44% 54% 2% Managers 43% 56% 1% Other white collars 44% 54% 2% Manual workers 36% 62% 2% House persons 43% 54% 3% Unemployed 34% 65% 1% Retired 38% 60% 2% Students 38% 60% 2% The package The package appears to be the least influential factor of the four discussed, with only one in seven agreeing that the package influenced their choice. Slovakian, Czech and Latvian smokers are the most influenced by the package, with 42%, 34% and 30% respectively from each country agreeing that the package influences their choice of cigarettes. Whilst those in the Netherlands, Denmark, Belgium, Spain, Germany and Luxembourg are the least influenced by the cigarette package (one in ten or less are influenced by the cigarette package). 75
/ Countries at EU average (13-18%) /")
78 EUROBAROMETER SPECIAL 332 Tobacco Base: Cigarettes Smokers n=7637. Given the small country bases, we have divided countries into three groups: Countries with a score that is significantly higher than the EU average (19-100%)/ Countries at EU average (13-18%) / Countries with a score that is significantly lower than the EU average (0-12%). In terms of socio-demographics, those claiming to be influenced by the pack are more likely to be years (18% compared to 13% among over 40 year olds) and from the lower social groups (18% compared to 14% in middle and higher groups). 76
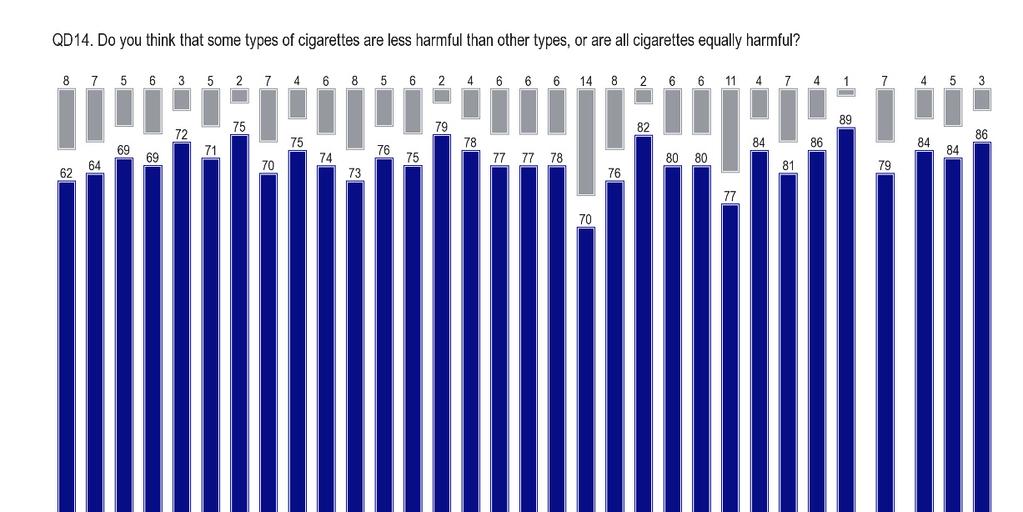
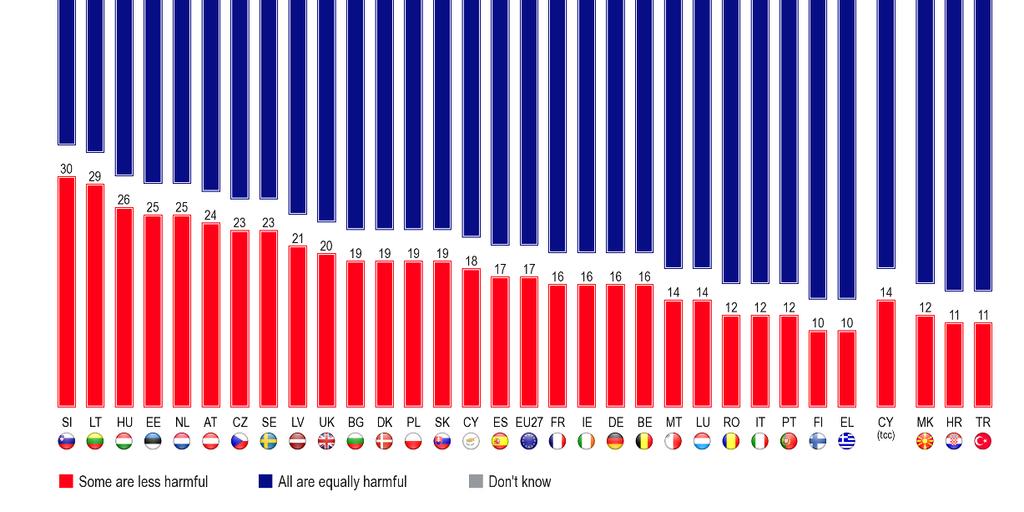
79 EUROBAROMETER SPECIAL 332 Tobacco 5.2 Harmful effects Are all cigarettes equally harmful? - One in five EU citizens believe that some cigarettes are less harmful than others - 17% of EU citizens believe that some cigarettes are less harmful than others. A small proportion (6%) does not know whether there is a difference between cigarettes and so feel unable to say whether they are equally harmful or not. Slightly over three quarters of EU citizens believe that all cigarettes are equally harmful. 77
80 EUROBAROMETER SPECIAL 332 Tobacco - More smokers than non-smokers believe that some cigarettes are less harmful than others - Smokers are more likely than others to believe that some cigarettes are less harmful than others; with a quarter of current smokers agreeing with this statement. 17% of those who have stopped smoking still believe that some cigarettes are less harmful than others. Those who have never smoked are the least likely to believe that some cigarettes are less harmful than others with only 12% believing the same. QD14 Do you think that some types of cigarettes are less harmful than other types, or are all cigarettes equally harmful? Answer: Some are less harmful - % EU Smokers 25% Ex-smoker 17% Never smoked 12% Base: Smokers, n= 7851; Ex-smokers, n=5910; Never smoked, n=12987 The belief that some cigarettes are less harmful than others is slightly stronger in some countries. Specifically, in Slovenia, Lithuania, Hungary, Estonia and the Netherlands, in these countries a quarter or more of respondents believe that some cigarettes are less harmful than others. Whereas, in Greece, Finland and Italy and in the non-eu countries of Croatia, Turkey and the Former Yugoslav Republic of Macedonia 84% or more agree that all cigarettes are equally harmful. 78
81 EUROBAROMETER SPECIAL 332 Tobacco 79
, significantly more smokers believe that some types of cigarettes are less harmful than others compared to non-smokers (exsmokers and")
82 EUROBAROMETER SPECIAL 332 Tobacco The results from the ten countries where respondents agreed most that some types of cigarettes are less harmful than others were analysed further. In all but two of these countries (the Netherlands and Sweden), significantly more smokers believe that some types of cigarettes are less harmful than others compared to non-smokers (exsmokers and those who have never smoked combined). 80
83 EUROBAROMETER SPECIAL 332 Tobacco Socio-demographically, more men than women believe that some types of cigarettes are less harmful than others (20% of men versus 14% of women), younger people also believe the same more than older people (22%) and as a consequence students more than other occupation categories (23%) believe the same. QD14 Do you think that some types of cigarettes are less harmful than other types, or are all cigarettes equally harmful? Some are less harmful All are equally harmful EU27 17% 77% 6% Sex Male 20% 75% 5% Female 14% 79% 7% Age % 72% 6% % 78% 4% % 78% 4% % 78% 8% Education (End of) 15-12% 79% 9% % 78% 5% % 76% 5% Still studying 23% 71% 6% Respondent occupation scale Self- employed 20% 76% 4% Managers 20% 76% 4% Other white collars 18% 78% 4% Manual workers 17% 78% 5% House persons 13% 80% 7% Unemployed 20% 75% 5% Retired 13% 78% 9% Students 23% 71% 6% DK 81
84 EUROBAROMETER SPECIAL 332 Tobacco Factors indicative of harmful effects Depending on the factor, one in ten to one in three respondents believe that certain features indicate that a cigarette brand could be less harmful compared to others. - The tar or nicotine levels on the pack is most indicative of harm - Of the features listed, the tar or nicotine levels on cigarette packs are believed to be the most indicative, by about a third of EU citizens. Terms in the brand name, the taste and the colour of cigarette packs are each seen as equally differentiating features of harm, by one in ten respondents. In addition, for each of the features, one in ten citizens does not know whether these could be indicative of harm; particularly nonsmokers. QD15 Do you think that any of the following is an indication of whether a cigarette brand could be less harmful compared to others? - EU Yes No Don't know The tar or nicotine levels indicated on cigarette packs 35% 55% 10% Specific terms in the brand's name, such as "silver", "blue" or "natural" 12% 76% 12% The taste, such as menthol or sweet flavours 10% 78% 12% The colour of cigarette packs 10% 80% 10% Smokers Non-Smokers The tar or nicotine levels 48% 48% 4% 30% 57% 13% Specific terms in the brand's name 18% 77% 5% 10% 75% 15% The taste 14% 80% 6% 8% 78% 14% The colour of cigarette packs 14% 83% 3% 8% 79% 13% Base: Total sample, n=26788; Smokers, n=7851; Non-smokers, n=

85 EUROBAROMETER SPECIAL 332 Tobacco It is apparent with each feature that more smokers than non-smokers (ex-smokers or never smoked) believe that each feature could be identifying a brand as being less harmful than another. Smokers who believe that some types of cigarettes are less harmful than others recognise that these four features are distinctive between brands, more than smokers who feel all cigarettes are equally harmful. Among those who believe some types of cigarettes are less harmful than others, tar or nicotine levels are the most indicative (84%), followed by specific terms in the brand s name (40%), the taste (31%) and colour of cigarette packs (29%) are a close third and fourth respectively. Among smokers who feel all cigarettes are equally harmful there is less agreement that these features are discriminatory, although the same order is evident. The tar or nicotine levels indicated on cigarette packs Citizens in Hungary, Malta, Slovenia and Lithuania are more likely to believe than citizens in other countries that tar or nicotine levels on cigarette packs indicate that a brand could be less harmful than another. Respondents from Turkey agreed the least that these levels are an indication that a brand could be less harmful (17%). A similar result can be found in the Turkish Cypriot Community (16%). More men than women believe that tar and nicotine levels indicate that a cigarette brand can be more or less harmful than others (38% men, 32% women). In addition, those under 39 years feel the same more than those 55 years and older (40% years, 40% years, 29% 55 years+). The perception that tar and nicotine levels 83
86 EUROBAROMETER SPECIAL 332 Tobacco indicate that a brand is less harmful than another is more strongly felt amongst current smokers (48%) than those who have given up smoking (35%) or those who have never smoked (28%). Specific terms in the brand name, such as silver, blue or natural There is some country variation in belief that specific terms in the brand s name indicate one brand is less harmful to another. In particular, agreement in Hungary is particularly high (three times the EU average) with a third of respondents agreeing that terms such as silver, blue or natural indicate that a brand is less harmful 84
 that terms in the brand name could be indicative of a brand being less harmful than another are in Finland, Denmark and the Netherlands.")
87 EUROBAROMETER SPECIAL 332 Tobacco compared to another. Other countries where agreement is just over double the EU average are the Czech Republic and Slovenia. The lowest levels of agreement (5% or less) that terms in the brand name could be indicative of a brand being less harmful than another are in Finland, Denmark and the Netherlands. More current smokers (18%) than those who have stopped (10%) or those who have never smoked (9%) agree that terms in the brand name indicate that a brand is less harmful than another. 85
88 EUROBAROMETER SPECIAL 332 Tobacco The taste, such as menthol or sweet flavours One in ten people believe that specific tastes indicate a cigarette is less harmful than another. At least twice as many citizens in Hungary, Malta, Poland and Slovakia and the Former Yugoslav Republic of Macedonia believe that taste can be indicative of one cigarette brand being less harmful than another. Conversely, those in Denmark, Greece, Finland and Sweden are the least likely to believe that taste indicates harm, with 4% or less agreeing the same. 86
89 EUROBAROMETER SPECIAL 332 Tobacco As with other features, more current smokers (14%) felt that specific taste was indicative of one cigarette brand being less harmful than another than either those who have stopped smoking (9%) or those who have never smoked (8%). The colour of cigarette packs As with the specific cigarette taste, one in ten people believe that the colour of the cigarette pack is indicative of one brand being less harmful than another. 87
90 EUROBAROMETER SPECIAL 332 Tobacco Notably, in Hungary four times the EU average feel that the pack colour does differentiate cigarettes on the basis of harm. In Lithuania, Latvia, Malta, Slovakia and Poland around double the EU average (between 17% and 22%) believe that pack colour is an indication of harm. Those from Denmark, the Netherlands and Germany agree the least, with only between 2% and 4% agreeing that pack colour differentiates harm between cigarette brands. Smokers (14%) appear to believe more than those who have stopped (9%) or those who have never smoked (8%) that pack colour is indicative of the level of harm between cigarette brands. 88
91 EUROBAROMETER SPECIAL 332 Tobacco 6 TOBACCO PROMOTION AND PURCHASING In the EU, tobacco advertising on TV was banned in the early 1990s. In 2003, advertising in print media, on radio and over the Internet was also banned and tobacco sponsorship of cross-border events or activities was also prohibited. However, advertising in cinemas and on billboards or using merchandising (e.g. ash trays or parasols) is not included in the ban and remains the responsibility of the individual country to ban under its own national law. 6.1 Awareness of tobacco advertising or promotion - 45% of EU citizens have seen tobacco advertising or promotion - On average, almost half of EU citizens have seen tobacco advertising or promotion in the last six months. Two in ten have seen tobacco advertising or promotion from time to time and two in ten have seen it rarely. Less than one in ten respondents claims that they have seen tobacco advertising or promotion often. Interestingly, non-smokers are less likely to have seen tobacco advertising or promotion than smokers. It is likely that smokers are sensitised to advertising and 89
92 EUROBAROMETER SPECIAL 332 Tobacco promotions for tobacco as a result of being smokers and so they are more likely to see advertising or promotions when they are shown. This phenomenon is often seen in advertising recall for specific brands, with users of a brand recalling seeing the brand more than non-users as they are sensitised to the brand as a result of using it. In this case, smokers are the users and they are recalling smoking advertising and promotions more than the non-using non-smokers. QD16 In the past 6 months, have you seen tobacco advertising or promotion? Answers: 'Never' - EU Non-smokers 52% Smokers 46% Base: Non-smokers, n=18897; Smokers, n=7851 Among the EU Member States, the Cypriot, French and UK respondents have seen the least tobacco advertising or promotion with three out of ten or fewer having seen any at all. Among the non-eu countries, similarly low levels of advertising awareness are present in Turkey. Conversely, in Greece, Sweden and Austria at least six out of ten respondents claim to have seen tobacco advertising or promotion in the last six months (rarely, from time to time or often). 90
93 EUROBAROMETER SPECIAL 332 Tobacco Those who never see tobacco advertising or promotion are female more than male, older (older than 55 years) and as a consequence of both of these factors more likely to be retired and house persons. In contrast, those who have seen tobacco advertising or promotion often are younger (15-24 years), students and smokers. 91
94 EUROBAROMETER SPECIAL 332 Tobacco QD16 In the past 6 months, have you seen tobacco advertising or promotion? From Often time to Rarely Never DK time EU27 8% 19% 18% 50% 5% Sex Male 8% 21% 20% 46% 5% Female 7% 17% 16% 54% 6% Age % 21% 20% 42% 4% % 21% 19% 46% 4% % 21% 19% 49% 4% % 15% 16% 57% 7% Education (End of) 15-5% 16% 17% 57% 5% % 19% 18% 50% 5% 20+ 7% 21% 20% 47% 5% Still studying 13% 23% 20% 40% 4% Respondent occupation scale Self- employed 7% 20% 19% 49% 5% Managers 6% 20% 22% 47% 5% Other white collars 9% 22% 20% 44% 5% Manual workers 9% 20% 19% 48% 4% House persons 7% 15% 15% 58% 5% Unemployed 9% 20% 17% 49% 5% Retired 5% 14% 16% 58% 7% Students 13% 23% 20% 40% 4% Self-positioning on the social staircase Low (1-4) 8% 17% 17% 52% 6% Medium (5-6) 8% 18% 18% 51% 5% High (7-10) 8% 21% 19% 47% 5% 92
95 EUROBAROMETER SPECIAL 332 Tobacco 6.2 Tobacco purchasing - Self-service and vending machines used most frequently - Within the European population, self-service sales and vending machines are the most frequently used of the various tobacco purchasing methods listed, with about one in seven using each of these methods. Purchasing tobacco in another country is slightly less common, with one in ten buying tobacco this way. Tobacco is purchased via the Internet at relatively low levels, with only 3% doing so rarely or from time to time. If we focus on specific populations, i.e. on ex-smokers and smokers, we can observe some differences. Not surprisingly, recall levels for tobacco product purchase in the last 12 months are lower among ex-smokers than among smokers. However, recall follows a similar trend, with 9% recalling having purchased tobacco products in selfservice sales, 7% in vending machines, 7% in another country and 2% via the Internet. Among people who have never smoked, the purchase of tobacco products is uniformly low, even if purchases in self-services sales and in vending machines (both 4%) are slightly higher than purchases in another country and via the Internet (both 3%). Let us now focus our analysis on the most interesting population for this question, smokers. Logically, they are the main purchasers of tobacco products, with 39% purchasing tobacco products in self-service sales, 36% in vending machines, 27% in another country and 5% via the Internet. QD17 In the past 12 months, have you bought tobacco products in each of the following ways? Smokers - EU Often From time to time Rarely Never DK In self-service sales 17% 14% 8% 60% In vending machines 11% 16% 9% 64% Bought in another EU country/ Bought in another country 5% 12% 10% 73% Via the Internet 94% Base: Smokers, n=
96 EUROBAROMETER SPECIAL 332 Tobacco In self-service sales Among smokers, self-service purchasing is particularly high in Austria (98%), the Former Yugoslav Republic of Macedonia (89%), Belgium and Estonia (both 73%), Slovenia (72%), Slovakia (71%) and Latvia and Finland (both 70%). Self-service purchasing is particularly low in Greece, the UK and Cyprus (14%) and in Turkey, with only 13% of respondents participating in this type of purchasing. Socio-demographically, smokers who are older than 55 years old (69% never) and, as a consequence, those who are retired (68% never) are less likely than other demographic groups to purchase tobacco via self-service sales. In vending machines Among smokers, levels of purchasing tobacco from vending machines are similar to that of self-service sales, with 36% of EU citizens purchasing from a vending machine. Austrian, Spanish, Portuguese and Maltese respondents use vending machines more than others with 91%, 88%, 86% and 83% respectively purchasing tobacco from vending machines. In many countries the use of vending machines is almost non-existent; specifically in Bulgaria, Estonia, Lithuania, Latvia, Cyprus and in Turkey, where the purchase by smokers of tobacco via a vending machine is 4% or less. As with the use of self-service sales, smokers who are older than 55 years old (76% never) and retired (80% never) are less likely to purchase tobacco from vending machines. It is also the case for house persons (75% never). In addition, men tend to use vending machines more than women (60% never male versus 69% never female). 94
97 EUROBAROMETER SPECIAL 332 Tobacco Bought in another EU country/bought in another country 27% of European smokers buy tobacco in a country other than where they reside. Only in Austria is the percentage of respondents purchasing from another country notably higher, at 60%. Also in France, in the Netherlands and in Croatia results are strikingly higher at 41%. At the opposite end of the scale, Bulgaria (9%), Hungary (7%), Greece (6%) and Turkey (only 1%) are the only countries where purchasing outside of the country is 9% or less. Socio-demographically, smokers older than 55 years (79% never), retired (82% never) as well as house persons (82% never) are the groups least likely to purchase tobacco from another country. Via the Internet Buying tobacco products over the Internet is relatively uncommon. In most countries, 5% or less of smokers purchase tobacco over the Internet. Only in Spain and Italy is purchasing at relatively high levels, with respectively 13% and 12% of smokers purchasing tobacco products in this way. 95
98 EUROBAROMETER SPECIAL 332 Tobacco 6.3 Attitudes to tobacco-control policies - Most are in favour of tobacco-control policies - On the whole, most citizens are in favour of the various tobacco-control policies listed and the majority are in favour of each of the proposals outlined. Sociodemographically, those in favour of the proposals tend to be women, those over 55 years of age, house persons, managers and the retired. QD18 Would you be in favour of or opposed to any of the following measures?? In favour Total sample Smokers Non-smokers Putting picture health warnings on all packages of tobacco products 75% 61% 80% Introducing an extra fee on manufacturers of tobacco products to cover the health costs of tobacco use 67% 43% 77% Banning advertising of tobacco products in points of sales/ shops 63% 48% 69% Banning flavours that make tobacco products more attractive 61% 44% 68% Banning the sales of tobacco products via the Internet 60% 45% 66% Increasing taxes on tobacco products 56% 21% 71% Keeping tobacco products out of sight in shop/ points of sale 55% 37% 63% Banning colours, logos and promotional elements from packets of tobacco products 54% 34% 62% Banning the sales of tobacco products through vending machines 52% 32% 61% 96
99 EUROBAROMETER SPECIAL 332 Tobacco More smokers than non-smokers oppose each of the proposals. Opinions differ particularly regarding the proposals on taxes on manufacturers and taxes on tobacco products, where non-smokers are in support and smokers are not. Putting picture health warnings on all packages of tobacco products is the only proposal that clearly receives support from more than half of the smokers (whereas, within the EU, only three countries have already introduced picture health warnings: Belgium, Romania and the United Kingdom). Banning advertising of tobacco from shops/points of sale is close with 48% of smokers in favour. The policy that received the most positive response is that of putting picture health warnings on all packages of tobacco products. Three quarters of all EU citizens are in favour of this policy. Those countries in which pictorial warnings are already included are not particularly in favour or against this policy; Belgium 81%, Romania 72% and the UK 77%. Maltese citizens are the most in favour (nine out of ten), whilst those from Denmark and Slovenia showed the most opposition. Two thirds of EU citizens are in favour of introducing a fee on manufacturers to cover the health costs of tobacco use. The Cypriots are the most supportive, with 83% in favour. Those from Bulgaria, Romania, the Netherlands and Austria and Croatia are the most against it with over a third opposed to it. EU citizens are less supportive of increasing taxes on tobacco products, with 56% in favour of this proposal. Support varies by country and is strongest in Finland and Turkey where seven in ten are in favour. Opposition is greatest in France and Lithuania with 48% against it. Almost two thirds of EU citizens are in favour of banning the advertising of tobacco products at point of sale/in shops, whereas slightly fewer (55%) are in favour of keeping the actual products out of sight in store/at point of sale. Respondents in Ireland, Cyprus and Turkey are most in favour of banning both the advertising and the display of tobacco products in shops/at points of sale. Finland is also one of the countries most in favour of banning the advertising of tobacco products in points of sales/shops but it was not one of the most in favour of keeping tobacco products out of sight. The countries most opposed to these two measures are the Netherlands and Austria. 97
100 EUROBAROMETER SPECIAL 332 Tobacco EU citizens are more in favour of banning sales through the Internet than banning them through vending machines, 60% versus 52% respectively. Given current purchasing behaviour is more towards vending machines rather than the Internet this reaction is not surprising. Citizens from Cyprus and Turkey are those most in favour of banning sales through the Internet and through vending machines, with around eight out of ten in favour of each proposed measure. The greatest opposition to the two measures is less consistent, with citizens from the Netherlands, Denmark and Sweden being the most opposed to banning sales via the Internet. Whereas, citizens from Austria, the Netherlands and Spain are the most resistant to banning tobacco sales through vending machines. Banning flavours that make tobacco products more attractive achieves support from six out of ten EU citizens. Those in particular support are citizens from Cyprus, Ireland and Turkey, with around eight out of ten in favour. Opposition is strongest from Slovenia, the Netherlands, Sweden and the Czech Republic and Croatia, where at least four out of ten object. Slightly over half of EU citizens are in favour of banning colours, logos and promotional elements from tobacco packages. The strongest support comes from Cyprus, Ireland and Turkey. A similar support can be found in the Turkish Cypriot Community. Opposition is greatest in the Netherlands with 57% opposed to it, followed by Sweden and Slovenia with 52% and 49% respectively. 98

101 EUROBAROMETER SPECIAL 332 Tobacco *Within the EU, only three countries have already introduced picture health warnings on all packages of tobacco products: Belgium, Romania and the United Kingdom 99
102 EUROBAROMETER SPECIAL 332 Tobacco CONCLUSIONS About a third of EU citizens are current smokers of cigarettes, cigars or pipes. Greece, Bulgaria, Hungary and the candidate countries of Turkey and the Former Yugoslav Republic of Macedonia have the highest proportions of smokers. Manufactured cigarettes are the most commonly smoked tobacco product, consumed by eight out of ten current smokers. The frequency with which manufactured cigarettes are smoked is highest in several of the countries that have the highest proportions of smokers; specifically Greece and the three candidate countries, Croatia, Turkey and the Former Yugoslav Republic of Macedonia. The high prevalence of smoking in Greece is compounded by the fact that the number of cigarettes consumed per day is the highest (the equivalent of just over a packet of 20 per day). Hand-rolled cigarettes are smoked by about one in seven smokers. It appears that hand-rolled cigarettes may be used as a substitute for manufactured cigarettes, as in the countries where consumption is relatively high the use of manufactured cigarettes is comparatively low. Cigars, water pipes and pipes are used by fewer smokers than hand-rolled cigarettes and are primarily reserved for occasional use. While in general the regular or occasional use of other tobacco and nicotine products is relatively low in comparison to mainstream tobacco products, their highest rates of use are in Sweden, Finland and Denmark. Almost a third of smokers have tried to quit smoking in the last 12 months and half of those who have tried, have done so more than once. The main factors that lead people to consider giving up are personal health, followed by family/ partner/ friends. The price of tobacco products is also a factor in trying to quit. Other external factors (such as smoking restrictions, social disapproval, warning labels and media campaigns) play an indirect role. 100
103 EUROBAROMETER SPECIAL 332 Tobacco Smokers are the most tolerant of others smoking in their private environment and consequently the countries in which the proportion of smokers is highest demonstrate higher tolerance in terms of smoking in the home or car and vice versa. Exposure to second-hand smoke in the last 6 months was higher in bars than in eating establishments (among those who visited bars and eating establishments, 45% recalled that people were smoking in the former, while 30% recalled that people were smoking in the latter). A quarter of those who work indoors are exposed to second-hand smoke. Cigarette choice seems to be based mainly on taste and price. Overall, taste is the main factor influencing choice; however in some countries price is more important. Tar, nicotine and carbon monoxide levels play a role in some countries but on the whole are less important than taste and price. One in five EU citizens wrongly believes that some cigarettes are less harmful than others. Tar, nicotine and carbon monoxide levels on the pack are perceived as being most indicative of relative harm. Forty five percent of EU citizens claim to have seen tobacco advertising or promotions in the last 6 months, despite the EU ban on crossborder advertising. Special distribution channels play a significant role in tobacco purchasing. During the last 12 months, 17% of smokers have often bought tobacco products from self-services machines, 11% of smokers have bought them from vending machines and 1% have done so via the internet. Most EU citizens are in favour of a wide range of tobacco-control measures: putting picture health warnings on all tobacco product packages (75%); introducing an extra fee on manufacturers of tobacco products to cover the health costs of tobacco use (67%); banning advertising of tobacco products at points of sale/shops (63%); banning flavours that make tobacco products more attractive (61%); banning the sale of tobacco products via the Internet (60%); increasing taxes on tobacco products (56%); keeping tobacco products out of sight in shops/points of sale (55%), banning colours, logos and promotional elements from tobacco product packets (54%); and banning the sale of tobacco products through vending machines (52%). 101
104
105 ANNEXES
106
107 TECHNICAL SPECIFICATIONS
108
109 SPECIAL EUROBAROMETER N 332 Tobacco TECHNICAL SPECIFICATIONS Between the 2 nd and the 19 th of October 2009, TNS Opinion & Social, a consortium created between TNS plc and TNS opinion, carried out wave of the EUROBAROMETER, on request of the EUROPEAN COMMISSION, Directorate-General for Communication, Research and Speechwriting. The SPECIAL EUROBAROMETER N 332 is part of wave and covers the population of the respective nationalities of the European Union Member States, resident in each of the Member States and aged 15 years and over. The EUROBAROMETER has also been conducted in the three candidate countries (Croatia, Turkey and the Former Yugoslav Republic of Macedonia) and in the Turkish Cypriot Community. In these countries, the survey covers the national population of citizens and the population of citizens of all the European Union Member States that are residents in these countries and have a sufficient command of the national languages to answer the questionnaire. The basic sample design applied in all states is a multi-stage, random (probability) one. In each country, a number of sampling points was drawn with probability proportional to population size (for a total coverage of the country) and to population density. In order to do so, the sampling points were drawn systematically from each of the "administrative regional units", after stratification by individual unit and type of area. They thus represent the whole territory of the countries surveyed according to the EUROSTAT NUTS II (or equivalent) and according to the distribution of the resident population of the respective nationalities in terms of metropolitan, urban and rural areas. In each of the selected sampling points, a starting address was drawn, at random. Further addresses (every Nth address) were selected by standard "random route" procedures, from the initial address. In each household, the respondent was drawn, at random (following the "closest birthday rule"). All interviews were conducted face-to-face in people's homes and in the appropriate national language. As far as the data capture is concerned, CAPI (Computer Assisted Personal Interview) was used in those countries where this technique was available.
110 ABBREVIATIONS COUNTRIES INSTITUTES N FIELDWORK POPULATION INTERVIEWS DATES 15+ BE Belgium TNS Dimarso /10/ /10/ BG Bulgaria TNS BBSS /10/ /10/ CZ Czech Rep. TNS Aisa /10/ /10/ DK Denmark TNS Gallup DK /10/ /10/ DE Germany TNS Infratest /10/ /10/ EE Estonia Emor /10/ /10/ IE Ireland TNS MRBI /10/ /10/ EL Greece TNS ICAP /10/ /10/ ES Spain TNS Demoscopia /10/ /10/ FR France TNS Sofres /10/ /10/ IT Italy TNS Infratest /10/ /10/ CY Rep. of Cyprus Synovate /10/ /10/ CY(tcc) Turkish Cypriot Comm. KADEM /10/ /10/ LV Latvia TNS Latvia /10/ /10/ LT Lithuania TNS Gallup Lithuania /10/ /10/ LU Luxembourg TNS ILReS /10/ /10/ HU Hungary TNS Hungary /10/ /10/ MT Malta MISCO /10/ /10/ NL Netherlands TNS NIPO /10/ /10/ AT Austria Österreichisches Gallup-Institut /10/ /10/ PL Poland TNS OBOP /10/ /10/ PT Portugal TNS EUROTESTE /10/ /10/ RO Romania TNS CSOP /10/ /10/ SI Slovenia RM PLUS /10/ /10/ SK Slovakia TNS AISA SK /10/ /10/ FI Finland TNS Gallup Oy /10/ /10/ SE Sweden TNS GALLUP /10/ /10/ UK United Kingdom TNS UK /10/ /10/ HR Croatia Puls /10/ /10/ TR Turkey TNS PIAR /10/ /10/ MK Former Yugoslav Rep. of Macedonia TNS Brima /10/ /10/ TOTAL /10/ /10/


111 For each country a comparison between the sample and the universe was carried out. The Universe description was derived from Eurostat population data or from national statistics offices. For all countries surveyed, a national weighting procedure, using marginal and intercellular weighting, was carried out based on this Universe description. In all countries, gender, age, region and size of locality were introduced in the iteration procedure. For international weighting (i.e. EU averages), TNS Opinion & Social applies the official population figures as provided by EUROSTAT or national statistic offices. The total population figures for input in this post-weighting procedure are listed above. Readers are reminded that survey results are estimations, the accuracy of which, everything being equal, rests upon the sample size and upon the observed percentage. With samples of about 1,000 interviews, the real percentages vary within the following confidence limits: Observed percentages 10% or 90% 20% or 80% 30% or 70% 40% or 60% 50% Confidence limits ± 1.9 points ± 2.5 points ± 2.7 points ± 3.0 points ± 3.1 points
EUROBAROMETER SPECIAL 332. Fieldwork: October 2009 Publication: May 2010
 Special Eurobarometer 332 European Commission Tobacco Summary Fieldwork: October 2009 Publication: May 2010 Special Eurobarometer 332 / Wave 72.3 TNS Opinion & Social This survey was requested by the Directorate-General
Fieldwork: February March 2010 Publication: October 2010
 Special Eurobarometer 345 European Commission Mental Health Part 1: Report Fieldwork: February March 2010 Publication: October 2010 Special Eurobarometer 345 / Wave 73.2 TNS Opinion & Social This survey
2008 EUROBAROMETER SURVEY ON TOBACCO
 8 EUROBAROMETER SURVEY ON TOBACCO KEY MSAG Support for smoke-free places: The survey confirms the overwhelming support that smoke-free policies have in the EU. A majority of EU citizens support smoke-free
Attitudes of Europeans towards tobacco
 Special Eurobarometer European Commission Attitudes of Europeans towards tobacco Fieldwork September December 2005 Publication January 2006 Special Eurobarometer 239 / Waves 64.1 64.3 TNS Opinion & Social
Young people and drugs. Analytical report
 Flash Eurobarometer European Commission Young people and drugs among 15-24 year-olds Analytical report Fieldwork: May 2008 Report: May 2008 Flash Eurobarometer 233 The Gallup Organization This survey was
Fieldwork: October 2009 Publication: February 2010
 SPECIAL EUROBAROMETER 329 Special Eurobarometer 330 Health Determinants Report Oral health Fieldwork: October 2009 Publication: February 2010 Special Eurobarometer 330 / Wave TNS Opinion & Social This
EUROPEAN CITIZENS DIGITAL HEALTH LITERACY
 Flash Eurobarometer 404 EUROPEAN CITIZENS DIGITAL HEALTH LITERACY SUMMARY Fieldwork: September 2014 Publication: November 2014 This survey has been requested by the European Commission, Directorate-General
Report. Survey conducted by TNS political & social
 Food waste and date marking Survey conducted by TNS political & social This document does not represent the point of view of the European Commission. The interpretations and opinions contained in it are
Youth attitudes on drugs. Analytical report
 Flash Eurobarometer 33 The Gallup Organization? Flash Eurobarometer European Commission Youth attitudes on drugs Analytical report Fieldwork: May 211 Report: June 211 This survey was requested by Directorate-General
Fieldwork October - November 2006 Publication March Report
 Special Eurobarometer European Commission Attitudes towards Alcohol Fieldwork October - November 2006 Publication March 2007 Report Special Eurobarometer 272b / Wave 66.2 TNS Opinion & Social This survey
Special Eurobarometer 445. Report. Antimicrobial Resistance
 Survey requested by the European Commission, Directorate-General for Health and Food Safety and co-ordinated by the Directorate-General for Communication This document does not represent the point of view
SMOKING PREVALENCE IN ROMANIA. A SECONDARY DATA ANALYSIS
 Bulletin of the Transilvania University of Braşov Vol. 5 (54) No. 1-2012 Series VII: Social Sciences Law SMOKING PREVALENCE IN ROMANIA. A SECONDARY DATA ANALYSIS Codrina ŞANDRU 1 Abstract: This article
Transmission, processing and publication of HBS 2015 data
 EUROPEAN COMMISSION EUROSTAT Directorate F: Social statistics Unit F-4: Income and living conditions; Quality of life Doc. LC-ILC/194/17/EN estat.f.4 (2017) WORKING GROUP ON INCOME AND LIVING CONDITIONS
A new scale to measure tobacco control activity in a country: data tables and questionnaire
 A new scale to measure tobacco control activity in a country: data tables and questionnaire 1 Appendix 1: Smoke free public places - score on 1 July 2005 in 30 European countries Country Bars and restaurants
Public administration reforms and public sector performance in Central and Eastern Europe EU member states: in EU perspective
 Public administration reforms and public sector performance in Central and Eastern Europe EU member states: in EU perspective Prof. Ing. Juraj Nemec, CSc. Masaryk University, Czech Republic, Size of government
Finnish international trade 2017 Figures and diagrams. Finnish Customs Statistics
 Finnish international trade 217 Figures and diagrams Finnish Customs Statistics IMPORTS, EXPORTS AND TRADE BALANCE 199-217 Billion e 7 6 5 4 3 2 1-1 9 91 92 93 94 95 96 97 98 99 1 2 3 4 5 6 7 8 9 1 11
Smokefree Policies in Europe: Are we there yet?
 Smokefree Policies in Europe: Are we there yet? 14 April 2015, 9:00 10:30am Rue de l Industrie 24, 1040 Brussels Permanent Partners: Temporary Partners: The research for the SFP Smokefree Map was partially
Finnish international trade 2017 Figures and diagrams. Finnish Customs Statistics
 Finnish international trade 217 Figures and diagrams Finnish Customs Statistics IMPORTS, EXPORTS AND TRADE BALANCE 199-217 Billion e 7 6 5 4 3 2 1-1 9 91 92 93 94 95 96 97 98 99 1 2 3 4 5 6 7 8 9 1 11
Trends in injecting drug use in Europe
 Trends in injecting drug use in Europe Linda Montanari, Bruno Guarita and Danica Thanki Annual Expert Meeting on Drug-Related Infectious Diseases Lisbon, 15-17 October Overview of the presentation 1) Information
New trends in harm reduction in Europe: progress made challenges ahead
 New trends in harm reduction in Europe: progress made challenges ahead Dagmar Hedrich, Alessandro Pirona, EMCDDA 2 nd European Harm Reduction Conference, 7-9 May 2014, Basel Session 4: Changes in harm
Risk perception and food safety: where do European consumers stand today?
 Risk perception and food safety: where do European consumers stand today? Lucia de Luca Press Officer, EFSA Outline Objective Methodology Risk perceptions Views on public authorities action Sources of
Post-test of the advertising campaign Help
 Post-test of the advertising campaign Help Results Contact : Patrick KLEIN Tél : 01 41 98 97 20 Port : 06 09 64 33 e-mail : patrick.klein@ipsos.com December 2005 Contents Methodology 3 Recall and Liking
Overview of drug-induced deaths in Europe - What does the data tell us?
 Overview of drug-induced deaths in Europe - What does the data tell us? João Matias, Isabelle Giraudon, Julián Vicente EMCDDA expert group on the key-indicator Drug-related deaths and mortality among drug
'SECTION B EU PARTY. The following abbreviations are used:
 'SECTION B EU PARTY The following abbreviations are used: AT Austria BE Belgium BG Bulgaria CY Cyprus CZ Czech Republic DE Germany DK Denmark ES Spain EE Estonia EU European Union, including all its Member
Palliative nursing care of children and young people across Europe
 Palliative nursing care of children and young people across Europe Results of a postal survey in August 2016 Updated in April 2017 (presented at the 29th PNAE-meeting in Naples/Italy on 28th April 2017)
Extrapolation and potential impact of IPHS deployment in Europe
 SIMPHS2 Validation Workshop Brussels, 31 Jan 2012 1 SIMPHS2 Validation Workshop Extrapolation and potential impact of IPHS deployment in Europe JRC IPTS IS Unit Ioannis Maghiros, Fabienne Abadie, Maria
Statistics on smoking: England, 2006
 Statistics on smoking: England, 2006 Summary This statistical bulletin presents a range of information on smoking. Sources used within this publication include the General Household Survey, Drug Use, Smoking
Cross Border Genetic Testing for Rare Diseases
 Cross Border Genetic Testing for Rare Diseases EUCERD Joint Action WP8 Helena Kääriäinen National Institute for Health an Welfare, Helsinki, Finland Starting point Possibilities and demand for genetic
Nutrient profiles for foods bearing claims
 Nutrient profiles for foods bearing claims Fields marked with * are mandatory. Background Regulation (EC) 1924/2006 (Nutrition and Health Claims NHC Regulation) establishes EU rules on nutrition and health
WCPT COUNTRY PROFILE December 2017 SWEDEN
 WCPT COUNTRY PROFILE December 2017 SWEDEN SWEDEN NUMBERS WCPT Members Practising physical therapists 11,043 Total number of physical therapist members in your member organisation 17,906 Total number of
WCPT COUNTRY PROFILE December 2017 HUNGARY
 WCPT COUNTRY PROFILE December 2017 HUNGARY HUNGARY NUMBERS WCPT Members Practising physical therapists 727 Total number of physical therapist members in your member organisation 4,000 Total number of practising
Review of Member State approaches to the Macrophyte and Phytobenthos Biological Quality Element in lakes
 Review of Member State approaches to the Macrophyte and Phytobenthos Biological Quality Element in lakes Report to ECOSTAT Martyn Kelly (Bowburn Consultancy, UK) Sebastian Birk (University of Duisburg-Essen,
WCPT COUNTRY PROFILE December 2017 SERBIA
 WCPT COUNTRY PROFILE December 2017 SERBIA SERBIA NUMBERS WCPT Members Practising physical therapists 622 Total number of physical therapist members in your member organisation 3,323 Total number of practising
Engagement in language assessment / Regions of Europe
 Summary table: Engagement in language / Regions of This table lists the statistically significant differences in the engagement in activities by the respondents from different s of : If the word or appears
Update on EEA s near real time air quality data exchange
 Update on EEA s near real time air quality data exchange Jaume Targa (EEA ETC/ACC) Acknowledgement Thanks to all nrt data providers Currently there are 71 providers Latvian Environment, Geology and Name
EIIW Competitiveness Report on the EU Market
 EIIW Competitiveness Report on the EU Market Jens K. Perret Wuppertal, January 215 Preliminary European Institute for International Economic Relations at the University of Wuppertal, Rainer-Gruenter-Str.
Louis-André Vallet (CNRS) Observatoire Sociologique du Changement (UMR CNRS & Sciences Po Paris)
 Observatoire Sociologique du Changement (UMR CNRS & Sciences Po Paris)") Louis-André allet (CNRS) Observatoire Sociologique du Changement (UMR 7049 - CNRS & Sciences Po Paris) louisandre.vallet@sciencespo.fr ASSESSING THE PERFORMANCE OF THE THREE ONE-DIGIT ESEG PROTOTYPES WITH
Louis-André allet (CNRS) Observatoire Sociologique du Changement (UMR 7049 - CNRS & Sciences Po Paris) louisandre.vallet@sciencespo.fr ASSESSING THE PERFORMANCE OF THE THREE ONE-DIGIT ESEG PROTOTYPES WITH
Manuel Cardoso RARHA Executive Coordinator Public Health MD Senior Advisor Deputy General-Director of SICAD - Portugal
 Manuel Cardoso RARHA Executive Coordinator Public Health MD Senior Advisor Deputy General-Director of SICAD - Portugal Public Health Public health is the science and art of preventing disease, prolonging
European status report on alcohol and health Leadership, awareness and commitment
 European status report on alcohol and health 2014 Leadership, awareness and commitment Leadership, awareness and commitment Background Strong leadership from national and local governments is essential
Perspectives for information on alcohol use in the EU
 EMCDDA Perspectives for information on alcohol use in the EU Julian Vicente Luxembourg 20-21 March 2018 CNAPA meeting Topics in this presentation ESPAD project (now with EMCDDA) in students Alcohol ( Tobacco
SMOKING AND THE ENVIRONMENT: ACTIONS AND ATTITUDES
 Special Eurobarometer European Commission SMOKING AND THE ENVIRONMENT: ACTIONS AND ATTITUDES Fieldwork: Autumn 2002 Publication: November 2003 Special Eurobarometer 183 / Wave 58.2 - European Opinion Research
31 countries (117 registries, 20 national) Increased coverage in countries with regional registries 50% European population Overall >20 million
 Increased coverage in countries with regional registries 50% European population Overall >20 million") 31 countries (117 registries, 20 national) Increased coverage in countries with regional registries 50% European population Overall >20 million cancer cases Adult patients (age 15+) 45 major cancer sites
31 countries (117 registries, 20 national) Increased coverage in countries with regional registries 50% European population Overall >20 million cancer cases Adult patients (age 15+) 45 major cancer sites
the high CVD risk smoker
 Smoking Cessation: population and patients A comprehensive approach to the smoker the high CVD risk smoker Catriona Jennings Cardiovascular Specialist Research Nurse Imperial College London European Society
European Community Pharmacy: a reference in Public Health
 European Community Pharmacy: a reference in Public Health Ilaria Passarani PGEU Secretary General 4 October 2018, Burgos, Spain Pharmaceutical Group of European Union Members: Professional Bodies & Pharmacists
Underage drinking in Europe
 Underage drinking in Europe There are two major studies on underage drinking which are published every 4 years: HBSC (Health Behaviour in School-aged Children) and ESPAD (The European School survey Project
Alcohol-related harm in Europe and the WHO policy response
 Alcohol-related harm in Europe and the WHO policy response Lars Moller Programme Manager World Health Organization Regional Office for Europe Date of presentation NCD global monitoring framework: alcohol-related
The cancer burden in the European Union and the European Region: the current situation and a way forward
 The cancer burden in the European Union and the European Region: the current situation and a way forward Presented by Zsuzsanna Jakab WHO Regional Director for Europe Informal Meeting of Health Ministers
COMPANY PRESENTATION 2017
 COMPANY PRESENTATION 2017 1 WHO WE ARE, WHAT WE DO Swedish Match develops, manufactures, and sells quality products with market-leading brands in the product areas Snus and moist snuff, Other tobacco products
EU Market Situation for Poultry. Committee for the Common Organisation of the Agricultural Markets 20 April 2017
 EU Market Situation for Poultry Committee for the Common Organisation of the Agricultural Markets 2 April 217 -9.% -11.% -5.% -.1% -.7% -2.2% 3.% 1.7% 1.2%.8%.6%.%.%.% 7.9% 7.% 6.4% 6.2% 6.% 5.5% 5.3%
Meeting report, September 2005
 European Medicines Agency Post-authorisation Evaluation of Medicines for Human Use London, 24 October 2005 Doc. Ref. EMEA//322553/2005 COMMITTEE ON HERBAL MEDICINAL PRODUCTS () Meeting report, 19-20 September
REPORT FROM THE COMMISSION TO THE EUROPEAN PARLIAMENT AND THE COUNCIL ON FOOD INGREDIENTS TREATED WITH IONISING RADIATION FOR THE YEAR 2012
 EUROPEAN COMMISSION Brussels, 4.2.2014 COM(2014) 52 final REPORT FROM THE COMMISSION TO THE EUROPEAN PARLIAMENT AND THE COUNCIL ON FOOD INGREDIENTS TREATED WITH IONISING RADIATION FOR THE YEAR 2012 EN
ERGP (12) 31 report on complaints handling ERGP REPORT ON THE ASSESSMENT OF COMPLAINT HANDLING PROCEDURES AND CONSUMER PROTECTION
 31 report on complaints handling ERGP REPORT ON THE ASSESSMENT OF COMPLAINT HANDLING PROCEDURES AND CONSUMER PROTECTION") ERGP REPORT ON THE ASSESSMENT OF COMPLAINT HANDLING PROCEDURES AND CONSUMER PROTECTION 1 Content Page 0. Executive Summary 7 1. Background 11 2. Objectives 12 3. Methodology 13 4. Legal framework on complaint
ERGP REPORT ON THE ASSESSMENT OF COMPLAINT HANDLING PROCEDURES AND CONSUMER PROTECTION 1 Content Page 0. Executive Summary 7 1. Background 11 2. Objectives 12 3. Methodology 13 4. Legal framework on complaint
CNAPA Meeting Luxembourg September 2016
 CNAPA Meeting Luxembourg September 2016 Manuel Cardoso RARHA Executive Coordinator Public Health MD Senior Advisor Deputy General-Director of SICAD - Portugal RARHA Events Policy Dialogue and Final Conference
PRESS RELEASE ISSUED BY THE STATE UNIVERSITY OF NEW YORK AT ALBANY
 PRESS RELEASE ISSUED BY THE STATE UNIVERSITY OF NEW YORK AT ALBANY EMBARGOED FOR RELEASE AT 6:00A.M. EST, FEBRUARY 20, 2001. NOTE TO EDITORS These results will be presented today (Tuesday, February 20,
Where we stand in EFORT
 Where we stand in EFORT Engaging with the new EU regulatory landscape for medical devices. Challenges & opportunities Brussel, Belgium April 6, 2018 Per Kjaersgaard-Andersen Associate Professor Section
Proposal for the future operationalisation of GALI in social surveys
 EUROPEAN COMMISSION EUROSTAT Directorate F: Social statistics Unit F-5: Education, health and social protection DOC 05-PH-03 Proposal for the future operationalisation of GALI in social surveys Meeting
Overview of European Consumption Databases
 FEDERAL INSTITUTE FOR RISK ASSESSMENT Overview of European Consumption Databases Katrin Büsch Workshop Food Consumption Data and Dietary Exposure in the European Union, 15-16 May 2008, Berlin Introduction
Q1 What age are you?
 Q1 What age are you? Answered: 504 Skipped: 0 18 19 20 21 22 23 24 25 26 27 28 29 30 31 32 33 34 35 4.56% 23 3.77% 19 4.56% 23 6.15% 31 3.97% 20 6.55% 33 5.95% 30 6.75% 34 6.35% 32 4.37% 22 6.75% 34 5.56%
Table 7.1 Summary information for lung cancer in Ireland,
 7 Lung cancer 7.1 Summary Lung cancer is the third most common cancer in Ireland, accounting for 15% of cancers in men and 9% in women, if non-melanoma skin cancer is excluded (table 7.1). Each year, approximately
Fresh fruit and vegetable production, trade, supply & consumption monitor in the EU-27 (covering ) With the support of:
 With the support of:") Fresh fruit and vegetable production, trade, supply & consumption monitor in the EU-27 (covering 2005-2010) With the support of: Freshfel Fruit and Vegetable Production, Trade, Supply & Consumption Monitor
Fresh fruit and vegetable production, trade, supply & consumption monitor in the EU-27 (covering 2005-2010) With the support of: Freshfel Fruit and Vegetable Production, Trade, Supply & Consumption Monitor
Spreading Excellence and Widening Participation
 Spreading Excellence and Widening Participation Dr G Ambroziewicz Ankara, 27/02/2017 Research and Background Disparities in research and innovation performance: barrier to competitiveness, growth and jobs
Yersiniosis SURVEILLANCE REPORT. Annual Epidemiological Report for Key facts. Methods. Epidemiology
 SURVEILLANCE REPORT Annual Epidemiological Report for 2015 Yersiniosis Key facts In 2015, 26 countries reported 7 279 confirmed yersiniosis cases in the EU/EEA. The overall notification rate was 2.0 cases
Note on the harmonisation of SILC and EHIS questions on health
 EUROPEAN COMMISSION EUROSTAT Directorate F: Social statistics and Information Society Unit F-5: Health and food safety statistics 23/01/2008 Note on the harmonisation of SILC and EHIS questions on health
Trichinellosis SURVEILLANCE REPORT. Annual Epidemiological Report for Key facts. Methods
 Annual Epidemiological Report for 2015 Trichinellosis Key facts In 2015, a total of 156 confirmed cases of trichinellosis was reported from 29 EU/EEA countries. The overall notification rate was 0.03 cases
ALCOHOL CONSUMPTION IN EUROPE; TRADITIONS, GENERATIONS, CULTURE AND POLICY
 ALCOHOL CONSUMPTION IN EUROPE; TRADITIONS, GENERATIONS, CULTURE AND POLICY JACEK MOSKALEWICZ INSTITUTE OF PSCHIATRY AND NEUROLOGY WARSAW, POLAND THIRD EUROPEAN CONFERENCE ON ALCOHOL AND LAW ENFORCEMENT,
Multi-Country Opinion Research Survey TOPLINE RESULTS GLOBAL AVERAGE
 Multi-Country Opinion Research Survey TOPLINE RESULTS GLOBAL AVERAGE KEY SPECIFICATIONS AUDIENCE: LEGAL AGE, GENERAL POPULATION ADULTS SAMPLE SIZE: n=31,002 GEOGRAPHY: ARGENTINA AUSTRALIA AUSTRIA BRAZIL
European Status report on Alcohol and Health
 European Status report on Alcohol and Health Dr Lars Moller Regional Advisor a.i. WHO Regional Office for Europe Main killers in the WHO European Region Source: Preventing chronic diseases. A vital investment.
Drinking guidelines used in the context of early identification and brief interventions in Europe: overview of RARHA survey results
 Drinking guidelines used in the context of early identification and brief interventions in Europe: overview of RARHA survey results E. Scafato, C. Gandin, L. Galluzzo, S. Ghirini, S. Martire Istituto Superiore
Burden and cost of alcohol, tobacco and illegal drugs globally and in Europe
 Burden and cost of alcohol, tobacco and illegal drugs globally and in Europe Jürgen Rehm 1-4 Kevin D. Shield 1,2,3 1) Centre for Addiction and Mental Health, Toronto, Canada 2) University of Toronto, Canada
Cannabis policies & cannabis use
 Cannabis policies & cannabis use Point of departure Does an increased interest in cannabis regulation result in the tendency to view the world through a lens that gives an over emphasis to, or over simplifies,
Project Meeting Prague
 Project Meeting Prague IO1 Assessment 9.11.217 CHRISTINA PADBERG ON BEHALF OF FRANKFURT UAS Current Status Assessment matrix was fully evaluated Experts have been interviewed, Interviews were fully evaluated
WHO REGIONAL OFFICE FOR EUROPE RECOMMENDATIONS ON INFLUENZA
 WHO REGIONAL OFFICE FOR EUROPE RECOMMENDATIONS ON INFLUENZA September 2017 Address requests about publications of the WHO Regional Office for Europe to: Publications WHO Regional Office for Europe Marmorvej
UK bowel cancer care outcomes: A comparison with Europe
 UK bowel cancer care outcomes: A comparison with Europe What is bowel cancer? Bowel cancer, which is also known as colorectal or colon cancer, is a cancer that affects either the colon or the rectum. The
The Risk of Alcohol in Europe. Bridging the Gap June 2004
 The Risk of Alcohol in Europe Bridging the Gap 16-19 June 2004 1. What is the relationship between alcohol and the risk of heart disease? 2. What is the relationship between alcohol and the risk of other
The health economic landscape of cancer in Europe
 1 Approval number The health economic landscape of cancer in Europe Bengt Jönsson, Professor Emeritus of Health Economics Stockholm School of Economics 2 Disclaimer This presentation was developed by Professor
Current levels and recent trends in health inequalities in the EU: Updates from the EU Report
 Current levels and recent trends in health inequalities in the EU: Updates from the EU Report Anne Scott London Health Observatory Expert Working Group on Social Determinants and Health Inequalities Luxembourg,
HEALTH, FOOD AND ALCOHOL AND SAFETY
 Special Eurobarometer European Commission HEALTH, FOOD AND ALCOHOL AND SAFETY Fieldwork: January-February 2003 Publication: December 2003 Special Eurobarometer 186 / Wave 59.0 - European Opinion Research
RECOMMENDATIONS ON INFLUENZA VACCINATION DURING THE WINTER SEASON
 RECOMMENDATIONS ON INFLUENZA VACCINATION DURING THE 2018 2019 WINTER SEASON October 2018 Address requests about publications of the WHO Regional Office for Europe to: Publications WHO Regional Office for
Annual epidemiological report 2014 food- and waterborne diseases and zoonoses
 Annual epidemiological report 2014 food- and waterborne diseases and zoonoses SURVEILLANCE REPORT Salmonellosis Salmonellosis is the second most commonly reported gastrointestinal infection and an important
Where do EU Contries set the limit for low risk drinking.
 Where do EU Contries set the limit for low risk drinking. Results from the EU RARHA survey E. Scafato,L. Galluzzo, S. Ghirini, C. Gandin Istituto Superiore di Sanità, Italy WP5: Outline of the work (tasks)
Summary. 10 The 2007 ESPAD Report
 The main purpose of the European School Survey Project on Alcohol and Other Drugs (ESPAD) is to collect comparable data on substance use among 15 16 year-old European students in order to monitor trends
COMMISSION OF THE EUROPEAN COMMUNITIES COMMISSION STAFF WORKING DOCUMENT. Accompanying document to the
 EN EN COMMISSION OF THE EUROPEAN COMMUNITIES Brussels, 30.6.2009 SEC(2009) 894 Part 1 COMMISSION STAFF WORKING DOCUMENT Accompanying document to the Proposal for a COUNCIL RECOMMENDATION on smoke-free
Media Release. Inaugural study reveals that more than one in four women in European and Central Asian prisons locked up for drug offences
 Media Release Embargoed 00.01 CET Monday 12 th March 2012 Inaugural study reveals that more than one in four women in European and Central Asian prisons locked up for drug offences Up to 70 percent of
European Collaboration on Dementia. Luxembourg, 13 December 2006
 European Collaboration on Dementia Luxembourg, 13 December 2006 2005 Call for projects Special attention has also to be given to information and definition of indicators on neurodegenerative, neurodevelopment,
PARALLELISM AND THE LEGITIMACY GAP 1. Appendix A. Country Information
 PARALLELISM AND THE LEGITIMACY GAP 1 Appendix A Country Information PARALLELISM AND THE LEGITIMACY GAP 2 Table A.1 Sample size by country 2006 2008 2010 Austria 2405 2255 0 Belgium 1798 1760 1704 Bulgaria
The way we drink now
 EUROPEAN DRINKING TRENDS The way we drink now Helena Conibear, of Alcohol in Moderation, examines the most recent research on people s drinking habits across Europe today. Notable trends include a rise
Present and potential perspectives for information on alcohol use in the EU
 EMCDDA Present and potential perspectives for information on alcohol use in the EU Julian Vicente Luxembourg 7-8 June 2016 CNAPA meeting Topics in this presentation 1.- EMCDDA overview and its work on
REPORT FROM THE COMMISSION TO THE EUROPEAN PARLIAMENT, THE COUNCIL, THE EUROPEAN ECONOMIC AND SOCIAL COMMITTEE AND THE COMMITTEE OF THE REGIONS
 EUROPEAN COMMISSION Brussels, 17.6.011 COM(011) 35 final REPORT FROM THE COMMISSION TO THE EUROPEAN PARLIAMENT, THE COUNCIL, THE EUROPEAN ECONOMIC AND SOCIAL COMMITTEE AND THE COMMITTEE OF THE REGIONS
Monthly measles and rubella monitoring report
 SURVEILLANCE REPORT Monthly measles and rubella monitoring report December 2018 Period covered: 1 November 2017 to 31 October 2018 Introduction This monitoring report is based on measles and rubella data
Research paper: Legal treatment of the use of cannabis for medical purposes in the member states of the European Union
 Parliament of Montenegro Parliamentary Institute Research Centre Research paper: Legal treatment of the use of cannabis for medical purposes in the member states of the European Union Podgorica, December
Alcohol in Europe and Brief Intervention. Dr Lars Møller Programme Manager World Health Organization Regional Office for Europe
 Alcohol in Europe and Brief Intervention Dr Lars Møller Programme Manager World Health Organization Regional Office for Europe Global risk factors ranked by attributable burden of disease 2010 (GBD, Lancet,
This document is a preview generated by EVS
 TECHNICAL REPORT RAPPORT TECHNIQUE TECHNISCHER BERICHT CEN/TR 17223 March 2018 ICS 03.100.70; 11.040.01 English version Guidance on the relationship between EN ISO 13485: 2016 (Medical devices - Quality
Injecting trends in Austria including results of a systematic literature review on interventions aiming to influence the route of administration
 Injecting trends in Austria including results of a systematic literature review on interventions aiming to influence the route of administration Alexander Grabenhofer-Eggerth TDI expert meeting - Lisbon,
HPAI H5(N8) in Member States in poultry, captive and wild birds
 in Member States in poultry, captive and wild birds") HPAI H5(N8) in Member States in poultry, captive and wild birds (01/10/2016-01/03/2017) DG Health and Food Safety 13,578,000 5,610,000 234,000 Broad migration flows of ducks across Europe 1,000,000 71,000
HPAI H5(N8) in Member States in poultry, captive and wild birds (01/10/2016-01/03/2017) DG Health and Food Safety 13,578,000 5,610,000 234,000 Broad migration flows of ducks across Europe 1,000,000 71,000