Advancing Wellbeing in Northern Arizona: A Regional Health Equity Assessment September 6, 2017
|
|
|
- Bennett Lane
- 5 years ago
- Views:
Transcription
 523-9188; Fax: (928) 523-4648 Email: CHER@nau.")

1 Advancing Wellbeing in Northern Arizona: A Regional Health Equity Assessment September 6, 2017 This report was prepared by the Northern Arizona University Center for Health Equity Research 1395 S. Knoles Dr. Flagstaff AZ, Phone: (928) ; Fax: (928) CHER@nau.edu Report Contributors: Katharine Sanderson, MA, Heather J. Williamson, DrPH, Emery Eaves, PhD, Steven Barger, PhD, Crystal Hepp, PhD, Kristan Elwell, PhD, Ricky Camplain, PhD, Kyle Winfree, PhD, Robert T. Trotter, PhD, and Julie A. Baldwin, PhD This report was commissioned by the NARBHA Institute with thanks to the NAH Foundation for their partnership and support.
2 TABLE OF CONTENTS List of Figures... iii List of Tables... vi Executive Summary... vii Introduction... 1 Northern Arizona Regional Overview... 1 Geographic Overview... 2 Demographic Overview... 3 Theoretical Framework and Research Design... 9 Social Determinants of Health Model... 9 Mixed-Methods Research Design... 9 Qualitative Methods Quantitative Methods Negotiation of Data Use Agreements Results Regional Health Overview Leading Causes of Mortality Regional Trends County Trends Causes of Hospital Admission and Emergency Visits Regional Trends County Trends Primary Care Area Trends Priority Health Outcomes of Community Members Substance Abuse and Behavioral Health Issues Population-Specific Information Chronic Health Conditions of Concern Population-Specific Information Patterns and Disparities in Populations Health Patterns and Disparities in Rural vs. Urban Populations Health Patterns and Disparities by Race/Ethnicity Leading Causes of Mortality: Stratification by Race and Ethnicity by County Health Patterns in Children (Age 0 24) Social Determinants of Health SDOH Factor 1: Access to Health Care SDOH Factor 2: Economic Stability SDOH Factor 3: Education SDOH Factor 4: Neighborhood and Physical Environment SDOH Factor 5: Social and Cultural Context Organizational Barriers Lack of Funding Resources i
3 Lack of Evaluation and Data Collection Capacity Lack of Collaboration and Communication between Agencies Needed Services Identified by Participants Report Strengths and Limitations Preliminary Recommendation Social Determinants of Health Target Populations Increase Quantity and Quality of Health Services and Resources Multi-Sector Collaboration Work Toward Integration of Health Services into One Medical System and Setting Increase Awareness of and Access to Existing Health Resources in the Community Next Steps Project Contributors Works Cited Appendices A. Interview Guide for Community Member Interviews B. Focus Group Question Guide for Community Member Focus Groups C. CDC WONDER Leading Causes of Mortality by Nation, State, and County D. Total Number of Hospital Admissions and Emergency Department Visits, 2010 and 2014, for each ICD-9 Code Category by County E. Hospital Discharge Summary of Age Distributions at Time of Hospitalization Related to Suicide, Suicide Attempt, or Self-inflicted Injury by County (2014) F. Top 15 Hospital Discharge Diagnoses for Inpatient Admission and ED Visits by Urban Area and Rural Areas, 2010 and G. Leading Causes of Mortality by Ethnicity and County H. Top 15 Discharge Diagnoses for Selected Age Groups by County, 2010 and ii
4 List of Figures 1. Map of the northern Arizona region Regional land distribution by county Regional land ownership by county County population totals Age distribution by county Racial/ethnic population characteristics by county Regional primary language and immigration by county Regional veteran population by county Regional tribal population of largest tribes Regional tribal population of smallest tribes Regional population characteristics by county Regional population centers by county The Social Determinants of Health (SDOH) Model BRFSS self-rated health status BRFSS physically unhealthy days BRFSS mentally unhealthy days BRFSS activity limitations Mortality causes higher in northern Arizona Leading causes of mortality by county Remaining leading causes of mortality by county Map of primary care areas in Arizona Hospital visits by per 10,000 residents living in a primary care area in BRFSS binge drinking by county BRFSS smoking by county Regional substance abuse related arrest rates by county Alcohol and marijuana use by twelfth graders Other types of substance use by twelfth graders, prescription drugs Other types of substance use by twelfth graders, non-prescription drugs Suicide rates by county Unintentional injury rates by county Age at time of hospitalization for suicide, suicide attempt, or self-inflicted injury BRFSS high cholesterol by county BRFSS prior heart attack by county BRFSS diabetes by county BRFSS high blood pressure by county Regional population distribution by county Foreign and remote levels by zip code Top disease categories for inpatient admissions: urban/rural, Top disease categories for inpatient admissions: urban/rural, Top disease categories for ED visits: urban/rural, iii
5 41. Top disease categories for ED visits: urban/rural, BRFSS self-rated health status by ethnicity and county BRFSS functional limitations by ethnicity and county BRFSS mental health by ethnicity and county Leadings causes of mortality by ethnicity Age-adjusted unintentional injury rate by county and ethnicity, Chronic liver diseases in the AI/AN population Clinical disease categories stratified by ethnicity and race, Hospital utilization by PCA and ethnicity, Regional summary of disease categories for top 15 diagnoses, Regional summary of disease categories for top 15 diagnoses, Top disease categories for children < 1 year by county, Top disease categories for children < 1 year by county, Top disease categories for children ages 1 4 years by county, Top disease categories for children ages 1 4 years by county, Top disease categories for children ages 5 9 years by county, Top disease categories for children ages 5 9 years by county, Top disease categories for children ages years by county, Top disease categories for children ages years by county, Top disease categories for children ages years by county, Top disease categories for children ages years by county, Diagram depicting the Social Determinants of Health (SDOH) model BRFSS usual source of care BRFSS recent doctor visit BRFSS recent dentist visit BRFSS insurance coverage Rates of insured population by county BRFSS couldn t see a doctor because of cost Rates of insured population on tribal reservations BRFSS couldn t fill prescription due to cost Regional poverty rates by county Trends in unemployment by county Tribal poverty and unemployment rates Regional home ownership by county Regional affordable quality housing measures by county BRFSS mental health and income BRFSS self-rated health and income BRFSS functional limitation and income BRFSS cardiovascular risk and income Regional rates of food insecurity by county Map of regional food insecurity BRFSS daily vegetable intake BRFSS daily fruit intake Regional educational attainment by county Regional annual drop-out rates by county iv
6 86. Regional on time high school graduation rates by county and ethnicity BRFSS cardiovascular risk and education BRFSS self-rated health and education BRFSS functional limitation and education BRFSS mentally unhealthy days and education BRFSS sufficiently active BRFSS meeting physical activity goals Regional access to physical activity and recreation opportunities by county Violent crime rates by county Regional domestic violence arrest rates by county Regional aggravated domestic violence arrest rates by county Air pollution by county v
7 List of Tables 1. Documents Collected for Needs and Assets Assessment Synthesis Community Interview Sampling Schema Summary of Qualitative Methods Leading Causes of Mortality across Northern Arizona Region, List of ICD-9 Code Categories Top 10 Most Common Clinical Manifestations for Northern Arizona Residents, Populations Uniquely Affected by Health Challenges Number of Survey Participants by Race/Ethnicity and County, Leading Causes of Mortality, Apache County Leading Causes of Mortality, Coconino County Leading Causes of Mortality, Gila County Leading Causes of Mortality, Mohave County Leading Causes of Mortality, Navajo County Leading Causes of Mortality, Yavapai County Population to Mental Health Provider Ratio Primary Care Area Resource Profile Population to Dentist Ratio Regional Child Abuse and Neglect Reports by County vi
8 Executive Summary Northern Arizona s health challenges are complex. The geographical, cultural, political, and socioeconomic in this region require an assessment process that considers health indicator data in the context of dynamic social and environmental influences that affect population health and individual wellbeing. This assessment was designed to provide critical information on outcomes from this vital context. Its results are intended to inform dialogue among diverse partners and service delivery organizations so that novel solutions can be developed, implemented, and evaluated to address disparities that may be prioritized for collaborative intervention. 1
9 Why Health Equity? Wellbeing and good health are not equitably distributed. As defined by the National Academies of Sciences, Engineering, and Medicine, health equity is: the state in which everyone has the chance to attain their full health potential and no one is disadvantaged from achieving this potential because of social position or any other defined circumstance. 1 Targeted solutions designed to address health equity needs and challenges in northern Arizona can improve health status indicators, reduce costs in medical care, and promote vibrant community development with benefits across the social and economic spectrum. Scope of Study The NARBHA Institute, in partnership with the Northern Arizona Healthcare Foundation, commissioned the NAU Center for Health Equity Research (CHER) to conduct a regional health equity needs assessment to inform the goal of advancing wellbeing in northern Arizona. This report summarizes findings from CHER s comprehensive study of health disparities across the six-county region of northern Arizona encompassed by Apache, Coconino, Gila, Mohave, Navajo, and Yavapai Counties. This extensive area, which covers 66,223 square miles, is ethnically diverse and largely rural, with a mix of tribal, public and privately owned lands. Twelve of the 22 federally recognized American Indian tribes in Arizona live in this region. Methods The comprehensive nature of the analysis is unique; the report authors are not aware of any previous studies occurring in the region with a similar breadth and scope. The project team collected and analyzed diverse quantitative and qualitative data in an iterative process, which allowed team members to regularly discuss ongoing findings and identify areas for further exploration. Qualitative data collection occurred through: Detailed review and synthesis of 57 existing reports from the region; Engagement in 18 stakeholder meetings, 13 conferences and community forums, 62 interviews with community leaders and service providers, and seven focus groups with 49 participants. The quantitative team completed: Primary data analysis of the Arizona Department of Health Services Hospital Discharge, Centers for Disease Control and Prevention (CDC WONDER), and the Behavioral Risk Factor Surveillance System (BRFSS) datasets; Secondary data analysis of county-level information in diverse sectors (e.g. health, employment, poverty, food security, education, crime, youth behavior and neighborhood environment). Framework for Analysis Social factors determine health outcomes more often than medical care. The assessment was guided by the Social Determinants of Health (SDOH) 2 framework to allow for exploration of the complex intersections of social, cultural, economic, and s level influences on health and wellbeing. Information was gathered in 5 categories: access to healthcare, economic stability, education, neighborhood and built environment, and social and cultural contexts. Such a holistic approach is fundamental to ongoing efforts to identify -level changes that offer the potential to reduce health inequity in the region. 1 viii


10 Result Highlights Among the many results identified in the assessment, noteworthy findings include: Higher Fatality Rates When comparing Arizona and United States age-adjusted causes of death, the six-county region has significantly higher fatality rates from heart disease, cancer, chronic lower respiratory disease, accidents, suicide, chronic liver disease and assault/homicide. These leading causes of death varied by county and community, with the top three causes of death overall for the region being diseases of the heart, cancer and unintentional injuries. Increased Rates of Injury and Suicide Among the leading causes of death, accidents and suicide were of particular note for northern Arizona given their comparatively high rates. Suicide rates were highest among non-hispanic whites, while fatalities from unintentional injuries were highest among American Indian populations. Suicide and self-inflicted injury rates were also highest among people ages across the region. Burden of Chronic Disease Chronic health, especially diabetes, heart disease, obesity, respiratory and dental health were highlighted qualitatively as important health priorities. Across the region, the leading causes of death largely aligned with the health priorities identified by participants in the qualitative analysis, including diseases of the heart, diabetes and respiratory. Impact of Substance Use and Poor Behavioral Health Study participants identified substance use and behavioral health as critical priorities because of the influence these issues have on accidents, suicide, chronic illnesses and violent crime, as well as their negative effects on educational attainment, economic self-sufficiency and social engagement. Population-Specific Disparity Patterns Participants emphasized the key role that population level analysis will play in ongoing improvement efforts. Specific populations identified for additional deeper dive analysis and potential targeted interventions included American Indians (including elders), Hispanics, Veterans, aging adults, children, rural populations, low-income populations, members of the LGBTQ community and individuals with disabilities. Opportunity for Interdisciplinary Partnerships While appreciative of the existing services that bring diverse individual and community benefits, many participants stressed the need for more crosssector, inter-agency collaboration in data collection and analysis, strategic planning and resource sharing, and program implementation. shutterstock ix

11 SDOH Findings Participants identified a range of social, environmental and issues affecting health equity and wellbeing in the northern Arizona region. This information is summarized within the SDOH five-dimensional framework as follows. ACCESS TO HEALTHCARE Access to healthcare was the most discussed barrier to achieving good health. There is a shortage of providers and services across primary care, behavioral health and dental care. Specialty provider visits, especially for children, require residents to travel long distances, often traveling outside the region. Although many people report having some type of health insurance coverage, residents regularly experience difficulties accessing care because of an insufficient number of providers, the cost of services or a lack of navigation competency. Recruitment and retention of rural-based providers has proven challenging and there are long wait times reported for many facilities. There is limited capacity for receiving behavioral health services, partially because of a lack of providers, but also, due to eligibility requirements and inadequate service options. There is a common perception that people most likely to receive needed behavioral health services are those who are AHCCCS-eligible, have a serious mental illness or are in crisis. Resident behavioral health needs that are less severe are often unmet. Because they frequently interface with community members with mental health problems, law enforcement officials need more training to recognize mental health and navigate the behavioral health. Participants highlighted inadequate home health care for older adults and people with disabilities, and a shortage of palliative care for people with serious. Access to dental services for preventive care is reported as limited across the region. Poor dental coverage with many insurance plans also creates major barriers. x


12 ECONOMIC STABILITY A significant percentage of the population in the northern Arizona region live in poverty. All six counties have a higher percentage of children living in poverty than national rates and five out of six counties experience overall higher poverty rates compared with the national average. Lack of employment opportunities, in particular among American Indian communities, contributes to high poverty rates. High cost of living and unavailability/unaffordability of housing options impact residents ability to procure healthy foods, health care services and other basic resources. Limited local access to healthy food options also contributes to high food insecurity. Expanded access to nutritious foods in schools is vital. County-specific associations were identified between lower household income and increased mentally unhealthy days, lower self-rated health status, increased functional limitations and higher cardiovascular risk factors. EDUCATION Educational attainment significantly correlates with reports of health status. Associations were identified between lower education levels and higher mentally unhealthy days, increased cardiovascular morbidity and higher self-reported functional limitations. Variation across the region is seen in high school graduation rates, with Navajo, Gila, and Apache counties having the lowest rates. American Indian youth have the lowest high school graduation rates in the region, followed by Hispanic students. There is a need for improved information-sharing and understanding on the benefits of preventive health care, strategies for managing health (especially for those with chronic physical or behavioral health ), and health navigation. xi

13 SOCIAL & CULTURAL CONTEXT Social and cultural factors have both positive and negative influences on health equity in the region. Strengths There are many close-knit communities in the region whose residents support one another despite social and environmental challenges. Local and regional organizations serving the area have an understanding of the SDOH and often use this framework for holistic approaches to support health and well-being. American Indian populations especially demonstrate resiliency and strong communities supported by cultural revitalization efforts. shutterstock Challenges Limited social activities and productive engagement opportunities are felt to result in higher rates of substance use and other risky behaviors in youth. The stigma associated with seeking mental health services is felt to be palpable. Limited transportation, loss of mobility, and insufficient community and social supports result in social isolation and poor access to resources like food and medication for aging adults and individuals with disabilities. Some members of the American Indian communities identified historical trauma and loss of culture as contributing to health disparities. There is some distrust reported with health s, especially among the Hispanic population. Representatives from both the Hispanic and American Indian communities identified incongruences between traditional health beliefs and western medicine practices. xii

14 NEIGHBORHOOD & BUILT ENVIRONMENT Important environmental factors were identified, including: Transportation options are often limited, and, if available, are frequently not affordable. Access to parks, sidewalks, and other recreational infrastructure is varied, with residents of Apache, Mohave and Navajo counties having less access as compared to the state average. Although most counties in northern Arizona rated better than the state average in the quantitative measurements of violent crime, residents of specific neighborhoods in the region reported high rates of crime and violence, partly attributed to substance use. shutterstock Assessment Limitations Gaps in data available to inform this assessment included: Hospital discharge data for IHS and Tribal 638 facilities. These facilities are not required to report such information to the Arizona Department of Health Services. Data on outpatient healthcare and mental health-related encounters. Such data sources are not easily available for integrated analysis. Data sources specific to the health status of members of the LGBTQ community. Linked data sets, to help identify patterns of individual utilization/needs over time and further population-specific needs for priority populations otherwise identified by the assessment. The intent of this assessment was to gather and summarize quantitative and qualitative data related to health equity across a wide, six-county geography. Consequently, information regarding innovative, best practice programs that are underway across the region was not atically gathered. In addition, the assessment was not designed to specify the priority in which interventions might be collaboratively developed and implemented to address issues identified in the assessment. Such prioritization should occur as part of future activities within and among organizations serving this region. xiii

15 Next Steps Review of this report s findings in diverse community and organizational settings may serve to: 1. Validate its major themes and findings; 2. Formulate plans to address gaps in data and refine topics for further inquiry; 3. Build collaborative dialogue that will facilitate expanded regional information sharing and interdisciplinary program planning. Further programmatic planning will benefit from the following considerations: Improvements in health equity and wellbeing depend on inter-sector and intra-region collaboration. This collaboration can be facilitated by building capacity to more easily communicate, collect and share data and information, and align goals. Fifty-seven existing health reports and community needs assessments were reviewed as part of this regional report. Opportunities exist to combine resources for future assessments. The NAU Center for Health Equity Research would be pleased to participate in planning related to such efforts. Solutions for the multi-factorial challenges identified in this report necessitate interdisciplinary approaches to service delivery; many have either not been previously attempted or have only been demonstrated locally in select communities. New sources of data and the ability to establish links among data sets will be fundamental to future population health collaborations and their evaluations. Because this comprehensive health equity needs assessment included the formal acquisition of data from regional, statewide and national data bases, detailed analysis is now possible of population health that are unique to the region, along with comparative studies of issues that are common across the region, state and nation. There was widespread community uncertainty about service availability in different parts of northern Arizona. Stakeholders should work to create and maintain a comprehensive and up-to-date list of available resources across the region. Resource information should be convenient and readily available, as well as be culturally, linguistically, intellectually, and age appropriate. We hope that this report will establish a solid foundation for continued collaborative efforts to advance wellbeing in northern Arizona. 1. Communities in Action: Pathways to Health Equity. Report by the National Academies of Sciences, Engineering, and Medicine, January CDC. Healthy People Accessed 9/29/16.
16 ii
17 INTRODUCTION The Advancing Wellbeing in Northern Arizona project was generously funded by the NARBHA Institute and the Northern Arizona Healthcare (NAH) Foundation. Our intention as an interdisciplinary research team was to present information that is culturally relevant and comprehensive, and that can be innovatively used to develop and promote community-engaged strategic actions to reduce health disparities across northern Arizona. The geographic, cultural, political, and economic in northern Arizona require an assessment process that does not simply take a generic approach to develop generic solutions. The goal of the regional health needs assessment project was to provide critical information on the context surrounding the health needs and assets of the region. This will foster the creation of locally targeted activities with community and consortium partners that complement the factors identified through existing data sources. By identifying local context and that might not be readily visible in existing data sets (issues of space, time, and culture), this project was designed to avoid one size fits all solutions. This report will contribute to the strategic planning efforts of community organizations, agencies, and health care facilities as they seek to develop targeted, culturally relevant, and locally appropriate interventions to advance community health equity throughout the region. The project has three main goals: Goal 1: Synthesize existing data and conduct deeper data-dives to understand regional patterns and anomalies in health outcomes and access to resources for healthy lifestyles. Goal 2: Identify local and institutional strengths, needs, barriers, and resources for addressing health disparities in northern Arizona. Goal 3: Engage local stakeholders in an interactive and iterative dissemination process. Help identify communities and organizations as potential partners that can build cross-sector collaborations to improve health outcomes. NORTHERN ARIZONA REGIONAL OVERVIEW The northern Arizona region comprises six counties: Apache, Coconino, Gila, Mohave, Navajo, and Yavapai (Figure 1). This region covers 66,223 square miles of land in Arizona and is home to 12 federally recognized American Indian tribes. 2 This region is largely rural and very culturally, economically, and geographically diverse. This diversity makes it important to consider health issues as well as community assets and challenges in a locally specific context. Counties and communities vary greatly in demographics such as ethnicity and age and also in degrees of access to all types of services, opportunities, and utilities necessary for healthy people and communities. Reporting data at the county level obscures many important elements of the social and physical environments that impact health differently for different populations. For example, reporting data at the county level can skew averages toward wealthier urban populations and obscure and realities in rural and underserved populations. This is a necessary and important consideration when developing strategic plans to improve health and increase health equity across the region. Although it is incredibly diverse, the region also shares some important features that contribute to common health issues and challenges, making regional trends an important topic for analysis and collaborative strategies vital to facilitating improvements in the health of the region. 1

18 Figure 1. Map of the northern Arizona region. Geographic Overview Most of the northern Arizona region sits atop the Colorado Plateau and is home to a variety of climates and natural features including sparsely vegetated plateaus and mesas, deep canyons, barren deserts, and dense pine forests. The highest elevations are in Coconino County at 12,633 feet, and the lowest are in Mohave County at 1,112 feet. 3 Northern Arizona is home to some of the most beautiful sites in the country including the Painted Desert, Antelope Canyon, Montezuma Castle National Monument, Monument Valley, Roosevelt Lake, the Grand Canyon, and many other national forests, monuments, rivers, and lakes. Although Coconino County is the largest county in the region geographically, Yavapai and Mohave have much larger populations; Yavapai is the most populous county in the region but it covers only 12% of the land geographically. Most of the land in northern Arizona (52%) is publicly owned and is maintained by either the U.S. Forest Service or the Bureau of Land Management. The second largest sector (27%) is owned by American Indian tribal governments. Only 15% of the total land in the region is privately owned. Although 68% of the land in Apache County is tribally owned, tribal lands make up less than 1% of Yavapai County. 4-9 See Figures 2 and 3. 2

19 Figure 2. Regional land distribution by county % Land Ownership by County 80% 60% 40% 20% 0% Apache Coconino Gila Mohave Navajo Yavapai Tribal Public Private Figure 3. Regional land ownership by county. 3-8 Demographic Overview Figures 4 8 present the population demographics of each county in the region. A comparison of the population of each county reveals great variability in the number and concentration of residents, the relative ages of residents, the ethnic/racial composition of each county, and the percentage of residents who identify as veterans. Apache and Navajo counties have a much younger population than most other counties, with roughly 30% of their respective populations younger than 18. Yavapai and Gila counties have relatively larger aging adult populations. 2 These differences can have large effects on the distribution of important health outcomes and challenges that communities face in getting appropriate and relevant health resources and services. 3
20 Yavapai and Mohave counties are the least ethnically diverse. Gila and Coconino counties have relatively larger Hispanic populations, whereas Apache County is more than 70% American Indian. 2 As discussed later in the report, these populations can face unique challenges as well as social, economic, and political contexts that affect health outcomes. Total Population Apache Coconino Gila Mohave Navajo Yavapai 53,159 71, , , , , , , , , ,000 Figure 4. County population totals. 2 Age 35.0% 30.0% 25.0% 20.0% 15.0% 10.0% 5.0% 0.0% Apache Coconino Gila Mohave Navajo Yavapai < 5 <18 > 65 Figure 5. Age distribution by county. 2 4

21 Race/Ethnicity by County Values <1 are not listed 0% 10% 20% 30% 40% 50% 60% 70% 80% 90% 100% Apache Coconino Gila Mohave Navajo Yavapai White American Indian Hispanic Black Figure 6. Racial/ethnic population characteristics by county % Primary Language and Immigration 50.0% 40.0% 30.0% 20.0% 10.0% 0.0% Apache Coconino Gila Mohave Navajo Yavapai Language other than English spoken at home % of population foreign born Figure 7. Regional primary language and immigration by county. 2 Twelve of 22 federally recognized American Indian tribes live in northern Arizona. Many people of American Indian descent live on reservations, but many also live in border towns, urban centers, and rural areas outside of reservations. The history, economy, culture, and language of each tribe is unique, as is the geography and physical environment of each reservation. The level and quality of social, economic, and health care resources and infrastructure available to tribal members also varies between tribes. Despite their uniqueness, there are also many commonalities in regards to health issues, assets, and barriers that tribal communities share regardless of tribal affiliation. These themes are discussed further later in this report. 5
22 Apache % Veteran Population Coconino Gila Mohave Navajo Yavapai 0% 2% 4% 6% 8% 10% 12% 14% Figure 8. Regional veteran population by county. 2 The relative sizes of each tribe based on percentage of population and percentage land ownership relative to the regional totals are shown in Figures 9 and 10. Only the largest tribes in the region, those comprising more than 1% of the total tribal population in the region, are shown in Figure 9. The seven smaller tribes in the region comprise a combined total of 3% of the regional tribal population. These smaller tribes are shown in Figure 10 according to their proportion of the remaining 3% of the total tribal population. The Navajo Nation, which covers parts of Arizona, Utah, and New Mexico, has more than 200,000 members. 11 According to the 2010 Census, more than 100,000 members of the Navajo Nation are living in the Arizona portion of the reservation, making it the largest tribe in the region in terms of population and reservation size, which totals over 18 million acres. The smallest tribe in the region is the Tonto Apache, who number 120 and occupy a reservation of just 85 acres. 12 Tribal Population (only tribes with >1% of total tribal population) 7% 5% 1% 2% 10% 75% Navajo White Mountain Apache San Carlos Apache Hopi Hulapai Other Tribes (see Figure 10) Figure 9. Regional tribal population of largest tribes. 6
23 4% Smaller Tribes by Population (tribes with < 1% of total tribal population) 7% 9% 37% 17% 26% Ft. Mohave Yavapai Apache Havasupai Kaibab Paiute Yavapai Prescott Tonto Apache Figure 10. Regional tribal population of smallest tribes. San Juan Southern Paiute tribal population is incorporated into total for Navajo Nation. Rural populations experience significant health disparities when compared to more urban populations. Risk factors for these disparities include social and geographic isolation, higher rates of risk behaviors, lower incomes and job opportunities, and fewer opportunities for constructive entertainment and engagement. All of these things contribute to higher rates of chronic illness and lower rates of overall good health in rural communities. 13 Although there are some major urban centers in the region, much of the area consists of small rural areas. Sixty-three percent of the population in the region lives in urban areas (population greater than 50,000) or urban clusters (population greater than 2,500) and 37% live in rural areas (population less than 2,500). 2 See Figure 11. Significant numbers of residents in Coconino, Mohave, and Yavapai counties live in highly developed urban areas, whereas Apache, Gila, and Navajo counties have no population centers with more than 50,000 people. Apache and Navajo counties have the highest populations living in rural areas whereas most of the people in Gila County live in an urban cluster. 2 See Figure 12. As shown, therefore, northern Arizona is primarily rural, with a mix of land ownership between private, public, and tribal groups. Strategic planning to address these diverse environmental and structural issues is challenging. The proportion of the population living in urban versus rural areas has important implications for levels of access to health services and other resources that are important for strong health outcomes. 7
24 Population of Rural vs Urban by County 80% 70% 60% 50% 40% 30% 20% 10% 0% Apache Coconino Gila Mohave Navajo Yavapai Urban Area (> 50,000) Urban Cluster (2,500-50,000) Rural Area (< 2,500) Figure 11. Regional population characteristics by county Major Cities (Populations over 7,000 people) Coconino Mohave Yavapai Gila Navajo Apache* Figure 12. Regional population centers by county. *No towns in Apache County have populations higher than 7,000 people. The largest towns in the county are Eager with 4,885 people and Chinle (part of the Navajo Nation) with 4518 people (Census 2010). 8
25 THEORETICAL FRAMEWORK AND RESEARCH DESIGN Due to the comprehensive nature of the needs assessment and the expansive size of the region, we elected to use the Social Determinants of Health Model (SDOH) as an overarching theoretical framework for this needs assessment. The SDOH serves as a guide for exploring the complex intersections between social, cultural, economic, political, and s level influences on mental and physical health among diverse populations throughout the region. 1 SOCIAL DETERMINANTS OF HEALTH MODEL The World Health Organization defines the SDOH as encompassing the in which people are born, grow, live, work, and age circumstances shaped by the distribution of money, power, and resources at global, national, and local levels. 1 It is important to explore the social and physical environments in which people live as we strive to see health in terms of holistic wellbeing instead of merely as the absence of disease or illness. Issues such as access to health care, neighborhood safety, economic stability, and many other conditional influences affect individual and population health. It is also important to understand the context in which people make decisions that affect their health. Accordingly, the SDOH is now widely recognized as a critical model that attempts to explain and mitigate health disparities and inequities worldwide. Figure 13 depicts a working model of the SDOH, illustrating correlations between multiple social factors that affect health outcomes and individual and community wellbeing. 1 The SDOH model does not ignore the immediate causes of poor health such as individual decisions and genetics, but it expands the picture to consider the upstream factors that create the for poor health and inequitable access to resources. This framework helped us to identify critical information that could help elucidate both immediate and underlying community needs and assets. By highlighting the unique aspects of geography, demography, and the economic and social context of the region, this report will help to guide regional partners in creating locally adaptive and relevant strategies that can make a lasting and positive impact on the health of the region. MIXED-METHODS RESEARCH DESIGN The needs assessment team consisted of researchers and affiliates who brought a diverse set of skills including qualitative and quantitative research, biostatistics, community-based participatory research, data informatics and imaging, GIS (Geographic Information Systems) mapping, and program evaluation. The team used a mixed-methods research design to gather, analyze, and integrate both qualitative and quantitative data to understand health issues, contexts, priorities, and assets and to help build a more complete picture of health and wellbeing across the region. By collecting and analyzing both qualitative and quantitative data, the team was able to triangulate findings and help compensate for the weaknesses of each type of data. There are areas where qualitative data helped to explain the significance or seeming inconsistency in the numbers, and there are also instances where the statistical data helped to give credence to the anecdotal evidence. Utilizing a mixed-methods approach allowed for a more in-depth picture of health and wellness priorities and assets throughout the northern Arizona region. 9
26 Access to Health Care Social & Cultural Context Education Economic Stability Neighborhood & Built Environment Culturally Competent Care Health Literacy Quality of Care Health Insurance Provider Availability Social Cohesion Community Engagement Social Support Systems Discrimination Incarceration Graduation Rates Language & Literacy Early Childhood Education Higher Education Poverty Employment Affordable Housing Food Security Access to Healthy Food & Recreation Crime & Violence Air & Water Quality HEALTH OUTCOMES Mortality, Morbidity, Life Expectancy, Health Status, Functional Limitations, Health-Related Quality of Life Figure 13. The Social Determinants of Health Model (SDOH). To collect qualitative data, the team conducted focus groups and interviews with community members, leaders, and health care providers. The team also attended various community forums and regional health conferences, and held meetings with a variety of local stakeholders and community organizations. The focus of these data collection methods was to draw on the firsthand experience of those living and working in the region to document their perceptions and priorities regarding health in their communities, and to add important social and cultural contexts to health issues that are not measurable using strictly quantitative data. To collect relevant quantitative data, the team focused on primary data sources that included geographic resolution at the zip code or county level. The main data sets analyzed were from the Behavioral Risk Factor Surveillance System (BRFSS) and the Arizona Department of Health Services Hospital Discharge Data. The BRFSS data include important indicators that address topics such as access to health care, self-reported health status, preventative and health management behaviors, and additional social determinants of health such as income and education. 10 The hospital discharge data include all hospital admissions and emergency department visits, and show both primary and secondary diagnoses of all patients who sought care at every hospital across the region. These data can be aggregated to show prevalence of more than 250 health according to any number of categories including insurance type, gender, age, ethnicity, and zip code of residence. The report also includes a number of secondary data sources, aggregated at the county level. 10
27 Throughout the process, the team continuously conducted an informal gap analysis through constant comparison of emerging trends and themes, existing data, and community and stakeholder priorities. Quantitative and qualitative researchers frequently came together to discuss the research process, available data, and preliminary findings. This process helped to identify strategic areas for deeper datadives and to inform the data collecting and analysis practices from both teams. Qualitative Methods The first phase of this project involved conducting visioning focus groups with project funders and key stakeholders within the region. Questions posed to participants were open ended and all members were given a chance to participate. During these visioning groups, participants discussed a variety of topics including emerging and persistent health priorities, available data sources, additional stakeholders to incorporate into the process, and desired deliverables of the project. The research team used these groups as a first step to outline the overall goals and scope of the project. All visioning focus groups were audio recorded and transcribed verbatim. The transcriptions were then coded using NVivo Qualitative Analysis Software. 15 Analysis of the data followed a standard ethnographic approach of identifying consensus-level themes and trends. 16 We began each visioning group using a standard ethnographic approach known as freelisting to design knowledge-based and opinion-based questions about health. 17 A freelisting-style question allows for a mixed-methods (both qualitative and quantitative) approach to data collection. The participant is asked to list everything they can about a particular topic e.g., list all of the health disparities or health issues that exist in northern Arizona that we could address in this assessment. We used this technique to build a consensus model of health priorities of key stakeholders. The freelisting data were analyzed using a cognitive anthropology program called Anthropac. 17 The program allows the composite freelistings from all respondents to be displayed in a table that lists all items mentioned by all participants and identifies the rank ordering, saliency, and frequency of each item. We categorized each response into broader topic areas to highlight areas of general consensus. As part of this needs assessment process, the research team collected, analyzed, cross-checked, and synthesized existing regional and institutional reports and data, such as county health needs assessments, health improvement plans, and reports on specific health issues in the region. These investigations were focused on the needs and assets identified in existing local, regional, and statewide assessments. Because of the prevalence of additional data sources for specific and up-to-date quantitative indicators and measures, we chose to focus on broader themes, key priorities, and the qualitative methods used by various counties and agencies to gain an understanding of the social context of health needs and assets within the region, as well as areas of underlying methodological biases and potential gaps in addressing health disparities in the region. Although needs assessments and strategic plans completed within the past 3 years were prioritized, we also collected assessments and plans conducted as far back as Older assessments were treated as longitudinal assessment data, rather than current health data within the communities of interest. The team collected and synthesized 57 documents, which included a needs assessment for each county in northern Arizona (Apache, Coconino, Gila, Mohave, Navajo, Yavapai), needs assessments for regional 11
28 medical centers within each county, assessments of tribal populations, and needs and assets assessments for organizations such as the Susan Komen Foundation, WIC, Veterans Affairs, and other organizations whenever available. Needs assessments that focused on specific illnesses, housing, disability, and other specific topics of interest with a statewide focus were included to provide in-depth information on programs within the region of interest. See Table 1. Table 1: Documents Collected for Needs and Assets Assessment Synthesis Region Document Type Population or Agency Year (s) AZ Statewide Annual Report Substance Abuse 2014 AZ Statewide Annual Report General Population 2011 AZ Statewide-Tribes Annual Report American Indian 2008 AZ Statewide-Tribes Annual Report American Indian 2014 County-Apache Annual Report General County Population 2013, 14 Tribe-Navajo Annual Report HIV/AIDS, Navajo Nation 2015 Tribe-Navajo Annual Report Tuba City Regional HC Corp Tribe-Navajo Health Survey Navajo Nation 2013 AZ Statewide Health System Review Behavioral Health 2011 AZ Statewide Health System Review Developmental Disabilities 2016 AZ Statewide Needs Assessment HIV/AIDS 2014 AZ Statewide Needs Assessment WIC 2013 AZ Statewide Needs Assessment Oral Health 2004 County-Coconino Needs Assessment Flagstaff Medical Center 2012, 15 County-Coconino Needs Assessment Page Medical Center 2013 County-Coconino Needs Assessment General County Population 2013, 16 County-Gila Needs Assessment General County Population 2012, 15 County-Mohave Needs Assessment General County Population 2012,13 County-Mohave Needs Assessment Kingman Regional Medical Center 2016 County-Navajo Needs Assessment Little Colorado Medical Center 2014 County-Navajo Needs Assessment Summit Regional Medical Center 2015 County-Navajo Needs Assessment General County Population 2012 County-Yavapai Needs Assessment General County Population 2012 County-Yavapai Needs Assessment Yavapai Regional Medical Center 2013 Northern Arizona Needs Assessment Mental Health 2015 Northern AZ-Verde Needs Assessment Verde Valley Medical Center 2012 Valley Tribe-Navajo Needs Assessment Asthma 2015 Tribe-Navajo Needs Assessment Tsehootsooi (Ft. Defiance) Medical 2013 Center US Border States Needs Assessment CHW Training Needs 2011 US Nationwide Needs Assessment Disabilities, American Indian 2011 US-Western States Needs Assessment Veterans 2014 Tribe-Hualapai Needs Assessment/Assets Hualapai Tribe 2014 Report AZ Statewide-Tribes Report-AI Behavioral Health Behavioral Health, American Indian 2012 AZ Statewide-Tribes Report-AI Health Conference American Indian 2012 AZ Statewide-Tribes Report-AI Health Status American Indian 2014 AZ Statewide-Tribes Report-AI Trauma American Indian Trauma
29 Table 1 (continued) AZ Statewide Report-Breast Cancer Community Breast Cancer 2015 Profile AZ Statewide Report-Early Childhood Early Childhood 2015 Opportunities AZ Statewide Report-Oral Health Oral Health 2016 AZ Statewide-Tribes Report-Oral Health Summit Oral Health, American Indian 2011 AZ Statewide Report-Race/Ethnicity Racial/Ethnic Differences in 2013 Comparative Health Status AZ Statewide Report-Racial/Ethnic Health Status Racial/Ethnic Differences in 2013 Health Status AZ Statewide Report-SMI Service Capacity Serious Mental Illness 2014 Assessment AZ Statewide-Tribes Report-Tribes Consultation American Indian 2015 AZ Statewide Strategic Plan Housing County-Apache Strategic Plan General County Population 2013 County-Coconino Strategic Plan General County Population 2014 County-Gila Strategic Plan General County Population 2012 County-Mohave Strategic Plan Mohave Regional Medical Center 2013 County-Navajo Strategic Plan General County Population 2013 Prescott Quad Cities Strategic Plan General Population 2014 The initial synthesis of existing health needs assessments and strategic plans was completed using Excel to catalogue priorities and methods by region. In-depth syntheses using NVivo Qualitative Analysis Software involved the development of codes to categorize topics identified in the initial stages of coding. 15 NVivo coding was used to aggregate specific health topics, existing programs, evaluation status, and barriers to health as identified by the various counties. Further, several of the assessments reported on community surveys, key informant interviews, and focus groups. These reports provided initial community perspectives and informed our development of surveys and interview guides to use in this assessment. Meetings with stakeholder organizations helped us to start to build relationships with organizations and agencies working on health issues throughout the region to get their perspective and insights into health issues as well as where to go for additional information. We met with a number of groups working on community health issues throughout the region who represent diverse populations such as the Intertribal Council of Arizona, First Things First, Health Choice Integrated Care, and county and tribal health departments and agencies. Because health departments are responsible for the community health needs assessments (CHNA), we used these meetings to discuss their most recent CHNAs. We did not ask participants to reiterate what was published in their needs assessments, but instead to expand on what was included and discuss issues that may not have been reflected in the needs assessment but are still prevalent in the community. The team attended various conferences across the region to collect and share information. The main goals in attending these meetings and conferences was to introduce the goals and objectives of the project, solicit input on perceptions of health priorities, learn about key issues that are currently being addressed, and discuss potential collaboration and data sharing opportunities. 13
30 The research team conducted interviews with local stakeholders, health care providers, and community leaders. These semi-structured, one-on-one interviews were designed to explore a variety of community perspectives on the major health concerns and disparities as well as relevant community assets and strengths throughout northern Arizona. See Appendix A for the full interview question guide. The main topics we explored in these interviews are outlined as follows: Persistent and emerging health issues. Prevalent disparities and the populations most adversely affected by these disparities. Social/structural determinants of health (SDOH) that contribute to the disparities. Organization and agency level challenges needed to address health issues. Strengths of the health care in northern Arizona that can be built upon to increase capacity and deliver quality health care services. Programs or organizations that employ innovative strategies to serve the needs of the community and have been successful in overcoming common challenges across the region. We started by identifying three key groups of stakeholders (described below) who would offer complementary perspectives and insights into community health issues. To build a nominated expert sampling frame, we asked everyone we spoke with to name other people who they felt would offer a unique and relevant perspective on regional health issues. We divided the participants into three groups, outlined below, for coding purposes. Visioneers: People involved in health care or community life who can reach across county lines and offer a perspective of the entire region. This group includes researchers, consultants and tribal liaisons, and regional directors of programs and services. Community Leaders: Leaders of faith-based organizations, political officers, law enforcement officers, directors of community programs and services, and educators. Community Providers: Doctors, nurses, care coordinators, community health representatives, health educators, social workers, counselors, and other direct health service providers. To ensure that we captured a thorough and varied sample of county and tribal level expertise, we developed a target sample schema, distributing the targets evenly across sectors of expertise, tribe, and county. See Tables 2 and 3. Interviewers audio recorded each interview and took detailed notes. The research team then reviewed the audio recordings and transcribed exemplary and compelling quotes to be used in the final report. The interview notes were coded using NVivo Qualitative Analysis Software as described above. Researchers followed a standard ethnographic approach of identifying consensus-level themes and cultural perceptions, as well as variability around those themes. 16,18 The team also collected supporting primary data through the implementation of community member focus groups. We used the focus groups as an opportunity to further explore priority health issues and document the stories and experiences of community members who are dealing with these issues firsthand. We also documented participants perceptions of community sources of resilience and the experiences of people who are benefitting from successful strategies to help eliminate health barriers and disparities. 14
31 Sector of Expertise Behavioral Health Services Table 2: Community Interview Sampling Schema Home County of Participant Apache Coconino Gila Mohave Navajo Yavapai Tribal Medical Provider Housing/ Shelter Services Food Security and Hunger Youth Programs Education Senior Services Jail & Probation Services Fire Dept. and First Responders We conducted seven focus groups that represented geographically diverse areas across the region including Page, Winslow, Kingman, Payson, and Springerville. We also used our preliminary data-dive to locate some specific area residents who face unique challenges regarding health and wellness including older adults, low-income residents, border town residents, veterans, and residents of very remote or rural locations. See Appendix B for the full focus group question guide. Photovoice is a participatory qualitative research method in which participants go out into their community and take photographs to explore community issues and identify community needs and assets. We are implementing this data collection technique to include the voices of young people across the region in a creative way that will allow community members to share their stories and experiences through a powerful visual medium. 19 The team conducted a training and information session with two youth groups and then sent them out into their communities to take photographs. After the photographs were developed, the participants engaged in a group discussion with researchers to talk about the pictures they took, the significance of the images, what the pictures represent to the photographer and to the rest of the group, and what context the pictures can provide to the overall health of their communities. This method also facilitates the development of a critical dialogue between researchers and community members where participants can explore community issues as they construct meaning through their own personal experiences. 20 Oftentimes, the photos serve as a springboard to enter into a meaningful discussion of many topics and issues surrounding health and wellness. This method also allows participants to advocate for themselves and their communities using their own language and experiences. 21 Through Photovoice, we asked young people to explore themes related to (1) health concerns or problems prevalent in their community; (2) things that made it more difficult to be healthy in the community; and (3) things that made it easier for people in the community to be healthy. 15
32 Table 3: Summary of Qualitative Methods Method of Data Collection Examples of Participants Number completed Synthesis of existing needs County Assessments 57 assessments Tribal Assessments Regional Assessments Medical Center Assessments Private Foundation Assessments Meetings with stakeholder organizations Conferences and community forums Interviews with community leaders and providers NARBHA Institute NAH Foundation and NAH North Country Healthcare Intertribal Council of Arizona County and Tribal Health Departments First Things First HCIC Indigenous Community Forums Indian Disability Summit Navajo Nation COPE Symposium: Community Outreach and Patient Empowerment AZ Rural Health Conference: U of A Center for Rural Health HCIC Tribal Summit Hopi Mental Health Conference CHR Conference Behavioral Health Care Providers Medical Providers and CHRs Housing and Shelter Services Civic Organizations Political Representatives Food Assistance Services Youth Programs and Education Senior Services Fire Department and EMT Jail and Probation Services Community focus groups Flagstaff North Country HealthCare clients Winslow North Country HealthCare clients Page General Community Lake Havasu Head Start Springerville Senior Center Bullhead City American Legion Photovoice Springerville Boys and Girls Club Havasupai Youth Group
33 Quantitative Methods Concordant with the overall project, the quantitative team also used the SDOH to provide a theoretical framework for the quantitative analyses. A simple aggregation of variables into theoretical constructs was not possible because multiple data sources used for these analyses provide estimates at differing levels of discrimination. For example, some may provide state-level estimates, some county-level estimates, and others zip code or census block-level discrimination. Although this might be construed as a limiting factor, we believe that this is rather a strength of the design. For certain data sets, the team used a top-down approach by fitting variables into a SDOH framework, a priori (e.g., Behavioral Risk Factor Surveillance System), whereas analyses with different data sets (e.g., American Community Survey) employ a bottom-up approach by combining variables into respective components, statistically, that aggregate themselves into categories that would fit into the SDOH model. We also used data representing rates of disease, illness, prevention behaviors, and rates of reasons for hospital utilization as a way to show disparities and priorities in health outcomes. A unique benefit of this top-down and bottom-up design is that all variables are captured and their respective weight to the SDOH model can be examined. Negotiation of Data Use Agreements As part of this needs assessment process, the quantitative team worked to secure critical database sharing agreements with the majority of our stakeholder groups, in order to conduct deep data-dives on all of the key public health, epidemiological, and health care metrics that have been identified in both the qualitative and the quantitative elements of the needs assessment. Some publically available data sets on key health needs are valuable for assessing overall health priorities and disparities, but the team discovered that state- and even county-level data do not provide the granularity needed to address some of the unique health disparities found in northern Arizona, because some of those needs and affected populations are overshadowed by the aggregate data from the broader region and state. The team successfully negotiated a full public health data use agreement with the Arizona Department of Health Services (ADHS) and Northern Arizona University, and is now an accredited repository for all of the ADHS data sets, including birth, death, hospitalization and discharge, infectious disease, and immunization records for the entire state. The data use agreement includes the opportunity to work with third-party groups (such as hospitals, community clinics, etc.) to conduct analyses of all state health data. These data include both PHI (Personal Health Information) and PII (Personally Identifiable Information) which over time will allow us to, with appropriate IRB and HIPAA oversight, significantly refine our broader analysis of the public data sets and to identify the variability of needs across our geographical region, as well as identify the common needs that cut across the region. Access to these data will be extremely useful in many future health research endeavors at the university. The quantitative team identified several data sources that helped to create a more robust picture of health disparities and areas of greatest health need in northern Arizona. The data sources that we used in our analysis are summarized below. 17
34 Data Sources The Behavioral Risk Factor Surveillance System (BRFSS) is an annual phone survey conducted nationally through state health departments with technological and methodological assistance from the CDC. This survey is designed to assess health-related risk behaviors, chronic health, and use of preventive services. It includes all 50 states and is large enough to provide state-specific estimates for key health risks and health resources. A key strength of the BRFSS is that it uses probability sampling and thus is representative of the non-institutionalized (i.e., not in a group home, in the military, or incarcerated) adult population of Arizona. Interviews are conducted using both landline and cellular telephones. For landlines, respondents are randomly selected from all adults living in the household. Cellular telephone respondents are treated as single households. Approximately 20% of completed interviews were cell phone respondents. This sampling approach provides a less biased assessment of several health indicators relative to other data sources such as those from health care institutions or health care contacts (e.g., primary care records). Persons under 18 are excluded from the survey and data on health and chronic disease diagnoses are self-reported. 10 We used publicly available codebooks to select key health assessments corresponding to Healthy People 2020 health indicators and other national health benchmarks. 1,10 We have restricted BRFSS data from , including county identifiers. We used these data to illustrate county-specific patterns for the key BRFSS variables within Arizona. The BRFSS data fit nicely into the SDOH framework because several of the leading health indicators for Healthy People 2020 are assessed in the BRFSS. These include insurance coverage, having a usual source of care, having unmet care needs, breast cancer and colorectal cancer screening, hypertension screening, obesity, health-related quality of life, smoking, and binge drinking. We chose four key determinants available in the BRFSS data set to provide further analysis to highlight patterns and correlations between social determinants of health and priority health outcomes. These domains represent a broad set of health indicators and address stakeholder interest in comorbidity, i.e., the presence of multiple risk factors within individuals. These correlations are discussed in the Regional Health Overview, Priority Health Outcomes, Patterns and Disparities in Populations, and Social Determinants of Health sections of this report. The Arizona Department of Health Services (ADHS) Hospital Discharge database comprises a primary data source that includes records for all inpatient and emergency department (ED) visits from all Arizona licensed hospitals. These data were instrumental in conducting regional comparisons of why people from different regions go to the ED and inpatient departments. This data set includes patient information such as residence zip code, age, ethnicity, and insurance payer. Not all data were analyzed in this first project phase, but future evaluations will include analysis regarding any disparities in diagnoses according to zip code, age, ethnicity and insurance payer. These data will also allow us to analyze ED utilization patterns to understand whether non-emergency ED discharges are more closely correlated with communities that either do not have access to care or usual transportation or are lowincome or are less educated. We will use Primary Care Areas (PCAs) and zip code tracts as the major level of resolution for this data moving forward. A PCA is defined as a geographic area in which most residents seek primary health services from the same health facility. 22 This will allow a finer level of analysis than the general county and tribal level. 18
35 The Centers for Disease Control and Prevention Wide-ranging Online Data for Epidemiologic Research (CDC WONDER) is a publicly available web application that manages 20 data sources including U.S. births, deaths, cancer diagnoses, Tuberculosis, cases, vaccinations, environmental exposures, and population estimates. Understanding the leading causes of death within a geographically defined population can lend insight into health problems that are more specific to that population. To better understand causes of mortality that are unique to the six counties of northern Arizona, together and individually, we accessed the 15 Leading Causes of Death database that is part of CDC WONDER. The data are aggregated from the 57 different Vital Statistics jurisdictions in the United States over 5 years ( ). 23 Additional Data Sources A number of additional sources provided data at the county level. Although we were unable to conduct secondary analysis on this information at a granular level, these data were very helpful for comparing indicators across counties in the northern Arizona region and comparing the regional averages with statewide trends and U.S. trends. Many of these databases are compiled from other federally funded primary sources, including the U.S. Census Bureau, the Center for Disease Control and Prevention s (CDC) Behavioral Risk Factor Surveillance System (BRFSS), the American Community Survey (ACS), the National Cancer Institute (NCI), and several others. Arizonahealthmatters.org is an excellent database for researchers to identify issues impacting Arizonans. The embedded community dashboard includes 164 indicators, which are available by state and county level. This database is updated within 3 months of a new data release from data sources. 24 The Community Health Rankings database is created and maintained by the Robert Wood Johnson Foundation. This database includes 58 health indicators from a variety of sources, and the indicators correspond to a variety of focus areas including health outcomes, quality of life, health behaviors, clinical care, social and economic factors, and physical environment. The data are only available at the county level but are important for describing some key health issues in the region. The data were last updated in The Center for Disease Control Community Health Status Indicators (CDC CHSI) database includes 43 indicators that represent categories such as mortality, health care access and quality, health behaviors, social factors, and physical environment. The data were last updated in The Kids Count Data Center, created and maintained by the Annie E. Casey Foundation, contains a variety of indicators related to child and family wellbeing. Depending on the indicator, data are available at the national, state, and county level. Certain indicators are available at the zip code level in some places. Although we only used data that were available with at least county-level resolution, some important indicators used from this database included children receiving SNAP and TANF benefits, children ages 3 4 enrolled in school, adolescent suicides, and juvenile arrest rates. 27 We used U.S. Census data at the county level to gather descriptive statistics on county-level population distribution across the region, county age distribution, poverty, unemployment, rural vs. urban 19
36 populations, and veteran population. The census was last updated in 2010, although 2015 estimates are available for some indicators. 2 The American Community Survey (ACS) is conducted every 5 years by the U.S. Census Bureau. Surveys are mailed to 295,000 addresses each month. It is important to note that people are not selected, but rather addresses are selected to ensure geographic coverage. If forms are not returned, second forms are mailed, followed by telephone calls and personal visits to a subsample of non-responders and group residences. The resulting data from this ongoing survey are distributed to federal, state, and local agencies to assist in the decision-making process for allocation of nearly $400 billion in funding per year. The indicators included in this survey include population, housing, and social and economic characteristics of communities that are comparable across the country. This data set allows us to compare previous and current data and to establish a benchmark with which to compare future data and to highlight trends. 28 The Arizona Youth Survey (AYS) was administered by the Arizona Criminal Justice Council to a statewide sample of eighth, tenth, and twelfth grade students in The survey uses the Risk and Protective Factor model to assess the prevalence and frequency of youth behaviors. The questions cover topics such as substance use, gang involvement, attitudes towards family and community, safety, and prosocial behaviors. 29 The Arizona Department of Education collaborates with local school districts, the Arizona State Legislature, and the U.S. Department of Education to gather data on many indicators related to student and school performance. The Arizona Department of Health Services (ADHS) publishes statistical profiles on each primary care area in the state of Arizona. Statistical profiles of PCAs include information on demographics, health resources, and health status indicators. These profiles are updated annually. 22 Mapping and Informatics The above-mentioned approaches provide statistical rigor and comprehensive analytics. Mapping through Geographic Information System (GIS) analysis provides additional visualization of the location of health care facilities, distribution mapping of PCAs, and distribution mapping of food deserts, etc. RESULTS The results of our mixed-method inquiry are presented first via an overview of the health of the region, which includes leading causes of mortality, hospital inpatient and ED visits, priority health outcomes, and patterns of disparities among populations. The bulk of the qualitative findings are summarized and discussed using the SDOH framework and incorporating quantitative data. Issues regarding access to health care are followed by discussion of economic stability, education, and the neighborhood and built environment. The discussion of social determinants of health includes social and cultural contexts that impact health, and community strengths identified in the needs and assets assessment. Organizational barriers related to addressing health issues are also presented, along with a list of priority services and supports identified through the needs assessment. 20

37 REGIONAL HEALTH OVERVIEW One approach to understanding population health involves the assessment of health-related quality of life (HRQOL), which refers to mental and physical wellbeing as well as an individual s general health perceptions. These domains are regularly assessed in population health surveys because they mirror known racial and ethnic disparities and predict important outcomes such as health care utilization and mortality. 30 The BRFSS includes HRQOL measures and therefore provides an overall picture of the health status and resources of northern Arizona. The most global indicator of HRQOL self-rated health is assessed by asking respondents to rate their health as poor, fair, good, very good or excellent. This single item provides an integrative summary of health status and is particularly noteworthy because it predicts mortality independent of age, sex, smoking, existing disease, etc. and is more strongly related to mortality than a large number of clinical biological measures. Figure 14 shows responses aggregated at the county level for participants who rated their health as good, very good, or excellent. Figure 14. BRFSS self-rated health status. Arizona residents report good health status overall, with Apache (73%), Gila (74%), and Mohave (75%) counties having notably lower numbers of adults reporting good, very good, or excellent health status. These are large absolute differences relative to the state in general whereas Coconino County residents report the best health status (87%) of any county in Arizona. The extent to which people feel physically or mentally unhealthy is related to overall health (Figures 15 and 16). Respondents were asked, how many days in the last 30 was your physical health not good? The percentage of adults who reported 14 or more days of poor physical health (a standard definition of poor health) in northern Arizona was generally above the state average. There was a high burden of physically unhealthy days in Mohave County where, along with Apache county, a higher burden of the number of mentally unhealthy days was also observed (days when people were sad, blue, or depressed). Difficulty with activities of daily living (dressing, bathing, running errands, etc.) is strongly associated with overall wellbeing (Figure 17). These difficulties represent another substantial health burden in northern Arizona residents. Although Coconino County has the lowest percentage of adults reporting any activity limitations, elsewhere in northern Arizona the burden of difficulties is high, with a third or more of adults in Yavapai, Gila, and Apache counties reporting some difficulty and 36% of Mohave County adults reporting some difficulty with these activities. This appears to indicate one of the largest health disadvantages in the state and is a pressing health need. 21


.")
38 Figure 15. BRFSS physically unhealthy days. Figure 16. BRFSS mentally unhealthy days. Figure 17. BRFSS activity limitations. LEADING CAUSES OF MORTALITY Regional Trends Understanding the leading causes of death within a geographically defined population can lend insight into health problems that are more specific to that population. To better understand causes of mortality that are unique to the six counties of northern Arizona, together and individually, we accessed the 15 Leading Causes of Death database that is part of CDC WONDER. The data are aggregated from the 57 different Vital Statistics jurisdictions in the United States over 5 years ( ). 23 Table 4 presents the leading causes of death for the northern Arizona region. 22
39 Table 4: Leading Causes of Mortality across Northern Arizona Region: (All Ages) Leading Causes of Mortality Deaths Crude Rate Age Adjusted Rate Diseases of heart Malignant neoplasms Accidents (unintentional injuries) Chronic lower respiratory diseases Cerebrovascular diseases Diabetes mellitus Alzheimer's disease Intentional self-harm (suicide) Chronic liver disease and cirrhosis Influenza and pneumonia Nephritis, nephrotic syndrome and nephrosis Parkinson's disease Essential hypertension and hypertensive renal disease Septicemia Assault (homicide) *Rates are per 100,000 individuals. When comparing the entire United States population, 14 of 15 leading causes of death are the same. In the entire United States population, Pneumonitis due to solids and liquids (including inhalation of food, vomit, oils, essences, and other solids and liquids) is the 15 th leading cause of death, whereas the Arizona list (including three of the six northern Arizona counties: Apache, Coconino, and Navajo) includes assault (homicide). Figure 18 shows only the causes of mortality (age-adjusted rate per 100,000) that were higher in northern Arizona than in the state and the nation. See Appendix C for a complete list of leading causes of mortality at the national, state, and county level. Figure 18 shows the causes of mortality that rate higher in northern Arizona than the national and state rates
40 Causes of Mortality Higher in the N AZ Region Heart Diseases Malignant Neoplasms Chronic Respiratory Unintentional Injury Intentional Self- Harm Chronic Liver Diseases National Arizona Northern Arizona Figure 18. Mortality causes higher in northern Arizona: Age-adjusted rate per 100,000, County Trends The 15 leading causes of death are the same among Arizona and the six counties of northern Arizona, but are ordered differently. Figures 19 and 20 show the leading causes of mortality by county. It is important to note the age demographics of the county, which can affect what types of diseases are affecting community members. Gila, Mohave, and Yavapai counties have the highest rates of people over the age of 65 whereas in Navajo and Apache counties, about 30% of the population is under the age of Leading Causes of Mortality Heart Diseases Malignant Neoplasms Chronic Respiratory Unintentional Injury Diabetes Apache Coconino Gila Mohave Navajo Yavapai Figure 19. Leading causes of mortality by county
41 Leading Causes of Mortality Cerebrovascular Alzheimers Chronic Liver Diseases Intentional Self-Harm Influenza Apache Coconino Gila Mohave Navajo Yavapai Figure 20. Remaining leading causes of mortality by county. 23 CAUSES OF HOSPITAL ADMISSION AND EMERGENCY VISITS In an effort to understand health differences among the populations living in northern Arizona, when stratified by geographic differences, we analyzed the 2010 and 2014 hospital discharge databases provided by the Arizona Department of Health Services. The data sets contained more than 100 variables for every inpatient and emergency department visit made by residents of the six counties of northern Arizona, excluding visits made to Indian Health Service facilities. To better understand the clinical manifestations that are most greatly impacting the residents of northern Arizona, we used a atic approach, driven by the International Classification of Diseases, Ninth Revision, Clinical Modification (ICD-9-CM), which is a standardized list of six-character alphanumeric codes to describe diagnoses. 31 We are using this coding rather than the more recent ICD-10-CM because the majority of the data sets that we have collected fall into the same timeframe as the ICD-9-CM (until October of 2015). The ICD-9 codes are used by hospitals to categorize procedures and diagnoses for billing purposes. There are some limitations with this data set. Because diagnostic codes are not collected for research purposes, ICD-9 diagnostic codes may not capture a diagnosis accurately. ICD codes may reflect provider diagnostic practices or preferences. Providers do not always choose the codes that make it to the final billing submission. Moreover, must be diagnosed in order to be classified, and some diseases, such as hypertension, depression, and diabetes, are often under-diagnosed. Diagnosis information may not be comprehensive; for example, there is limited clinical information such as physiological measurements, test results, and data about how long someone has had a disease or condition and its severity. This data set is not linked, meaning there is no way to account for one patient making multiple hospital visits for the same condition. Each time that person visited the hospital would count as a separate data entry. However, because the use of ICD codes is increasingly commonplace, studies on code accuracy are available for a wide variety of disease and discipline specific journals. 25
42 Regional Trends To understand the larger picture of types of that most commonly affect northern Arizona residents, we divided the codes into the clinical categories shown in Table 5. For a complete list of ICD-9 codes included in each category, see the left-hand column in Table 5. To better understand the clinical manifestations that result in the greatest number of inpatient and emergency department visits, we parsed the data for the top 10 principal ICD-9 codes associated with visits. Table 6 shows the top 10 principal diagnostic codes for inpatient admissions and emergency department visits made by residents of the northern Arizona region in 2010 to any hospital in Arizona (excluding Indian Health Service facilities) according to the clinical categories of the principal diagnoses codes. These are specific diagnoses that refer to specific, not general categories as in Table 5. Table 6 also includes the total medical expenditures related to each condition. Table 5: List of ICD-9 Code Categories ICD-9 Codes Disease Category Infectious and Parasitic Diseases Neoplasms Endocrine, Nutritional and Metabolic Diseases, and Immunity Disorders Diseases of the Blood and Blood-Forming Organs Mental Disorders Diseases of the Nervous System and Sense Organs Diseases of the Circulatory System Diseases of the Respiratory System Diseases of the Digestive System Diseases of the Genitourinary System Complications of Pregnancy, Childbirth, and the Puerperium Diseases of the Skin and Subcutaneous Tissue Diseases of the Musculoskeletal System and Connective Tissue Congenital Anomalies Certain Conditions Originating in the Perinatal Period Symptoms, Signs, and Ill-Defined Conditions Injury and Poisoning V01-V91 Supplementary Classification of Factors Influencing Health Status and Contact with Health Services 26
43 Table 6: Top 10 Most Common Clinical Manifestations for Northern Arizona Residents, 2010 Inpatient Visits Clinical Category Visits Charges ICD-9 Codes Urinary tract infection site not specified Acute upper respiratory infections of unspecified site Emergency Department Visits Clinical Category Visits Charges ICD-9 Codes 5613 $24,746, Pneumonia, organism unspecified 763 $22,792, $4,330, Chronic bronchitis 486 $16,603, Live born Infants 4761 $22,148,162 V30.00 Unspecified 465 $37,544, septicemia Other chest pain 4612 $45,954, Acute pancreatitis 411 $13,825, Headache 4377 $13,553, Cardiac 366 $9,911, dysrhythmias Unspecified otitis 4357 $2,949, Other chest pain 348 $9,394, media Abdominal pain unspecified site 4313 $20,900, Acute kidney failure, unspecified 322 $13,114, Pneumonia, organism unspecified 4023 $51,599, Urinary tract infection site not specified Acute pharyngitis 3933 $3,378, Subendocardial infarction initial episode of care Unspecified chest pain 3691 $21,534, Cerebral artery occlusion unspecified with cerebral infarction 310 $8,527, $24,982, $11,758, County Trends The discharge data from all hospitals from 2010 and 2014 show very similar patterns in reason for inpatient admission across the region. For a full list of the top 15 diagnoses for inpatient admissions and ED visits by county, please see Appendix D. The ICD-9 categories with the highest percentages were injury and poisoning at 20 22%, ill-defined at 12 18%, and respiratory at 10 15%. Digestive were in the 6 8% range and musculoskeletal were in the 6 9% range. In Apache County, 15% of admissions were classified as respiratory and the rate for all other counties was 10%. In Coconino County, mental disorders were the highest at 6% and in 2014 the percentage rose to 8%. All other counties ranged from 2% to 4%. In Yavapai County, musculoskeletal disorders were the highest at 9% and all other counties ranged from 4% to 7%. The most common reasons for ED visits were also very similar across the counties. Over the same time period, injury and poisoning as well as respiratory were the top two reasons for the ED visit. In most counties, 27
 as a more granular geographically")
44 musculoskeletal or digestive took the number three spot, but in Coconino County the third highest rate was mental disorders. Primary Care Area Trends Because there is a high degree of demographic variability in communities within the county boundaries, we used primary care areas (PCAs) as a more granular geographically defined category. Again, a PCA is defined as a geographic area in which most residents seek primary health services from the same health facility. 22 Figure 21 shows the 26 PCAs in northern Arizona. Figure 22 shows ED and inpatient visits per 10,000 residents living in a primary care area in 2014, calculated from the hospital discharge data. The values representing the height of each bar were determined by dividing the total number of visits per primary care area by the number of residents living in that primary care area, and then multiplying by 10,000 to get a crude rate. Because this is a rate of visits, instances where the rate per 10,000 people exceeds 10,000 indicates the prevalence of individuals visiting the hospital multiple times. Sometimes one individual could have dozens of visits to the hospital in a given year. Again, this does not include visits to IHS or all Tribally-governed facilities. Figure 21. Map of primary care areas in Arizona
45 Visits per 10,000 residents Colorado City ShowLow Williamson Primary Care Areas* San Carlos Apache Inpatient and Emergency Department Visits rates per 10,000 residents Winslow Navajo Nation Prescott Valley Hopi Snowflake/Heber Cottonwood/Sedona Flagstaff Lake Havasu City Bullhead City Payson Prescott Globe Page Kingman Black Canyon City SpringervilleEager White Mountain Golden Valley Chino Valley Hualapai Tribe Figure 22. Hospital visits per 10,000 residents living in a primary care area in Does not include Grand Canyon Village PCA. PRIORITY HEALTH OUTCOMES OF COMMUNITY MEMBERS Priority health outcomes include what illnesses and are of highest concern, discussed here from both a quantitative and qualitative perspective. In some cases, similar priorities are identified through both the qualitative and quantitative data. There are also some instances where priorities were identified by community members but were not the most prevalent heath issues according to county data. There could be a number of reasons for these differences, which are discussed. Substance Abuse and Behavioral Health Issues According to the qualitative data, substance abuse is perceived by many community members as one of the leading health priorities across the region. Participants frequently noted that substance abuse problems are often a cause of, as well as an outcome of, many broader health and social problems such as low educational attainment, poverty, unemployment, depression, and other mental and physical health issues. Not only does alcohol and substance abuse lead to chronic illnesses such as kidney disease, liver disease, and heart disease, but it is also a factor in many fatal injuries. As noted previously in this report, unintentional injury (accidents) was ranked in the top three leading causes of death for the region broadly, and was the number one leading cause of death in Apache County. Alcohol abuse was the most prevalent concern but abuse of prescription drugs, methamphetamines, and heroin was also a major concern in many communities. Participants said that either alcohol or substance abuse was a factor in almost 100% of sexual assaults and suicide attempts at the time of the 29

. This is slightly lower than the 2015 U.S. median of 16.")
46 act. Substance abuse was also seen as a key factor in domestic violence and child neglect, both of which are discussed further later in this report. Participants perceptions of the causes and effects of high rates of substance abuse and its social impacts are discussed in various sections throughout this report. Two behavioral leading health indicators in the BRFSS data set are tobacco use and alcohol use, particularly binge drinking (Figures 23 and 24). About 15% of Arizona adults report binge drinking (consuming five or more alcoholic drinks in one sitting for men and four or more for women). This is slightly lower than the 2015 U.S. median of 16.3%, with Coconino County the highest at 19%. Statewide, 16% of adults are current cigarette smokers with substantially higher rates in Mohave (23%), Gila (23%), and Yavapai (19%) counties. The national average for cigarette smoking was 17.5% in These are areas of particular concern because tobacco use is the largest preventable health risk behavior. Figure 23. BRFSS binge drinking by county. Figure 24. BRFSS smoking by county. Figure 25 summarizes data from the Arizona Department of Public Safety crime reports. The graph shows substance abuse related to adult arrest rates per 1,000 people. These figures were created by averaging the total adult (over 18) arrests in Most counties were at or below the state average for DUI arrests and marijuana possession, with the exception of Coconino County. Only Apache and Coconino counties were below the state average for arrest for possession of other dangerous narcotics, whereas Mohave County was more than 5 times higher than the state average. Mohave and Navajo counties were almost 1.5 times higher than the state average for liquor law violations, and Coconino County was more than 3 times higher. 33 According to data from the Arizona Youth Survey, the most commonly used substances among twelfth graders are alcohol, cigarettes, and marijuana. In five of the six counties, the percentage of students using cigarettes at least once by twelfth grade was above the state average. The percentages ranged from 41.6% in Gila and Navajo counties to 35.9% in Yavapai County. The state average for this indicator is 38.3%. 29 Figure 26 shows the percentage of twelfth graders who have used either alcohol or marijuana in the 30 days prior to taking the survey. These data are from Coconino County reported the highest rates of alcohol and marijuana use, whereas Apache County reported the lowest. The other four counties were fairly consistent with the state average
47 Substance Abuse Related Adult Arrest Rates (per 1000 people) Apache Coconino Gila Mohave Navajo Yavapai Liquor Law Violation DUI Marajuana Possession Other Narcotics Possession Figure 25. Regional substance abuse related arrest rates by county. 33 Calculated using data in Arizona crime reports from 2015 and 2015 Census population estimates. Past 30 Days Substance Use (12th Grade) 60.00% 50.00% 40.00% 30.00% 20.00% 10.00% 0.00% Apache Coconino Gila Mohave Navajo Yavapai State Average Alcohol Marijuana Figure 26. Alcohol and marijuana use by twelfth graders. 29 The other most commonly used substances included prescription opioids, over the counter drugs, prescription tranquilizers, and prescription stimulants. Inhalants, hallucinogens, ecstasy, methamphetamines, and heroin were also reported but at rates much lower than other more common substances. 29 For these substances, Coconino and Gila counties were significantly higher than the state averages, and Apache County was again lower. The other three counties were fairly consistent with state averages. 29 See Figures 27 and
48 Past 30 Days Substance Use (12th Grade) 15% 10% 5% 0% Apache Coconino Gila Mohave Navajo Yavapai State Average RX Opioids RX Tranquilizers RX Stimulants Over the Counter Drugs Figure 27. Other types of substance use by twelfth graders, prescription drugs. 29 Past 30 Days Substance Use (12th Grade) 15% 10% 5% 0% Apache Coconino Gila Mohave Navajo Yavapai State Average Methamphetamines Inhalants Heroin Synthetic Drugs Figure 28. Other types of substance use by twelfth graders, non-prescription drugs. 29 Despite the qualitative data pointing to substance abuse as a major concern for northern Arizona, the self-reported quantitative data largely point to substance use rates either at or below the state average among the general population. The only groups with elevated rates of substance use were young people in Coconino and Gila counties. These discrepancies could be due to the fact that the quantitative data set relies on self-report and it is possible that people could under-report their personal substance use. Also, the outcomes of substance abuse are palpable within families and communities; this is likely why this was a main topic of the health priority discussion among participants in the qualitative part of the study. Participants felt that substance abuse is often an underlying factor in other priority behavioral health issues including unintentional injury, depression, suicide, domestic violence, and sexual assault. Many 32
49 participants discussed suicide as a priority community health issue, especially among young people (Figure 29). According to the CDC WONDER data, suicide was ranked as the eighth leading cause of death for the region as compared to the tenth leading cause of death in the United States. All six counties had higher age-adjusted rates of suicide compared to the U.S. rate. Northern Arizona also shows higher rates of unintentional injuries (accidents) resulting in fatalities (Figure 30). Participants identified this as related to substance use. Rates are particularly high in Apache and Navajo counties. 23 Apache Coconino Gila Mohave Navajo Yavapai United States Northern Arizona Age-Adjusted Suicide Rate by County (per 100k people) Figure 29. Suicide rates by county. 23 Apache Coconino Gila Mohave Navajo Yavapai United States Northern Arizona Age-Adjusted Unintentional Injury Rate by County (per 100k people) Figure 30. Unintentional injury rates by county
50 Figure 31 describes the distribution of age at the time of suicide, suicide attempt, or self-inflicted injury among northern Arizonans in Time of suicide, suicide attempt, or self-inflicted injury is identified from ICD-9 diagnostic codes from the Arizona Department of Health Services Hospital Discharge Data. These codes do not distinguish between patient encounters that resulted in death or any degree of recovery. For additional histograms showing age distributions by county, see Appendix E. Suicide rates ranged from 1.0 to 2.3 suicides per 1,000 residents. The rate was highest in Navajo County and lowest in Apache County (see Appendix E). Most suicides for all counties were attempted by residents younger than 38 years of age. The age of suicide attempters was highest in Mohave and Yavapai counties; 31 34% of all suicide attempts in these counties were carried out by residents older than 48 years of age. Ages were youngest in Navajo and Coconino counties, where 16 17% of all suicide attempts were carried out by residents younger than 18 years of age. In Coconino County almost 40% of all suicide attempts were carried out by residents younger than Percent Age at Hospital Visit Figure 31. Age at time of hospitalization for suicide, suicide attempt, or self-inflicted injury in northern Arizona (2014)
51 Population-Specific Information Veterans were seen as more susceptible to mental and emotional health issues. Many members of the veteran community spoke about high rates of mental illness. Respondents reported that PTSD was a major problem that often goes unrecognized and untreated. This leads to increases in self-medication through substance abuse and higher rates of suicide. Alcohol and substance abuse was the number one priority health issue among American Indian community members (identified by AI community members themselves as well as other stakeholder groups). Many discussed the devastating impacts that parental substance abuse has on the family unit and also noted a rise of young people under the influence of drugs and alcohol. Many discussed the relationship between substance abuse and high rates of domestic violence, sexual assault, neglect, and emotional abuse that affects children and elders. Alcohol, prescription drug abuse, methamphetamine, and heroin were the substances of highest concern. High rates of depression and problems coping with anger were also a common concern, especially among young people. I think domestic violence and sexual assault are closely related to substance abuse. About 40% of the women that come to the shelter are Native. Of that 40%, about 25% are fleeing domestic violence on the reservation. Of the women that I work with, somewhere between 50 90% have experienced some form of sexual assault. (Interview Participant) They also commonly noted the tendency of alcohol and substance abuse to co-occur with other mental health issues, as well as physical health issues for both the drug user and his or her family. Young parents now are struggling with that because some of em are not able to finish school. Maybe because they have issues at home with their, you know, like alcoholism, drugs, child abuse, sexual abuse. I mean, a whole range. And that kind of cycles into, you know, people using drugs and alcohol and all those kind of stuff. And then the parents, we kind of disappear on them. So the kids are basically raising themselves. And so now, I think we re seeing the effects of that. (Focus Group Participant) Participants explained that things like poverty, unemployment, geographic isolation, inadequate access to behavioral health care, and other social determinants of health create a cycle of perceptions of helplessness and hopelessness that are perpetuated by and then contribute to violence, depression, suicide, and substance abuse. Participants perceptions of the causes and effects of high rates of substance abuse are discussed in various sections throughout this report. Chronic Health Conditions of Concern Concerns regarding chronic were consistent across the region, with diabetes, heart disease, obesity, and respiratory at the top of the list of concerns from the qualitative data. The BRFSS data also confirm high rates of diabetes and other cardiovascular in the region. The percentage of people who have had a heart attack is generally small in Arizona although somewhat higher percentages are found in northern Arizona. Stroke prevalence is also low, ranging from 2% in Apache County to 5% in Mohave and Gila counties. In contrast, cardiovascular risk factors, such as high blood pressure and diabetes, are much higher in Mohave, Yavapai, Gila, Navajo, and Apache counties 35


52 (Figures 32 35). Figure 32. BRFSS high cholesterol by county. Figure 33. BRFSS prior heart attack by county. Figure 34. BRFSS diabetes by county. Figure 35. BRFSS high blood pressure by county. The high absolute prevalence of diagnosed hypertension in northern Arizona suggests a strong need for secondary prevention, in part because diagnosed high blood pressure is likely to underestimate the true prevalence of hypertension and because of the strong association of blood pressure with heart disease and stroke. Diagnosed high cholesterol, another potent cardiovascular risk factor, varies substantially across counties, with 26% reporting high cholesterol in Apache County and 46% in Mohave. These estimates are expected to be lower than the true prevalence because diagnosis requires both screening and correct recall of screening results. Overall, there is a high burden of cardiovascular disease risk concentrated in Mohave County. We need additional examination of the extent to which these risk factors are successfully controlled. Analysis of the existing county and hospital health needs assessments revealed very similar health outcome priorities. Rates of STDs and STIs were included in many CHNA priorities and were also mentioned by interview or focus group participants. Alzheimer s disease, cancer, and stroke were also identified as areas of concern in many of the county CHNAs as well as through the qualitative data collected during this assessment. Death rates from cancer are perceived to be particularly high due to the prevalence of late diagnosis and late treatment and the reality that for many people, cancer specialists are not available locally and are unaffordable. Community members also felt that in some 36
53 areas, exposure to a particularly high level of environmental contaminants was linked to rising rates of cancer as well as respiratory ailments such as asthma, COPD, pneumonia, and Alzheimer s disease. These could be especially prevalent because in many rural areas, the average age of the population is increasing. Most participants also discussed dental problems as being a priority health issue for both children and adults. Preventative care is very minimal and simple dental problems often go untreated, leading to more serious health. Population-Specific Information Stakeholders also discussed priority health status concerns among specific populations including veterans and the American Indian communities. The average age of veterans in many communities is around 60. Veterans of the Vietnam War may have been exposed to toxic substances, which could create chronic health problems (cancer especially) and many are concerned that they are not getting the care they need to treat or manage these. Concerns among the American Indian (AI) communities were very similar to the concerns of the general population across northern Arizona. Diabetes and heart disease, along with associated and complications, were at the top of the list. Many people suffer from heart and kidney that stem from unmanaged or advanced stages of diabetes. There was also a concern about the high level of amputations that could be avoided with proper management of diabetes. Many AI participants were also concerned with rising rates of cancer. PATTERNS AND DISPARITIES IN POPULATIONS We asked participants to identify particular populations that are disproportionately affected by illness. Participants discussed specific and unique challenges for rural communities, American Indian and Hispanic populations, young people, individuals with disabilities, veterans, and older adult populations across the region. Table 7 summarizes the specific populations and their unique health challenges, as identified by participants. Health Patterns and Disparities in Rural vs. Urban areas Many residents of the northern Arizona region live in very rural and remote areas and often lack basic utilities such as running water, electricity, and phone/internet service. There are few services in remote rural areas and transportation is a common barrier to seeking services and resources. Participants felt that more support services are needed for seniors who are homebound or have little access to transportation. We live in one of the the poorest counties in the nation. We have people who live out, off grid. They don't have running water. They don t have toilets, anything like that. And these are the people that I see on a regular basis. (Focus Group Participant) People don t have laptops and Internet to apply for assistance services AHCCCS and Food stamps. All DES offices are closed closest one is in Show Low that can be 100 miles round trip can t buy fuel if they can t buy food. (Interview Participant) 37
54 Population Table 7: Populations Uniquely Affected by Health Challenges Unique Health Challenges Homeless and Transient Aging Adults People with Severe Mental Illness Rural Population American Indian Hispanic Veterans Youth Individuals with Disabilities Lack of affordable housing means less money to spend on other resources. High levels of stress due to instability which contribute to other health problems. Lack of wrap-around shelter services that help people get back on their feet. Lack of community support services for the homebound. Lack of social support services to help with social isolation and depression. Lack of advocates to help seniors navigate the health care/social service application successfully. Lack of supported group housing. Lack of behavioral health treatment services. Lack of access to timely screening services. High rates of substance abuse, homelessness, and social insecurity. Lack of prioritization of treatment over incarceration. Lack of opportunities for education and employment and high rates of poverty. Lack of proximal providers and specialty services. Lack of transportation. Lack of Internet connectivity. Lack of access to utilities, infrastructure, and nutritious foods. Lack of opportunities for education and employment. High rates of transiency leads to fragmented care. Historical trauma as basis for many disparities. Lack of cohesiveness between IHS, 638, and off-reservation health care s. Lack of incorporation of American Indian concepts of health and wellness into Western medical. Fear and discrimination discourages use of available services. Language barriers make it more difficult to navigate health care. Inconsistencies and barriers with the VA health care. High rates of PTSD and other mental health issues with little access to behavioral health care. Lack of access to community engagement opportunities. Limited resources for recreation. Lack of education and awareness about health prevention topics. Lack of proximal providers and services. Lack of transportation. Social isolation. 38
55 Problems stemming from lack of specialists, difficulty with provider retention, and distance to primary care facilities are much worse in the most rural communities. Providers are drawn to more urban areas where pay is higher and there is more to do socially. Small rural populations cannot support specialty services. The lack of providers in rural areas is exacerbated by lack of public transportation, lack of employment opportunities, and lower access to basic utilities and infrastructure. The problem with living in a small town is that you don t always have what you need right here close. So the people that I work with, I m finding they have to travel a long ways to get help with DES or whatever. Our DES office was closed for a while so in order to get food stamps, they had to travel to Show Low to get their fingerprints done. Which a lot of our clients cannot travel. It s just hard not to be able to have all the services that you need close by. (Focus Group Participant) As noted earlier in this report, most of the land area in northern Arizona region consists of very rural areas (Figure 36). Apache County has the highest proportion of rural residents at 74% (defined as those living in communities of fewer than 2,500 people), followed by Navajo County at 54%. All counties contain at least one urban cluster (at least 2,500 people), but half of the counties contain no urban areas at all (more than 50,000 people). The health needs and concerns of the most rural areas in the region can be much different from urban communities with more access to health and social services, transportation, and more opportunities for productive and engaging social outlets. That being said, even though many of these services and opportunities are available in urban areas, affordability, transportation, and other social barriers still exist that inhibit people from accessing them. 2 Population of Rural vs Urban by County 80% 70% 60% 50% 40% 30% 20% 10% 0% Apache Coconino Gila Mohave Navajo Yavapai Urban Area Urban Cluster Rural Area Figure 36. Regional population distribution by county. 2 39
56 We used the ADHS discharge data to observe patterns in hospital discharges among rural and urban populations. As discussed above, hospital discharge information is problematic for a number of reasons. Briefly, because diagnostic codes are not collected for research purposes, ICD-9 diagnostic codes may not capture a diagnosis accurately. Providers do not always choose the codes that make it to the final billing submission. Moreover, must be diagnosed in order to be classified, and some diseases such as hypertension, depression, and diabetes are often underdiagnosed. This data set is not linked, meaning there is no way to account for one patient making multiple hospital visits for the same condition. Each time that person visited the hospital would count as a separate data entry. We described the top 20 ICD-9 diagnosis codes for inpatient admissions and emergency department visits for each zip code included in the urban/rural classification. We were able to identify patterns of ICD-9 discharge codes in rural and urban areas (described below). The definitions used here to determine rural vs urban areas and the degree of rural remoteness is more complex than those used in the U.S. Census (shown in Figure 11). For the following analysis, we used two different classifications to determine the level of geographic remoteness for each aggregation level. For the first, we used zip code level discharge data. The U.S. Census Bureau uses the term Frontier and Remote (FAR) to describe areas that have some combination of low populations and high geographic remoteness. To capture variation in differing degrees of remoteness and access to goods and services, the Census uses four levels of designation to delineate these differences. 34 Each zip code is classified as Urban (not colored) or Rural. If the zip code is rural, it is further classified as Level 1, 2, 3 or 4. Level 1 FAR describes an area with a relatively high population and relatively easy access to high-level goods and services such as advanced medical procedures or regional airport hubs. Level 4 FAR more closely describes an area with a much smaller population with more difficult access to goods and services such as grocery stores, gas stations, and basic health care services. Each level is defined in relation to the time it takes to drive to the outer edges of the nearest urban area. Figure 37 shows a map of zip code areas in northern Arizona according to their rural code designations. Areas in white are not designated as rural. The lightest blue indicates Level 1 and the darkest blue, Level 4. It should be noted that most of the Level 3 and 4 FAR regions correspond with tribal reservation lands. To further explore the relationship between degrees of FAR and health outcomes in northern Arizona, we would need to include tribal health data. Rural Level 1 Areas with up to 50,000 people that are 60 minutes or more from an urban area of 50,000 or more people. Rural Level 2 Areas with up to 25,000 people that are 45 minutes or more from an urban area of 25,000 49,999 people and 60 minutes or more from an urban area of 50,000 or more people. Rural Level 3 Areas with up to 10,000 people that are 30 minutes or more from an urban area of 10,000 24,999 people, 45 minutes or more from an urban area of 25,000 49,999 people, and 60 minutes or more from an urban area of 50,000 or more people. Rural Level 4 Areas that are 15 minutes or more from an urban area of 2,500 9,999 people, 30 minutes or more from an urban area of 10,000 24,999 people, 45 minutes or more from an urban area of 25,000 49,999 people, and 60 minutes or more from an urban area of 50,000 or more people

57 Figure 37. Map of foreign and remote levels by zip code. In general, the top ICD-9 diagnostic codes for inpatient admission across all five classifications were very similar. Respiratory and ill-defined signs and symptoms accounted for a large percent of the top 20 in all five urban/rural classifications. Common respiratory included upper respiratory infections, pharyngitis, pneumonia, respiratory failure, asthma, and bronchitis. Ill-defined signs and symptoms commonly included headache, chest pain, abdominal pain, syncope, and vomiting. Genitourinary were also common and mostly consisted of urinary tract infections. In the Rural Level 4 category, alcohol abuse was the number two code in 2010 and the number one code in 2014, accounting for 3% of all inpatient admissions in those years. Injuries were fairly consistent across the geographic categories. Percentages in Figures represent percent of total admissions in the top 15 diagnoses. Abbreviations for the figures are as follows: Ill-Def: Ill-defined signs and symptoms Resp: Respiratory Genit: Genitourinary Injury: Conditions related to injury and poisoning Mental: Mental Circ: Circulatory Digest: Digestive Endo: Endocrine and metabolic disorders 41
58 2010 Inpatient Admissions 50% 45% 40% 35% 30% 25% 20% 15% 10% 5% 0% Urban Rural 1 Rural 2 Rural 3 Rural 4 Ill-Defined Resp Genit Injury Mental Figure 38. Top disease categories for inpatient admissions: urban/rural, Inpatient Admissions 50% 40% 30% 20% 10% 0% Urban Rural 1 Rural 2 Rural 3 Rural 4 Ill-Defined Resp Genit Injury Mental Figure 39. Top disease categories for inpatient admissions: urban/rural,
59 2010 ED Visits 50% 40% 30% 20% 10% 0% Urban Rural 1 Rural 2 Rural 3 Rural 4 Resp Circu Genit Digest Endo Mental Figure 40. Top disease categories for ED visits: urban/rural, ED Visits 50% 45% 40% 35% 30% 25% 20% 15% 10% 5% 0% Urban Rural 1 Rural 2 Rural 3 Rural 4 Resp Circu Genit Digest Endo Mental Figure 41. Top disease categories for ED visits: urban/rural,
60 There were also many similarities across rural classifications for Emergency Department (ED) visits. For all levels of geographic remoteness, circulatory and respiratory made up the majority of the top 15 diagnoses. The respiratory were similar to those of the inpatient diagnoses. Common circulatory included atrial fibrillation, subendocardial infarction, artery occlusion, heart failure, and pulmonary embolism. Digestive were also common in the top 15 ED diagnoses. This category most commonly included pancreatitis but also gastroenteritis and colitis. Digestive disorders occur in Rural Level 2 areas more frequently than in Urban and Rural 1 areas. They were more frequent in 2010 than in Alcohol withdrawal appears in the top 15 diagnoses in 2010 and 2014 only in Rural 3 areas. Also in Rural 3 areas, Type 1 diabetes appears in the top 15 diagnoses in 2014 but not in Type II diabetes appears in Rural 4 areas in 2010 and Rural 1 and 3 areas in In Figures 40 and 41, endocrine disorders correspond to diabetes, and mental disorders to alcohol abuse. For a complete list of the top 15 diagnoses per category, see Appendix F. For the second characterization of rural and urban, we looked at PCA-level discharge data (see Figure 21 for a map of PCAs). We grouped the zip codes by their corresponding PCAs. ADHS categorizes each PCA as one of four potential descriptors: Urban, Rural, Frontier, or Indian. Urban PCAs are those that occur in counties with more than 400,000 people and contain Census tracts of more than 50,000 people. No PCAs in northern Arizona were designated as Urban. Rural PCAs are those that occur in counties of fewer than 400,000 people (if they do not qualify as Frontier or Indian). 22 Sixteen of 26 PCAs in northern Arizona are classified as Rural. Frontier PCAs are Rural but also have fewer than six people per square mile. Five of 26 PCAs in the region qualified as Frontier. Indian PCAs are defined as those within federally recognized tribal reservation borders. Five of the 26 PCAs are classified as Indian. The most common diagnosis codes linked to inpatient admissions were very similar across the region. Most diagnoses were related to childbirth, abdominal pain, respiratory, and injuries. Most common ED codes in Rural and Frontier PCAs were septicemia, respiratory including acute respiratory failure and chronic bronchitis, pneumonia, and heart-related. The top diagnoses for Indian PCAs included septicemia and pneumonia but diabetes-related were also high. In general, the most common diagnosis codes in PCAs designated Indian were much more likely to include codes related to chronic alcohol abuse and intoxication. These commonly included alcohol abuse, alcohol withdrawal, and acute alcoholic intoxication, and less commonly included alcoholinduced dementia and toxic effects of ethyl alcohol. Health Patterns and Disparities by Race/Ethnicity It is well documented in the literature that ethnic minorities often receive a lower quality of care and that they often suffer from greater morbidity and mortality than non-minorities The reasons for this are incredibly complex and beyond the scope of this report. Health disparities that affect any ethnic population are always compounded by a host of social, economic, political, and cultural factors that intersect in a myriad of dynamic interactions. The following section explores racial/ethnic disparities identified in the BRFSS, CDC Wonder, and ADHS Hospital Discharge databases. Additional layers of population-specific context were gathered through our qualitative methods. It is important to note that one of the major limitations of this analysis is that it does not include any data from any Indian Health Service facilities. 44
61 Racial/Ethnic Patterns in Selected BRFSS Health Indicators for Northern Arizona Despite the 5 years of combined BRFSS data, the sample sizes within county by race and ethnicity are too small to estimate health characteristics for all groups within all counties (Table 8). However, several within-county comparisons for functional limitations, mentally unhealthy days, and self-rated health met minimum statistical standards for reporting and are described here. Questions regarding high blood pressure and high cholesterol were only assessed in odd survey years. Thus, when examined with small frequencies of racial and ethnic participants, the county-level numbers for comorbid cardiovascular risk were too small to explore by race/ethnicity. There are clear disparities by race/ethnicity in self-rated health (Figure 42), but the level of disparity in perceived health status varies across county. For example, Hispanics in Apache County have the best health status in the county whereas Hispanics in Yavapai County have the lowest health status in the county and among the lowest in northern Arizona. Twenty percent more American Indian respondents living in Navajo county have high self-rated health compared to those living in Apache County. Also notable is that county-level variation is as large as variation across race and ethnicity. Thus, education and geography appear to be stronger determinants of self-rated health status than race/ethnicity. Figure 43 shows more consistent patterns for functional limitations. Non-Hispanic Whites were more likely to report some limitation relative to other social groups. Coconino County was the exception where whites and American Indians were comparable. Again, these differences are striking but are less dramatic than the prevalence of functional limitations among those with less than a high school education. Fewer data points are available to compare mentally unhealthy days across county and race/ethnicity. Generally minority groups reported more mentally unhealthy days relative to non- Hispanic Whites (Figure 44). Table 8: Number of Survey Participants by Race/Ethnicity and County, Arizona Behavioral Risk Factor Surveillance System Apache (n = 802) Coconino (n = 1,464) Gila (n = 985) Mohave (n = 2,217) Navajo (n = 951) Yavapai (n = 2,345) Non-Hispanic White Non-Hispanic Black Asian Non- Hispanic 333 1, , , American Indian Hispanic Other


62 Figure 42. BRFSS self-rated health status by ethnicity and county. Figure 43. BRFSS functional limitations by ethnicity and county. 46

63 Figure 44. BRFSS mental health by ethnicity and county. Leading Causes of Mortality: Stratification by Race and Ethnicity by County In the six counties of northern Arizona, non-hispanic Whites, Hispanic and Latinos, and American Indians comprise nearly 95% of the total population. With this in mind, we sought to better understand differences in age-adjusted mortality rates among these racial/ethnic populations in each of these counties. 23 See Appendix G for a complete list of leading causes of mortality in each county by ethnicity. A focused look within each county reveals substantial differences when county populations are stratified by race and ethnicity. In the following tables, the age-adjusted rates are for each leading cause of mortality by ethnicity. Cells are left blank when the data for that population are unreliable due to low rates or small populations. Green rates are significantly better than the county average; for all populations, red rates are significantly worse. 23 Apache County The 2015 American Community Survey estimated that there were 71,474 residents of Apache County, where 18.8% of the population is non-hispanic White, 73.5% is American Indian, and 6.5% is Hispanic or Latino. 28 In Apache County, cancer and diseases of the heart are disproportionately high in the Hispanic population and low in the American Indian population. Accidental injuries are disproportionately high in the American Indian populations and extremely low in the non-hispanic White population (Table 9). 47
64 Table 9: Leading Causes of Mortality, Apache County, Age-Adjusted Rate per 100,000 Leading Causes of Death All Populations American Indian Hispanic Non-Hispanic White Malignant neoplasms Diseases of heart Accidents (unintentional injuries) Unreliable 50.8 Chronic lower respiratory diseases Cerebrovascular diseases Intentional self-harm (suicide) Chronic liver disease and cirrhosis Unreliable Diabetes mellitus Alzheimer s disease 13.5 Unreliable Influenza and pneumonia Unreliable Assault (homicide) Coconino County The 2015 American Community Survey estimated that there were 136,701 residents of Navajo County, where 54.7% of the population is non-hispanic White, 28.3% is American Indian, and 13.8% is Hispanic or Latino. Twenty-two percent of the population lives below the poverty level. 28 There are relatively few data points for Coconino County for the Hispanic population. The American Indian population has a disproportionately high rate of accidental injury and chronic diseases of the liver, diabetes, and influenza/pneumonia, and a relatively low cancer rate. The non-hispanic White population has higher than average cancer rates and lower than average liver disease and diabetes (Table 10). Gila County The 2015 American Community Survey estimated that there were 53,159 residents of Gila County, where 63% of the population is non-hispanic White, 16.8% is American Indian, and 18.7% is Hispanic or Latino. Just over 21% of the population lives below the poverty level. 28 In Gila County, the mortality rates that were available for Hispanics were relatively low. The American Indian population has relatively low rates of cancer and heart disease but almost twice the rate of accidental injury, over three times the rate of diabetes, and over four times the rate of chronic diseases of the liver (Table 11). 48
65 Table 10: Leading Causes of Mortality, Coconino County, Age-Adjusted Rate per 100,000 Leading Causes of Death All Populations American Indian Hispanic Non-Hispanic White Malignant neoplasms Diseases of heart Accidents (unintentional injuries) Chronic lower respiratory diseases 38 Unreliable Cerebrovascular diseases Intentional self-harm (suicide) Chronic liver disease and cirrhosis Diabetes mellitus Alzheimer s disease Influenza and pneumonia Parkinson s disease 9.9 Unreliable Assault (homicide) Table 11: Leading Causes of Mortality, Gila County, Age-Adjusted Rate per 100,000 Leading Causes of Death All Populations American Indian Hispanic Non-Hispanic White Malignant neoplasms Diseases of heart Accidents (unintentional injuries) Chronic lower respiratory diseases 63.5 Unreliable Unreliable 70.8 Cerebrovascular diseases 37.9 Unreliable Unreliable 36.2 Intentional self-harm (suicide) 31.4 Unreliable Unreliable 31.6 Chronic liver disease and cirrhosis Unreliable 22.4 Diabetes mellitus Alzheimer s disease Influenza and pneumonia Parkinson s disease Assault (homicide)
66 Mohave County The 2015 American Community Survey estimated that there were 204,737 residents of Mohave County, where 77.5% of the population is non-hispanic White, 3% is American Indian, and 16.2% is Hispanic or Latino. Just over 17% of the population lives below the poverty level. 28 In Mohave County, both Hispanic and American Indian populations have lower than average rates of cancer and heart disease. Again the American Indian population had about twice the average of accidental injury and three times the rates of chronic disease of the liver. The Hispanic population had almost half the rate of chronic lower respiratory diseases (Table 12). Navajo County The 2015 American Community Survey estimated that there were 107,656 residents of Navajo County, where 42% of the population is non-hispanic White, 44% is American Indian, and 11% is Hispanic or Latino. Nearly 31% of the population is below the poverty level. In Navajo County, American Indian and Hispanic populations had relatively low rates of cancer and diseases of the heart whereas the non- Hispanic White populations had relatively higher rates of those. Again, American Indian populations have disproportionately higher rates of diabetes, liver disease, accidental injury, and pneumonia/influenza (Table 13). Table 12: Leading Causes of Mortality, Mohave County, Age-Adjusted Rate per 100,000 Leading Causes of Death All Populations American Indian Hispanic Non-Hispanic White Malignant neoplasms Diseases of heart Accidents (unintentional injuries) Chronic lower respiratory diseases Cerebrovascular diseases Intentional self-harm (suicide) 32.8 Unreliable Unreliable 36.3 Chronic liver disease and cirrhosis Diabetes mellitus 22.5 Unreliable Alzheimer s disease Influenza and pneumonia Unreliable 17.1 Parkinson s disease
67 Table 13: Leading Causes of Mortality, Navajo County, Age-Adjusted Rate per 100,000 Leading Causes of Death All Populations American Indian Hispanic Non-Hispanic White Malignant neoplasms Diseases of heart Accidents (unintentional injuries) Chronic lower respiratory diseases Unreliable 53.3 Cerebrovascular diseases Unreliable 43.6 Intentional self-harm (suicide) Chronic liver disease and cirrhosis Unreliable 21.1 Diabetes mellitus Alzheimer s disease Influenza and pneumonia Parkinson s disease Assault (homicide) Yavapai County The 2015 American Community Survey estimated that there were 222,255 residents of Yavapai County, where 80.6% of the population is non-hispanic White, 2.2% is American Indian, and 14.4% is Hispanic or Latino. Yavapai County has the fewest number of people living in poverty, with 15.1% of the population living below the poverty level. 28 Many indicators are missing for the American Indian population in Yavapai County, but from the data we do have, it is clear that the population suffers relatively low rates of cancer and heart diseases compared to other populations in the county. The Hispanic population also had relatively low rates of cancer and heart disease as well as accidents and chronic respiratory diseases. The non-hispanic White population had slightly higher rates of cancer but was on par with other indicators (Table 14). In general, American Indian populations in our region experienced much higher rates of accidental injury, chronic diseases of the liver, and diabetes and much lower rates of cancer and heart diseases. 23 The Hispanic population tended to have relatively low rates of cancer, heart disease, and accidental injury. There was little consistency between counties in terms of what disproportionately affected this population. The non-hispanic White population consistently had higher rates of cancer and heart disease and in most counties, higher rates of chronic respiratory diseases. They also generally suffered lower rates of accidental injury, diabetes, and chronic liver diseases. Figure 45 shows the age-adjusted mortality rates for the top three leading causes of death by ethnicity. Age-adjusted county rates were averaged for each ethnic population. Heart disease and cancer were much more likely to affect the Hispanic/Latino populations and the Non-Hispanic White populations than accidents, while accidents were much more likely to affect the American Indian populations. 51
68 Table 14: Leading Causes of Mortality, Yavapai County, Age-Adjusted Rate per 100,000 Leading Causes of Death All Populations American Indian Hispanic Non-Hispanic White Malignant neoplasms Diseases of heart Accidents (unintentional injuries) 62 Unreliable Chronic lower respiratory diseases Cerebrovascular diseases Intentional self-harm (suicide) Unreliable 34.8 Chronic liver disease and cirrhosis 15.9 Unreliable Diabetes mellitus 15.3 Unreliable Alzheimer s disease Unreliable 24 Influenza and pneumonia Unreliable 13.3 Parkinson s disease The non-hispanic White population overall had higher rates of suicide than the American Indian or Hispanic/Latino populations. Data for Hispanic/Latino were statistically too small to trust so those were coded as unreliable. The numbers for the American Indian populations in Gila, Mohave, and Navajo counties were also very small and therefore unreliable. American Indian populations have dramatically higher rates of unintentional injury and chronic diseases of the liver. American Indians overall also experienced the highest rates of fatalities due to unintentional injuries. In Yavapai County the numbers were too low to calculate reliable estimates. Rates for Hispanic/Latino were also unreliable for Apache County. See Figure 46. Another health outcome category that disproportionately affects American Indian populations is chronic diseases of the liver. Figure 47 compares age-adjusted rates in the American Indian population to rates in the total population by county. 52
69 Leading Causes of Mortality by Ethnicity (Regional Avgs) Heart Diseases Cancer Accidents American Indian Hispanic/Latino Non-Hispanic White Figure 45. Leadings causes of mortality by ethnicity. 200 Age Adjusted Unintentional Injury Rate by Ethnicity Apache Coconino Gila Mohave Navajo Yavapai American Indian Hispanic/Latino Non-Hispanic White Figure 46. Age-adjusted unintentional injury rate by county and ethnicity
70 Age-Adjusted Mortality Rates: Chronic Diseases of the Liver Apache Coconino Gila Mohave Navajo American Indian All Populations Figure 47. Chronic liver diseases in the American Indian population. Hospital Utilization for Certain Conditions by Ethnicity All inpatient and emergency department hospitalizations for residents living in the six counties of northern Arizona in 2014 were incorporated into this analysis. All visits for each clinical category were stratified into the observed number of visits for individuals self-reported to be American Indian, Hispanic or Latino, or non-hispanic White. All clinical categories, except diseases of the skin and subcutaneous tissue, had significantly different population proportions than what would be expected based on the population that visits the hospital (as opposed to the proportion of the general population). For the clinical categories of injury, poisoning, and endocrine, nutritional, and metabolic disorders, the combination of groups indicated that the racial ethnic groups were different from what was expected; no individual group was responsible for the differences; that is, the combination of all groups needed to be taken into account. Figure 48 illustrates hospital utilization rates by ethnicity for certain categories of health. In instances where the bar extends above the X-axis, that population had higher than expected utilization rates for that type of condition relative to population size. In instances where the bar extends below the X-axis, that population had lower than expected utilization rates for that type of condition relative to population size. This type of analysis can help illuminate which ethnic populations are disproportionately seeking care for certain types of. For most health condition categories, the non-hispanic white and American Indian populations utilize hospital services more than expected taking into account the proportion of the population those groups comprise. For American Indian populations, these data do not account for visits to Indian Health Service or other Tribally-governed facilities. Excluding skin and complications due to pregnancy and delivery, Hispanics utilize hospital services at a much lower rate than expected considering the proportion of the population Hispanics comprise. 54


71 Figure 48. Clinical disease categories stratified by race/ethnicity,


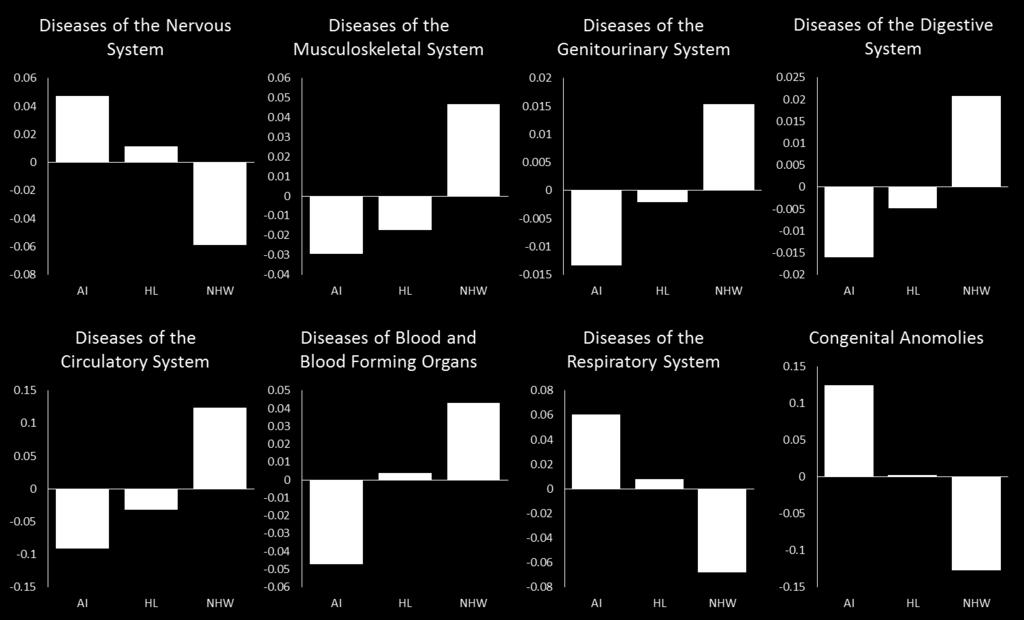
72 Figure 48 (continued). 56
73 Figure 49 summarizes hospital utilization by ethnicity for each primary care area in the region. The values determining the height of each bar were calculated by dividing the total number of visits per primary care area per racial/ethnic groups by the number of residents of that racial/ethnic group living in the primary care area, and then multiplying by 10,000 to get a crude rate. If the number of visits is greater than 10,000, the number of visits made by a racial/ethnic group exceeded the number of residents in a primary care area that comprise that racial/ethnic group. This is due to the fact that single individuals can visit the hospital any number of times in a given year. For example, if the population of non-hispanic White individuals in a primary care area was 10,000, but those individuals made 20,000 of the inpatient or emergency room visits, then the crude rate would be 20,000 visits per 10,000 non- Hispanic White residents. Data from Grand Canyon Village were not available Visits per 10,000 residents20000 Rate of Inpatient and Emergency Department Visits by PCA and Race/Ethnic Category AI HL NHW Primary Care Areas Figure 49. Hospital utilization by PCA and ethnicity, Health Patterns in Children Age 0 24 Few health data on children are consistent at the county level in Arizona. To understand what are affecting children ages 0 24, we consulted the Arizona Department of Health Services Hospital Discharge data by age group. Of note, up to 25 ICD-9 codes can be specified in a claim and the primary diagnostic code was used for the purpose of this research. The following analysis is based on data showing the 15 most common primary diagnosis codes for inpatient and emergency department visits by county. The diagnoses are categorized further by age group (less than 1 year old, 1 4 years old, 5 9 years old, years old, and years old). Each diagnosis code is classified as 1 of 18 general disease categories. We used those categories to code the top 15 diagnoses and ascertain the percentage of each disease category within the top 15 diagnoses. 57
74 Figures 50 and 51 depict the regional summaries for 2010 and Disease categories occurring among the top 15 diagnoses are summarized by age group. Percentages represent percent of total admissions. Some of the specific diseases that correspond with each category listed below vary between age groups and counties. For a complete list of the top 15 diagnoses and their corresponding disease categories by county and region, see Appendix H. 15% Regional Summary % 5% 0% <1 1 to 4 5 to 9 10 to to 24 Nervous/Senses Respiratory Ill-defined Infectious Injury Genitourinary Digestive Mental Pregnancy Figure 50. Regional summary of disease categories for top 15 diagnoses, Regional Summary % 15% 10% 5% 0% <1 1 to 4 5 to 9 10 to to 24 Nervous/Senses Respiratory Ill-defined Infectious Injury Genitourinary Digestive Mental Pregnancy Figure 51. Regional summary of disease categories for top 15 diagnoses,
75 Less than 1 Year For children less than 1 year old, the most common discharge diagnosis was birth. This category most commonly included single live birth babies born through cesarean and non-cesarean delivery as well as twin births born by cesarean section. There was relative consistency across the counties in terms of cesarean vs. vaginal deliveries. Cesarean deliveries comprised between 20% and 30% of all live births across the region. The second most common discharge diagnosis category was diseases of the respiratory. This category commonly included acute upper respiratory infections, acute bronchitis, and pneumonia. Less common diagnoses in this category were sinus infections and croup. Admissions for diseases of the nervous and sense organs were also relatively high. Specific diagnoses in this category most commonly included ear infections (90 100%) but in some counties also included conjunctivitis (pink eye). Ear Infections ranked fourth on average in the top 15 diagnoses across the counties. On average, this category comprised about 6% of total admissions for this age group in 2010 but dropped to 3% in 2014 (Figures 52 and 53). Symptoms, signs, and ill-defined typically made up 4 5% of all admissions for this age group. Specific diagnoses in this category commonly included fever, vomiting, vomiting with nausea, cough, and less commonly, diarrhea. From 2010 to 2014, the proportion of respiratory disease diagnoses decreased substantially from 25% to less than 10% in Apache County. Smaller decreases occurred in Coconino, Gila, Mohave, and Yavapai counties. 30% Age < 1 (2010) 25% 20% 15% 10% 5% 0% Apache Coconino Gila Mohave Navajo Yavapai Nervous/Senses Respiratory Ill-defined Infectious Digestive Perinatal Conditions Figure 52. Top disease categories for children less than 1 year old by county in 2010 (excluding birth). The perinatal disease category included jaundice and other unspecified. 59
76 30% Age < 1 (2014) 20% 10% 0% Apache Coconino Gila Mohave Navajo Yavapai Nervous/Senses Respiratory Ill-defined Infectious Genitourinary Endocrine/Metabolic Circulatory Figure 53. Top disease categories for children less than 1 year old by county in 2014 (excluding birth). The endocrine/metabolic condition that appeared in the top 15 diagnoses for Apache County was dehydration. The circulatory that appeared in Gila County were heart failure (n = 21) and subendocardial infarction (n = 16). 1 4 Years For the 1 4 age group, the most common disease category for hospital admission or ED visit was diseases of the respiratory. The diagnoses that comprised the majority of this category were upper respiratory infections followed by pneumonia, croup, pharyngitis, bronchitis, and pneumonia. Pneumonia was the second highest diagnoses in Navajo County but between the other five counties, averaged at about ninth. On average, ear infections ranked second in the top 15 diagnoses across the region. Ill-defined symptoms and were also common for this age group and this group included fever, nausea, and vomiting. Nausea and vomiting were in the top 15 for all six counties and on average, ranked in the middle of the list. Injuries made up about 8 11% of all admissions regionally. All specific diagnoses in this category involved some type of injury to the head, face, or neck. Injury rates were the highest in Coconino County, comprising 15 17% of top 15 diagnoses. Injuries in Apache County for this age group averaged 2% of top 15 diagnoses. Streptococcal virus was the most common infectious disease for this age group. From 2010 to 2014, noticeable decreases in the proportion of respiratory disease diagnoses occurred in Apache and Coconino counties. Similarly, nervous/sense diseases also decreased in Coconino and Mohave counties (Figures 54 and 55). 60
77 Ages 1 4 (2010) 30% 25% 20% 15% 10% 5% 0% Apache Coconino Gila Mohave Navajo Yavapai Nervous/Senses Respiratory Ill-defined Infectious Injury Genitourinary Digestive Figure 54. Top disease categories for children ages 1 4 years by county, Ages 1 4 (2014) 30% 25% 20% 15% 10% 5% 0% Apache Coconino Gila Mohave Navajo Yavapai Nervous/Senses Respiratory Ill-defined Infectious Injury Genitourinary Digestive 5 9 Years Figure 55. Top disease categories for children ages 1 4 years by county, For children ages 5 9, diagnoses classified as respiratory were the highest (35 44% of the top 15 diagnoses) followed by injuries (11% in 2010 and 19% in 2014) and ill-defined symptoms and (17% in 2010 and 7% in 2014). In 2010, although the respiratory made up 35% of the top 15 diagnoses, the rate in Apache County was 47%. The types of diagnosis that comprised these categories were very similar to those found in the 1 4 year age group. Asthma began to appear in this age group as a major respiratory diagnosis but was generally toward the bottom of the top 15. The exception to this was that asthma was the fifth top diagnosis in Apache County in 2010 and asthma with acute exacerbation was the third highest diagnosis in Navajo County in Abdominal pain appears as a diagnosis in the ill-defined category along with nausea, vomiting, and fever, common in the younger age groups. Diseases of the nervous and sense organs were still common among this 61
78 age group. Ear infections remained the top diagnosis for this category but conjunctivitis (pink eye) is also in the top 15 for most counties for this age group (Figures 56 and 57). Dissimilar from younger age groups, respiratory diseases increased among children 5 9 years old from Gila, Mohave, and Navajo counties. Infectious diseases also increased from 2010 to 2014 among this age group from Apache, Gila, Mohave, and Navajo counties. 25% 20% 15% 10% 5% Ages 5 9 (2010) 0% Apache Coconino Gila Mohave Navajo Yavapai Nervous/Senses Respiratory Ill-defined Infectious Injury Genitourinary Digestive Figure 56. Top disease categories for children ages 5 9 years by county, % Ages 5 9 (2014) 20% 15% 10% 5% 0% Apache Coconino Gila Mohave Navajo Yavapai Nervous/Senses Respiratory Ill-defined Infectious Injury Genitourinary Digestive Figure 57. Top disease categories for children ages 5 9 years by county,
79 10 14 Years Ear infections and conjunctivitis were lower for this age group but respiratory (31 34%) and injury/poisoning (28 30%) were slightly higher than for other age groups. The types of respiratory were consistent with the other age groups. Asthma was still in the top 15 but is consistently near the bottom of the list in all counties. Proportions of urinary tract infections are slightly higher in this age group than in the younger age groups and rank either fifth or sixth in each county. In Gila County in 2014, Type 1 diabetes appears in the top 15 diagnoses but with only 10 diagnosed cases. Of note is that respiratory diseases decreased substantially from 2010 to 2014 among children years old from Apache, Gila, Mohave, and Yavapai counties (Figures 58 and 59). Ages (2010) 25% 20% 15% 10% 5% 0% Apache Coconino Gila Mohave Navajo Yavapai Nervous/Senses Respiratory Ill-defined Infectious Injury Genitourinary Digestive Skin Endocrine/Metabolic Figure 58. Top disease categories for children ages years by county, The genitourinary category included urinary tract infection diagnoses only. The digestive category included colitis and gastroenteritis. Ages (2014) 25% 20% 15% 10% 5% 0% Apache Coconino Gila Mohave Navajo Yavapai Nervous/Senses Respiratory Ill-defined Infectious Injury Genitrouinary Digestive Skin Edocrine/Metabolic Figure 59. Top disease categories for children ages years by county,
80 15 24 Years Respiratory, injuries, and ill-defined were all still common in this age group. Urinary tract infections move to the top five diagnoses for most counties and asthma moves out of the top 15 for most counties. For this age group, complications or associated with pregnancy and/or childbirth begin to commonly occur in the top 15. Across the regional top 15 diagnoses, pregnancy-related accounted for 8% in 2010 and 14% in In Mohave County this rate was 21 22% and in Navajo County it was 20% in 2014 (up from 9% in 2010). In 2014 this category was the second highest reason for hospital admission in Mohave and Coconino counties (Figures 60 and 61). Mental appear for the first time in this age group. In 2010, alcohol abuse was the number one diagnosis for this age group in Coconino and Navajo counties. In 2014, the rates of alcohol abuse were relatively lower compared to other diagnoses but appeared in more counties. In Yavapai County, the mental category included anxiety and depressive disorders but not alcohol abuse. Anxiety disorder appears in Mohave and Coconino counties and depressive disorders appear in Navajo and Yavapai counties. Mental disorders were not in the top 15 diagnoses in Gila County for either 2010 or % 10% 8% 6% 4% 2% Ages (2010) 0% Apache Coconino Gila Mohave Navajo Yavapai Mental Respiratory Ill-defined Infectious Injury Genitourinary Digestive Pregnancy/Childbirth Figure 60. Top disease categories for children ages years by county,
81 Ages (2014) 12% 10% 8% 6% 4% 2% 0% Apache Coconino Gila Mohave Navajo Yavapai Mental Respiratory Ill-defined Infectious Injury Genitourinary Digestive Pregnancy/Childbirth Figure 61. Top disease categories for children ages years by county, SOCIAL DETERMINANTS OF HEALTH As described previously concerning this report s theoretical framework, the Social Determinants of Health (SDOH) model is an important framework for exploring the complex intersections between social, cultural, economic, political, and s-level influences on mental and physical health among diverse populations throughout the region. The key social determinants explored in this section are outlined in Figure 62. Many of these factors relate to the health disparities between populations discussed in the previous section. 14 Access to Health Care Social & Cultural Context Education Economic Stability Neighborhood & Built Environment Culturally Competent Care Health Literacy Quality of Care Health Insurance Provider Availability Social Cohesion Community Engagement Social Support Systems Discrimination Incarceration Graduation Rates Language & Literacy Early Childhood Education Higher Education Poverty Employment Affordable Housing Food Security Access to Healthy Food & Recreation Crime & Violence Air & Water Quality HEALTH OUTCOMES Mortality, Morbidity, Life expectancy, Health status, Functional limitations, Health-related quality of life Figure 62. Diagram depicting the Social Determinants of Health (SDOH) model. 65
82 SDOH Factor 1: Access to Health Care Healthy People 2020 has several objectives related to health care access that broadly focus on increasing the number of people with health coverage and a regular source of care, while reducing the number of people unable to obtain needed prescriptions, dental care, and health care. 1 This assessment identified access to care as a major concern requiring urgent attention in northern Arizona. Access to quality, affordable health care was the most commonly discussed priority health issue identified by all methods of qualitative data collection. The issue of access to care is complex, and several social determinants of health can serve as underlying barriers or facilitators to people being able to access the care and resources they need. Some of these barriers were direct, and are loosely defined here as the immediate barriers that prevent people from receiving care. These mainly stem from a lack of knowledge of services, lack of available services, lack of affordable and reliable transportation, inconvenient office hours, and general challenges to obtaining insurance and barriers in patterns of coverage. Indirect barriers refer to underlying social determinants, such as social, cultural, economic, and environmental barriers that inhibit people s ability to access quality care and the resources necessary to live a healthy life. Shortage of Proximal Providers and Services There is a perception of a shortage of health care providers in most of northern Arizona. One cause is the inability of local health care facilities to recruit and retain providers, especially in rural areas. Providers are often community outsiders and they do not stay long enough to get to know the community where they work. If a patient finds a provider they like and begins to develop a positive trusting relationship, when the provider leaves they have to start over with someone new. Some participants feel that the lack of continuity of providers contributes to a lower quality in care. The shortage also causes very long wait times to get appointments, and in some cases, specialty services are not available locally at all. Patients say, I had such a good relationship with my last counselor and now I have a new one that s why she came to the ER new person isn t seeing the whole picture. We need to keep staff for them to be useful. (Interview Participant) We only have [one provider] that puts a lot of pressure on them to address a lot of need. Their staff has recently turned over getting a lot of new behavioral health people who are not from this area they re not in tune to what is happening in this area yet need a few years to adjust probably won t last here that long. (Interview Participant) Many veterans were frustrated by the fact that they have to make appointments for prevention and management very far in advance because often the wait times are more than a month. It is very hard to find providers for emergency or urgent situations. Providers who are available to veterans using the VA health care are among the lowest ratios of any population. We have 8,000 veterans about 4,700 are registered with the VA here and we were doing that with one doctor and the doctor didn t speak English he used a translator. (Focus Group Participant) 66
83 Veteran participants also talked about the red tape and regulations that make it hard for them to obtain convenient quality services. Most of these barriers were related to insurance and being restricted to where they can obtain covered services. Differences in quality and availability within various veteran service centers means that often the highest quality services are not available at the closest VA location. There are veterans traveling 2 hours to receive certain services. I m a veteran and I got really sick 2 years ago. I went to the VA and they said no you have to go to the emergency room. So I couldn t afford to go to the emergency room so I went up here to the health facility. And they said we can t see you because you have VA. I offered to pay them cash and they wouldn t take it. I had to go all the way up [another] VA facility I was lucky because I had a car but think about the people that can t. (Interview Participant) Lack of Behavioral Health Providers The Arizona Department of Health Services has designated all of northern Arizona as a Mental Health Professional Shortage Area (MHPSA). Table 15 shows the ratio of mental health providers (i.e., psychiatrists, psychologists, licensed clinical social workers, marriage/family therapists, counselors, nurses specialized in mental health services, and mental health providers treating substance use) to population by county. According to County Health Rankings, the state average for the ratio of mental health providers to population is 839:1. Only Yavapai County and Coconino County averages are better than the state average. The highest ratios are in Gila and Navajo counties. Lack of access to mental health services was one of the most common issues discussed in the interviews and focus groups. Participants discussed an extreme inadequacy in the numbers of mental and behavioral health providers, especially in rural areas. The perception is that many other health and social issues are compounded because of the lack of appropriate and timely mental health care. Participants were particularly concerned about the shortage of inpatient treatment centers and outpatient support services for substance abuse issues. Table 15: Population to Mental Health Provider Ratio, County Mental Health Care Provider to Population Ratio Apache 1153:1 Coconino 543:1 Gila 1772:1 Mohave 1484:1 Navajo 1504:1 Yavapai 637:1 Arizona Overall 850:1 67
84 They come out from our place and they don t have any kind of supports around and they re right back on the street. They re right back in the in the throes of addiction. And then most likely, the law enforcement will pick em up. They could end up in jail. And then it s just a cycle. (Focus Group Participant) There are no facilities for people who want to get help. You know, they they can start it. And they say, well, I m sorry, you have to do outpatient. You know, some people just can t do it outpatient. They go to their group, and then they come home, and are surrounded by their environment. So it s really hard for individuals here. There is very little for the entire northern Arizona for people who want to better themselves. (Focus Group Participant) Participants also felt that many people would benefit from having access to outpatient counseling services that could help people manage their mental health issues and prevent people from going into crisis. Many of the behavioral health services that are available, are reserved for AHCCCs patients, those who are severely mentally ill, or people in crisis. Behavioral health is a huge area of need Change Point is the only provider and most services offered are available to AHCCCs only. (Interview Participant) If you re under 18, there are NO behavioral health services that work with private insurance or cash pay. (Interview Participant) Because mental health is a less visible health concern, many people do not see less severe mental health issues as being something that can actually be actively prevented or treated. There is little awareness and promotion of the important potential of counseling services for addressing common issues such as relationship problems, depression, hopelessness, anger, and stress. Participants discussed the connection between people not having access to the resources to help manage these issues and the fact that eventually many turn to substance abuse, suicide, or other self-destructive behaviors. The stresses that people go through there are lots of single parent families them trying to go to school and deal with putting food on the table and a roof over their heads sometimes is just too much too much pressure it leads to depression and anxiety they turn to substance abuse because of the stresses. (Interview Participant) All too often, law enforcement serves as a potential liaison to needed health and mental health care services. Many community members that interact with law enforcement on a regular basis suffer from severe mental illness, chronic homelessness, or chronic substance abuse issues. Participants discussed barriers that exist in the intersection between the criminal justice and the behavioral health care that make it very difficult for law enforcement to help community members get the appropriate mental health resources they need and avoid unnecessary incarceration. 68
85 Mental health is not addressed at any level within the police department. If there s somebody who is arrested and their issue is mental health, they may be doing criminal acts because of issues that they re dealing with they just arrest and release there is no treatment or observation or referral. Those issues are never addressed. (Interview Participant) We are using the jails as de facto mental health centers which they should not be. We should not have people in jail who are there because of mental health reasons. (Interview Participant) Some law enforcement agencies in the region do see a need for reforming the way that officers interact with community members who are suffering from these issues, but they face organizational challenges in successfully implementing better long-term strategies for getting these individuals the help and resources they need to avoid future altercations and potential incarcerations. More opportunities are needed for law enforcement officers to have Crisis Intervention Training (CIT). Often, even when officers are trained in CIT, when police respond to a call and recognize that the person needs behavioral health services, they do not have the mental health resources available to make sure the person gets the appropriate help. We might only have five officers working the streets in the entire city and we find somebody that needs mental health care and we end up spending hours and hours with these people because we can t get an agency to come screen them or come help us deal with them. (Interview Participant) Nobody will come to the scene and we don t have a drop off there is no quick fix available to take someone who needs help to the people that can help them. (Interview Participant) Participants discussed organizational and regulatory issues that make this process more difficult. Staffing issues at behavioral health facilities create long response times. Individuals who are not existing patients at a behavioral health facility must be willing to seek services voluntarily. If they are resistant, there is little the officers can do besides arrest them. Individuals also have to have a medical screening before they can be accepted into an inpatient facility. Often, officers spend hours waiting in the ER with individuals to get the necessary screening. People also reported that veterans experience lack of mental health services. PTSD and other combatrelated mental and emotional issues are very prevalent in the veteran community but there is a lack of awareness about these issues. Often symptoms go unrecognized and veterans and their families are not connected to the resources they need. We have combat veterans coming home who have watched their brothers in arms die right in front of them or be wounded right in front of them. Right now the medical sciences have advanced rapidly as far as physical abilities, such as prosthetic legs and arms, they re doing great but they haven t really progressed much in the area of mental health. (Interview Participant) 69
86 Lack of Primary Care Providers Participants reported that because there are too few primary care providers, they are overloaded and as a result are providing lower quality care. It is difficult for community members to get appointments in a timely manner and when they do, they feel that the doctors do not have enough time to listen to the patients and give them the attention and information they need. Many providers are not even taking new patients. I got irritated with the doctor over there because when I had my son 9 years ago, he was really good. And now, cause he s overloaded with all these patients, it s like his work is slacking. (Focus Group Participant) When you do go try to find a doctor, they re not taking new patients if you have kids, your peds will take your newborn, but if you don t like I lost my [general practitioner] and it was almost impossible to find a new one they want to know what is pre-existing. How much work are you going to be? That s what you feel like. (Interview Participant) We seem to have an awful lot of doctors that unless you know you re gonna be sick a month in advance, and can get an appointment, it s just tough luck you might as well forget it. You re you re gonna die before you get in to see one of them. (Focus Group Participant) In the northern region of Arizona, only 23% of Primary Care Areas (PCAs) had better primary care provider to population ratios than the state as a whole (Table 16). 40 In more urban areas such as Flagstaff, Show Low, and Prescott, the ratios were lowest. Ratios were highest in the most rural and remote areas. Most tribal PCAs do not have a general hospital. According to 2016 data from the ADHS Division of Licensing Services, more than half of PCAs have no skilled nursing facilities or home health agencies. Adequacy of transportation is determined by the transportation score, which is part of the Primary Care Index. Transportation scores are based on poverty and access to a personal vehicle and not on access to public transportation, infrastructure, and distance to services. 22 PCAs with the worst transportation scores include the San Carlos Apache Tribe, White Mountain Apache Tribe, and Navajo Nation, and the best scores came from Flagstaff, Williamson, and Page. 41 According to the quantitative (BRFSS) data, only Yavapai County is above the state average for residents who self-reported that they have a usual source of care. In Coconino and Apache counties the averages are in the mid-50s, the lowest in the region. The percentages of people who visited their doctor for a routine check-up in the past year are closer to the state average. For both indicators, Yavapai and Gila counties are the highest (Figures 63 and 64). 70
87 Primary Care Area Population Pop-PCP Ratio * Table 16: Primary Care Area Resource Profile 41 General Hospital* * 71 Hospital Beds per 1,000 ppl Skilled Nursing Facilities Home Health Agencies Trans Score *** Arizona State 6,835, :1 Yes** Springerville/Eager 18, :1 Yes Page 9, :1 Yes Grand Canyon Village 10,500 1,169:1 No Flagstaff 93, :1 Yes Payson 27, :1 Yes Globe 19, :1 Yes San Carlos Apache Tribe 10,400 10,350:1 Yes Colorado City 11,000 2,200:1 No Kingman 61, :1 Yes Hualapai Tribe 1,300 1,300:0 No Golden Valley 10,900 1,100:1 Yes Bullhead City 64, :1 Yes Lake Havasu City 57, :1 Yes Navajo Nation 100, :1 Yes Hopi Tribe 12, :1 No Winslow 18, :1 Yes Snowflake/Heber 18,000 1,000:1 Yes Show Low 30, :1 Yes White Mountain Apache Tribe 13, :1 No Cottonwood/Sedona 63, :1 Yes Chino Valley 24,000 1,600:1 Yes Williamson 12, :1 Yes Prescott Valley 59, :1 Yes Prescott 50, :1 Yes Black Canyon City 13, :1 No *Number of active providers, and ratio to population of Family Practice, General Practice, Gynecology, Internal Medicine, Obstetrics and Gynecology, Obstetrics, Pediatrics (MDs) physicians, all active Osteopathic Physicians (DOs), Nurse Practitioners (NPs) and Physician Assistants (PAs) working in Primary Care (includes federal doctors). NPs and PAs are counted as 0.8 of an MD full-time equivalent. **A general hospital is defined by the Arizona Department of Health Services as a short-stay, acute care, non-federal general hospital. For a yes designation in this category, the hospital must be within a driving time of 35 minutes or less. There are 67 general hospitals in the state. ***The transportation score is determined by six indicators including % of population with annual income less than 100% of poverty line, % population over 65 and under 14, % of population with disability, % of population without a motor vehicle, and the motor vehicle to population ratio. The higher the score, the less adequate or greater the need for transportation.

88 Figure 63. BRFSS usual source of care. Figure 64. BRFSS recent doctor visit. Primary Care Access in the American Indian Community Many American Indian community members also spoke about a lack of customer service in the health care delivery. Participants spoke about a lack of empathy and compassion among some providers who serve American Indian communities. Many patients travel hours to seek services and when they are greeted with negativity, it can affect their entire health care experience and their willingness to come back for care. Many participants said that people feel disrespected by doctors and feel that their expectations of the health care are rarely met. Often, people feel like the doctors are in such a rush that they do not take time to really communicate with patients in a productive way. Long wait times for appointments at Indian Health Services (IHS) or Tribally-governed facilities are also a huge barrier for people seeking services. Patients often wait for hours to be seen. Clinics are currently shifting from a walk-in to a stricter appointment. Patients who are used to the walk-in and have little access to transportation become frustrated when they show up and are turned away or told to reschedule. There is also frustration with the lack of treatment capacity at many IHS or Tribally-governed clinics. Many people reported waiting days or weeks to get an appointment at IHS or Tribally-governed clinics only to be referred to another facility, which is often farther away. The clinic is trying to drop walk-ins. People got used to being seen whenever they went to the clinic and now they are trying to make it so that you have to have an appointment. If you re 10 minutes late you can t be seen. People aren t willing to put up with that. People can have a real problem and they just won t say because they don t feel like they will be listened to. (Interview Participant) Lack of Specialty Services The most commonly discussed specialty area that participants felt was lacking was home health care services for older adults, people with disabilities, or homebound individuals. Often, elders do not want to lose their independence or move far from their homes into assisted living facilities. The limited number of home health services, especially in rural areas and on the reservations, can be a huge barrier for individuals to get the care they need. When older adults do not have someone regularly checking in on them and helping to monitor their condition and noticing changes, their health can deteriorate very rapidly. Often older adults rely on friends and family members but that can be inconsistent and those people are often not medically trained. 72
89 We have very limited home health in our area. There is only one nurse and he comes out [here], and he won t go to our outlying areas So there s very limited resources. It s a nurse and so he can do, you know, he can do nursing things. But there is not therapy here for our area. (Focus Group Participant) American Indian community members discussed the need for more palliative care resources for elders. Often seniors have to be placed in facilities that are very far from their traditional lands and their families. Participants at the Indigenous Community Forum discussed the physical and emotional impact of being forced to leave their homes to live in remote facilities because many elders are so strongly connected to the land where they grew up. Some would rather not get the care they need than leave their homeland. Participants, especially in rural areas, are frustrated with the general lack of services that their local health facilities provide. This could mean that many people have to travel very long distances to see certain types of specialists if they could even get in to see someone at all. Sometimes the specialists are booked weeks or months in the future. The most commonly discussed needs were surgical services, lab and imaging services, and OB/GYN services. Other specialty providers that participants felt were in very short supply were oncology, rheumatology, cardiology, speech therapy, autism specialists, and pediatric behavioral health specialists. We have very limited surgeries at our hospitals so they would have to go out of town. They even have to go to Show Low to have babies. (Focus Group Participant) And then when you finally do get in to see somebody, they can t help you. I was waiting for an ultrasound and they gave it to me and found the ovarian cysts and twice they ve told me. Okay, we can t get you in until November, and it was like September. (Focus Group Participant) Lack of Dental Providers Many participants were frustrated over the lack of affordable dental care in the region. Many insurance plans do not cover dental services and only North Country HealthCare offers sliding scale services which can also be cost prohibitive. In terms of dental, unless a person has credit or can pay in full, there are no dental providers Dental for people who don t have insurance that s non-existent. It s unfortunate because then people end up in the ER and the problem is so much worse and presents as a critical pain problem or another health problem the highest cost of care. (Interview Participant) We do have AHCCCS and all these different plans, but once you reach a certain age, you know, you don t get any dental care cause I ve seen quite a few patients that are unable to eat because of their teeth, and yet they can t get dental coverage. (Focus Group Participant) According to BRFSS data, preventive oral health care, another leading health indicator, varied from 49% to 65% across counties, with only half of residents in Yavapai and Mohave counties having seen a dentist in the last 12 months (Figure 65). Table 17 shows the population to dentist ratio for each Primary Care Area in the northern Arizona region

90 Figure 65. BRFSS recent dentist visit. Table 17: Population to Dentist Ratio Primary Care Area Population to Dentist Ratio Springerville/Eager 4500:1 Page 2425:1 Grand Canyon Village 0 Flagstaff 1189:1 Payson 2518:1 Globe 9750:1 San Carlos Apache Tribe 0 Colorado City 0 Kingman 2117:1 Hualapai Tribe 0 Golden Valley 0 Bullhead City 2667:1 Lake Havasu City 2375:1 Navajo Nation 10000:1 Hopi Tribe 12000:1 Winslow 3067:1 Snowflake/Heber 2250:1 Show Low 1443:1 White Mountain Apache Tribe 0 Cottonwood/Sedona 1481:1 Chino Valley 4000:1 Williamson 7300:1 Prescott Valley 2384:1 Prescott 795:1 Black Canyon City 0 Arizona 1853:1 74

91 Distance to Providers and Services Because of the shortage of local primary care and specialty providers, community members are often forced to drive long distances to seek care. This can be a major problem considering the lack of public transportation options and the lack of affordable and dependable transportation resources, especially in rural areas. Traveling long distances for medical care also comes with additional indirect costs such as the need to take more time off from work (for many residents this time is unpaid) or more time required for paid childcare, which many people cannot afford. Limited resources traveling hours away is not an option for people unless it is unavoidable, people will opt not to go can t miss work, don t have a place to stay if it s far away. (Interview Participant) Transportation is a big part of it if you don t live in the city limits and you need that kind of support, it is literally impossible. I had a friend who broke her arm and couldn t drive and to come into town and go to her doctor s appointment and run some errands, cost her $70 in cab fees; she only lives 7 miles out of town. (Interview Participant) Insurance Coverage and Cost Barriers Having health insurance is a leading health indicator. According to BRFSS data for , more than 80% of participants reported having health insurance with modest between-county variability (Figure 66). Estimated rates of the medically insured population from other sources are 4 5% lower than the BRFSS data. In Apache County, the 2015 Census estimate of insured people is slightly lower than the BRFSS data (Figure 67). 2 It is worth noting that before 2008, 2 years before the Affordable Care Act went into effect, the average rate of insured adults in the northern Arizona region was about 15% lower than recent estimates. 2 However, analysis of BRFSS data shows that despite widespread insurance coverage, 14 16% of northern Arizona adults reported that they could not afford to see a doctor when they needed one. This is comparable to the Arizona average (Figure 68). The rate of insurance coverage for most American Indians living on reservations in the region is significantly lower than the general population (Figure 69). However, even without insurance, American Indians are eligible to receive care at IHS, Triballygoverned, or Urban Indian health facilities. Figure 66. BRFSS insurance coverage. 75
 Figure 67. Rates of insured population by county. 2 Figure 68. BRFSS couldn t see a doctor because of cost.")
92 90% 85% 80% 75% 75% 87% % of Population with Insurance 88% 88% 85% 85% 80% 80% 79% 78% 79% 85% 85% 89% 70% 65% Apache Coconino Gila Mohave Navajo Yavapai State Average % Insured Adults % Insured Children (<19) Figure 67. Rates of insured population by county. 2 Figure 68. BRFSS couldn t see a doctor because of cost. Participants discussed a variety of issues with health insurance coverage that create major barriers to accessing affordable convenient health care. Many people still do not have insurance because they do not understand the eligibility requirements and application process. Insurance is a big barrier there is a lack of understanding how to do that. Also there are quite a few people who did sign up for insurance and the premiums have increased prohibitively there is a lot of concern about that. Increased drastically. And then not knowing what other options there are getting assistance, other options for insurance. (Interview Participant) 76
93 Insurance Rates on Tribal Reservations Havasupai Hopi Hualapai Kaibab White Mountain Ft. Mohave 100% 90% 80% 70% 60% 50% 40% 30% 20% 10% 0% 61% 80% 75% 69% 74% 86% 71% 70% 86% 76% 80% Navajo San Carlos Figure 69. Rates of insured population on tribal reservations. 42 Cost is an issue even for those who have insurance due to high cost of copays, transportation, child care, and medications. Many participants also discussed the recent and dramatic rise in rates for insurance premiums. This created a sizable gap between the level of income required to qualify for AHCCCS and the ability of many working families and individuals to pay for private insurance through the health marketplace, making purchasing insurance unattainable for many people. Even with insurance, medical services can be cost prohibitive. Often, people can only afford plans with high deductibles so even though they have insurance, their out-of-pocket cost can be extremely high. This results in many people making the decision not to seek medical services unless it is an emergency. [It s hard for the] middle income people on Obama Care it s a middle gap in insurance. Those highdeductible insurance plans is all people can afford but nothing is covered. (Interview Participant) I mean, and these bills are huge. And my insurance only pays like so much. What do you do? You try not to go. If there s like a remedy you can do it yourself at home, you do it. Unless it gets really bad, then you go. (Focus Group Participant) People who do have insurance often struggle to find providers within the geographic area that are covered by their insurance because many services are not available within the care network. There are also so few providers in the care network that people do not feel like they have choices. Some of the health care facilities that are available, especially in shortage areas, prioritize AHCCCS patients due to regulations and there are few affordable local services that have space for privately insured or cashpaying patients. Some services that people need simply aren t covered by their insurance, especially dental and vision services. 77
94 Even with insurance some procedures and services are astronomical sometimes won t pay because you re out of the area but there are no services in the area. (Focus Group Participant) People s insurance won t cover like x-rays and that stuff in the hospital. It has to be done like in a lab. There s no lab in Page. So people have to go to Flagstaff to get x-rays done because their insurance won t cover it if they go to the hospital. (Focus Group Participant) Similarly, roughly 10% of adults reported being unable to fill a prescription due to cost, a pattern that was consistent statewide (Figure 70). This is particularly concerning given the high percentage of adults likely to have pharmaceutically managed chronic disease for example, high blood pressure treated with antihypertensive medication. Many participants noted that it is often very hard to get insurance companies to pay for certain medications, especially for those required to manage chronic such as high blood pressure and diabetes. Even when insurance pays for part of a prescription, the out-of-pocket cost can vary wildly and sometimes is not affordable. For many people who are struggling to make ends meet, paying for medications can mean not being able to afford food or other basic necessities. I have to take medication every single day. And I had to pay. One time I had to pay for it and I m like, oh my gosh. Are you kidding me? I couldn t pay for it. I went a week without that medication It was really stressing not having a medication that you absolutely need every day. (Focus Group Participant) So you have people coming to a senior center, getting free lunches because they can t afford to eat, who have to pay 250 dollars for insulin to stay alive. And that s crazy. That is ridiculous. (Focus Group Participant) Many participants discussed frustration with not being able to seek services because they could not afford to take the time off work. In many cases, the only services available on weekends or after working hours are in emergency rooms. In some cases, community members are choosing between taking care of themselves and their families and losing their jobs. Time off from employment and also the ability to get to a doctor after work hours. Either you can t take time off or if you can, then it s not paid time off. (Interview Participant) Figure 70. BRFSS couldn t fill prescription due to cost. 78
95 And most of us are, you know, most of the families work minimum wage. They don t have access to insurance with their employment. They don t have sick leave, annual leave. We have absolutely no daycare in town She had, what, six kids. She worked the motels. And kids will get sick. And every time she took time off to get to take care of her child that was sick, she got fired. She takes time off, she gets fired again. And four times, and then she couldn t find a job in town because she had a history of being fired. (Focus Group Participant) Clearly access to care is a complicated issue faced by many across northern Arizona. Barriers are ic, including a lack of primary care, behavioral health, and specialty providers, resulting in people traveling long distances to receive care. For some, even when they do access care, their perception is that the quality of care is poor. Additionally, despite the data showing high coverage rates of insurance, residents reported that not all services were covered by their payer or there were not enough providers included in their payer s provider network or the deductibles were too high. Difficulty with access to needed services impacts other areas of the residents lives, including ability to afford food and to maintain employment. SDOH Factor 2: Economic Stability Living in an impoverished state has been linked with poor health outcomes. 43 Healthy People includes objectives focused on reducing the proportion of people living in poverty, having difficulty affording housing, and experiencing food insecurity. Our analysis also identified these factors related to health. Poverty /Unemployment Poverty and unemployment are obvious obstacles to accessing health care services. They also contribute to other barriers discussed below such as lack of access to childcare, higher education, and adequate housing. Participants discussed the connections between poverty, unemployment, and mental health concerns such as depression and substance abuse. Some parents are working multiple jobs and have little time to spend with their families and friends. Many people have high amounts of stress because they feel like they cannot get ahead financially. The families are barely hanging on, making ends meet, working two jobs, you have kids and you re trying to do all that and when your spouse comes home you expect them to pick up the slack and they need help too. That causes family issues which increases substance abuse, domestic violence, and those issues. (Interview Participant) When parents are stretched financially, health care, especially preventive health care, quickly moves down the list of priorities. Some participants who are parents talked about not having the time or money to care for their own health because the children come first. So health becomes like a last issue too. Who s worried about your weight? Who s worried about taking your child to the clinic? You know? We don t take our children to the clinic until they re very sick. Or for immunizations. Cause we don t have the transportation. We don t have the money. (Focus Group Participant) And honestly like, we re women, so our children come first. And then whatever that s bothering you you just put yourself last. You just do because you gotta make sure these guys are okay. You forget about it and put it off and say I ll be okay You know, and then it just like leads to more serious 79
96 stuff. (Focus Group Participant) The lack of job opportunities contributes to a sense of hopelessness and helplessness. Several participants also discussed the sense of self-worth that is tied to employment. The emotional toll of being unemployed or unable to provide for your family is a major factor that affects wellbeing. This can lead to or exacerbate problems with depression, alcohol abuse, and family violence. It s so hard for people to find jobs up here. I just have I have some roommates. I have one roommate and she can t find a job. It s hard and her boyfriend doesn t have the income. And I m supporting everybody on Walmart. (Focus Group Participant) People tie self-worth and self-esteem to work when they are out of work they get depressed which feeds the cycle it is a combination of hopelessness and helplessness. (Interview Participant) I think the extreme poverty is a huge contributing factor because it works on not just financial, but on their self-esteem and their self-worth. We all do get satisfaction from work and being able to be self-reliant. And when you don t have that, it s very difficult I think on people s mental health as well. (Focus Group Participant) Figure 71 illustrates the level of poverty experienced by residents in all six counties. National estimates of poverty from Healthy People 2020 indicate that 14% of the population broadly live in poverty and 20% of children are living in poverty. All counties in northern Arizona except Yavapai were above these poverty thresholds, for the general population and for children. 28 According to the U.S. Bureau of Labor Statistics, unemployment rates in the United States have hovered around 5% since Yavapai County was close to the national unemployment rate, but other counties in northern Arizona have unemployment rates above 5% (Figure 72) % 40% 30% 20% 10% Poverty Rates by County 0% Apache Coconino Gila Mohave Navajo Yavapai State Average % of Population in Poverty % of Children in Poverty % of 65+ in Poverty Figure 71. Regional poverty rates by county
97 Unemployment Rates * Jun-11 Sep-11 Dec-11 Mar-12 Jun-12 Sep-12 Dec-12 Mar-13 Jun-13 Sep-13 Dec-13 Mar-14 Jun-14 Sep-14 Dec-14 Mar-15 Jun-15 Sep-15 Dec-15 Mar-16 Jun-16 Apache Coconino Gila Mohave Navajo Yavapai Arizona Figure 72. Trends in unemployment by county. 24 Rates averaged from January and June each year. Poverty and Unemployment in the American Indian Community In most tribal communities living on reservations, rates of poverty and unemployment are dramatically higher than in the rest of the population. On average, the tribal poverty rates are 11% higher than the county levels and the unemployment rates are twice as high on reservations. 2,42 Among the tribal reservations in northern Arizona, the White Mountain Apache had the highest unemployment rate and San Carlos had the highest poverty rate (Figure 73). 42 The presence of exacerbating structural factors including high rates of poverty and unemployment and lack of opportunities for education and job training were common for those living on and off the reservation but for those living on the reservations, these factors were perceived as more severe. These factors not only create barriers to accessing care, but they also create that make people more susceptible to mental and behavioral health issues such as depression, suicide, domestic violence, and substance abuse. Some participants discussed discrimination and racism as a social factor that exacerbates many of these challenges. Our average family cannot even afford to live here in town. They have to live with somebody else to be able to make it. And it s really hard because, you know, all that adds stress to the family unit. Separates families. And you know, the dads, you know, I don t think we always think about what the dads are pressured, you know, to be the provider. And if they can t provide for their families, their self-esteem and their hopes of being a good parent go down the hill and then they turn to drugs and alcohol. (Focus Group Participant) High unemployment and poverty rates across the region, and in particular among tribal communities, are influencing the mental health and physical health of residents. Compounding these issues is also the high cost of living and housing in the region. 81
98 Poverty and Unemployment on Tribal Reservations Havasupai Hopi Hualapai Kaibab White Mountain Ft. Mohave Navajo San Carlos Tonto Yavapai Apache Yavapai Prescott 60% 50% 40% 30% 20% 10% 0% % Unemployment % Poverty Figure 73. Tribal poverty and unemployment rates. 42 High Cost of Living and Housing High housing costs can influence home ownership levels (Figure 74). When families are spending a larger than normal percentage of their income on rent, lower-income families are often not able to procure health food, health care services, and other basic resources that facilitate health and wellbeing. 44 Participants also discussed the high cost of living in many areas as a factor that exacerbates economic insecurity. The lack of affordable housing and affordable childcare were the most commonly discussed elements of this topic. Paying a large percent of income for housing creates more financial strain on the household which can exacerbate other barriers to health care and barriers to emotional and physical wellbeing. Members of the American Indian community also discussed problems with housing on the reservations. In many communities housing is overcrowded and the structures are dilapidated. Yeah, affordable housing. And the one place I was living in had cockroaches and they wouldn t take care of it. Made my younger son get cockroaches in his ears and infections in his ears. So I just lived out of hotels for a while. (Focus Group Participant) Participants felt that homelessness is common and also is underrepresented in statistics. Many people live in their cars or in hotels, or stay for short stints with friends and relatives. These people are not counted in the homelessness statistics and the extent of the problem is largely hidden. Not having stable housing also creates a barrier to employment and applying for insurance or other social services. So many young families are considered homeless because they don t have a regular place to stay or live they go from couch to couch or are living in their cars or in motels. If you don t have that stability then sometimes you don t qualify for these benefits. It s another vicious cycle. (Interview Participant) 82

99 Figure 74. Regional home ownership by county. 10 Participants also felt that the cost of childcare is unaffordable to families. The inability to afford childcare has a huge effect on earning capacity, stress, and job performance/security. And then childcare is a huge issue. The cost of childcare. People will go days without seeking medical attention because they can t take off of work and very few doctors are open on weekends or they can t arrange for childcare and so they just go without addressing it. (Interview Participant) We have absolutely no daycare in town. Another reason why some parents can t go to work, because they have no one to watch their children. (Focus Group Participant) Besides Apache, the remaining counties are above the U.S. median for the percentage of the population with high housing costs. However, residents of Apache County reported the highest proportion of households experiencing housing stress, indicating poor quality housing (Figure 75). 25,26 Income Patterns in Selected BRFSS Health Indicators for Northern Arizona We examined disparities for four key health indicators as a function of reported household income (Figures 76 79). To ensure adequate stability of income estimates, the eight income categories were collapsed into four categories. Lower income levels are associated with a greater burden of poor mental health, with the exception of Navajo County, which shows a curvilinear association with income level. Better self-rated health status showed a positive association with income level. For each county, higher income was associated with a higher percentage of people who rated their health as good, very good, or excellent. Functional limitations were strongly related to household income, with the two lowest income categories (representing incomes less than $25,000 per year) having the greatest prevalence of functional limitations. And comorbid cardiovascular risk factors followed the expected inverse association with income levels for Mohave, Navajo, and Yavapai counties but less so for the other three. 83

100 Affordable Quality Housing Indicators 50.0% 40.0% 30.0% 20.0% 10.0% 0.0% Apache Coconino Gila Mohave Navajo Yavapai US Median % of Population with High Housing Costs * % of Population with Housing Stress ** Figure 75. Regional affordable quality housing measures by county. 25,26 *Renters or owners living in units with a mortgage spending 30% or more of household income on rent, American Community Survey averages. 28 **A house is defined as stressed if one of the following criteria is met: (1) housing unit lacks complete plumbing; (2) housing unit lacks complete kitchen; (3) household is overcrowded (more than 1 person per room; or (4) household is cost burdened (housing costs > 30% of monthly household income). 26 Figure 76. BRFSS mental health and income. 84


101 Figure 77. BRFSS self-rated health and income. Figure 78. BRFSS functional limitation and income. 85

102 Figure 79. BRFSS cardiovascular risk and income. Results of the BRFSS data analysis identified an association between income level and self-rated health, mental health, functional limitations, and cardiovascular risk factors across the region. This highlights the importance of designing programs and services to address health and wellness to be inclusive of the social determinants of health. Access to Healthier Food Diabetes, heart disease, and obesity are health outcomes related to poor nutrition and lack of exercise. This is due to both a lack of awareness and food insecurity. Many people do not have the money or time to buy and cook healthier foods or participate in recreational activities. Diabetes is often not properly managed and leads to very serious and debilitating complications. Food insecurity is an economic and social indicator of the health of a community. The U.S. Department of Agriculture (USDA) defines food insecurity as limited or uncertain availability of nutritionally adequate foods or uncertain ability to acquire these foods in socially acceptable ways. 45 There is strong evidence that residing in a food desert is correlated with a high prevalence of overweight, obesity, and premature death. 46 Supermarkets traditionally provide healthier options than convenience stores or smaller grocery stores. Additionally, lack of access to fresh fruits and vegetables is a substantial barrier to consumption and is related to premature mortality. 47 The major determinants of food security are the physical availability of healthy foods and the economic and physical ability of a person to procure healthy foods, as well as food utilization practices which include eating habits, food preparation, and household distribution of foods
103 Food insecurity and poor or limited access to affordable nutritious foods and opportunities for physical recreation were commonly described as underlying factors of many chronic health problems in all communities, especially chronic such as diabetes, heart disease, and obesity. Participants felt that limited access to healthy food is often compounded by a lack of knowledge about healthy food preparation, lack of time and capacity to prepare foods, and the higher cost of healthier foods. Participants commonly discussed high rates of food insecurity in their communities. Many families can barely afford to buy food at all, much less nutritious foods. People who do not have reliable transportation also have a harder time accessing healthy food, physical recreation, and other resources that support a healthy lifestyle. Doritos and soda is not dinner. Even when they can get good food, many don t have a way to cook it. (Interview Participant) But even having food. Like some of those kids go home, and that s the only meal they get is at your school. They don t get food at dinnertime or on weekends. (Focus Group Participant) We all know that you shouldn t eat processed foods, but when you can get five boxes of boxed mac and cheese for a buck fifty, and that won t buy you a single chicken breast, for families that are really on a tight budget, you make the choices you have to make. We either don t have food for my kids tonight or it s processed mac and cheese because at least it s calories. (Focus Group Participant) Figure 80 summarizes the percentage of the adult and child population in each county who have experienced food insecurity at some point in the last year. The figure also shows the percentage of people in each county who have low access to food. This is defined by the percentage of people who are low income and who live more than 1 mile (urban residents) and more than 10 miles (rural residents) from a grocery store. All counties have higher rates than the state average for all three indicators. Navajo and Apache counties have the highest rates of food-insecure children. Almost 45% of residents in Apache County have low access to grocery stores, in part due to the extremely rural geography of the county. 24,25,49 Figure 81 was created using the USDA Economic Research Service interactive mapper. The map shows areas based on Census tract where a significant percentage of the population is low income and/or has low access to a grocery store. The light blue indicates Census tracts with a poverty rate of 20% or higher, or tracts with a median family income less than 80% of the income for the state or metropolitan area. The pink indicates Census tracts in which at least 500 people or 33% of the population live farther than 1 mile (urban) or 10 miles (rural) from the nearest supermarket. The purple indicates tracts where all of the above are met. 49 Except for Flagstaff, much of northern Arizona s population lives far from a regular source of healthy foods, such as fruits and vegetables, which are two leading health indicators (Figures 82 and 83). Currently (2017) the national baseline is ~0.50 cup of fruit per 1,000 calories (for people 2 years and over) and the goal is to increase that to 1 cup per 1,000 calories. For vegetables, the current and targeted amounts are 0.76 and 1.16 cups per 1,000 calories, respectively. Arizona is on target for these goals, as are most northern Arizona counties. However, there are vulnerable sub-county regions without access to fruits and vegetables that merit attention. 1 87

104 Food Insecurity Arizona Yavapai Navajo Mohave Gila Coconino Apache 0% 5% 10% 15% 20% 25% 30% 35% 40% 45% 50% % of food insecure residents % of food insecure children % of low income residents who do not live near a grocery store Figure 80. Regional rates of food insecurity by county. 24,25 Figure 81. Map of regional food insecurity

105 Figure 82. BRFSS daily vegetable intake. Figure 83. BRFSS daily fruit intake. It is clear that much of northern Arizona lacks affordable housing, and ready access to healthy foods contributes to health disparities among residents. Additionally, unemployment and poverty contribute to stress and are associated with poor health outcomes. Improving educational attainment is one approach to addressing economic security. SDOH Factor 3: Education According to national data from the U.S. Census Bureau and the CDC BRFSS, people with more education are likely to live longer and experience better health outcomes. Better education confers health benefits at the individual, community, and societal level. 50 The linkages between educational attainment and health are complex. Researchers at the Robert Wood Johnson Foundation found three major interrelated pathways between educational attainment and health. First, educational attainment is linked to health knowledge, literacy, and behaviors. Second, education is linked to employment, working, work-related resources, and income. And third, education is linked to social outcomes such as efficacy, social standing, and social supports. 51 Participants discussed the lack of educational attainment and opportunities for job training and postsecondary education as factors that exacerbate all of the above-mentioned barriers. When there is less opportunity for people to get an education, develop skills and job training, and find good-paying jobs, it is very difficult to achieve economic stability and opportunity for improvement. Many people who do go to college do not take their skills back to their home communities because there are few jobs in their field and there is more opportunity in larger urban centers. Job opportunities are low and there are no job training services the jobs that are available, no one is qualified for. (Interview Participant) We re poor economically, no jobs, education levels are low, educational is marginal, half of kids graduated and only a few go on to college. (Interview Participant) 89

106 Education was also an area of concern for many American Indian participants. Many tribes are making efforts to improve educational attainment and quality, but it is a slow process. Many young people are dealing with complicated issues at home and do not have the support and the parental pressure to make sure they stay in school. Some participants felt that many young people do not see the value in education. Many parents dropped out of high school and don t try to get their GED. The kids see that and say, Oh I don t have to go to school because my parents didn t the attitude is, I don t need to do that because we can just go on assistance and live that way. (Interview Participant) Figure 84 shows rates of educational achievement by county according to the BRFSS data Apache, Gila, and Mohave counties have the highest rates of residents with less than a high school diploma and Yavapai and Coconino counties have the highest populations of college graduates. Figure 85 shows the annual dropout rates per county in northern Arizona. This indicator includes the percentage of 7 12 graders who dropped out each year. The graph depicts an average of the total percentage of dropouts for in each county and also shows the county rates in 2015 alone. 52 Figure 86 shows that American Indian students have the lowest 4-year graduation rates, followed by Hispanic students. American Indian students in Gila County are disproportionately lower than in other counties. 53 Educational Attainment by County Yavapai 13% 32% 36% 19% Navajo 13% 37% 35% 15% Mohave 25% 31% 43% 10% Gila 22% 33% 35% 10% Coconino 10% 30% 36% 23% Apache 28% 36% 24% 12% 0% 10% 20% 30% 40% 50% 60% 70% 80% 90% 100% Less than high school High school Some college College graduate + Figure 84. Regional educational attainment by county. 90
107 Annual Drop-Out Rates State Average (2015 Only) Yavapai Navajo Mohave Gila Coconino Apache 0.00% 1.00% % 3.00% average 4.00% 5.00% 6.00% Figure 85. Regional annual drop-out rates by county ( ) % 80.00% 60.00% 40.00% 20.00% 4 Year High School Graduation Rates 0.00% Apache Coconino Gila Mohave Navajo Yavapai State Average White Hispanic/Latino American Indian Figure 86. Regional on time high school graduation rates by county and ethnicity

108 Education Patterns in Selected BRFSS Health Indicators for Northern Arizona Because educational achievement is an important social determinant of health, we examined four broad health domains by level of education. These include cardiovascular disease risk factors, self-rated health, functional limitations, and mental health. These domains were also chosen to address stakeholder interest in comorbidity that is, the presence of multiple risk factors within individuals. We categorized respondents into four groups: less than a high school education, high school degree or equivalent, some college, and college graduates or higher. Education categories with fewer than 50 respondents do not provide sufficient stability for estimation and are thus omitted. As shown in Figure 87, cardiovascular comorbidity was greater among persons with lower education, although this was less evident in Gila County. The absolute magnitude of these differences was large only for Mohave and Yavapai counties. Persons with less than a high school education were more likely to rate their health as fair or poor, vs. good, very good, or excellent (Figure 88). This disadvantage decreased in a dose-response manner with educational attainment across most counties. This is consistent with national-level data from the BRFSS and other sources. Persons reporting any functional limitation (Figure 89) were also more likely to have lower education. Education gradients were not observed in Navajo County, whereas in the rest of northern Arizona having less than a high school education was associated with a substantial burden. These data show that low education is strongly associated with functional limitations and that this subgroup has 8 20% higher prevalence of limitations relative to the county average. The form of this association was threshold rather than linear. That is, categories at or above a high school education were similar to one another rather than each higher education category evincing a more desirable health profile (e.g., as seen for self-rated health judgments). Figure 87. BRFSS cardiovascular risk and education. 92


109 Figure 88. BRFSS self-rated health and education. Figure 89. BRFSS functional limitation and education. 93

110 Patterns of education-related mental health difficulties varied across county (Figure 90). Most striking is the high percentage of Apache and Yavapai residents with less than a high school education reporting 14 or more mentally unhealthy days out of the last 30. These percentages are more than twice the average of their respective counties. Although the potential sources of these difficulties are heterogeneous (problems with stress, depression, and/or emotions), this illustrates an area of health need and a domain in which additional mental health screening is warranted. Analysis of the BRFSS data thus reveals an association between education and health and wellness outcomes. Health Literacy and Awareness of Resources Participants discussed the widespread lack of knowledge about the benefits of preventative care and regular check-ups with a primary care provider. Some participants discussed a lack of awareness of the importance of diet and exercise and a lack of knowledge about strategies for chronic disease management. Most people don t see a doctor because they are scared to go or they just lack the basic health literacy and are unaware of what indicates a serious problem, the benefits of prevention, where to go for services, how insurance works wait till things get really bad before they go in. (Interview Participant) For any type of chronic illnesses that people are diagnosed with, it s just kind of, here s your diagnosis. Here s your pill. Good luck. You know, there s no education. There's no follow-up care to teach you how to live with it, how to make it better without being, you know, necessarily medication dependent. (Interview Participant) Figure 90. BRFSS mentally unhealthy days and education. 94
111 There is also a prevalent lack of awareness about where to go for certain services and the types of services that are available. Many participants expressed a desire for more information about what programs and services are available in their communities and where to go for more information about available services. Even if they wanted to seek help, no one knows where to begin. Even people who have some knowledge of the just don t know where to start there is no one intake place or non-profit organization that people really know about it s just daunting. Who do you call to ask the question of where do I go get help. (Interview Participant) Participants discussed a major lack of awareness in how to apply for insurance and social services, what the eligibility requirements and income guidelines are, and how to navigate the after the person is enrolled to receive benefits. There is a lot of misinformation out there especially in Indian Country. People don t understand that they also need to get coverage through Medicaid or the marketplace to get coverage Opportunities are there to get people covered, but people need help to understand them. (Interview Participant) For some the elderly more, it s the pride issue not knowing how because they ve never had to or not having someone who can help them apply for services or direct them don t know some of the organizations who can help them fill it out Some people are too embarrassed to even ask. (Interview Participant) Health Literacy and Awareness in Specific Populations Providers who work with a high percentage of Hispanic clients discussed specific challenges faced by the undocumented population. Many undocumented people do not have health insurance and do not know where to go for health resources that are designed to help the uninsured. There is often a general lack of knowledge about how to apply for insurance and other social services and how to navigate those s after people are enrolled. In bigger cities there are a lot of organizations that are Latino oriented and so people go there and say, Help me. Or, I have a health issue, I don t know where to go or what to do. There they get connected to other organizations and resources. We don t have that here. (Interview Participant) Sometimes insurance won t pay because you re out of the area but there are no services in the area in the Hispanic community, those are a lot of the things we don t know about don t know about rules and regulations. (Interview Participant) As was prevalent in the general population of northern Arizona, many American Indian participants felt that people lack general health knowledge and a solid understanding of certain, how they affect the body, and how they can be successfully managed. This makes it more difficult for people to employ prevention strategies, seek timely medical care, and successfully manage chronic. 95
112 [In regards to diabetes] Patients don t understand what it is. It s too complicated so it s not a personal priority at the time. They think, I m alright, I feel okay, and I ll worry about it later. They don t understand the constant management that it takes. (Interview Participant) Part of it is a lack of knowledge and understanding of the disease they know the procedures and terminology but don t fully understand the effects of it. We need to be more direct with people and give it to them in terms they understand. (Interview Participant) Residents of northern Arizona will not successfully access available health resources without additional education regarding navigation and availability of resources. Additionally, the ability to acquire adequate health knowledge would also help individuals manage their health. SDOH Factor 4: Neighborhood and Physical Environment The physical context in which populations live also influences their health and wellness. This can include the natural environment, the built environment, crime and safety, or the availability of utilities and material goods. 1 Access to Recreation Facilities The BRFSS asks a series of questions about leisure-time physical activity as part of a rotating core of physical activity questions asked every other year. These cover different types of activities along with their duration and frequency. These features are matched with typical energy expenditures for the activities to determine whether respondents meet physical activity guidelines. Physical activity is presented as a binary outcome reflecting the percentage of respondents who meet recommended weekly activity levels. Recommended levels are 150 or more minutes per week of moderate activity or 75 or more minutes of vigorous activity. Mohave County residents are slightly lower than the state average for being sufficiently active whereas the rest of northern Arizona is above the state average (Figure 91). Muscle strengthening is also an important activity with health benefits beyond aerobic activity. These include yoga, sit-ups or push-ups, and using weight machines, free weights, or elastic bands. Respondents reporting muscle strengthening activities at least twice per week were considered to meet the guidelines. Overall, northern Arizona was above the state average on muscle strengthening activities relative to the rest of the state. Mohave County, perhaps because of the older average age of residents, had fewer residents meeting physical activity guidelines. Healthy People 2020 Leading Health Indicators uses a composite of both guidelines. In northern Arizona counties, 22.3% of adults met both guidelines as ascertained with above-target percentages in Coconino, Gila, Navajo, and Apache counties. The BRFSS study indicates that despite challenges with access to recreational facilities, northern Arizonans are able to maintain an adequate level of activity. Although these figures are promising relative to national targets, physical activity could be increased and overweight/obesity is pervasive in northern Arizona (Figure 92). 96


113 Figure 91. BRFSS sufficiently active Figure 92. BRFSS meeting physical activity goals. Participants discussed reduced opportunities for engaging in healthy activities due to limited parks, sidewalks, and other recreational facilities. Perceptions about neighborhood safety also affect residents willingness to play or exercise outside. Lack of access to recreational facilities was not experienced by all residents across the region, as evidenced in Figure 93 which shows that residents of Yavapai and Coconino counties have similar access compared to the state average % 80% 60% 40% 20% Recreation/Physical Activity Access 0% Apache Coconino Gila Mohave Navajo Yavapai Arizona Average % of population with adequate access to parks or rec facilities * % of adults reporting NO leisure time for physical activity** Figure 93. Regional access to physical activity and recreation opportunities by county (2017). 25 *Access to exercise opportunities measures the percentage of individuals in a county who live reasonably close to a location for physical activity. Locations for physical activity are defined as parks or recreational facilities. Adequate access for physical activity is defined by percent of people who reside in a Census block within half a mile from a park, in urban Census tracts within 1 mile of a recreation facility, and in rural Census tracts within 3 miles of a recreation facility. **Physical inactivity is the percentage of adults aged 20 and over reporting no leisure-time physical activity. Examples of physical activities provided include running, calisthenics, golf, gardening, or walking. 97
Health System Members of the Milwaukee Health Care Partnership
 Health System Members of the Milwaukee Health Care Partnership Aurora Health Care Children s Hospital of Wisconsin Columbia St. Mary s Health System Froedtert Health Wheaton Franciscan Healthcare In Collaboration
The Guidance Center Community Health Needs Assessment
 The Guidance Center Community Health Needs Assessment Community Health Needs Assessment 1 Background The Guidance Center (TGC) conducted a Community Health Needs Assessment () in August and September,
Prevention & Treatment of Substance Abuse in Native American Communities
 Prevention & Treatment of Substance Abuse in Native American Communities Susan Gerard, Director June 16, 2005 Impact of Substance Abuse for Native American People Substance abuse is a major cause of death
COMMUNITY PARTNERS MEETING
 PUBLIC HEALTH & SYSTEMS IN ACTION COMMUNITY PARTNERS MEETING Presenter: Amy Fagan, Assistant Director of Health Date: February 23, 2017 HEALTH DISTRICT VISION HEALTHY PEOPLE, HEALTHY COMMUNITY HEALTH COALITION
Community Health Status Assessment
 Community Health Status Assessment EXECUTIVE SUMMARY The Community Health Status Assessment (CHSA) is one of four assessments completed as part of the 2015-2016 Lane County Community Health Needs Assessment
2014 Butte County BUTTE COUNTY COMMUNITY HEALTH ASSESSMENT
 2014 Butte County BUTTE COUNTY COMMUNITY HEALTH ASSESSMENT EXECUTIVE SUMMARY 2015 2017 EXECUTIVE SUMMARY TOGETHER WE CAN! HEALTHY LIVING IN BUTTE COUNTY Hundreds of local agencies and community members
2014 Healthy Community Study Executive Summary
 2014 Healthy Community Study Executive Summary BACKGROUND The Rockford Health Council (RHC) exists to build and improve community health in the region. To address this mission, RHC conducts a Healthy Community
Health Disparities Research. Kyu Rhee, MD, MPP, FAAP, FACP Chief Public Health Officer Health Resources and Services Administration
 Health Disparities Research Kyu Rhee, MD, MPP, FAAP, FACP Chief Public Health Officer Health Resources and Services Administration Outline on Health Disparities Research What is a health disparity? (DETECT)
Arizona State Data Report
 ASTHO Breast Cancer Learning Community: Using Data to Address Disparities in Breast Cancer Mortality at the State Level Arizona Department of Health Services ADDRESS: 150 North 18 th Ave. Phoenix, AZ 85007
Racial disparities in health outcomes and factors that affect health: Findings from the 2011 County Health Rankings
 Racial disparities in health outcomes and factors that affect health: Findings from the 2011 County Health Rankings Author: Nathan R. Jones, PhD University of Wisconsin Carbone Cancer Center Introduction
Nebraska Statewide Suicide Prevention Plan
 Nebraska Statewide Suicide Prevention Plan 2016-2020 This plan provides a framework to help Nebraskans work together to prevent suicide. It sets out shared strategies for suicide prevention and sets the
Results from the South Dakota Health Survey. Presented by: John McConnell, Bill Wright, Donald Warne, Melinda Davis & Norwood Knight Richardson
 Results from the South Dakota Health Survey Presented by: John McConnell, Bill Wright, Donald Warne, Melinda Davis & Norwood Knight Richardson May 2015 Overview Why the interest in South Dakota? Survey
Status of Vietnamese Health
 Status of Vietnamese Health Santa Clara County, CALIFORNIA 2011 December 12, 2011 December 12, 2011 To Whom It May Concern: To the Residents of Santa Clara County: As part of my State of the County Address
Attending to the Whole Population
 Attending to the Whole Population a population health roundtable June 29, 2016 WHO definition of health Health is a state of complete physical, mental and social well-being and not merely the absence
Table of Contents. 2 P age. Susan G. Komen
 RHODE ISLAND Table of Contents Table of Contents... 2 Introduction... 3 About... 3 Susan G. Komen Affiliate Network... 3 Purpose of the State Community Profile Report... 4 Quantitative Data: Measuring
Executive Summary. Introduction to the Community Profile Report
 Executive Summary Introduction to the Community Profile Report Affiliate Overview The Affiliate began as the Komen New Jersey Race for the Cure in 1994. Recognizing the need for growth, key volunteers
Health Disparities Matter!
 /KirwanInstitute www.kirwaninstitute.osu.edu Health Disparities Matter! Kierra Barnett, Research Assistant Alex Mainor, Research Assistant Jason Reece, Director of Research Health disparities are defined
Regional Executive Summary Project Overview
 Carlisle Regional Medical Center Hamilton Health Center Holy Spirit A Geisinger Affiliate Penn State Milton S. Hershey Medical Center Pennsylvania Psychiatric Institute PinnacleHealth System Executive
Service Area: Herkimer, Fulton & Montgomery Counties. 140 Burwell St. 301 N. Washington St. Little Falls, NY Herkimer, NY 13350
 2016 Community Service Plan & Community Health Improvement Plan & Herkimer County Public Health Service Area: Herkimer, Fulton & Montgomery Counties Bassett Healthcare Network s Little Falls Hospital Herkimer
Community Health Needs Assessment for the Greater Brockton CHNA
 The Greater Brockton Community Health Network Area Abington / Avon / Bridgewater / Brockton / East Bridgewater / Easton / Holbrook / Stoughton / West Bridgewater / Whitman Community Health Needs Assessment
Health Disparities Research
 Health Disparities Research Kyu Rhee, MD, MPP, FAAP, FACP Chief Public Health Officer Health Resources and Services Administration Outline on Health Disparities Research What is a health disparity? (DETECT)
Rockford Health Council
 2010 Healthy Community Study Rockford Area Early Learning Council Becky Cook Kendall April 12, 2011 Rockford Health Council Community-based healthy community collaborative Formed in 1982 as the Rockford
Community Development Division: Funding Process Study Update
 Community Development Division: Funding Process Study Update Background and Context Two key research studies the Race to Equity Report and a study of Madison s Social Sector by Joiner Sandbrook LLC--highlighted
The National Academies of SCIENCES ENGINEERING MEDICINE Achieving Rural Health Equity and Well-being: Challenges and Opportunities
 The National Academies of SCIENCES ENGINEERING MEDICINE Achieving Rural Health Equity and Well-being: Challenges and Opportunities Panel #1: Leveraging Resources to Advance Equity in Rural Areas Dolores
5 Public Health Challenges
 5 Public Health Challenges The most recent Mecklenburg County Community Health Assessment (CHA) prioritized the prevention of premature death and disability from chronic disease as the number one public
Reducing the Impact of Cancer. Listening to American Indians in Minnesota
 Reducing the Impact of Cancer Listening to American Indians in Minnesota Table of Contents Background... 2 Summary of Results... 3 Part 1: Summary of responses from American Indian listening sessions...
Snapshot 2016 COMMUNITY HEALTH ASSESSMENT
 Snapshot 2016 COMMUNITY HEALTH ASSESSMENT Background Hospitals that are 501 (c) (3) and public health agencies in Ohio are required to complete a community health assessment (CHA) every three years. A
2013 Arizona State Health Assessment Summary and Findings. Health and Wellness for all Arizonans
 2013 Arizona State Health Assessment Summary and Findings Health and Wellness for all Arizonans Presentation Overview The State Health Assessment Process Health Indicators 15 Leading Health Issues: o County
Table of Contents. 2 P a g e. Susan G. Komen
 NEW HAMPSHIRE Table of Contents Table of Contents... 2 Introduction... 3 About... 3 Susan G. Komen Affiliate Network... 3 Purpose of the State Community Profile Report... 4 Quantitative Data: Measuring
 By understanding and using data and statistics, you will become well informed about the state of health in the county and learn the most recent health information and activities pertinent to your specific
Road Map. Requirements for reporting Defining health disparities Resources for data
 Health Disparities Road Map Requirements for reporting Defining health disparities Resources for data Health disparities and substance use Resources for data Challenges Building data sources Environmental
2016 Community Service Plan & Community Health Improvement Plan
 2016 Community Service Plan & Community Health Improvement Plan A.O. Fox Memorial Hospital The Mary Imogene Bassett Hospital (dba: Bassett Medical Center) & Otsego County Health Department Service Area:
2016 PRC Community Health Needs Assessment
 2016 PRC Community Health Needs Assessment Staunton City, Waynesboro City, and Augusta County, Virginia Prepared for: Augusta Health By Professional Research Consultants, Inc. The PRC Community Health
Community Health Needs Assessment 2013 St. Joseph Medical Center
 Community Health Needs Assessment 2013 St. Joseph Medical Center McLean County Prepared by Dr. Laurence G. Weinzimmer and Professor Eric J. Michel Executive Summary The McLean County Community Health-Needs
HealthVoices. Health and Healthcare in Rural Georgia. The perspective of rural Georgians
 HealthVoices Health and Healthcare in Rural Georgia Issue 3, Publication #100, February 2017 Samantha Bourque Tucker, MPH; Hilton Mozee, BA; Gary Nelson, PhD The perspective of rural Georgians Rural Georgia
Central New York Care Collaborative, Inc. PPS Community Profile
 Central New York Care Collaborative, Inc. PPS Community Profile Counties served: Cayuga, Lewis, Madison, Oneida, Onondaga, and Oswego DEMOGRAPHICS 1 The total population of the Central New York Care Collaborative
2016 Collier County Florida Health Assessment Executive Summary
 2016 Florida Health Assessment Executive Summary Prepared by: The Health Planning Council of Southwest Florida, Inc. www.hpcswf.com Executive Summary To access the report in its entirety, visit http://www.hpcswf.com/health-planning/health-planningprojects/.
Community Health Improvement Plan
 Community Health Improvement Plan 2014-2017 IOWA COUNTY WISCONSIN Prepared for Iowa County Health Department by: Jenny Pritchett, Director/Health Officer 1 P a g e Contents Letter from the Health Officer..
Table of Contents INTRODUCTION... 2 METHODOLOGY Appendix 1 Comparison of Peer Counties... 6
 Table of Contents INTRODUCTION... 2 METHODOLOGY... 4 Appendix 1 Comparison of... 6 Appendix 2 Key Findings from the MAPP Assessments... 7 BARRIERS TO HEALTHCARE ACCESS... 7 HEALTH STATUS... 9 DEATH INDICATORS...
Southview Medical Center. Community Benefit Plan & Implementation Strategy
 201 4 Southview Medical Center Community Benefit Plan & Implementation Strategy TABLE OF CONTENTS INTRODUCTION... 2 Southview Medical Center Service Area... 2 Community Health Needs Assessment... 2 Data
Camden Citywide Diabetes Collaborative
 Camden Citywide Diabetes Collaborative The Camden Coalition of Healthcare Providers is an organization that seeks to improve the quality, capacity and accessibility of the health care system for vulnerable,
2018 Healthy Aging Summit- Call for Abstracts
 1 2018 Healthy Aging Summit- Call for Abstracts Deadline for submission of abstracts is 11:59 pm (Eastern Standard Time) Monday, February 5, 2018. The U.S. Department of Health and Human Services (HHS),
Santa Clara County Highlights
 Santa Clara County Highlights Data and Partnerships: Pivotal Elements to Create Healthy Communities November 6th, 2009 David Hill, PhD, MPH Cities of Santa Clara County 2 The pivotal elements Data evidence-based
Division of Behavioral Health Services
 Division of Behavioral Health Services Annual Report on Substance Abuse Treatment Programs Fiscal Year 2012 Submitted Pursuant to A.R.S. 36-2023 December 31, 2012 Report Contents Program Names and Locations
Working Towards Addressing Women s Health Disparities in Arizona
 Working Towards Addressing Women s Health Disparities in Arizona Suncerria Tillis, MBA Arizona Health Disparities Center December 6, 2006 National Conference of State Legislatures Women s Health Pre-Conference
Arizona Annual Tuberculosis Surveillance Report
 Arizona Annual Tuberculosis Surveillance Report 2014 Table of Contents I. Executive Summary 1 II. Case Rates 3 III. Cases and Case Rates by Race and Ethnicity 4 IV. Cases by Gender 4 V. Cases and Case
Arizona Department of Health Services. Hispanic Adult Tobacco Survey 2005 Report
 Arizona Department of Health Services Arizona Department of Health Services Office of Tobacco Education and Prevention Program Hispanic Adult Tobacco Survey 2005 Report July, 2006 Prepared by: Frederic
Table of Contents. 2 P age. Susan G. Komen
 NEVADA Table of Contents Table of Contents... 2 Introduction... 3 About... 3 Susan G. Komen Affiliate Network... 3 Purpose of the State Community Profile Report... 4 Quantitative Data: Measuring Breast
In Health Matters, Place Matters - The Health Opportunity Index (HOI) Virginia Department of Health Office of Health Equity
 Virginia Department of Health Office of Health Equity") In Health Matters, Place Matters - The Health Opportunity Index (HOI) Virginia Department of Health Office of Health Equity 1 Identifying the Problem America s Health Rankings United Health Foundation
In Health Matters, Place Matters - The Health Opportunity Index (HOI) Virginia Department of Health Office of Health Equity 1 Identifying the Problem America s Health Rankings United Health Foundation
The Distribution and Composition of Arizona s Dental Workforce and Practice Patterns: Implications for Access to Care
 The Distribution and Composition of Arizona s Dental Workforce and Practice Patterns: Implications for Access to Care Center for California Health Workforce Studies July 2004 Elizabeth Mertz, MA Kevin
Quantitative Data: Measuring Breast Cancer Impact in Local Communities
 Quantitative Data: Measuring Breast Cancer Impact in Local Communities Quantitative Data Report Introduction The purpose of the quantitative data report for the Southwest Florida Affiliate of Susan G.
Office of Minority Health (OMH) at Work in Indian Country
 at Work in Indian Country") Office of Minority Health (OMH) at Work in Indian Country J. Nadine Gracia, MD, MSCE Deputy Assistant Secretary for Minority Health Director, Office of Minority Health U.S. Department of Health and Human
Office of Minority Health (OMH) at Work in Indian Country J. Nadine Gracia, MD, MSCE Deputy Assistant Secretary for Minority Health Director, Office of Minority Health U.S. Department of Health and Human
Community Health Needs Assessment for UI Health Hospital & Clinics
 Community Health Needs Assessment for UI Health Hospital & Clinics Office of the Vice Chancellor for Health Affairs Community Engagement & Neighborhood Health Health Policy & Strategy Population Health
Table of Contents. 2 P age. Susan G. Komen
 NEW MEXICO Table of Contents Table of Contents... 2 Introduction... 3 About... 3 Susan G. Komen Affiliate Network... 3 Purpose of the State Community Profile Report... 3 Quantitative Data: Measuring Breast
PHACS County Profile Report for Searcy County. Presented by: Arkansas Center for Health Disparities and Arkansas Prevention Research Center
 PHACS County Profile Report for Searcy County Presented by: Arkansas Center for Health Disparities and Arkansas Prevention Research Center Contents Introduction... Page 2 Demographics...Page 3 Social Environment
Module 6: Substance Use
 Module 6: Substance Use Part 1: Overview of Substance Abuse I am Martha Romney and I am presenting on substance abuse. This module focuses on the healthy people 2020 objective to reduce substance abuse
19th SESSION OF THE SUBCOMMITTEE OF THE EXECUTIVE COMMITTEE ON WOMEN, HEALTH, AND DEVELOPMENT
 PAN AMERICAN HEALTH ORGANIZATION WORLD HEALTH ORGANIZATION 19th SESSION OF THE SUBCOMMITTEE OF THE EXECUTIVE COMMITTEE ON WOMEN, HEALTH, AND DEVELOPMENT Washington, D.C., USA, 12 14 March 2001 Provisional
Community-Based Strategies for Cancer Control
 Community-Based Strategies for Cancer Control Chanita Hughes Halbert, Ph.D. Department of Psychiatry and Behavioral Sciences Hollings Cancer Center Medical University of South Carolina 1900: Ten Leading
Pre-Conception & Pregnancy in Ohio
 Pre-Conception & Pregnancy in Ohio Elizabeth Conrey, PhD 1 January 217 1 State Maternal and Child Health Epidemiologist, Ohio Department of Health EXECUTIVE SUMMARY The primary objective of the analyses
PINELLAS HIGHLIGHTS DIET & EXERCISE
 PINELLAS HIGHLIGHTS DIET & EXERCISE DIET & EXERCISE Diet is not simply a matter of discipline. Access and the ability to afford healthy food play a role in food selection. Without enough income or proper
Community Health Needs Assessmen. Implementation Strategy
 Community Health Needs Assessmen Implementation Strategy HOSPITAL BACKGROUND Baptist Memorial Restorative Care Hospital was established in 1994 as a long term acute care hospital and is located within
Follow-up to the Second World Assembly on Ageing Inputs to the Secretary-General s report, pursuant to GA resolution 65/182
 Follow-up to the Second World Assembly on Ageing Inputs to the Secretary-General s report, pursuant to GA resolution 65/182 The resolution clearly draws attention to the need to address the gender dimensions
2017 Community Health Needs Assessment Report
 2017 Community Health Needs Assessment Report, Florida Prepared for: By: Professional Research Consultants, Inc. 11326 P Street Omaha, NE 68137-2316 www.prccustomresearch.com 2017-0313-02 June 2017 Table
Adventist HealthCare Washington Adventist Hospital Community Health Needs Assessment Implementation Strategy. Adopted May 15, 2017
 Adventist HealthCare Washington Adventist Hospital 2017-2019 Community Health Needs Assessment Implementation Strategy Adopted May 15, 2017 Implementation Strategy Development & Adoption Adventist HealthCare
Community Health Needs Assessment: Implementation Plan
 Community Health Needs Assessment: Implementation Plan Community Health Needs Assessment (CHNA) California Senate Bill 697, the Patient Protection and Affordable Care Act (PPACA) (HR3590), and Internal
COMMISSION OF THE EUROPEAN COMMUNITIES
 COMMISSION OF THE EUROPEAN COMMUNITIES Brussels, 20.10.2009 COM(2009) 567 final COMMUNICATION FROM THE COMMISSION TO THE EUROPEAN PARLIAMENT, THE COUNCIL, THE EUROPEAN ECONOMIC AND SOCIAL COMMITTEE AND
Baseline Health Data Report: Cambria and Somerset Counties, Pennsylvania
 Baseline Health Data Report: Cambria and Somerset Counties, Pennsylvania 2017 2018 Page 1 Table of Contents Executive Summary.4 Demographic and Economic Characteristics 6 Race and Ethnicity (US Census,
Arizona Health Improvement Plan
 Arizona Health Improvement Plan Arizona Alliance for Community Health Centers February 4, 2015 Will Humble, MPH ADHS Director Leading Health Issues State Health Assessment Obesity Behavioral Health Services
Greater Atlanta Affiliate of Susan G. Komen Quantitative Data Report
 Greater Atlanta Affiliate of Susan G. Komen Quantitative Data Report 2015-2019 Contents 1. Purpose, Intended Use, and Summary of Findings... 4 2. Quantitative Data... 6 2.1 Data Types... 6 2.2 Breast Cancer
Platte Valley Medical Center Page 0
 Platte Valley Medical Center Page 0 Table of Contents Introduction 4 Background and Purpose... 4 Service Area... 4 Map of the Service Area...5 Project Oversight...5 Consultants... 6 Identification of Community
A National Opportunity: Improving the Mental Health and Wellbeing of Adolescents and Young Adults
 A National Opportunity: Improving the Mental Health and Wellbeing of Adolescents and Young Adults Proposal by Stanford Psychiatry's Center for Youth Mental Health and Wellbeing January 2016 Stanford Psychiatry's
Table of Contents. 2 P age. Susan G. Komen
 WYOMING Table of Contents Table of Contents... 2 Introduction... 3 About... 3 Susan G. Komen Affiliate Network... 3 Purpose of the State Community Profile Report... 4 Quantitative Data: Measuring Breast
Community Needs Assessment. June 26, 2013
 Community Needs Assessment June 26, 2013 Agenda Purpose Methodology for Collecting Data Geographic Area Demographic Information Community Health Data Prevalence of Alcohol & Drug Use Utilization data Findings
HEALTH DISPARITIES AMONG ADULTS IN OHIO
 OHIO MEDICAID ASSESSMENT SURVEY 2012 Taking the pulse of health in Ohio HEALTH DISPARITIES AMONG ADULTS IN OHIO Amy K. Ferketich, PhD 1 Ling Wang, MPH 1 Timothy R. Sahr, MPH, MA 2 1The Ohio State University
Monitoring of the achievement of the health-related Millennium Development Goals
 SIXTY-THIRD WORLD HEALTH ASSEMBLY WHA63.15 Agenda item 11.4 21 May 2010 Monitoring of the achievement of the health-related Millennium Development Goals The Sixty-third World Health Assembly, Having considered
Community Health Status Assessment: High Level Summary
 Community Health Status Assessment: High Level Summary This summary provides a general overview of Community Health Status Assessment (CHSA) results as part of the Health Improvement Partnership (HIP-C)
Washington State Collaborative Oral Health Improvement Plan
 Washington State Collaborative Oral Health Improvement Plan 2009-2014 Prioritization Criteria (non-financial): Strategic Area I: System Infrastructure (Partnerships, Funding, Technology) Goal 1: Mobilize
Community Health Needs Assessment
 Community Health Needs Assessment Scott County, Missouri This assessment will identify the health needs of the residents of Scott County, Missouri, and those needs will be prioritized and recommendations
The Heterosexual HIV Epidemic in Chicago: Insights into the Social Determinants of HIV
 The Heterosexual HIV Epidemic in Chicago: Insights into the Social Determinants of HIV Nikhil Prachand, MPH Board of Health Meeting January 19, 2011 STI/HIV/AIDS Division Today s Presentation Epidemiology
Jackson Hospital Community Health Needs Assessment. Fiscal Year 2016
 Jackson Hospital Community Health Needs Assessment Fiscal Year 2016 JACKSON HOSPITAL AT A GLANCE Jackson Hospital, located in Montgomery, Alabama, is a not-for-profit organization committed to improving
Executive Summary. The Case for Data Linkage
 This first report of the San Francisco (SF) Firearm Injury Reporting System (SFFIRS) is the collaborative product of a pilot project to track and report on all violent injuries, with an initial focus on
2017 PRC Community Health Needs Assessment
 2017 PRC Community Needs Assessment Obici care Foundation Service Area Western Tidewater, Virginia Prepared for: OBICI HEALTHCARE FOUNDATION By Professional Research Consultants, Inc. The PRC Community
Franklin County The Health of Our Communities
 Franklin County The Health of Our Communities Paul Smith s College May 1, 2013 1 Welcome and Introductions Meeting Agenda New York State s Health Improvement Plan (Prevention Agenda 2013-2017) Franklin
HealtheCNY Indicator List by Data Source
 American Community Survey 23 Adults with Health Insurance Children Living Below Poverty Level Children with Health Insurance Families Living Below Poverty Level Homeowner Vacancy Rate Homeownership Households
REQUEST FOR PROPOSALS: CONTRACEPTIVE ACCESS CHANGE PACKAGE
 REQUEST FOR PROPOSALS: CONTRACEPTIVE ACCESS CHANGE PACKAGE OVERVIEW The Colorado Collaborative for Reproductive Health Equity (Collaborative), supported by the Colorado Health Foundation and Caring for
M.A.P. II. Monitoring and Assessment Project Executive Summary. Infectious Diseases. Chronic Diseases. Tarrant County Public Health
 M.A.P. II Monitoring and Assessment Project 2002-2004 Environmental Health Social & Mental Health Injuries Chronic Diseases County Maternal & Child Health Infectious Diseases County Public Health Safeguarding
Community Health Needs Assessment Report. Saline County, Nebraska
 Community Health Needs Assessment Report Saline County, Nebraska 12/31/2018 Crete Area Medical Center 2 Table of Contents I. Introduction... 3 II. Description of Community Served... 3 III. Crete Area Medical
Part 1: Introduction & Overview
 Part 1: Introduction & Overview We envision a collaborative, participative partnership around IDU that: Provides all relevant and interested stakeholders with a voice and role. Promotes awareness of the
Slide 1. Slide 2. Slide 3. Ongoing Disparities in Rural Health. All-Cause Mortality: US vs. Appalachia
 Slide 1 Ongoing Disparities in Rural Health 1 Slide 2 Source: Singh and Siahpush, Widening Rural-Urban Disparities in Life Expectancy, U.S., 1969-2009. American Journal of Preventive Medicine, 2014; 46(2):e19-e29.
Washoe County Community Health Needs Assessment EXECUTIVE SUMMARY
 2018 2020 Washoe County Community Health Needs Assessment EXECUTIVE SUMMARY The 2018-2020 Washoe County Community Health Needs Assessment was sponsored in full by the Washoe County Health District and
Key gender equality issues to be reflected in the post-2015 development framework
 13 March 2013 Original: English Commission on the Status of Women Fifty-seventh session 4-15 March 2013 Agenda item 3 (b) Follow-up to the Fourth World Conference on Women and to the twenty-third special
HEALTH DISPARITIES By Hana Koniuta November 19, 2010
 HEALTH DISPARITIES By Hana Koniuta November 19, 2010 "We need to focus on the uninsured and those who suffer from health care disparities that we so inadequately addressed in the past." Sen. Bill Frist
Executive Summary To access the report in its entirety, visit
 Executive Summary To access the report in its entirety, visit http://www.hpcswf.com/health-planning/health-planningprojects/. Demographic and Socioeconomic Characteristics Population Demographics has a
Fort Ha milton Hospital. Community Benefit Plan & Implementation Strategy
 201 4 Fort Ha milton Hospital Community Benefit Plan & Implementation Strategy TABLE OF CONTENTS INTRODUCTION... 2 Fort Hamilton Hospital Service Area... 2 Community Health Needs Assessment... 2 Data Collection...
Comprehensive HIV Health Services Plan
 PanWest-West Texas Ryan White Programs Comprehensive HIV Health Services Plan 2010-2013 Executive Summary EXECUTIVE SUMMARY This Comprehensive HIV Services Plan is the first joint plan between the PanWest
Westside Health Collaborative Initiative
 Westside Health Collaborative Initiative OVERVIEW, KEY FINDINGS, IMPROVEMENT PLAN www.westsideontherise.org Westside on the Rise: Positive Transformation of People and Place Neighborhood Transformation
PROMEDICA MONROE REGIONAL HOSPITAL 2016 COMMUNITY HEALTH NEEDS ASSESSMENT IMPLEMENTATION PLAN
 PROMEDICA MONROE REGIONAL HOSPITAL 2016 COMMUNITY HEALTH NEEDS ASSESSMENT IMPLEMENTATION PLAN 2017-2019 Approved and Adopted on December 19, 2016 PROMEDICA MONROE REGIONAL HOSPITAL 2016 COMMUNITY HEALTH
Table of Contents. 2 P age. Susan G. Komen
 OREGON Table of Contents Table of Contents... 2 Introduction... 3 About... 3 Susan G. Komen Affiliate Network... 3 Purpose of the State Community Profile Report... 4 Quantitative Data: Measuring Breast
Bassett Medical Center PPS Community Profile
 Bassett Medical Center PPS Community Profile Counties served: Delaware, Herkimer, Madison, Otsego, and Schoharie DEMOGRAPHICS 1 The Bassett Medical Center PPS s total population is 278,214. Age: Residents
CHS 2009 Baltimore City Community Health Survey: Summary Results Report
 CHS 2009 Baltimore City Community Health Survey: Summary Results Report About the Survey: A representative sample of 1,134 Baltimore residents participated in the Community Health Survey The survey reached