STATISTICS AND ANALYSIS ON SUPPLY OF AND TRAFFICKING IN NARCOTIC DRUGS AND PSYCHOTROPIC SUBSTANCES 1996
|
|
|
- Leo Watson
- 5 years ago
- Views:
Transcription
1 STATISTICS AND ANALYSIS ON SUPPLY OF AND TRAFFICKING IN NARCOTIC DRUGS AND PSYCHOTROPIC SUBSTANCES 1996
2 The United Nations International Drug Control Programme wishes to express its appreciation for responses received in the annual reports questionnaires (ARQ), which provided the main source of information for this paper. In order to prepare such documentation, it needs to be stressed, that the quality as well as quantity of information presented, the improvement of clarity and the elaboration of analysis depends on detailed reporting by Governments. Feedback from readers of this document would be welcomed. Please send your comments to: Supply Reduction and Law Enforcement Section United Nations International Drug Control Programme P.O. Box 500 A-1400 Vienna Austria This document has not been formally edited
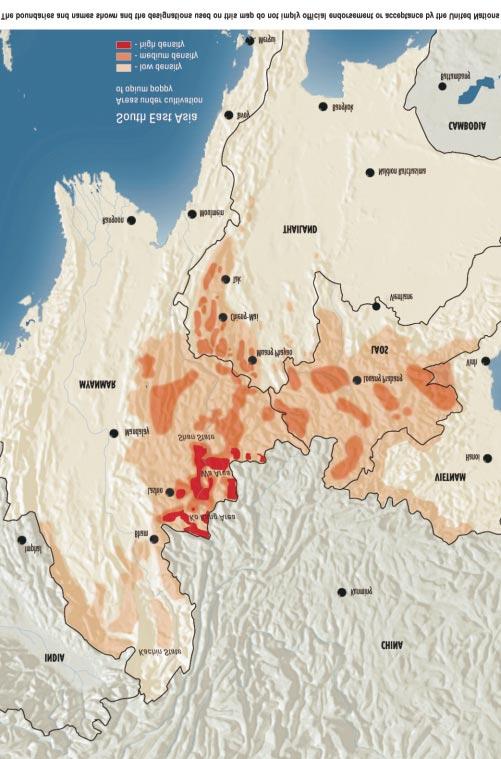
3 - 1 - Chapter CONTENTS Page INTRODUCTION... 3 RESPONSES TO ANNUAL REPORTS QUESTIONNAIRES (ARQ) AND GROUPING OF COUNTRIES BY SUBREGIONS... 4 INDICATORS ON DRUG TRAFFICKING AND SUPPLY... 5 I. ILLICIT CULTIVATION AND PRODUCTION... 6 Cultivation of opium poppy and production of opium gum... 6 Cultivation of coca bush and production of coca leaf Maps: Cultivation areas: Opium poppy cultivation in South-West and Central Asia Opium poppy cultivation in South-East Asia Coca and opium poppy cultivation in South America and Mexico II. TRAFFICKING Distribution of opium gum and manufacture of heroin Manufacture of cocaine Emerging trends in international trafficking: the growing role of Africa Maps: Trafficking routes: Heroin trafficking routes Cocaine trafficking routes Seizures Herbal cannabis Cannabis resin Opium (raw and prepared) Heroin and Morphine Cocaine Psychotropic substances: Stimulants Methaqualone LSD Maps: Key areas of drug seizures Key areas of seizures of herbal cannabis Key areas of seizures of cannabis resin Key areas of seizures of heroin and morphine Key areas of seizures of cocaine
4 - 2 - Chapter CONTENTS (continued) Page III. PRICES AND VALUE Farmgate level: Opium Coca Retail and wholesale prices for heroin and cocaine IV. INTERCEPTION RATES Annex: Details on statistical data of: Prices and levels of purity Illicit manufacture Diversion from licit channels Seizures... 58
5 - 3 - INTRODUCTION The present document is based on data obtained from annual reports questionnaires (ARQ) received by UNDCP up to 31 January Where information was lacking, additional sources were used. The statistics and analysis presented cover the period 1986 to 1996, with a focus on 1996, and include estimates for 1997 where available. For the calendar year 1996, 100 countries (listed on page 4) have submitted the ARQ. The following additional sources of information were used in cases where reporting by ARQ was incomplete or lacking: (a) International Criminal Police Organization (ICPO/Interpol) (In the Annex: data is followed by ICPO); (b) Reports provided separately by Governments or other official sources (In the Annex: data is followed by Govt.); (c) International Narcotics Control Board (In the Annex: data is followed by INCB); (d) World Customs Organization (In the Annex: data is followed by WCO); (e) UNDCP field offices reports. In order to provide an overview and meaningful analysis on drug trends, some presentations in this document have been grouped by geographic regions and subregions. Details on the grouping of countries are presented on page 4. The following abbreviations are used in this document: gr = gramme kg = kilogramme mt = metric tonne ha = hectare lt = litre u. = unit In view of the problems of vague or incomplete reporting, the figures presented in this document cannot always be taken as comprehensive statistics but rather as indicators of recent developments. Additionally, all figures provided, in particular those of more recent years, are subject to updating. Finally, boundaries shown in maps do not imply any official acceptance or endorsement by the UN. The statistics and analysis presented in this document have been structured according to the following subject areas: (i) Illicit cultivation and production; (ii) trafficking, including summarized information on seizures; (iii) prices and value; and (iv) interception rates. Definitions of these terminologies are provided on page 5. In the Annex, details on statistical data (as maintained in the UNDCP data base) regarding prices and levels of purity, illicit manufacture, diversion from licit channels and seizures have been attached.
6 - 4 - RESPONSES TO ARQ AND GROUPING OF COUNTRIES BY SUBREGIONS A total of 100 countries (listed below, as received up to 31 January 1998) have submitted the ARQ, Part III, for 1996, which is in line with the number of responses received on an average basis in recent years and 10 reports more compared to The countries listed below have been grouped according to the regional and subregional breakdown used in this document. In the statistics and graphical presentations provided in the document, each subregion includes additional countries which have not submitted the ARQ in 1996 and are therefore not listed here. Africa America Asia Europe Oceania Côte d Ivoire North America East/South-East Asia Eastern Europe Australia Egypt Canada Brunei Darussalam Belarus Cook Isl. Ghana Mexico China Bulgaria Fiji Kenya USA Hongkong Croatia Malawi Central America Indonesia Czech Republic Mauritius Costa Rica Japan Hungary Morocco Guatemala Korea, Republic of Latvia Namibia Nicaragua Philippines Lithuania Sierra Leone Panama Singapore Moldova Rep. South Africa South America Central Asia* Poland Togo Brazil Armenia Romania Chile Kyrgyzstan Russian Federation Colombia Tajikistan Slovenia Ecuador Uzbekistan Ukraine Guyana South Asia Western Europe Paraguay Bangladesh Austria Peru Nepal Belgium Suriname Sri Lanka Cyprus Uruguay Near and Middle East** Denmark Venezuela Bahrain Finland The Caribbean Iran, Islamic Rep France Anguilla Iraq Germany Bermuda Israel Gibraltar Br. Virgin Is. Jordan Greece Cayman Is. Lebanon Ireland Cuba Qatar Italy Dominica Syrian Arab Rep. Liechtenstein Dominican Rep. United Arab Emirates Luxembourg Grenada Malta St. Lucia Monaco Turks Caicos Is. Norway Portugal Spain Sweden Switzerland Turkey United Kingdom Total = 11 Total = 27 Total = 24 Total = 35 Total=3 * This subregion also includes Caucasian countries ** This subregion also includes countries in South-West Asia
7 - 5 - INDICATORS ON DRUG TRAFFICKING AND SUPPLY Statistical information on the supply of and trafficking in drugs is mainly based on the following three indicators: * Production: the volume of a drug produced is the main indicator for its supply. In order to obtain net production figures, additional factors such as cultivation, eradication and yield have to be taken into account. Data on cultivation of opium poppy and coca bush (figures for cannabis plant are not available) are provided in hectares. The current estimated global cultivation area of both opium poppy and coca bush together account for approximately 450,000 hectares worldwide which roughly equals twice the size of Luxembourg. Data on production of opium gum and coca leaf are provided in metric tonnes. Manufacture of drugs involves the refining of drugs into more purified substances, such as morphine, heroin or cocaine. * Prices are differentiated between farmgate and wholesale/retail prices. Prices are an indicator for risk, the quality of drug as well as for the interaction between supply and demand of drugs. Data on prices are expressed in US$ equivalent. Wherever a trend was presented, the price is reflected as constant US$, which is based on 1996 and takes additional factors such as inflation rate into account. As for the quality of drug at the farmgate level, in Asia, for example, prices of opium in Afghanistan and Pakistan are currently between an estimated US$ 50 and $69 per kilogramme as compared to a price range of approximately US$ in East/South- East Asia (Laos PDR, Myanmar, Thailand, Vietnam). The latter is known for its higher quality opium. * Seizure data are used as an indicator for trafficking. However, such information has to be interpreted with caution since seizures may also indicate efforts in law enforcement. Additional information is obtained if the above indicators are combined/correlated, as follows: * Value is the product of net production and (farmgate) price of a drug, and means the potential income/profits made by (all farmers in) a particular region/country with the volume of drug produced. * Interception rate is the percentage of a drug seized in proportion to its total production. The deduction of total volume of a drug seized from the total net production equals the potential availability of that drug at the market ( net supply ). It should be noted that the net supply does not necessarily equal the volume of consumption, since a number of external factors such as storage and losses of drugs, which are unknown, come into play.
8 - 6 - I. ILLICIT CULTIVATION AND PRODUCTION The data on cultivation and production presented in this chapter are reflected as UNDCP estimates. Figures are based on government statistics, supplemented by UNDCP surveys and additional sources. The term UNDCP estimates should be interpreted to imply that insofar as official government statistics have not been complete throughout the years, additional techniques (mainly interpolation in combination with trends described elsewhere, such as reports by field offices) have been used to fill the gaps. In the following statistics and analysis, the term cultivation refers to potential harvestable cultivation areas. Cultivation areas in which there has been eradication prior to harvest are not included. Cultivation of opium poppy and production of opium gum Illicit cultivation of opium poppy continues to take place in three main regions: East/South-East Asia, including Lao People s Democratic Republic, Myanmar, Thailand and Vietnam; Near and Middle East, in particular Afghanistan and Pakistan; and the Americas, mainly Colombia and Mexico. In 1996, the total area under illicit poppy cultivation was estimated at some 270,000 hectares, which is at the average level maintained since Global production of opium, which was estimated at roughly 4,400 tonnes in 1996, seems to have increased moderately during the 1990s, the peak being in The Near and Middle East subregion now accounts for more than half of the global production of opium and yet less than one third of the estimate of global poppy cultivation (this takes account not only of Afghanistan and Pakistan but also of those other Asian countries referred to in pages 8 and 10). Afghanistan is now the world s premier source of illicit opium, with approximately 56,000 hectares of surface area under cultivation and a net production of about 2,250 tonnes of opium gum per year (1996). Production in Afghanistan has risen sharply in the last decade, which was a major reason for the worldwide increase. The country s very high production volume of over 3,000 tonnes in 1994 was also responsible for the global peak of that year. In 1995, the volume of opium produced in Afghanistan decreased, and subsequently remained stable in Latest surveys for 1997, however, suggest a production growth of 25% above the 1996 total, reaching 2,800 tonnes. The main reason for this was a higher yield caused by favourable weather conditions, since cultivation remained more or less stable. Cultivation in Pakistan seemed to have decreased fivefold in 1996 compared to previous years, resulting in a cultivation area of 878 hectares and an annual production of 24 tonnes. According to the Government of Pakistan, this decrease in poppy cultivation, which took place mainly in the North West Frontier Province, is due to alternative development as well as law enforcement efforts. Some reports suggest that limited illicit cultivation takes place in other countries of the region, including Egypt, India and Lebanon. Additionally, new areas in the Central Asia subregion seem to be increasingly used to grow opium poppy. However, no information is available with regard to actual quantities cultivated and produced in these countries, some of which may only be negligible amounts. Eradication data from Egypt relate to 2,037 hectares in 1996 and hectares in 1997.
9 - 7 - In East/South-East Asia, the ratio of cultivation to production differs from that in respect of the Near and Middle East, due to a different yield factor. The subregion accounts for 44% of the global estimated opium production, but for 69% of the global distribution of cultivation (1996). The total surface area under cultivation in East/South-East Asia was estimated at some 186,700 hectares in Myanmar, the second largest producer of opium worldwide and the biggest supplier in the subregion, produced an estimated 1,760 tonnes in 1996, followed by Lao PDR with 140 tonnes and Vietnam and Thailand with less than 10 tonnes each. Production in Myanmar (of which available figures vary widely depending on different sources) seems to have more or less stabilized since A current five year programme of alternative development, undertaken by the Government of Myanmar and scheduled to commence in March 1998, includes a strategy for the elimination of illicit cultivation within the country, which is one of the world s major opium producers. Estimates for Lao PDR indicate a modest rise in recent years, though this remains below the level of late 1980s/early 1990s. A survey carried out by the Government of Lao PDR revealed that this recent rise in production as well as cultivation was due to an increase in the number of families taking part in poppy cultivation. The number of villages concerned, however, remained roughly the same. This extension in the cultivation area occurred mainly in the four North-Western provinces located near to the borders with Thailand and Myanmar. On the other hand, Eastern provinces witnessed a decrease in production, which suggests a certain shift in production from East to West and a potential new development in opium poppy cultivation. Reports on production in Thailand and Vietnam refer to a sharp decline in 1993 and 1994; both countries seem since to have more or less maintained the low level of production. The reduction in Vietnam was achieved through the national strategy to eliminate illicit cultivation within ten years, which was initiated in 1993 and is based on eradication campaigns accompanied by alternative development programmes. The reduction in cultivation of opium poppy and production of opium in Thailand since 1992 was the result of successful highland development programmes and vigorous drug law enforcement efforts. The small increase in 1996 was thought to be due to favourable weather conditions, on the one hand, and rocketing farmgate prices for opium, on the other. In the Americas, production of opium is taking place in Colombia and Mexico, amounting to 101 and 54 tonnes (1996) respectively. The region accounts for 4% of the global totals of cultivation and production, with a more or less stable trend in recent years. The global trend in illicit opium production, which is thought to have realized a sharp increase during the 1980s and a moderate increase during the first half of the 1990s, followed by a peak in 1994, seemed to have stabilized in 1995 and Production in several smaller producer countries decreased over the last few years. Both major producer countries, Afghanistan and Myanmar, indicated a recent stabilization/moderate increase. Estimates for 1997, however, suggested a new rise in global production. This increase is mainly related to Afghanistan, as mentioned above. The global trend in cultivation more or less follows the production trend over the last ten year period. The following table 1 provides an overview of the global cultivation of opium poppy and production of opium, between , with a breakdown by subregion and country. Figure 1 is a graphical presentation of the global trends in cultivation and production over the last ten years. Figures 2 and 3 are graphical presentations of the cultivation and production situations in 1996, with a breakdown by subregion (fig. 2) and country (fig. 3).
10 - 8 - Table 1. Global illicit cultivation of opium poppy and production of opium, (UNDCP estimates) (in hectares and metric tonnes) Year Region/subregion Cultivation* in ha ASIA Near and Middle East Afghanistan 10,000 25,000 32,000 34,300 41,300 50,800 49,300 58,300 71,470 53,759 56,824 Pakistan 6,034 5,463 6,519 7,464 7,488 7,962 9,493 7,329 5,759 5, Subtotal 16,034 30,463 38,519 41,764 48,788 58,762 58,793 65,629 77,229 58,850 57,697 East and South East Asia Lao, PDR ,400 42,130 30,580 29,625 19,190 26,040 18,520 19,650 21,601 Myanmar 86,570 92, , , , , , , , , ,000 Thailand 2,408 3,163 2,811 2,982 1,782 3,727 3, Vietnam 8,000 10,000 12,000 14,000 18,000 17,000 12,199 4,268 3,066 1,880 1,743 Subtotal 96, , , , , , , , , , ,712 Other Asian countries 15,000 10,713 8,093 10,750 13,054 12,145 8,430 11,778 14,250 15,739 16,190 Total Asia 128, , , , , , , , , , ,599 LATIN AMERICA Mexico 3,865 5,160 6,700 6,600 5,450 3,765 3,310 3,960 5,795 5,050 5,100 Colombia ,344 6,578 10,882 17,111 11,071 6,300 Total Latin America 3,865 5,160 6,700 6,600 5,450 5,109 9,888 14,842 22,906 16,121 11,400 GLOBAL TOTAL 131, , , , , , , , , , ,999 Production in tonnes ASIA Near and Middle East Afghanistan ,120 1,200 1,570 1,980 1,970 2,330 3,416 2,335 2,248 Pakistan Subtotal ,250 1,349 1,720 2,140 2,151 2,491 3,544 2,447 2,272 East and South East Asia Lao, PDR Myanmar ,125 1,544 1,621 1,728 1,660 1,791 1,583 1,664 1,760 Thailand Vietnam Subtotal 1,001 1,269 1,469 1,923 1,933 2,032 1,861 1,998 1,722 1,803 1,915 Other Asian countries Total Asia 1,781 2,475 2,872 3,429 3,768 4,265 4,053 4,568 5,357 4,328 4,235 LATIN AMERICA Mexico Colombia Total Latin America GLOBAL TOTAL 1,821 2,525 2,939 3,495 3,830 4,314 4,140 4,693 5,519 4,486 4,389 * Potentially harvestable, after eradication
11 - 9 - Figure 1. Global trend in illicit cultivation of opium poppy and production of opium, (in hectares and metric tonnes) Cultivation* (ha) 131, , , , , , , , , , ,999 Production (mt) 1,821 2,525 2,939 3,495 3,830 4,314 4,140 4,693 5,519 4,486 4,389 * Potentially harvestable, after eradication 300,000 Global illicit opium poppy cultivation 250, ,000 Hectares 150, ,000 50,000 Estimated cultivation Trendline - Global illicit opium production 6,000 5,000 4,000 Tonnes 3,000 2,000 1,000 Estimated production Trendline -
12 Figure 2. Global illicit cultivation of opium poppy and production of opium, 1996 Breakdown by subregion Global opium poppy cultivation (in percentage) Global opium production (in percentage) Latin America Other 4% Asian countries 6% Near and Middle East 21% Other Asian countries 1% Latin America 4% Near and Middle East 51% East and South East Asia 69% East and South East Asia 44% Figure 3. Global illicit production of opium, 1996 Ranking of countries (in metric tonnes) Afghanistan 2,248 Myanmar 1,760 Lao, PDR 140 Colombia Mexico Other Asian countries Pakistan Vietnam 9 Thailand ,000 1,500 2,000 2,500
13 Cultivation of coca bush and production of coca leaf Illicit cultivation of coca bush and production of coca leaf, which were sharply rising during the 1970s and 1980s, both seem to have decreased since 1990/91. The main coca cultivating and producing countries remain Bolivia, Colombia and Peru. In 1996, the total illicit cultivation area within the three countries amounted to an estimated 178,000 hectares, which is a decline of less than 10% compared to While Peru indicated a consistent decrease of coca cultivation in recent years, cultivation in Colombia seemed to be steadily rising. Over the same period, cultivation in Bolivia reflected a stable trend. The UNDCP estimates for 1996 revealed 75,000 hectares in Peru, 67,000 ha in Colombia and 36,000 ha in Bolivia. This distribution of hectarage among the three countries indicates almost equal cultivation in Peru and Colombia (Peru still marginally higher) and about half of that in Bolivia. The distribution of hectarage in 1996, however, differs considerably from previous years, when the share of Peru s cultivation amounted to three-quarters of the global hectarage, with the remaining quarter split evenly between Bolivia and Colombia. Projections for 1997 suggest a continuation of this trend, with Peru reflecting a reduction and Colombia a growth in cultivation. Similarly, production in Peru is estimated to have declined considerably in the 1990s, while figures for Colombia indicate a rising trend over the last ten years. Estimates for production in Bolivia tend to be stable in recent years, though figures are higher than during the mid-1980s. Global coca production was estimated at more than 310,000 tonnes in 1996, most of which originated from Peru (over 130,000 tonnes or 42%). The country s production, however, declined by approximately 20% compared to 1995 and is currently almost half of its highest level in Bolivia remained the second largest producer with nearly 100,000 tonnes (or 32%) in 1996, closely followed by Colombia with an estimated 80,000 tonnes (26%). Colombia s production figures have more than doubled since the mid- 1980s, with the trend still rising. The ratio of cultivation to production differs among the three countries due to varying yield factors. Peru accounts for just over 40% of both coca cultivation and production. Colombia takes a 38% share of the total coca bush cultivation yet only 26% of the total coca leaf production. On the other hand, Bolivia s share is higher for production than for cultivation. It should be noted, however, that production in Colombia is calculated at an estimated yield, of which some sources suggest a higher factor. The following table 2 provides an overview of the global cultivation of coca bush and production of coca leaf, between , with a breakdown by country. Figures 4 and 5 are graphical presentations of the cultivation and production situations in 1996, with a breakdown by and ranking of countries. Figure 6 is a graphical presentation of the global trends in coca cultivation and production over the last ten years.
14 Table 2. Global illicit cultivation of coca bush and production of cocal leaf, (UNDCP estimates) (in hectares and metric tonnes) Country/year Cultivation* in ha Bolivia 25,800 29,300 36,900 40,900 38,300 35,900 33,500 35,200 36,100 36,600 36,100 Colombia 24,240 22,500 34,000 42,400 40,100 37,500 37,100 39,700 44,700 50,900 67,200 Peru 150, , , , , , , , , ,500 75,000 GLOBAL TOTAL** 200, , , , , , , , , , ,300 Production in tonnes Bolivia 71,311 80, , , ,861 99,228 92,594 97,293 99, ,162 99,780 Colombia 29,088 27,000 40,800 50,880 48,120 45,000 44,520 47,640 53,640 61,080 80,640 Peru 150, , , , , , , , , , ,000 GLOBAL TOTAL ** 250, , , , , , , , , , ,420 * Potentially harvestable, after eradication ** Cultivation and production in other countries are estimated to be less than 3% Figure 4. Global illicit cultivation of coca bush and production of coca leaf, 1996 Breakdown by countries Global coca cultivation (in percentage) Peru 42% Bolivia 20% Global coca prodution (in percentage) Bolivia 32% Peru 42% Colombia 26% Colombia 38% Figure 5. Global illicit production of coca leaf, 1996 Ranking of countries (in metric tonnes) Peru 131,000 Bolivia 99,780 Colombia 80,640-20,000 40,000 60,000 80, , , ,00 0
15 Figure 6. Global trend in illicit cultivation of coca bush and production of coca leaf, (in hectares and metric tonnes) Cutivation* (ha) 200, , , , , , , , , , ,300 Production (mt) 250, , , , , , , , , , ,420 * Potentially harvestable, after eradication Global illicit cultivation of coca bush 300, , ,000 Hectares 150, ,000 50,000 Estimated cultivation Trendline - 400,000 Global illicit production of coca leaf 350, , ,000 Tonnes 200, , ,000 50,000 Estimated production Trendline -
16
17
18
19 II. TRAFFICKING Distribution of opium gum and manufacture of morphine/heroin The opium gum produced in each country is either abused domestically - for consumption (opium) as well as conversion into end products (morphine/heroin) - or illegally exported, being again available to the recipient country for consumption and /or conversion purposes. The illegal distribution of opium and subsequent manufacture of morphine and heroin primarily take place within the opium cultivating regions, thus reducing the risks to traffickers while increasing the potential profits since heroin/morphine are of higher value per unit weight than opium. After this distribution of opium gum within each region, it is estimated that Thailand, Lao PDR, Pakistan, Afghanistan, and to a lesser extent Myanmar, Malaysia, Iran, Islamic Rep., and India, have similar shares of illicit opium available for potential conversion into morphine and heroin. The opium produced in Mexico and Colombia is assumed to be used mainly for conversion into heroin, which takes place within each country. As in the case of opium, morphine and heroin are used for domestic consumption as well as illegal export. These drug types seem to differ, however, in the ratio of quantity consumed domestically (or within the cultivating regions) to the volume used for other purposes (opium: manufacture into end product; heroin: export outside the region). Additionally, this ratio differs from country to country depending on actual cultivation figures and consumption habits. A second difference is the volume and destination of exports: While most of the illegal opium export/distribution takes place within the same region as of its origin (to neighbouring countries of poppy cultivating area) and is thought to never leave the cultivating regions, most of the heroin, even though manufactured within the same geographical areas, is finally trafficked outside the region. Manufacture of cocaine The manufacture of cocaine involves an extraction from the coca leaf and purification of coca paste. Recent reports indicate that the majority of Peruvian coca growers now process the leaves directly into paste, thereby reducing the bulk of the product transported to buyers. Additionally, Colombian organizations or cooperative ventures tend to process coca leaves directly into cocaine base. Leaves and paste are no longer sold separately and enter the market only in the form of the more purified cocaine base and cocaine hydrochloride. (Further details on manufacture of narcotic drugs and psychotropic substances are included in the Annex.) Emerging trends in international trafficking: the growing role of Africa Africa is emerging as an important region for the production (cannabis), trafficking and consumption of drugs. Although sufficient data are not always available, more and more studies and reports in recent years indicate alarming trends with regard to both illicit drug trafficking and abuse.
20 The continent has become a major transit point for illicit drug trafficking to markets in Europe and North America, as evidenced by the spread of international operations, mainly by West African trafficking groups, in recent years. Being confronted with increased pressure by law enforcement activities in many countries in recent years, trafficking groups, not only of West African origin but also belonging to Asian or Latin American cells, are continually looking for new and safer trafficking ways. Additionally, in the 1990s, the process of political and economic changes set in motion by the disintegration of the former USSR and the drive to liberalize the international economy have significantly increased both the magnitude and complexity of illicit drug trafficking. Trafficking groups have taken advantage of this increased volume of international trade and transportation as well as inadequate border control facilities at airports, seaports and land entry points, mainly due to lack of resources, to smuggle illicit drugs. Reports in the past indicated that cannabis was the most preponderant drug in the region, though most of this was either growing wildly or was for local traditional use. This situation was changing rapidly in recent years and cannabis has become a cash crop, grown not only to supply the increasing market of the youth in major cities of the continent but also for export, mainly to Europe and North America. Countries in Africa are responsible for a quarter of the herbal cannabis and one-tenth of cannabis resin seized worldwide. It is mainly South Africa and Morocco that account for the bulk of the African share in global seizures. (Further details on seizures are included in the following chapter as well as in the Annex.) Although the volume of heroin seized in African countries is still small by international standards, there are indications of expansion of international trafficking links to both Europe and North America. Since the 1980s, West African trafficking organizations have gained control of trafficking in heroin from the source countries in Asia to markets in Europe and America. The same established heroin routes have also been increasingly used to smuggle cocaine from Latin American sources to Europe. Psychotropic substances illegally trafficked in the region continue to be mainly central nervous system stimulants, notably amphetamines and pemoline, in particular in West and Central Africa, as well as methaqualone, originating from India and trafficked to South Africa, Zambia and other countries in Eastern Africa. In its reports of 1996 and 1997, the International Narcotics Control Board drew attention to the excessive quantities of ephedrine imported by some African states. The following trafficking maps provide some indication of the extent of Africa s involvement in the network of international drug trafficking.
21
22 Seizures Data on drug seizures provide indications of the trafficking situation. Despite the difficulty of quantifying the significance of trafficking, owing to the nature of intelligence information and because seizure data reflect both drug trafficking and the emphasis of law enforcement efforts, statistics on seizures, particularly if observed over a longer period of time, reflect trafficking trends and facilitate the discovery of possible new developments. The following analysis and statistical presentations summarize data on annual seizure quantities of the main narcotic drugs and psychotropic substances, between 1986 and Further details are included in the Annex. In general, the volume of global seizures of most narcotic drugs and psychotropic substances increased during the last decade, along with their rise in production and manufacture. Some drugs are trafficked mainly within a particular region or limited number of countries, whereas others are more widespread. Trafficking of cannabis exceeds that of all other drugs in terms of quantity and geographical dispersion. The volume of global seizures of herbal cannabis fluctuated widely over the last ten years. A breakdown by subregion reveals that North-America (Canada, Mexico and USA) seized approximately half of the global volume in recent years. In 1996, Africa (particularly South Africa), South-America (mainly Colombia) and Western Europe took similar shares, of an average 12% each, in the global seizures of herbal cannabis. Previously, seizures in Africa fluctuated widely; South-America seemed to follow a decreasing trend, while significant seizure quantities in Western Europe have been recorded only in recent years, mainly due to high seizure reports from Netherlands. As for the ranking of countries, Colombia, which used to seize the largest quantities ten years ago, has since noted a decrease, while Mexico s seizures were rising over the same period of time and reached an immense record in South Africa and USA continue to rank among countries with the largest annual seizure quantities of herbal cannabis. Canada has reached similar figures only since The Netherlands reflected a decline in 1996, but still holds the highest seizure record in Western Europe. During the same year, Belgium, France and Spain reported an increase. Global annual seizures of cannabis resin total only one-third of those for herbal cannabis. The trend in seizures of cannabis resin reflects a sharp increase over the last ten years. The average annual volume seized since the early 1990s is more than double the average seizure quantity of the 1980s. Western Europe and the Near and Middle East account for the largest seizure volumes, followed by Africa and North America. Countries within these subregions which record the highest quantities include Pakistan, Spain and Morocco. Pakistan s seizures remained more or less stable over the last decade, while trends in Spain reflected a steady increase and reached the level of Pakistan in recent years. Seizures in Morocco were slightly lower and followed a similar growth rate to that of Spain. Additional countries that seized significant quantities in 1996 include, in order of the volume of drug seized, the United Kingdom, Belgium, France, Canada, Kenya, United States of America, Turkey, the Netherlands and Sri Lanka.
23 More than 80% of the global seizures of opium (raw and prepared) are made in Iran, Islamic Rep. The drug mainly originates from Afghanistan, a major source country, and is widely trafficked within the region. Iran, Islamic Rep., recorded a sharp increase of opium seizures during the 1990s with the trend still rising. The peak in global opium seizures in 1995 was mainly attributable to a unique seizure record in Pakistan. On average, other countries in the region, such as China, India and Pakistan, and increasingly countries in Central Asia, including Tajikistan and Kyrgyzstan, together account for over 10% of global seizures. The Near and Middle East subregion (particularly Iran, Islamic Rep., and Pakistan) also accounts for the largest quantity of heroin and morphine seizures. However, other regions also take significant shares of global seizures, including Western Europe (mainly Turkey) and East/South-East Asia. Heroin/morphine seizures were steadily rising over the last decade, but seem to have stabilized in recent years. The peak in 1993 was due to a unique seizure record in Iran, Islamic Rep. In addition, the following countries reported significant seizures of heroin/morphine in recent years: East/South-East and South Asia: China, India, Thailand; North America: USA; Western Europe: Italy, Germany, United Kingdom. Global cocaine seizures were sharply rising until 1991 but have subsequently stabilized. The USA takes the largest share in the global seizures, followed by Colombia, Mexico and Peru. All three countries more or less reflected a similar trend during the last ten years, which broadly mirrored the global pattern. Additionally, most countries in the Americas continue to record relatively large cocaine seizures. The Americas account for 90% of the global seizure volume. The only other region in the world that reports significant seizures, though to a lesser extent, remains Western Europe. In 1996, Spain reported a sharp increase in cocaine seizures. In the ARQ, part III, information on seizures of the following psychotropic substances is collected: Stimulants, Methaqualone, other depressants, LSD and other hallucinogens. Seizures of stimulants increased significantly in 1996, which was mainly due to a seizure record in the United Kingdom. The country accounted for more than half of the global seizures for that year. LSD continues to be widely trafficked in a large number of mainly developed countries. The global seizures of LSD, which were relatively low between 1993 and 1995, increased in Methaqualone is mainly seized in India and, to a lesser extent, in countries in South-East Africa, particularly South Africa. However, in 1996, seizures of methaqualone dropped significantly compared to previous years, when figures were steadily rising. Some reports related to information on trafficking in Africa suggest that methaqualone may be being increasingly replaced by other drugs, such as cocaine. (Further details on seizures of narcotic drugs and psychotropic substances are included in the Annex.) The following graphical presentations provide an overview, per page, on seizures of herbal cannabis, cannabis resin, opium, heroin/morphine, cocaine, stimulants, methaqualone and LSD.
24 Seizures: Herbal cannabis Figure 7. Global trend, Breakdown by subregion (in metric tonnes) Other regions Western Europe South America Africa North America Table 3. Countries ranked in order of volume of drug seized, (in metric tonnes) Country Colombia , Mexico ,015.8 South Africa , USA Other countries of the world , , , , Total 2, , , , , , , , , , ,523.6 Figure 8. Trends of the three highest ranking countries, (in metric tonnes) 1, , , Colombia Mexico South Africa Figure 9. Countries ranked in order of volume of drug seized, 1996 (in proportion of total quantity seized worldwide) Mexico 40.3% Colombia South Africa Canada USA 9.5% 8.1% 7.0% 5.2% Netherlands 3.3%
25 Seizures: Cannabis resin Other regions North America Africa Near and Middle East Western Europe Figure 10. Global trend, Breakdown by subregion (in metric tonnes) 0 Table 4. Countries ranked in order of volume of drug seized, (in metric tonnes) Country Pakistan Spain Morocco Netherlands Other countries of the world Total , Figure 11. Trends of the three highest ranking countries, (in metric tonnes) Pakistan Morocco Spain Figure 12. Countries ranked in order of volume of drug seized, 1996 (in proportion of total quantity seized worldwide) Spain Spain Pakistan Pakistan United Kingdom 8.7% United Kingdom 8.7% Morocco 8.0% Morocco Belgium 6.1% 8.0% Belgium France 4.4% 6.1% 23.7% 23.7% 30.5% 30.5% France %
26 Seizures: Opium raw and prepared Figure 13. Global trend, Breakdown by subregion (in metric tonnes) Near and Middle East Other regions - Table 5. Countries ranked in order of volume of drug seized, (in metric tonnes) Country Iran, Islamic Rep Pakistan India Afghanistan Other countries of the world Total Figure 14. Trends of the three highest ranking countries, (in metric tonnes) Iran, Islamic Rep. Pakistan India Figure 15. Countries ranked in order of volume of drug seized, 1996 (in proportion of total quantity seized worldwide) Iran, Islamic Rep. Pakistan Tajikistan India China 4.3% 2.0% 1.7% 1.0% 86.6% Kyrgyzstan 0.9%
27 Seizures: Heroin and Morphine Other regions North America East and South-East Asia Western Europe Near and the Middle East Figure 16. Global trend, Breakdown by subregion (in metric tonnes) Table 6. Countries ranked in order of volume of drug seized, (in metric tonnes) Country Iran, Islamic Rep Pakistan Turkey China Other countries of the world Total Figure 17. Trends of the three highest ranking countries, (in metric tonnes) Iran, Islamic Rep. Pakistan Turkey Figure 18. Countries ranked in order of volume of drug seized, 1996 (in proportion of total quantity seized worldwide) Iran, Islamic Rep. Pakistan Turkey China 11.3% 14.6% 13.9% 28.0% United Kingdom 3.2% India 3.1%
28 Seizures: Cocaine Other regions Central America Western Europe South America North America Figure 19. Global trend, Breakdown by subregion (in metric tonnes) Table 7. Countries ranked in order of volume of drug seized, (in metric tonnes) Country USA Colombia Mexico Peru Other countries of the world Total Figure 20. Trends of the three highest ranking countries, (in metric tonnes) USA Colombia Mexico Figure 21. Countries ranked in order of volume of drug seized, 1996 (in proportion of total quantity seized worldwide) USA Colombia 14.5% 39.2% Mexico Peru Spain 4.4% 7.6% 6.2% Ecuador 3.0%
29 Seizures: Stimulants Figure 22. Global trend, Breakdown by subregion (in millions of doses *) Other regions North America East and South-East Asia Western Europe Table 8. Countries ranked in order of volume of drug seized, (in millions of doses *) Country United Kingdom Egypt Thailand USA Other countries of the world Total (*) Doses = Millions of doses or equivalent calculated at the rate of 1 dose = 100mg Figure 23. Trends of the three highest ranking countries, (in millions of doses * ) United Kingdom Egypt Thailand Figure 24. Countries ranked in order of volume of drug seized, 1996 (in proportion of total quantity seized worldwide) United Kingdom China USA Philippines 10.9% 10.0% 9.5% 51.1% Thailand 5.4% Japan 4.4%
30 Seizures: Methaqualone Figure 25. Global trend, Breakdown by subregion (in millions of doses *) South Asia Africa 0 Table 9. Countries ranked in order of volume of drug seized, (in millions of doses *) Country India Zambia South Africa Philippines Other countries of the world Total (*) Doses = Millions of doses or equivalent calculated at the rate of 1 dose = 250mg Figure 26. Trends of the three highest ranking countries, (in millions of doses *) India Zambia South Africa Figure 27. Countries ranked in order of volume of drug seized, 1996 (in proportion of total quantity seized worldwide) India 91.1% South Africa Uganda USA Indonesia 5.9% 1.4% 0.8% 0.5% Zambia 0.1%
31 Seizures: LSD Figure 28. Global trend, Breakdown by subregion (in thousand of doses *) Other regions North America Oceania South America Western Europe Table 10. Countries ranked in order of volume of drug seized, (in thousand of doses *) Country Brazil Australia Canada Germany Other countries of the world 14, , , , , , , , , , ,694.8 Total 14, , , , , , , , , , , Figure 29. Trends of the three highest ranking countries, (in thousand of doses *) Brazil Canada Australia Figure 30. Countries ranked in order of volume of drug seized, 1996 (in proportion of total quantity seized worldwide) Australia 45.9% Canada 18.4% Saudi Arabia Japan 13.8% 13.0% USA 7.3% United Kingdom 0.8% (*) Doses = Thousands of doses or equivalent calculated at the rate of 1000 doses = 50mg
32 Key areas: seizures of herbal cannabis in tonnes, 1996 Canada European Union Eastern Europe United States of America Kazakhstan Islamic Republic of Iran Morocco China Mexico Caribbean Egypt Nepal Saudi Arabia Hongkong Colombia Venezuela India Thailand Guatemala Panama Brazil Nigeria Kenya Sri Lanka Philippines Zambia Malawi 2-9 Paraguay Zimbabwe Madagascar Oceania Lesotho Argentina South Africa more than 750 Note: The boundaries and names shown and the designations used on this map do not imply official endorsement or acceptance by the United Nations.
33 Key areas: seizures of cannabis resin in tonnes, 1996 Canada European Union Eastern Europe Kazakhstan United States of America Morocco Syrian Arab Republic Lebanon Pakistan Nepal Oman Kenya India Sri Lanka more than 300 Note: The boundaries and names shown and the designations used on this map do not imply official endorsement or acceptance by the United Nations.
34 Key areas: seizures of heroin and morphine in kilogrammes, 1996 Eastern Europe European Union United States of America Turkey Islamic Republic of Iran Pakistan China Hong Kong Mexico Saudi Arabia Myanmar Colombia India Thailand Malaysia Singapore more than Note: The boundaries and names shown and the designations used on this map do not imply official endorsement or acceptance by the United Nations.
35 Key areas: seizures of cocaine in kilogrammes, 1996 Canada United States of America European Union Eastern Europe Mexico Guatemala Costa Rica Caribbean Belize Honduras Columbia Venezuela Panama Suriname Ecuador Peru Brazil more than Chile Bolivia Argentina Note: The boundaries and names shown and the designations used on this map do not imply official endorsement or acceptance by the United Nations.
36 III. PRICES AND VALUE Illicit drugs, just as with other commodities, have a market and are subject to its particular dynamics and instabilities. Prices are among the most complex indicators of a market, reflecting an interaction of supply and demand, competition, risk, etc. An additional complicating factor in the case of illicit drugs is their illegality/ black market structure and its suppressive features. As mentioned earlier in the document, prices of drugs are differentiated between farmgate and wholesale/retail price. Prices of drugs are, inter alia, an indication of risk in cultivation and trafficking (due to law enforcement), the quality of the substance and the interaction between supply and demand. The value of drug is the product of net production and farmgate price and represents the potential gross income made by farmers in a particular region/country with the volume of drug produced. In the following statistics, prices of drugs in Asia and Latin America are expressed in US$ equivalent. In tables and graphics that demonstrate a trend over the last ten years, additional factors such as inflation rate have been taken into account (constant US$). Prices of drugs that vary between regions within countries are expressed as an average. Farmgate level: Opium Farmgate prices of opium in Asia reported for 1996 varied between US $50 and more than $600 per kilogramme. This price difference seems to be caused, inter alia, by a different quality of drugs produced in each country/region. The opium produced in the Near and Middle East is generally considered as of lower quality, which was reflected in a low price of $ On the other hand, the higher quality opium in East/South-East Asia has a price of $ A similar price gap between the two subregions also existed in previous years. (See table 11 and fig. 32) Average opium prices for Asia reflected a threefold increase in 1996 compared to ten years ago. While the price for opium in most countries, and as an average in Asia, seemed to remain relatively stable between 1986 and 1992/93, a sharp rise was observed only between 1994 and 1996 (especially in East/South-East Asia). (See table 11 and fig. 31). The reason for this price increase may be a combination of various factors, one of which is assumed to be the stagnation in production in recent years; this, however, would imply that demand was constantly increasing over the last ten years, since price tends to correlate with demand and supply. In comparison, prices of opium in Colombia are still higher than the average farmgate price in Asia, despite a severe drop in the early 1990s (see fig. 33). Opium prices in Colombia are currently at the level of Thailand and Vietnam, twice as high as those in Lao PDR and Myanmar and ten times those in Afghanistan and Pakistan. (Data on prices of opium in Mexico are not available.) A correlation of the development in opium prices (at the producer s level) with the
Drug Prices Report Opioids Retail and wholesale prices * and purity levels,by drug, region and country or territory (prices expressed in US$ )
") 1 / 11 Region/Subregion/ Country Africa Eastern Africa Kenya Madagascar Mauritius Uganda United Republic of Tanzania Northern Africa Algeria Egypt Libya Morocco Sudan Southern Africa Botswana Burkina Faso
1 / 11 Region/Subregion/ Country Africa Eastern Africa Kenya Madagascar Mauritius Uganda United Republic of Tanzania Northern Africa Algeria Egypt Libya Morocco Sudan Southern Africa Botswana Burkina Faso
Annual prevalence estimates of cannabis use in the late 1990s
 Cocaine abuse in most east European countries, by contrast, is still far less widespread and less of a problem. A majority of countries in eastern Europe either did not report on cocaine at all, or they
EMBARGOED UNTIL 22 JUNE PM CEST (GMT+2)
") FACT SHEET ON STATISTICS AND TRENDS IN ILLICIT DRUGS Global estimates of drug use All illicit drug use Problem drug use** Annual prevalence (%)* 5.3 (3.3-7.3) 0.6 (0.3-0.9) Number of users (millions)*
FACT SHEET ON STATISTICS AND TRENDS IN ILLICIT DRUGS Global estimates of drug use All illicit drug use Problem drug use** Annual prevalence (%)* 5.3 (3.3-7.3) 0.6 (0.3-0.9) Number of users (millions)*
Seizures of ATS (excluding ecstasy ), 2010
, 2010") Seizures of ATS (excluding ecstasy ), 2010 (countries and territories reporting seizures* of more than 10 kg) 9 5.1 8.7 12.9 Ghana Armenia 0.7 9.9 1 2.1 Syrian Arab Republic Korea (Republic of) Iraq Islamic
Seizures of ATS (excluding ecstasy ), 2010 (countries and territories reporting seizures* of more than 10 kg) 9 5.1 8.7 12.9 Ghana Armenia 0.7 9.9 1 2.1 Syrian Arab Republic Korea (Republic of) Iraq Islamic
Main developments in past 24 hours
 ECDC DAILY UPDATE Pandemic (H1N1) 2009 Update 02 October 2009, 09:00 hours CEST Main developments in past 24 hours Weekly Influenza Surveillance Overview to be published today; Media highlights and Eurosurveillance
Current State of Global HIV Care Continua. Reuben Granich 1, Somya Gupta 1, Irene Hall 2, John Aberle-Grasse 2, Shannon Hader 2, Jonathan Mermin 2
 Current State of Global HIV Care Continua Reuben Granich 1, Somya Gupta 1, Irene Hall 2, John Aberle-Grasse 2, Shannon Hader 2, Jonathan Mermin 2 1) International Association of Providers of AIDS Care
3.5 Consumption Annual Prevalence Opiates
 3.5 Consumption 3.5.1 Annual Prevalence 3.5.1.1 Opiates EUROPE Western and Central Europe OPIATES AMERICA Central America Estonia, 2004 1.5 Panama** 0.2 Luxembourg, 2000 0.9 Honduras*, 2005 0.2 Latvia,
THE CARE WE PROMISE FACTS AND FIGURES 2017
 THE CARE WE PROMISE FACTS AND FIGURES 2017 2 SOS CHILDREN S VILLAGES INTERNATIONAL WHERE WE WORK Facts and Figures 2017 205 58 79 families and transit 31 Foster homes 162 8 3 173 214 2 115 159 136 148
Tobacco: World Markets and Trade
 United States Department of Agriculture Foreign Agricultural Service Circular Series FT -09-05 Sep. 2005 List of Tables Tobacco: World Markets and Trade Table 2 U.S. Tobacco Trade: 2004-2005 Table 3 Unmanufactured
Terms and Conditions. VISA Global Customer Assistance Services
 Terms and Conditions VISA Global Customer Assistance Services Visa Global Customer Assistance Services (VGCAS) 1 The Visa Global Customer Assistance Services are co-ordinated by the Global Assistance Centre
The Drugs Scenario - Global, Regional and National
 The Drugs Scenario - Global, Regional and National 1. The growing demand for narcotic drugs and psychotropic substances in the world is being met by an increase in their production through a proliferation
PREFACE. Antonio Maria Costa Executive Director United Nations Office on Drugs and Crime
 EXECUTIVE SUMMARY GLOBAL ILLICIT DRUG TRENDS 2003 PREFACE At the twentieth special session of the General Assembly in, States Members agreed to make significant progress towards the control of supply
Global EHS Resource Center
 Global EHS Resource Center Understand environmental and workplace safety requirements that affect your global operations. 800.372.1033 bna.com/gelw Global EHS Resource Center This comprehensive research
מדינת ישראל. Tourist Visa Table
 Updated 23/05/2017 מדינת ישראל Tourist Visa Table Tourist visa exemption is applied to national and official passports only, and not to other travel documents. Exe = exempted Req = required Press the first
מדינת ישראל. Tourist Visa Table. Tourist visa exemption is applied to national and official passports only, and not to other travel documents.
 Updated 25/05/2015 ישראל Tourist Visa Table Tourist visa exemption is applied to national and official passports only, and not to other travel documents. (C) Bearers of official passports requiring tourist
Economic and Social Council
 United Nations Economic and Social Council Distr.: General 17 December 2003 E/CN.3/2004/6 Original: English Statistical Commission Thirty-fifth session 2-5 March 2004 Item 3 (e) of the provisional agenda*
Lima - Peru, August 18-22, 2014
 2014 GLOBAL SYNTHETIC DRUGS ASSESSMENT Amphetamine-type stimulants and new psychoactive substances Lima - Peru, August 18-22, 2014 Juan Carlos Araneda Ferrer Project Coordinator Global SMART Programme
REGIONAL HIGHLIGHTS AFRICA AMERICAS. Central America and the Caribbean. INTERNATIONAL NARCOTICS CONTROL BOARD Report 2017
 REGIONAL HIGHLIGHTS AFRICA Increase in drug use: while Africa remains a key transit region for drug trafficking, the use of various types of drugs, including cocaine, opioids, amphetamine-type stimulants,
Drug Money: the illicit proceeds of opiates trafficked on the Balkan route. Executive summary
 Drug Money: the illicit proceeds of opiates trafficked on the Balkan route Executive summary 2015 Executive summary The cultivation, production and trafficking of illicit opiates accounted for almost
APPENDIX II - TABLE 2.3 ANTI-TOBACCO MASS MEDIA CAMPAIGNS
 WHO REPORT ON THE GLOBAL TOBACCO EPIDEMIC, 2011 APPENDIX II - TABLE 2.3 ANTI-TOBACCO MASS MEDIA CAMPAIGNS (SEE TABLE 4.9) Africa The Americas South-East Asia Europe Eastern Mediterranean Western Pacific
ADMINISTRATIVE AND FINANCIAL MATTERS. Note by the Executive Secretary * CONTENTS. Explanatory notes Tables. 1. Core budget
 UNITED NATIONS Distr. GENERAL 13 October 1997 ENGLISH ONLY SUBSIDIARY BODY FOR IMPLEMENTATION Seventh session Bonn, 20-29 October 1997 Item 9 of the provisional agenda ADMINISTRATIVE AND FINANCIAL MATTERS
References to Argentina Part 1 RECENT STATISTICS AND TREND ANALYSIS OF ILLICIT DRUG MARKETS
 References to Argentina Part 1 RECENT STATISTICS AND TREND ANALYSIS OF ILLICIT DRUG MARKETS A. EXTENT OF ILLICIT DRUG USE AND HEALTH CONSEQUENCES The global picture Cocaine In 2010, the regions with a
CND UNGASS FOLLOW UP
 CND UNGASS FOLLOW UP INCB follow-up activities on Chapter 2. Operational recommendations on ensuring the availability of and access to controlled substances exclusively for medical and scientific purposes,
CALLING ABROAD PRICES FOR EE SMALL BUSINESS PLANS
 CALLING ABROAD PRICES FOR EE SMALL BUSINESS PLANS More information about out-of-bundle charges for our small business customers calling internationally from the UK using a small business price plan Page
World Health organization/ International Society of Hypertension (WH0/ISH) risk prediction charts
 risk prediction charts") World Health organization/ International Society of Hypertension (WH0/ISH) risk prediction charts (charts in colour) (These charts will be updated in 2014) 2 1. Introduction 2. Instructions on how to use
World Health organization/ International Society of Hypertension (WH0/ISH) risk prediction charts (charts in colour) (These charts will be updated in 2014) 2 1. Introduction 2. Instructions on how to use
Part 1 RECENT STATISTICS AND TREND ANALYSIS OF ILLICIT DRUG MARKETS A. EXTENT OF ILLICIT DRUG USE AND HEALTH CONSEQUENCES
 References to Brazil Part 1 RECENT STATISTICS AND TREND ANALYSIS OF ILLICIT DRUG MARKETS A. EXTENT OF ILLICIT DRUG USE AND HEALTH CONSEQUENCES The global picture Cocaine In 2010, the regions with a high
Executive Summary. 1. Trends in World Drug Markets
 1. Trends in World Drug Markets 1.1 Overview Evolution of the world drug problem The world s drug problem is being contained. In 2005/06, the global markets for the main illicit drugs the opiates, cocaine,
WORLD DRUG REPORT 2011
 WORLD DRUG REPORT 2011 EXECUTIVE SUMMARY Global developments in illicit drug consumption, production and trafficking Consumption Globally, UNODC estimates that, in 2009, between 149 and 272 million people,
1.1 Overview Evolution of the World Drug Problem
 1.1 Overview 1.1.1 Evolution of the World Drug Problem Vigilance is needed to respond to year-onyear expansion in some market sectors The long-term stabilization which occurred in drug markets continued
Prices. Peru, potential cocaine production (mt), 1994 to Peru, monthly farm-gate prices of sun-dried coca leaf and coca paste (US$/kg)
, 1994 to Peru, monthly farm-gate prices of sun-dried coca leaf and coca paste (US$/kg)") World Drug Report 2009 Metric tons Peru, potential cocaine production (mt), 1994 to 2008 Sources: US Dept. of State (1994-1999), National monitoring system supported by UNODC (since 2000) based on conversion
World Drug Report 2009 Metric tons Peru, potential cocaine production (mt), 1994 to 2008 Sources: US Dept. of State (1994-1999), National monitoring system supported by UNODC (since 2000) based on conversion
Country-wise and Item-wise Exports of Animal By Products Value Rs. Lakh Quantity in '000 Unit: Kgs Source: MoC Export Import Data Bank
 Country-wise and Item-wise Exports of Animal By Products Value Rs. Lakh Quantity in '000 Unit: Kgs Source: MoC Export Import Data Bank Country CAPEXIL Description HS Code Value 2010-2011 Quantity 2010-2011
WELLNESS COACHING. Wellness & Personal Fitness Solution Providers
 WELLNESS COACHING Wellness & Personal Fitness Solution Providers Introducing Ourselves... We are Personal Wellness Coaches 2 We help people look and feel better by: - Educating on proper nutrition (80%)
World Drug Report 2017
 World Drug Report 2017 DEMAND Global trends in estimated number of drug users and people with drug user disorders, 2006-2015 Global trends in the estimated prevalence of drug use and prevalence of people
1. Background 2. The Big Picture 3. Global trends 4. Regional trends E/SE Asia 5. Effective responses
 Simultaneous launches: Vienna and Bangkok 13 Sep 2011 1. Background 2. The Big Picture 3. Global trends 4. Regional trends E/SE Asia 5. Effective responses The international drug control system 1. Based
World Drug Report 2008: Paraguay
 World Drug Report 2008: Paraguay p. 73 Seizures fell in South America and the Caribbean in 2006 Large seizures in South America are also undertaken by Venezuela (39 mt), Ecuador (34 mt), Peru (19 mt) and
Undetectable = Untransmittable. Mariah Wilberg Communications Specialist
 Undetectable = Untransmittable Mariah Wilberg Communications Specialist Undetectable=Untransmittable PLWH who get and stay undetectable have effectively no risk of transmitting HIV to their sex partners
Eligibility List 2018
 The Global Fund s 2017-2022 strategy and allocation-based approach enables strategic investment to accelerate the end of HIV/AIDS, tuberculosis and malaria and build resilient and sustainable systems for
1.6 Amphetamine-type stimulants
 1.6 Amphetamine-type stimulants 1.6.1 Production Global ATS production estimated at some 48 metric tons The group of amphetamine-type stimulants (ATS) encompasses amphetamines (amphetamine, methamphetamine),
ICM: Trade-offs in the fight against HIV/AIDS
 ICM: Trade-offs in the fight against HIV/AIDS 1 As the HIV/AIDS pandemic enters its 25 th year, both the number of infections and number of deaths due to the disease continue to rise. Despite an enormous
The Single Convention on Narcotic Drugs- Implementation in Six Countries: Albania, Bangladesh, India, Kyrgyzstan, Sri Lanka, Ukraine
 The Single Convention on Narcotic Drugs- Implementation in Six Countries: Albania, Bangladesh, India, Kyrgyzstan, Sri Lanka, Ukraine A MONOGRAPH PREPARED FOR: International Pain Policy Fellowship Training
Drug Use Around the World
 Special Agents U.S. DRUG ENFORCEMENT AGENCY STAFFING AND BUDGETS 1975 2000 10000 5000 Total Employees 8000 6000 4000 3000 2000 4000 1975 1980 1985 1990 1995 2000 1000 1975 1980 1985 1990 1995 2000 Support
E. COCAINE: OVERVIEW. Cultivation and production. Seizures
 34 1. RECENT STATISTICS AND TREND ANALYSIS OF THE ILLICIT DRUG MARKET limited data are available. In Afghanistan, a survey in urban households showed that over half the women surveyed who reported opioid
ESPEN Congress Geneva 2014 FOOD: THE FACTOR RESHAPING THE SIZE OF THE PLANET
 ESPEN Congress Geneva 2014 FOOD: THE FACTOR RESHAPING THE SIZE OF THE PLANET Buy 2 and take 3: are we benefitting from cheaper food? P. Marques-Vidal (CH) Pedro Marques-Vidal Department of Internal Medicine
Maternal Deaths Disproportionately High in Developing Countries
 EMBARGOED until Monday, 20 October, 6am GMT HQ/2003/24 20 October 2003 CF/DOC/PR/2003-82 Maternal Deaths Disproportionately High in Developing Countries African women are 175 times more likely to die in
INTERNATIONAL NARCOTICS CONTROL BOARD Annual Report Press Release No. 3
 page 1 REGIONAL HIGHLIGHTS Africa A particularly worrisome development in Africa is the large-scale trafficking in cocaine. Both the number of couriers apprehended and the volume of bulk seizures of cocaine
Introduction Overview of the status quo
 Introduction Whenever we learn that a government has prohibited the use or sale of certain goods, there is one thing we can be sure of - sooner or later, people willing to break the law will take advantage
Country Length Discount Travel Period Anguilla All 20% off 08/24/11 12/15/11 Antigua All 20% off 08/24/11 12/15/11 Argentina All 20% off 08/24/11
 Country Length Discount Travel Period Anguilla All 20% off 08/24/11 12/15/11 Antigua All 20% off 08/24/11 12/15/11 Argentina All 20% off 08/24/11 12/15/11 Aruba All 20% off 08/24/11 12/15/11 Australia
FRAMEWORK CONVENTION ALLIANCE BUILDING SUPPORT FOR TOBACCO CONTROL. Smoke-free. International Status Report
 FRAMEWORK CONVENTION ALLIANCE BUILDING SUPPORT FOR TOBACCO CONTROL Smoke-free Environments International Status Report As December, 00 Smoke-free environments are a vital part combating the global tobacco
Fellowships in nuclear science and technology: Applying the knowledge
 Fellowships in nuclear science and technology: Applying the knowledge Nearly 1200 scientists, engineers, and specialists receive training each year under IAEA-supported fellowships and scientific visits
1.3 Coca / Cocaine Market
 1.3 Coca / Cocaine Market 1.3.1 Summary Trend Overview Although the coca/cocaine market is stable overall, it has experienced considerable fluctuations over the 26/7 period. On the supply side, coca cultivation
Copyright 2011 Joint United Nations Programme on HIV/AIDS (UNAIDS) All rights reserved
 All rights reserved") UNAIDS DATA TABLES 2011 Copyright 2011 Joint United Nations Programme on HIV/AIDS (UNAIDS) All rights reserved UNAIDS / JC2225E The designations employed and the presentation of the material in this publication
UNAIDS DATA TABLES 2011 Copyright 2011 Joint United Nations Programme on HIV/AIDS (UNAIDS) All rights reserved UNAIDS / JC2225E The designations employed and the presentation of the material in this publication
World Connections Committee (WCC) Report
 Report") World Connections Committee (WCC) Report 06 Co-Dependents Anonymous Service Conference Countries Where CoDA Exists This report reflects the World Connections Committee (WCC) support of the growth and development
World Connections Committee (WCC) Report 06 Co-Dependents Anonymous Service Conference Countries Where CoDA Exists This report reflects the World Connections Committee (WCC) support of the growth and development
EU Market Situation for Poultry. Committee for the Common Organisation of the Agricultural Markets 20 April 2017
 EU Market Situation for Poultry Committee for the Common Organisation of the Agricultural Markets 2 April 217 -9.% -11.% -5.% -.1% -.7% -2.2% 3.% 1.7% 1.2%.8%.6%.%.%.% 7.9% 7.% 6.4% 6.2% 6.% 5.5% 5.3%
Global Measles and Rubella Update. April 2018
 Global Measles and Rubella Update April 218 Measles Number of Reported Measles by WHO Regions 218 Region Member States* Suspected cases Measles cases Clin Epi Lab Jan Feb Mar Apr May Jun Jul Aug Sep Oct
C. CANNABIS MARKET. Global cannabis cultivation and production
 24 1. RECENT STATISTICS AND TREND ANALYSIS OF ILLICIT DRUG MARKETS from Thailand and Uganda also indicate trafficking of amphetamine from West Africa via Ethiopia, raising the possibility of a parallel
WELLNESS COACHING. Wellness & Personal Fitness Solution Providers NZ & Australia
 WELLNESS COACHING Wellness & Personal Fitness Solution Providers NZ & Australia Introducing Ourselves... We are Personal Wellness Coaches 2 We help people look and feel better by: - Educating on proper
Annex 2 A. Regional profile: West Africa
 Annex 2 A. Regional profile: West Africa 355 million people at risk for malaria in 215 297 million at high risk A. Parasite prevalence, 215 Funding for malaria increased from US$ 233 million to US$ 262
310,891 ha million. 526 tons 7,554 tons million. Global cultivation. Global seizures. Potential production. Global number of users
 Opiates 41 G. MARKET ANALYSIS BY TYPE OPIATES Key figures Global cultivation change from previous year 5% 634 tons Global seizures five-year change 47% 5% Stable morphine opium heroin most recent estimate
ANNEX 3: Country progress indicators
 : progress indicators 541 : COUNTRY PROGRESS INDICATORS 2006 REPORT ON THE GLOBAL AIDS EPIDEMIC Annex 3 : COUNTRY PROGRESS INDICATORS As of March 2006, 115 countries had reported indicators on progress
Challenges and Opportunities to Optimizing the HIV Care Continuum Can We Test and Treat Enough People to Make a Seismic Difference by 2030?
 Challenges and Opportunities to Optimizing the HIV Care Continuum Can We Test and Treat Enough People to Make a Seismic Difference by 2030? Reuben Granich, MD, MPH Strategic and Scientific Advisor International
Recommended composition of influenza virus vaccines for use in the 2007 influenza season
 Recommended composition of influenza virus vaccines for use in the 2007 influenza season September 2006 This recommendation relates to the composition of vaccines for the forthcoming winter in the southern
Prohibition of importation, manufacturing and sale of Smokeless Tobacco products.
 Prohibition of importation, manufacturing and sale of Smokeless Tobacco products www.untobaccocontrol.org/kh/smokeless-tobacco/ BACKGROUND. Over the past decade, the WHO FCTC has served as a powerful tool
Royal Internal Congress. Colegio Real de Panamá. Security council. Drug traffic on a worldwide scale. Joshua Harris Moderador
 Royal Internal Congress Colegio Real de Panamá Security council Drug traffic on a worldwide scale Joshua Harris Moderador Gabriel Garcia Co-Moderador 5 y 6 de Octubre de 2017 1 Dear delegates, Welcome
Supplementary appendix
 Supplementary appendix This appendix formed part of the original submission and has been peer reviewed. We post it as supplied by the authors. Supplement to: Liyanage T, Ninomiya T, Jha V, et al. Worldwide
Presidential Determination -- Major Drug Transit or Major Illicit Drug Producing Countries for Fiscal Year 2017
 Obama Admits Mexico and Red China Play Major Roles in International Narcotics Trafficking to the United States The White House Office of the Press Secretary For Immediate Release September 12, 2016 Presidential
Appendix F. The Test-Curriculum Matching Analysis Science TIMSS 2011 INTERNATIONAL RESULTS IN SCIENCE APPENDIX F 479
 Appendix F The Test-Curriculum Matching Analysis Science TIMSS 2011 INTERNATIONAL RESULTS IN SCIENCE APPENDIX F 479 TIMSS went to great lengths to ensure that comparisons of student achievement across
Report 2016 REGIONAL HIGHLIGHTS AFRICA AMERICAS. Central America and the Caribbean INTERNATIONAL NARCOTICS CONTROL BOARD
 REGIONAL HIGHLIGHTS AFRICA Africa not only a trafficking hub: Africa continues to be one of the main drug trafficking transit regions: while the continent is a main transit region for drug trafficking,
Media Release. Inaugural study reveals that more than one in four women in European and Central Asian prisons locked up for drug offences
 Media Release Embargoed 00.01 CET Monday 12 th March 2012 Inaugural study reveals that more than one in four women in European and Central Asian prisons locked up for drug offences Up to 70 percent of
AGaRT The Advisory Group on increasing access to Radiotherapy Technology in low and middle income countries
 AGaRT The Advisory Group on increasing access to Radiotherapy Technology in low and middle income countries Together against Cancer The Advisory Group on Increasing Access to Radiotherapy To address the
: UNODC Cooperation on Drugs and Crime in the Islamic Republic of Iran
 History and Achievements 1999-2004: Beginning of UNODC Cooperation with the Islamic Republic of Iran The United Nations Office on Drugs and Crime in the Islamic Republic of Iran established a country office
Appendix F: Test-Curriculum Matching Analysis
 Appendix F: Test-Curriculum Matching Analysis TIMSS went to great lengths to ensure that comparisons of student achievement across countries would be as fair and equitable as possible. The TIMSS 2015 Assessment
Global Measles and Rubella Update November 2018
 Global Measles and Rubella Update November 218 Measles Number of Reported Measles by WHO Regions 218 Region Member States* Suspected cases Measles cases Clin Epi Lab Jan Feb Mar Apr May Jun Jul Aug Sep
Analysis of Immunization Financing Indicators from the WHO-UNICEF Joint Reporting Form (JRF),
,") Analysis of Immunization Financing Indicators from the WHO-UNICEF Joint Reporting Form (JRF), 2008-2010 Claudio Politi and Oumar Sagna Department of Immunization Vaccines and Biologicals, World Health
Analysis of Immunization Financing Indicators from the WHO-UNICEF Joint Reporting Form (JRF), 2008-2010 Claudio Politi and Oumar Sagna Department of Immunization Vaccines and Biologicals, World Health
International cooperation against the world drug problem. of human rights overrules the harm caused by drugs. Eradication of production and
 Forum: Issue: Student Officer: Position: General Assembly International cooperation against the world drug problem Elisa Barkan President Chair of General Assembly Introduction: Drugs are an extremely
Drug Trafficking and Abuse - Impediments to development - Akira Fujino United Nations Office on Drugs and Crime (UNODC)
") Drug Trafficking and Abuse - Impediments to development - Akira Fujino United Nations Office on Drugs and Crime (UNODC) Shanghai, 1909 Early days 1920s-30s Century of Drug Control BACKGROUND 19th century:
Drug Trafficking and Abuse - Impediments to development - Akira Fujino United Nations Office on Drugs and Crime (UNODC) Shanghai, 1909 Early days 1920s-30s Century of Drug Control BACKGROUND 19th century:
3.1 PHASE 2 OF THE GLOBAL PROJECT
 RESULTS CHAPTER 3 3.1 PHASE 2 OF THE GLOBAL PROJECT (1996 1999) This new report of the Global Project provides data on anti-tuberculosis drug resistance from 58 geographical settings. Of these, 28 provided
Economic and Social Council
 UNITED NATIONS Economic and Social Council Distr. GENERAL 1 March 1996 ORIGINAL: ENGLISH COMMISSION ON NARCOTIC DRUGS Thirty-ninth session Vienna, 16-25 April 1996 Item 5 of the provisional agenda* ILLICIT
References to Uruguay
 References to Uruguay Part 1 RECENT STATISTICS AND TREND ANALYSIS OF ILLICIT DRUG MARKETS A. EXTENT OF ILLICIT DRUG USE AND HEALTH CONSEQUENCES The global picture Regional trends in illicit drug use South
HPV Vaccines: Background and Current Status
 HPV Vaccines: Background and Current Status Bogota, Colombia, 2007 Jon Kim Andrus, MD HPV and Cervical Cancer Evidence that HPV is essential: Documented molecular studies of cervical cancer Case-control
Tipping the dependency
 BREAKING NEWS Meeting the investment challenge Tipping the dependency balance Domestic investments exceed international investments total reaching US$ 8.6 billion. 40 countries fund more than 70% of their
Annual prevalence estimates of amphetamines use in the late 1990s
 Estimates - Consumption Even though in the USA, the world s largest cannabis market, cannabis use increased slightly in compared to a year earlier (both annual and monthly prevalence rates were going upwards)
EMBARGOED UNTIL 26 JUNE AM EDT (5 PM CEST)
") B. COCAINE Global cultivation change from previous year 36% Global seizures change from previous year 23% most recent estimate () 213, ha coca bush = 298, x 1,129 tons cocaine purity as seized Global production
B. COCAINE Global cultivation change from previous year 36% Global seizures change from previous year 23% most recent estimate () 213, ha coca bush = 298, x 1,129 tons cocaine purity as seized Global production
The IB Diploma Programme Statistical Bulletin. November 2015 Examination Session. Education for a better world
 The IB Diploma Programme Statistical Bulletin November 2015 Examination Session Education for a better world TheIBDiplomaProgrammeStatisticalBuletin,November2015ExaminationSession. InternationalBaccalaureate
Hearing loss in persons 65 years and older based on WHO global estimates on prevalence of hearing loss
 Hearing loss in persons 65 years and older based on WHO global estimates on prevalence of hearing loss Mortality and Burden of Diseases and Prevention of Blindness and Deafness WHO, 2012 In 2012, WHO released
GLOBAL RepORt UNAIDS RepoRt on the global AIDS epidemic
 GLOBAL Report UNAIDS Report on the global AIDS epidemic 2012 Copyright 2012 Joint United Nations Programme on HIV/AIDS (UNAIDS) All rights reserved The designations employed and the presentation of the
Epidemiology of non medical use of prescription drugs. Kamran Niaz, Survey and Statistics Section, Policy Analysis and Research Branch
 Epidemiology of non medical use of prescription drugs Kamran Niaz, Survey and Statistics Section, Policy Analysis and Research Branch Monitoring of the drug use situation: Annual reports questionnaire
The Global S.M.A.R.T. Programme: Synthetics Monitoring: Analysis, Reporting and Trends. ATS trends, programme progress and planned expansion
 The Global S.M.A.R.T. Programme: Synthetics Monitoring: Analysis, Reporting and Trends ATS trends, programme progress and planned expansion Regional SMART Workshop, Bangkok, 5-6 August 2010 Beate Hammond,
Influenza Update N 176
 Update N 176 04 January 2013 Summary Reporting of influenza activity has been irregular in the past two weeks due to the holiday season in many countries. As a result, overall virus detections have dropped
WHO report highlights violence against women as a global health problem of epidemic proportions
 News release WHO/16 20 June 2013 EMBARGO: PLEASE DO NOT DISTRIBUTE OR PUBLISH BEFORE THURSDAY 20 JUNE 2013 AT 15H00 GENEVA TIME, 14H00 LONDON TIME, 13H00 GMT, AND 09H00 EST WHO report highlights violence
Various interventions for controlling sexually transmitted infections have proven effective, including the syndromic
 levels, as understaffing is a chronic issue in all the countries that are scaling up male circumcision. Current achievements notwithstanding, it is necessary to reinforce and strengthen national political
Overview of ATS trends in East and Southeast Asia
 Overview of ATS trends in East and Southeast Asia Presentation to Global SMART Programme Regional Workshop Shawn Kelley Research Analyst Global SMART Programme Phnom Penh, Cambodia 24 July 2012 Structure
Drug resistance TB in People Living with HIV: research questions and priorities.
 Drug resistance TB in People Living with HIV: research questions and priorities. Haileyesus Getahun, MD, PhD. Stop TB Department World Health Organisation Geneva, Switzerland Outline of presentation Definition
I. INTERDICTIONS OF ILLICIT DRUGS AND FIREARMS SMUGGLING IN 2008
 I. INTERDICTIONS OF ILLICIT DRUGS AND FIREARMS SMUGGLING IN 28 1. Number of Interdictions (1) Summary The number of interdictions for smuggling cases for illicit drugs in 28 was 293 (82% of the previous
MYANMAR. Emerging trends and concerns
 MYANMAR MYANMAR Emerging trends and concerns Myanmar remains a major source of methamphetamine pills and opiates in South-East Asia, most of which are manufactured in Shan State in the eastern part of
Launch of the INCB Annual Reports 2015
 Launch of the INCB Annual Reports 2015 Werner Sipp, INCB President 2 March 2016 1 The 3 Reports 2 Mandate of INCB Promote and monitor compliance with the 3 international drug control conventions by: Annual
WORLD DRUG REPORT 2004 WORLD DRUG REPORT. presented by Thomas Pietschmann UNODC, Research and Analysis Section
 WORLD DRUG REPORT 2004 presented by Thomas Pietschmann UNODC, Research and Analysis Section 1 OVERVIEW: ALL DRUGS CONSUMPTION 2 Estimates of annual prevalence of drug use at the global level in the late
Global Measles and Rubella Update October 2018
 Global Measles and Rubella Update October 218 Measles Number of Reported Measles Cases by WHO Regions 218 Region Member States* Suspected cases Measles cases Clin Epi Lab Jan Feb Mar Apr May Jun Jul Aug
STAT/SOC/CSSS 221 Statistical Concepts and Methods for the Social Sciences. Introduction to Mulitple Regression
 STAT/SOC/CSSS 1 Statistical Concepts and Methods for the Social Sciences Introduction to Mulitple Regression Christopher Adolph Department of Political Science and Center for Statistics and the Social