effects on organ development. a-f, Eye and wing discs with clones of ε j2b10 show no
|
|
|
- Hugh McBride
- 5 years ago
- Views:
Transcription
1
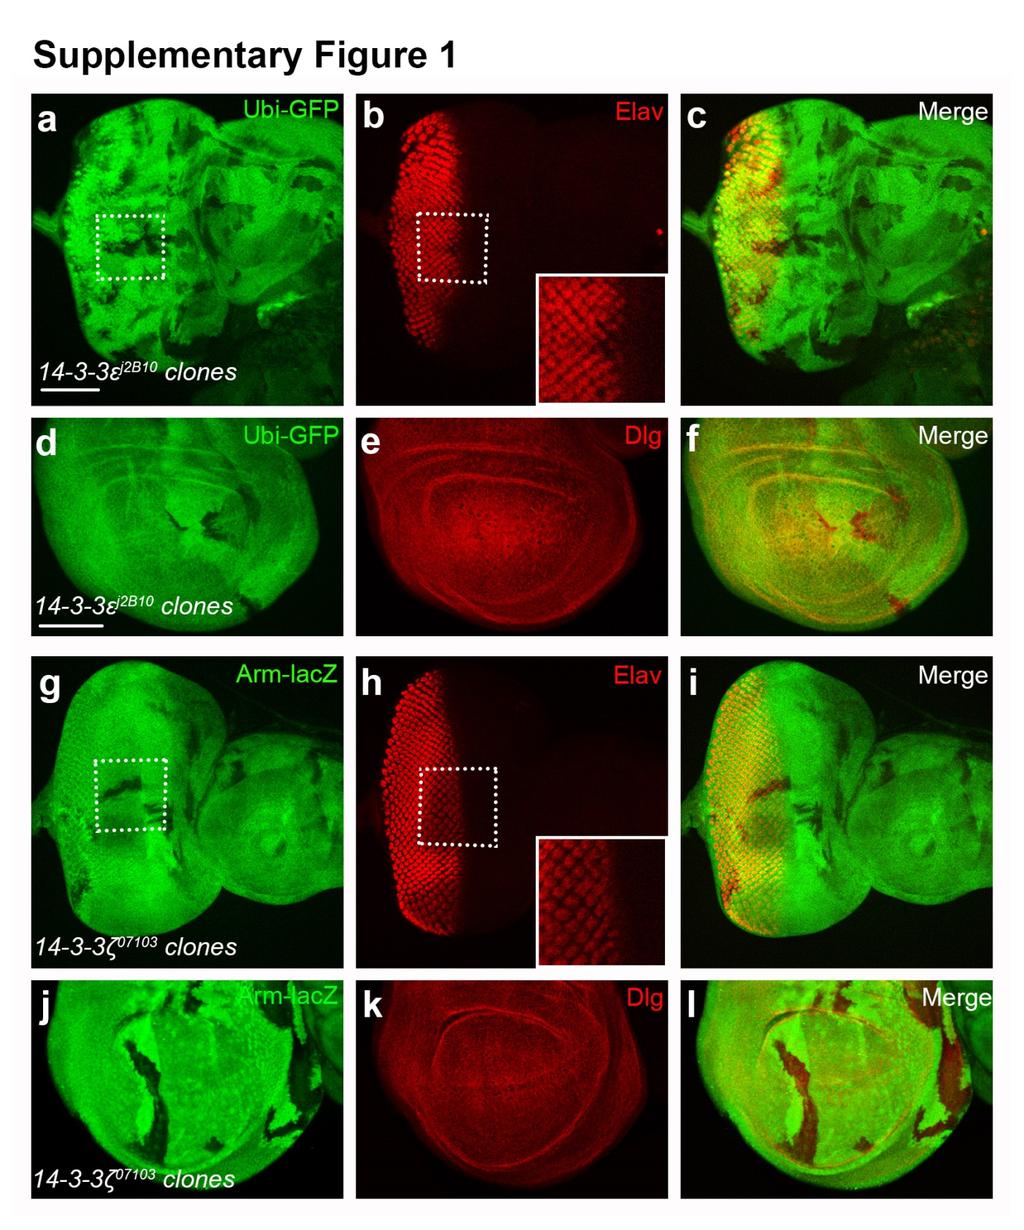
2 Supplementary Figure 1. Loss of function clones of or show no significant effects on organ development. a-f, Eye and wing discs with clones of ε j2b10 show no obvious defects in Elav and Dlg staining patterns, respectively. g-l, Eye and wing discs with clones of ζ develop normally with no obvious defects in Elav and Dlg patterns. Mutant clones were marked by loss of Ubi-GFP or Arm-lacZ, as indicated. Anti-Elav was used to mark differentiated neuronal cells in eye disc. Anti-Dlg was used to mark cell membrane in wing disc. Scale bar, 100 µm (a-c, g-i), 100 µm (d-f, j-l).
3
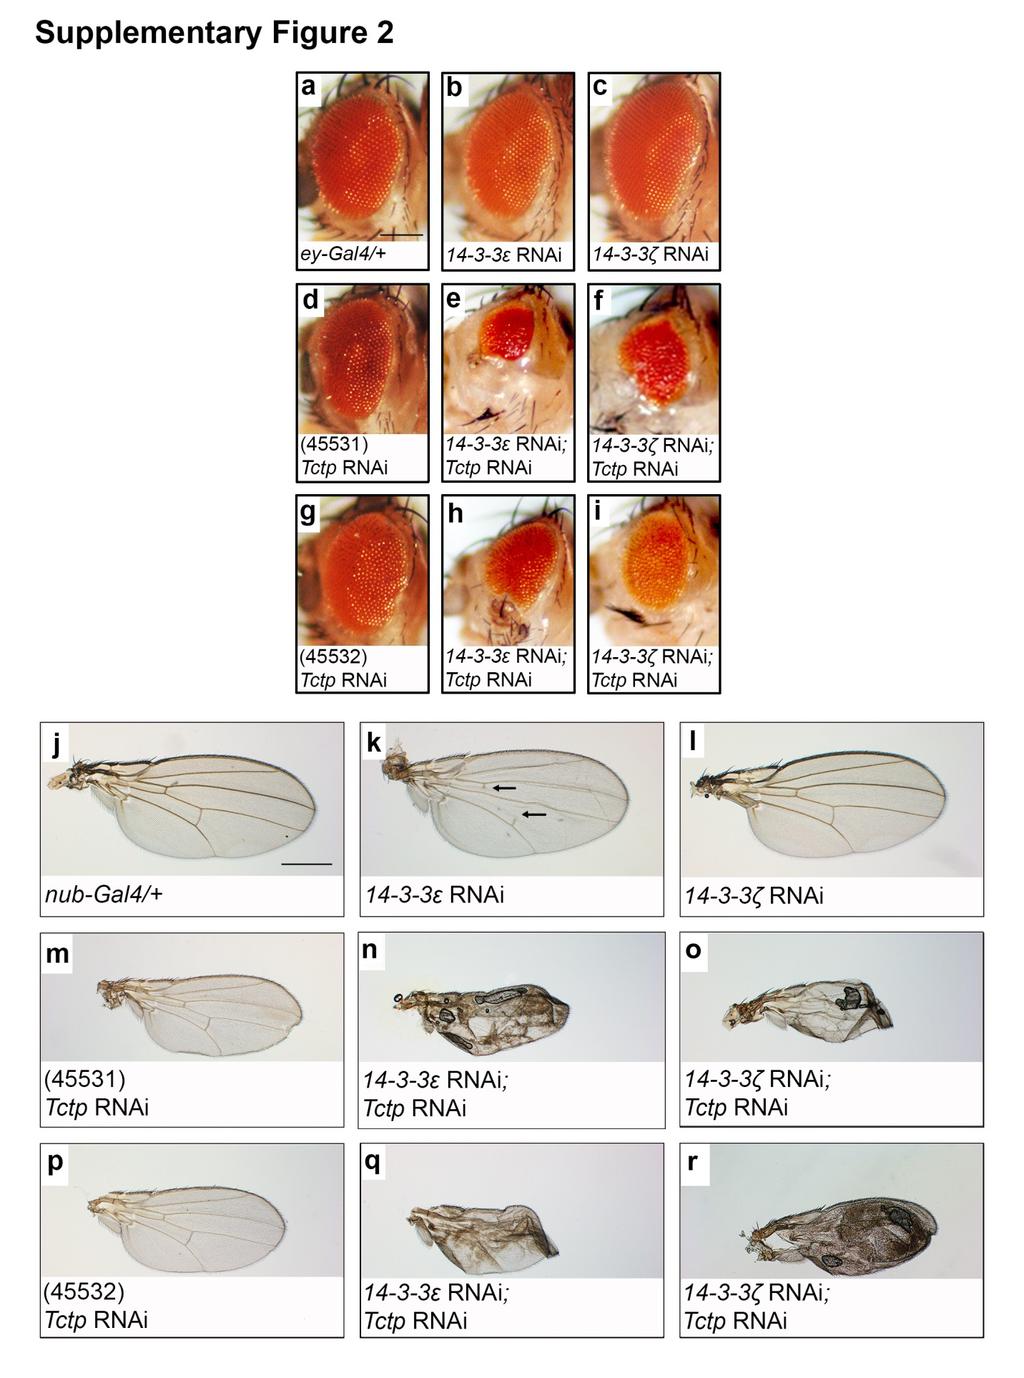
4 Supplementary Figure 2. Genetic interaction between Tctp with s with two different Tctp RNAi lines. a-i, Genetic interaction between Tctp and in adult eye. a, Adult fly with one copy of ey-gal4 shows normal eye. b-c, Knockdown of ε (b) or ζ (c) alone does not affect eye. d, Knockdown of Tctp using v45531 RNAi line (VDRC) results in small eye phenotype. e-f, Knockdown of both Tctp and ε (e) or ζ (f) strongly enhances the eye phenotype caused by Tctp RNAi alone. g-i, v45532 RNAi line (VDRC) gives similar results with v j-r, Genetic interaction between Tctp and in wing. j, Control wing with one copy of nub-gal4 is normal. k, Knockdown of ε affects the anterior and posterior cross veins (black arrows), but has no effect on wing size. l, Knockdown of ζ does not affect wing development. m, Tctp RNAi (v45531) results in mildly reduced and curled wing. n-o, Double knockdown of Tctp and ε (n) or ζ (o) enhances the Tctp RNAi phenotypes. p-r, Similar results are obtained with Tctp RNAi line v45532 (VDRC). Scale bar, 200 µm (a-i), 400 µm (j-r).
5
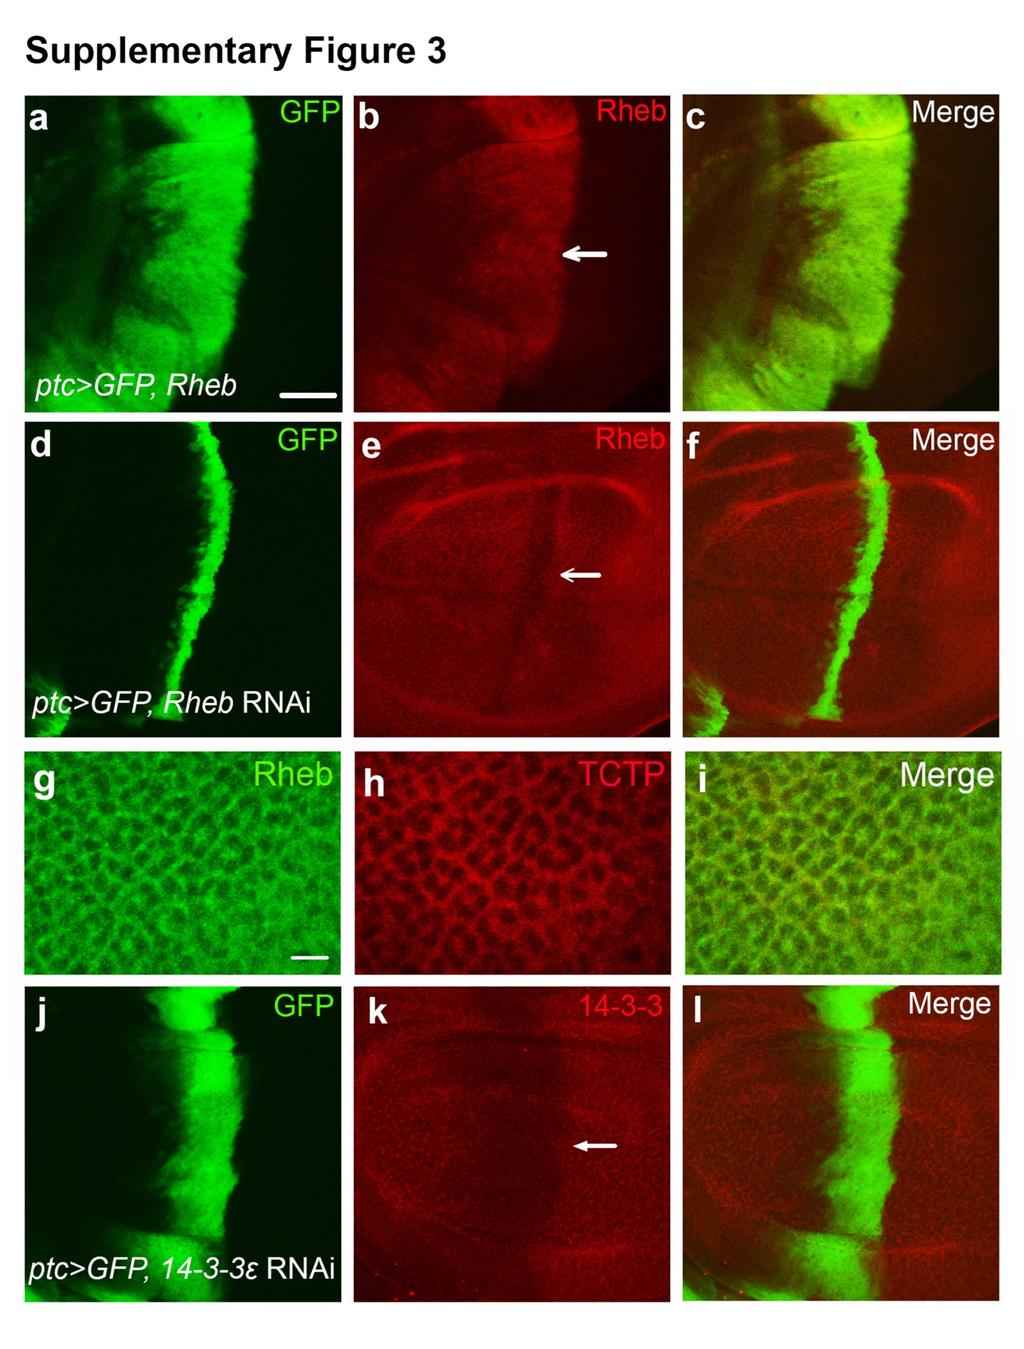
6 Supplementary Figure 3. Specificity of anti-rheb and anti antibodies. a-c, Rheb expression level was examined in wing disc. a, patched (ptc)-gal4 UAS-GFP (ptc>gfp) was used to overexpress Rheb in the anterior-posterior boundary region of wing. b, Rheb is overexpressed in the ptc region (white arrow). The ptc domain is enlarged by Rheb overexpression. c, Merge of a and b. d-f, ptc>gfp was used to knockdown Rheb in the ptc region. e, Rheb staining is reduced in the ptc region. The width of the ptc domain is reduced by Rheb knockdown. g-i, Rheb and Tctp show an overlapping expression pattern in eye imaginal disc. Both are enriched in the boundaries between ommatidia and in the center of each ommatidium where photoreceptor cells contact together. j-l, antibody staining is reduced in the ptc domain (GFP-positive region) by RNAi (k), suggesting that the antibody is specific. Scale bar, 50 µm (a-f, j-l), 5 µm (g-i).

7 Supplementary Figure 4. Overexpression of S6k cannot rescue the phenotype of double knockdown of Tctp and a, Fly with one copy of ey-gal4 has normal eye. b, Overexpression of S6k by ey-gal4 has no effect on eye size. c, Double knockdown of Tctp and one isoform of results in strong reduction of eye size. d, Overexpression of S6k cannot rescue the small eye phenotype caused by knockdown of both Tctp and ε or ζ. Scale bar, 200 µm (a-d).
 and CycE overexpression (b) show normal wings. c, Double knockdown of both 14-3-3 isoforms results in severe loss of wing tissues (<20% of wild-type wing size).")
8 Supplementary Figure 5. CycE suppresses wing defects caused by double knockdown of both forms. Effects of CycE overexpression on s depleted wings. MS1090-Gal4/+ control (a) and CycE overexpression (b) show normal wings. c, Double knockdown of both isoforms results in severe loss of wing tissues (<20% of wild-type wing size). d-f, Overexpression of CycE suppresses the double knockdown phenotype, showing strong rescue (61-100% of wild type size) (d), intermediate rescue (21-60%) (e), or no rescue (20% or below) (f). (g) Quantification of the data shown in (d-f). 60 flies with the genotype of MS1096>14-3-3ε RNAi/+; ζ RNAi/+; CycE/+ were scored. Scale bar, 400 µm (a-f).
 or Flag-Rheb (b) were examined with anti-flag antibody. Three proteins show similar expression levels.")
9 Supplementary Figure 6: Stoichiometric ratio between the levels of endogenous s and overexpressed Tctp and Rheb. a-b, Relative levels of transfected Flag ε, Flag ζ and Flag-Tctp (a) or Flag-Rheb (b) were examined with anti-flag antibody. Three proteins show similar expression levels. c, Endogenous s in non-transfected cells and Flag ε in transfected cells show comparable levels, as tested by anti antibody. These data suggest
10 that levels of endogenous s are not significantly different from the overexpressed Tctp/Rheb.
11
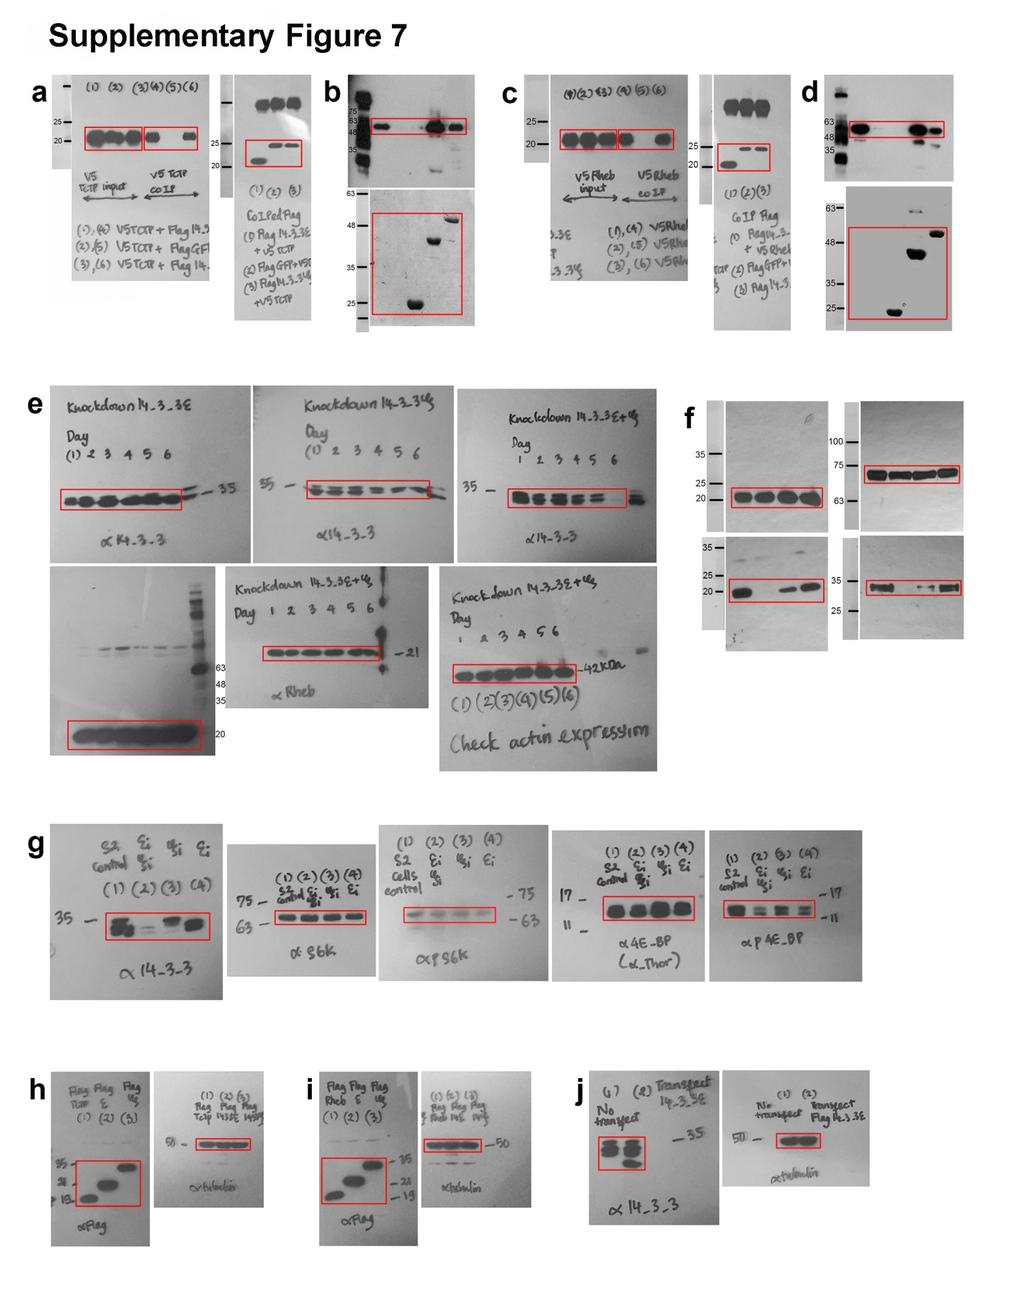
12 Supplementary Figure 7. Uncropped Western blots. a, Uncropped blots shown in Figure 4a. b, Blots shown in Figure 4b. c, Blots shown in Figure 4c. d, Blots shown in Figure 4d. e, Blots shown in Figure 5a. f, Blots shown in Figure 5b. g, Blots shown in Figure 6a. h, Blots shown in Supplementary Figure 6a. i, Blots shown in Supplementary Figure 6b. j, Blots shown in Supplementary Figure 6c.
Supplementary Figures
 J. Cell Sci. 128: doi:10.1242/jcs.173807: Supplementary Material Supplementary Figures Fig. S1 Fig. S1. Description and/or validation of reagents used. All panels show Drosophila tissues oriented with
Supplementary Figure 1 Madm is not required in GSCs and hub cells. (a,b) Act-Gal4-UAS-GFP (a), Act-Gal4-UAS- GFP.nls (b,c) is ubiquitously expressed
 Act-Gal4-UAS-GFP (a), Act-Gal4-UAS- GFP.nls (b,c) is ubiquitously expressed") Supplementary Figure 1 Madm is not required in GSCs and hub cells. (a,b) Act-Gal4-UAS-GFP (a), Act-Gal4-UAS- GFP.nls (b,c) is ubiquitously expressed in the testes. The testes were immunostained with GFP
Supplementary Figure 1 Madm is not required in GSCs and hub cells. (a,b) Act-Gal4-UAS-GFP (a), Act-Gal4-UAS- GFP.nls (b,c) is ubiquitously expressed in the testes. The testes were immunostained with GFP
Supporting Information
 Supporting Information Fig. S1. Overexpression of Rpr causes progenitor cell death. (A) TUNEL assay of control intestines. No progenitor cell death could be observed, except that some ECs are undergoing
Nature Neuroscience: doi: /nn Supplementary Figure 1
 Supplementary Figure 1 Expression of escargot (esg) and genetic approach for achieving IPC-specific knockdown. (a) esg MH766 -Gal4 UAS-cd8GFP (green) and esg-lacz B7-2-22 (red) show similar expression
marker. DAPI labels nuclei. Flies were 20 days old. Scale bar is 5 µm. Ctrl is
 Supplementary Figure 1. (a) Nos is detected in glial cells in both control and GFAP R79H transgenic flies (arrows), but not in deletion mutant Nos Δ15 animals. Repo is a glial cell marker. DAPI labels
SUPPLEMENTARY INFORMATION
 Supplementary Figure 1. Ras V12 expression in the entire eye-antennal disc does not cause invasive tumours. a, Eye-antennal discs expressing Ras V12 in all cells (marked with GFP, green) overgrow moderately
SUPPLEMENTARY INFORMATION
 DOI: 10.1038/ncb2566 Figure S1 CDKL5 protein expression pattern and localization in mouse brain. (a) Multiple-tissue western blot from a postnatal day (P) 21 mouse probed with an antibody against CDKL5.
Supplementary Information
 Supplementary Information Supplementary s Supplementary 1 All three types of foods suppress subsequent feeding in both sexes when the same food is used in the pre-feeding test feeding. (a) Adjusted pre-feeding
Supplementary Table 1. List of primers used in this study
 Supplementary Table 1. List of primers used in this study Gene Forward primer Reverse primer Rat Met 5 -aggtcgcttcatgcaggt-3 5 -tccggagacacaggatgg-3 Rat Runx1 5 -cctccttgaaccactccact-3 5 -ctggatctgcctggcatc-3
SUPPLEMENTARY FIGURE LEGENDS
 SUPPLEMENTARY FIGURE LEGENDS Supplemental FIG. 1. Localization of myosin Vb in cultured neurons varies with maturation stage. A and B, localization of myosin Vb in cultured hippocampal neurons. A, in DIV
Supplementary Figure S1: TIPF reporter validation in the wing disc.
 Supplementary Figure S1: TIPF reporter validation in the wing disc. a,b, Test of put RNAi. a, In wildtype discs the Dpp target gene Sal (red) is expressed in a broad stripe in the centre of the ventral
SUPPLEMENTARY INFORMATION
 DOI: 10.1038/ncb2988 Supplementary Figure 1 Kif7 L130P encodes a stable protein that does not localize to cilia tips. (a) Immunoblot with KIF7 antibody in cell lysates of wild-type, Kif7 L130P and Kif7
Supplementary Figure 1. Flies form water-reward memory only in the thirsty state
 1 2 3 4 5 6 7 Supplementary Figure 1. Flies form water-reward memory only in the thirsty state Thirsty but not sated wild-type flies form robust 3 min memory. For the thirsty group, the flies were water-deprived
SUPPLEMENTAL FIGURE LEGENDS
 SUPPLEMENTAL FIGURE LEGENDS Supplemental Figure S1: Endogenous interaction between RNF2 and H2AX: Whole cell extracts from 293T were subjected to immunoprecipitation with anti-rnf2 or anti-γ-h2ax antibodies
SUPPLEMENTARY INFORMATION
 DOI: 10.1038/ncb2607 Figure S1 Elf5 loss promotes EMT in mammary epithelium while Elf5 overexpression inhibits TGFβ induced EMT. (a, c) Different confocal slices through the Z stack image. (b, d) 3D rendering
(a-r) Whole mount X-gal staining on a developmental time-course of hearts from
 Whole mount X-gal staining on a developmental time-course of hearts from") 1 2 3 4 5 6 7 8 9 10 11 12 13 14 15 16 Supplementary Figure 1 (a-r) Whole mount X-gal staining on a developmental time-course of hearts from Sema3d +/- ;Ephb4 LacZ/+ and Sema3d -/- ;Ephb4 LacZ/+ embryos.
1 2 3 4 5 6 7 8 9 10 11 12 13 14 15 16 Supplementary Figure 1 (a-r) Whole mount X-gal staining on a developmental time-course of hearts from Sema3d +/- ;Ephb4 LacZ/+ and Sema3d -/- ;Ephb4 LacZ/+ embryos.
Nature Structural and Molecular Biology: doi: /nsmb Supplementary Figure 1
 Supplementary Figure 1 Mutational analysis of the SA2-Scc1 interaction in vitro and in human cells. (a) Autoradiograph (top) and Coomassie stained gel (bottom) of 35 S-labeled Myc-SA2 proteins (input)
Chapter 5 A Dose Dependent Screen for Modifiers of Kek5
 Chapter 5 A Dose Dependent Screen for Modifiers of Kek5 "#$ ABSTRACT Modifier screens in Drosophila have proven to be a powerful tool for uncovering gene interaction and elucidating molecular pathways.
SUPPLEMENTARY INFORMATION
 doi: 10.1038/nature07173 SUPPLEMENTARY INFORMATION Supplementary Figure Legends: Supplementary Figure 1: Model of SSC and CPC divisions a, Somatic stem cells (SSC) reside adjacent to the hub (red), self-renew
SUPPLEMENTARY INFORMATION
 doi:10.1038/nature12652 Supplementary Figure 1. PRDM16 interacts with endogenous EHMT1 in brown adipocytes. Immunoprecipitation of PRDM16 complex by flag antibody (M2) followed by Western blot analysis
SUPPLEMENTARY INFORMATION Glucosylceramide synthase (GlcT-1) in the fat body controls energy metabolism in Drosophila
 in the fat body controls energy metabolism in Drosophila") SUPPLEMENTARY INFORMATION Glucosylceramide synthase (GlcT-1) in the fat body controls energy metabolism in Drosophila Ayako Kohyama-Koganeya, 1,2 Takuji Nabetani, 1 Masayuki Miura, 2,3 Yoshio Hirabayashi
SUPPLEMENTARY INFORMATION Glucosylceramide synthase (GlcT-1) in the fat body controls energy metabolism in Drosophila Ayako Kohyama-Koganeya, 1,2 Takuji Nabetani, 1 Masayuki Miura, 2,3 Yoshio Hirabayashi
Effects of UBL5 knockdown on cell cycle distribution and sister chromatid cohesion
 Supplementary Figure S1. Effects of UBL5 knockdown on cell cycle distribution and sister chromatid cohesion A. Representative examples of flow cytometry profiles of HeLa cells transfected with indicated
Supplementary Figure 1.TRIM33 binds β-catenin in the nucleus. a & b, Co-IP of endogenous TRIM33 with β-catenin in HT-29 cells (a) and HEK 293T cells
 and HEK 293T cells") Supplementary Figure 1.TRIM33 binds β-catenin in the nucleus. a & b, Co-IP of endogenous TRIM33 with β-catenin in HT-29 cells (a) and HEK 293T cells (b). TRIM33 was immunoprecipitated, and the amount of
Supplementary Figure 1.TRIM33 binds β-catenin in the nucleus. a & b, Co-IP of endogenous TRIM33 with β-catenin in HT-29 cells (a) and HEK 293T cells (b). TRIM33 was immunoprecipitated, and the amount of
Supplementary Figure 1. Procedures to independently control fly hunger and thirst states.
 Supplementary Figure 1 Procedures to independently control fly hunger and thirst states. (a) Protocol to produce exclusively hungry or thirsty flies for 6 h water memory retrieval. (b) Consumption assays
Supplementary Fig. 1 V-ATPase depletion induces unique and robust phenotype in Drosophila fat body cells.
 Supplementary Fig. 1 V-ATPase depletion induces unique and robust phenotype in Drosophila fat body cells. a. Schematic of the V-ATPase proton pump macro-complex structure. The V1 complex is composed of
Zhu et al, page 1. Supplementary Figures
 Zhu et al, page 1 Supplementary Figures Supplementary Figure 1: Visual behavior and avoidance behavioral response in EPM trials. (a) Measures of visual behavior that performed the light avoidance behavior
Supplementary Figure 1
 Supplementary Figure 1 Kif1a RNAi effect on basal progenitor differentiation Related to Figure 2. Representative confocal images of the VZ and SVZ of rat cortices transfected at E16 with scrambled or Kif1a
Supplementary Figure 1 hlrrk2 promotes CAP dependent protein translation.
 ` Supplementary Figure 1 hlrrk2 promotes CAP dependent protein translation. (a) Overexpression of hlrrk2 in HeLa cells enhances total protein synthesis in [35S] methionine/cysteine incorporation assays.
Transgenic Expression of the Helicobacter pylori Virulence Factor CagA Promotes Apoptosis or Tumorigenesis through JNK Activation in Drosophila
 Transgenic Expression of the Helicobacter pylori Virulence Factor CagA Promotes Apoptosis or Tumorigenesis through JNK Activation in Drosophila Anica M. Wandler, Karen Guillemin* Institute of Molecular
T H E J O U R N A L O F C E L L B I O L O G Y
 Supplemental material Wang and Page-McCaw, http://www.jcb.org/cgi/content/full/jcb.201403084/dc1 T H E J O U R N A L O F C E L L B I O L O G Y Figure S1. Extracellular anti-wg staining is specific. Note
Tumor suppressor Spred2 interaction with LC3 promotes autophagosome maturation and induces autophagy-dependent cell death
 www.impactjournals.com/oncotarget/ Oncotarget, Supplementary Materials 2016 Tumor suppressor Spred2 interaction with LC3 promotes autophagosome maturation and induces autophagy-dependent cell death Supplementary
Supplementary Materials for
 www.sciencesignaling.org/cgi/content/full/6/283/ra57/dc1 Supplementary Materials for JNK3 Couples the Neuronal Stress Response to Inhibition of Secretory Trafficking Guang Yang,* Xun Zhou, Jingyan Zhu,
293T cells were transfected with indicated expression vectors and the whole-cell extracts were subjected
 SUPPLEMENTARY INFORMATION Supplementary Figure 1. Formation of a complex between Slo1 and CRL4A CRBN E3 ligase. (a) HEK 293T cells were transfected with indicated expression vectors and the whole-cell
Supplementary Fig. S1. Schematic diagram of minigenome segments.
 open reading frame 1565 (segment 5) 47 (-) 3 5 (+) 76 101 125 149 173 197 221 246 287 open reading frame 890 (segment 8) 60 (-) 3 5 (+) 172 Supplementary Fig. S1. Schematic diagram of minigenome segments.
Supplementary Fig. 1. GPRC5A post-transcriptionally down-regulates EGFR expression. (a) Plot of the changes in steady state mrna levels versus
 Plot of the changes in steady state mrna levels versus") Supplementary Fig. 1. GPRC5A post-transcriptionally down-regulates EGFR expression. (a) Plot of the changes in steady state mrna levels versus changes in corresponding proteins between wild type and Gprc5a-/-
Supplementary Fig. 1. GPRC5A post-transcriptionally down-regulates EGFR expression. (a) Plot of the changes in steady state mrna levels versus changes in corresponding proteins between wild type and Gprc5a-/-
Supplementary Figure 1. SC35M polymerase activity in the presence of Bat or SC35M NP encoded from the phw2000 rescue plasmid.
 1 2 3 4 5 6 7 8 9 10 11 12 13 14 15 16 17 18 19 20 21 22 23 24 25 26 27 Supplementary Figure 1. SC35M polymerase activity in the presence of Bat or SC35M NP encoded from the phw2000 rescue plasmid. HEK293T
Supplemental Materials. STK16 regulates actin dynamics to control Golgi organization and cell cycle
 Supplemental Materials STK16 regulates actin dynamics to control Golgi organization and cell cycle Juanjuan Liu 1,2,3, Xingxing Yang 1,3, Binhua Li 1, Junjun Wang 1,2, Wenchao Wang 1, Jing Liu 1, Qingsong
Supplementary Information
 Supplementary Information Supplementary Figure 1: cholesterol manipulation alters the positioning of autophagosomes in cells, related to figure 1. (a) HeLa cells were treated for 24h under conditions reducing
Head of College Scholars List Scheme. Summer Studentship Report Form
 Head of College Scholars List Scheme Summer Studentship 2019 Report Form This report should be completed by the student with his/her project supervisor. It should summarise the work undertaken during the
SUPPLEMENTARY FIGURES AND TABLE
 SUPPLEMENTARY FIGURES AND TABLE Supplementary Figure S1: Characterization of IRE1α mutants. A. U87-LUC cells were transduced with the lentiviral vector containing the GFP sequence (U87-LUC Tet-ON GFP).
Supplementary Figure 1. Spatial distribution of LRP5 and β-catenin in intact cardiomyocytes. (a) and (b) Immunofluorescence staining of endogenous
 and (b) Immunofluorescence staining of endogenous") Supplementary Figure 1. Spatial distribution of LRP5 and β-catenin in intact cardiomyocytes. (a) and (b) Immunofluorescence staining of endogenous LRP5 in intact adult mouse ventricular myocytes (AMVMs)
Supplementary Figure 1. Spatial distribution of LRP5 and β-catenin in intact cardiomyocytes. (a) and (b) Immunofluorescence staining of endogenous LRP5 in intact adult mouse ventricular myocytes (AMVMs)
(a) Significant biological processes (upper panel) and disease biomarkers (lower panel)
 Significant biological processes (upper panel) and disease biomarkers (lower panel)") Supplementary Figure 1. Functional enrichment analyses of secretomic proteins. (a) Significant biological processes (upper panel) and disease biomarkers (lower panel) 2 involved by hrab37-mediated secretory
Supplementary Figure 1. Functional enrichment analyses of secretomic proteins. (a) Significant biological processes (upper panel) and disease biomarkers (lower panel) 2 involved by hrab37-mediated secretory
supplementary information
 DOI: 10.1038/ncb2153 Figure S1 Ectopic expression of HAUSP up-regulates REST protein. (a) Immunoblotting showed that ectopic expression of HAUSP increased REST protein levels in ENStemA NPCs. (b) Immunofluorescent
EGFR shrna A: CCGGCGCAAGTGTAAGAAGTGCGAACTCGAGTTCGCACTTCTTACACTTGCG TTTTTG. EGFR shrna B: CCGGAGAATGTGGAATACCTAAGGCTCGAGCCTTAGGTATTCCACATTCTCTT TTTG
 Supplementary Methods Sequence of oligonucleotides used for shrna targeting EGFR EGFR shrna were obtained from the Harvard RNAi consortium. The following oligonucleotides (forward primer) were used to
Fig. S1. Subcellular localization of overexpressed LPP3wt-GFP in COS-7 and HeLa cells. Cos7 (top) and HeLa (bottom) cells expressing for 24 h human
 and HeLa (bottom) cells expressing for 24 h human") Fig. S1. Subcellular localization of overexpressed LPP3wt-GFP in COS-7 and HeLa cells. Cos7 (top) and HeLa (bottom) cells expressing for 24 h human LPP3wt-GFP, fixed and stained for GM130 (A) or Golgi97
Fig. S1. Subcellular localization of overexpressed LPP3wt-GFP in COS-7 and HeLa cells. Cos7 (top) and HeLa (bottom) cells expressing for 24 h human LPP3wt-GFP, fixed and stained for GM130 (A) or Golgi97
Supplementary Figure S1: Defective heterochromatin repair in HGPS progeroid cells
 Supplementary Figure S1: Defective heterochromatin repair in HGPS progeroid cells Immunofluorescence staining of H3K9me3 and 53BP1 in PH and HGADFN003 (HG003) cells at 24 h after γ-irradiation. Scale bar,
Supplementary information. The Light Intermediate Chain 2 Subpopulation of Dynein Regulates Mitotic. Spindle Orientation
 Supplementary information The Light Intermediate Chain 2 Subpopulation of Dynein Regulates Mitotic Spindle Orientation Running title: Dynein LICs distribute mitotic functions. Sagar Mahale a, d, *, Megha
SUPPLEMENTARY MATERIAL
 SUPPLEMENTARY MATERIAL Divergent effects of intrinsically active MEK variants on developmental Ras signaling Yogesh Goyal,2,3,4, Granton A. Jindal,2,3,4, José L. Pelliccia 3, Kei Yamaya 2,3, Eyan Yeung
Supplementary Information
 Supplementary Information Astrocytes regulate adult hippocampal neurogenesis through ephrin-b signaling Randolph S. Ashton, Anthony Conway, Chinmay Pangarkar, Jamie Bergen, Kwang-Il Lim, Priya Shah, Mina
Supporting Online Material for
 www.sciencemag.org/cgi/content/full/1171320/dc1 Supporting Online Material for A Frazzled/DCC-Dependent Transcriptional Switch Regulates Midline Axon Guidance Long Yang, David S. Garbe, Greg J. Bashaw*
Supplementary information
 Supplementary information 1 Supplementary Figure 1. CALM regulates autophagy. (a). Quantification of LC3 levels in the experiment described in Figure 1A. Data are mean +/- SD (n > 3 experiments for each
Supplementary Figures
 Supplementary Figures Supplementary Figure 1 DOT1L regulates the expression of epithelial and mesenchymal markers. (a) The expression levels and cellular localizations of EMT markers were confirmed by
Figure S1. HP1α localizes to centromeres in mitosis and interacts with INCENP. (A&B) HeLa
 HeLa") SUPPLEMENTARY FIGURES Figure S1. HP1α localizes to centromeres in mitosis and interacts with INCENP. (A&B) HeLa tet-on cells that stably express HP1α-CFP, HP1β-CFP, or HP1γ-CFP were monitored with livecell
SUPPLEMENTARY FIGURES Figure S1. HP1α localizes to centromeres in mitosis and interacts with INCENP. (A&B) HeLa tet-on cells that stably express HP1α-CFP, HP1β-CFP, or HP1γ-CFP were monitored with livecell
Neocortex Zbtb20 / NFIA / Sox9
 Neocortex / NFIA / Sox9 Supplementary Figure 1. Expression of, NFIA, and Sox9 in the mouse neocortex at. The lower panels are higher magnification views of the oxed area. Arrowheads indicate triple-positive
T H E J O U R N A L O F C E L L B I O L O G Y
 T H E J O U R N A L O F C E L L B I O L O G Y Supplemental material Krenn et al., http://www.jcb.org/cgi/content/full/jcb.201110013/dc1 Figure S1. Levels of expressed proteins and demonstration that C-terminal
(a) Schematic diagram of the FS mutation of UVRAG in exon 8 containing the highly instable
 Schematic diagram of the FS mutation of UVRAG in exon 8 containing the highly instable") Supplementary Figure 1. Frameshift (FS) mutation in UVRAG. (a) Schematic diagram of the FS mutation of UVRAG in exon 8 containing the highly instable A 10 DNA repeat, generating a premature stop codon
Supplementary Figure 1. Frameshift (FS) mutation in UVRAG. (a) Schematic diagram of the FS mutation of UVRAG in exon 8 containing the highly instable A 10 DNA repeat, generating a premature stop codon
Expanded View Figures
 MO reports PR3 dephosphorylates TZ Xian-o Lv et al xpanded View igures igure V1. PR3 dephosphorylates and inactivates YP/TZ., Overexpression of tight junction proteins Pals1 () or LIN7 () has no effect
SUPPLEMENTARY INFORMATION
 DOI: 1.138/ncb222 / b. WB anti- WB anti- ulin Mitotic index (%) 14 1 6 2 T (h) 32 48-1 1 2 3 4 6-1 4 16 22 28 3 33 e. 6 4 2 Time (min) 1-6- 11-1 > 1 % cells Figure S1 depletion leads to mitotic defects
Project report October 2012 March 2013 CRF fellow: Principal Investigator: Project title:
 Project report October 2012 March 2013 CRF fellow: Gennaro Napolitano Principal Investigator: Sergio Daniel Catz Project title: Small molecule regulators of vesicular trafficking to enhance lysosomal exocytosis
Supplementary Figure 1. PD-L1 is glycosylated in cancer cells. (a) Western blot analysis of PD-L1 in breast cancer cells. (b) Western blot analysis
 Western blot analysis of PD-L1 in breast cancer cells. (b) Western blot analysis") Supplementary Figure 1. PD-L1 is glycosylated in cancer cells. (a) Western blot analysis of PD-L1 in breast cancer cells. (b) Western blot analysis of PD-L1 in ovarian cancer cells. (c) Western blot analysis
Supplementary Figure 1. PD-L1 is glycosylated in cancer cells. (a) Western blot analysis of PD-L1 in breast cancer cells. (b) Western blot analysis of PD-L1 in ovarian cancer cells. (c) Western blot analysis
Supplementary Fig. 1. The Brown Norway rat has higher coronary flow compared to other rat strains. Publically available data for coronary flow
 Supplementary Fig. 1. The Brown Norway rat has higher coronary flow compared to other rat strains. Publically available data for coronary flow measured ex vivo on Langendorff apparatus under intrinsic
(A) SW480, DLD1, RKO and HCT116 cells were treated with DMSO or XAV939 (5 µm)
 SW480, DLD1, RKO and HCT116 cells were treated with DMSO or XAV939 (5 µm)") Supplementary Figure Legends Figure S1. Tankyrase inhibition suppresses cell proliferation in an axin/β-catenin independent manner. (A) SW480, DLD1, RKO and HCT116 cells were treated with DMSO or XAV939
Supplementary Figure Legends Figure S1. Tankyrase inhibition suppresses cell proliferation in an axin/β-catenin independent manner. (A) SW480, DLD1, RKO and HCT116 cells were treated with DMSO or XAV939
Nature Structural & Molecular Biology: doi: /nsmb Supplementary Figure 1. Differential expression of mirnas from the pri-mir-17-92a locus.
 Supplementary Figure 1 Differential expression of mirnas from the pri-mir-17-92a locus. (a) The mir-17-92a expression unit in the third intron of the host mir-17hg transcript. (b,c) Impact of knockdown
Supplementary Information. Cofilin Regulates Nuclear Architecture through a Myosin-II Dependent Mechanotransduction Module
 Supplementary Information Cofilin Regulates Nuclear Architecture through a Myosin-II Dependent Mechanotransduction Module O Neil Wiggan, Bryce Schroder, Diego Krapf, James R. Bamurg and Jennifer G. DeLuca
Supplemental Information. Proprioceptive Opsin Functions. in Drosophila Larval Locomotion
 Neuron, Volume 98 Supplemental Information Proprioceptive Opsin Functions in Drosophila Larval Locomotion Damiano Zanini, Diego Giraldo, Ben Warren, Radoslaw Katana, Marta Andrés, Suneel Reddy, Stephanie
Infect MCF-7 cells carrying dcas9-vp64 + psm2-p65-hsf1 with SAM library or vector. Introduce AKT reporter
 Infect MCF-7 cells carrying dcas9-vp64 + psm2-p65-hsf1 with SM library or vector Introduce reporter Grow cells in presence of puromycin for 5 days Vector control SM library fewer surviving cells More surviving
supplementary information
 DOI: 10.1038/ncb2133 Figure S1 Actomyosin organisation in human squamous cell carcinoma. (a) Three examples of actomyosin organisation around the edges of squamous cell carcinoma biopsies are shown. Myosin
CONTRACTING ORGANIZATION: Cold Spring Harbor Laboratory Cold Spring Harbor, NY 11724
 AD Award Number: W81XWH-10-1-0450 TITLE: The role of NF1 in memory retrieval PRINCIPAL INVESTIGATOR: Yi Zhong, Ph.D. CONTRACTING ORGANIZATION: Cold Spring Harbor Laboratory Cold Spring Harbor, NY 11724
Rescue of mutant rhodopsin traffic by metformin-induced AMPK activation accelerates photoreceptor degeneration Athanasiou et al
 Supplementary Material Rescue of mutant rhodopsin traffic by metformin-induced AMPK activation accelerates photoreceptor degeneration Athanasiou et al Supplementary Figure 1. AICAR improves P23H rod opsin
Supplementary Figure 1
 Supplementary Figure 1 Supplementary Figure 1 Schematic depiction of the tandem Fc GDF15. Supplementary Figure 2 Supplementary Figure 2 Gfral mrna levels in the brains of both wild-type and knockout Gfral
Supplementary Figure 1. Rab27a-KD inhibits speed and persistence of HEp3 cells migrating in the chick CAM. (a) Western blot analysis of Rab27a
 Western blot analysis of Rab27a") Supplementary Figure 1. Rab27a-KD inhibits speed and persistence of HEp3 cells migrating in the chick CAM. (a) Western blot analysis of Rab27a expression in GFP-expressing HEp3 cells. (b) Representative
Supplementary Figure 1. Rab27a-KD inhibits speed and persistence of HEp3 cells migrating in the chick CAM. (a) Western blot analysis of Rab27a expression in GFP-expressing HEp3 cells. (b) Representative
Type of file: PDF Title of file for HTML: Supplementary Information Description: Supplementary Figures
 Type of file: PDF Title of file for HTML: Supplementary Information Description: Supplementary Figures Type of file: MOV Title of file for HTML: Supplementary Movie 1 Description: NLRP3 is moving along
Supplementary Figure S1
 Supplementary Figure S1 Supplementary Figure S1. PARP localization patterns using GFP-PARP and PARP-specific antibody libraries GFP-PARP localization in non-fixed (A) and formaldehyde fixed (B) GFP-PARPx
G-TRACE: rapid Gal4-based cell lineage analysis in Drosophila
 nature methods G-TRACE: rapid Gal4-based cell lineage analysis in Drosophila Cory J Evans, John M Olson, Kathy T Ngo, Eunha Kim, Noemi E Lee, Edward Kuoy, Alexander N Patananan, Daniel Sitz, PhuongThao
Supplementary Information
 Supplementary Information mediates STAT3 activation at retromer-positive structures to promote colitis and colitis-associated carcinogenesis Zhang et al. a b d e g h Rel. Luc. Act. Rel. mrna Rel. mrna
SUPPLEMENTARY INFORMATION
 DOI: 10.1038/ncb2419 Figure S1 NiGFP localization in Dl mutant dividing SOPs. a-c) time-lapse analysis of NiGFP (green) in Dl mutant SOPs (H2B-RFP, red; clones were identified by the loss of nlsgfp) showing
SUPPLEMENTARY INFORMATION
 DOI: 10.1038/ncb2535 Figure S1 SOX10 is expressed in human giant congenital nevi and its expression in human melanoma samples suggests that SOX10 functions in a MITF-independent manner. a, b, Representative
Supplementary Information
 Supplementary Information Supplementary Figure 1: Luminal localization of CCM-3. (a) The CCM-3::GFP fusion protein localizes along the apical (luminal) surface of the pharynx (b) as well as the lumen of
A Normal Exencephaly Craniora- Spina bifida Microcephaly chischisis. Midbrain Forebrain/ Forebrain/ Hindbrain Spinal cord Hindbrain Hindbrain
 A Normal Exencephaly Craniora- Spina bifida Microcephaly chischisis NTD Number of embryos % among NTD Embryos Exencephaly 52 74.3% Craniorachischisis 6 8.6% Spina bifida 5 7.1% Microcephaly 7 1% B Normal
Supplementary Materials
 Supplementary Materials Supplementary Figure S1 Regulation of Ubl4A stability by its assembly partner A, The translation rate of Ubl4A is not affected in the absence of Bag6. Control, Bag6 and Ubl4A CRISPR
Supporting Information. FADD regulates NF-кB activation and promotes ubiquitination of cflip L to induce. apoptosis
 1 2 Supporting Information 3 4 5 FADD regulates NF-кB activation and promotes ubiquitination of cflip L to induce apoptosis 6 7 Kishu Ranjan and Chandramani Pathak* 8 9 Department of Cell Biology, School
Supplementary Figure 1: Tissue of Origin analysis on 152 cell lines. (a) Heatmap representation of the 30 Tissue scores for the 152 cell lines.
 Heatmap representation of the 30 Tissue scores for the 152 cell lines.") Supplementary Figure 1: Tissue of Origin analysis on 152 cell lines. (a) Heatmap representation of the 30 Tissue scores for the 152 cell lines. The scores summarize the global expression of the tissue
Supplementary Figure 1: Tissue of Origin analysis on 152 cell lines. (a) Heatmap representation of the 30 Tissue scores for the 152 cell lines. The scores summarize the global expression of the tissue
c Ischemia (30 min) Reperfusion (8 w) Supplementary Figure bp 300 bp Ischemia (30 min) Reperfusion (4 h) Dox 20 mg/kg i.p.
 Reperfusion (8 w) Supplementary Figure bp 300 bp Ischemia (30 min) Reperfusion (4 h) Dox 20 mg/kg i.p.") a Marker Ripk3 +/ 5 bp 3 bp b Ischemia (3 min) Reperfusion (4 h) d 2 mg/kg i.p. 1 w 5 w Sacrifice for IF size A subset for echocardiography and morphological analysis c Ischemia (3 min) Reperfusion (8
a Marker Ripk3 +/ 5 bp 3 bp b Ischemia (3 min) Reperfusion (4 h) d 2 mg/kg i.p. 1 w 5 w Sacrifice for IF size A subset for echocardiography and morphological analysis c Ischemia (3 min) Reperfusion (8
Edited by J. Richard McIntosh, University of Colorado, Boulder, CO, and approved June 17, 2016 (received for review November 13, 2015) Results
 Results") Role of kinesin-1 based microtubule sliding in Drosophila nervous system development Michael Winding a, Michael T. Kelliher b,c, Wen Lu a, Jill Wildonger b, and Vladimir I. Gelfand a,1 a Department of
Role of kinesin-1 based microtubule sliding in Drosophila nervous system development Michael Winding a, Michael T. Kelliher b,c, Wen Lu a, Jill Wildonger b, and Vladimir I. Gelfand a,1 a Department of
SUPPLEMENTARY INFORMATION
 DOI:.38/ncb2822 a MTC02 FAO cells EEA1 b +/+ MEFs /DAPI -/- MEFs /DAPI -/- MEFs //DAPI c HEK 293 cells WCE N M C P AKT TBC1D7 Lamin A/C EEA1 VDAC d HeLa cells WCE N M C P AKT Lamin A/C EEA1 VDAC Figure
p.r623c p.p976l p.d2847fs p.t2671 p.d2847fs p.r2922w p.r2370h p.c1201y p.a868v p.s952* RING_C BP PHD Cbp HAT_KAT11
 ARID2 p.r623c KMT2D p.v650fs p.p976l p.r2922w p.l1212r p.d1400h DNA binding RFX DNA binding Zinc finger KMT2C p.a51s p.d372v p.c1103* p.d2847fs p.t2671 p.d2847fs p.r4586h PHD/ RING DHHC/ PHD PHD FYR N
Supplementary Figure 1. Confocal immunofluorescence showing mitochondrial translocation of Drp1. Cardiomyocytes treated with H 2 O 2 were prestained
 Supplementary Figure 1. Confocal immunofluorescence showing mitochondrial translocation of Drp1. Cardiomyocytes treated with H 2 O 2 were prestained with MitoTracker (red), then were immunostained with
Supplementary Figure 1
 S U P P L E M E N TA R Y I N F O R M AT I O N DOI: 10.1038/ncb2896 Supplementary Figure 1 Supplementary Figure 1. Sequence alignment of TERB1 homologs in vertebrates. M. musculus TERB1 was derived from
IP: anti-gfp VPS29-GFP. IP: anti-vps26. IP: anti-gfp - + +
 FAM21 Strump. WASH1 IP: anti- 1 2 3 4 5 6 FAM21 Strump. FKBP IP: anti-gfp VPS29- GFP GFP-FAM21 tail H H/P P H H/P P c FAM21 FKBP Strump. VPS29-GFP IP: anti-gfp 1 2 3 FKBP VPS VPS VPS VPS29 1 = VPS29-GFP
Supplementary Figure 1. The CagA-dependent wound healing or transwell migration of gastric cancer cell. AGS cells transfected with vector control or
 Supplementary Figure 1. The CagA-dependent wound healing or transwell migration of gastric cancer cell. AGS cells transfected with vector control or 3xflag-CagA expression vector were wounded using a pipette
Supplementary Figure 1. A. Bar graph representing the expression levels of the 19 indicated genes in the microarrays analyses comparing human lung
 Supplementary Figure 1. A. Bar graph representing the expression levels of the 19 indicated genes in the microarrays analyses comparing human lung immortalized broncho-epithelial cells (AALE cells) expressing
SUPPLEMENTARY FIGURE LEGENDS. atypical adenomatous hyperplasias (AAH); Grade II: adenomas; Grade III: adenocarcinomas;
; Grade II: adenomas; Grade III: adenocarcinomas;") SUPPLEMENTARY FIGURE LEGENDS Supplementary Figure S1: Tumor grades in Ras G12D ; p53 / lung tumors. Representative histology (H&E) of K-Ras G12D ; p53 / lung tumors 13 weeks after tumor initiation. Grade
SUPPLEMENTARY FIGURE LEGENDS Supplementary Figure S1: Tumor grades in Ras G12D ; p53 / lung tumors. Representative histology (H&E) of K-Ras G12D ; p53 / lung tumors 13 weeks after tumor initiation. Grade
supplementary information
 Figure S1 Nucleotide binding status of RagA mutants. Wild type and mutant forms of MycRagA was transfected into HEK293 cells and the transfected cells were labeled with 32 Pphosphate. MycRagA was immunoprecipitated
SUPPLEMENTARY FIGURES
 SUPPLEMENTARY FIGURES Supplementary Figure 1. (A) Left, western blot analysis of ISGylated proteins in Jurkat T cells treated with 1000U ml -1 IFN for 16h (IFN) or left untreated (CONT); right, western
genome edited transient transfection, CMV promoter
 Supplementary Figure 1. In the absence of new protein translation, overexpressed caveolin-1-gfp is degraded faster than caveolin-1-gfp expressed from the endogenous caveolin 1 locus % loss of total caveolin-1-gfp
Drosophila PTEN Regulates Cell Growth and Proliferation through PI3K-Dependent and -Independent Pathways
 Developmental Biology 221, 404 418 (2000) doi:10.1006/dbio.2000.9680, available online at http://www.idealibrary.com on Drosophila PTEN Regulates Cell Growth and Proliferation through PI3K-Dependent and
Histone acetyltransferase CBP-related H3K23 acetylation contributes to courtship learning in Drosophila
 Li et al. BMC Developmental Biology (2018) 18:20 https://doi.org/10.1186/s12861-018-0179-z RESEARCH ARTICLE Open Access Histone acetyltransferase CBP-related H3K23 acetylation contributes to courtship
Supplementary Figure S1 Supplementary Figure S2
 Supplementary Figure S A) The blots shown in Figure B were qualified by using Gel-Pro analyzer software (Rockville, MD, USA). The ratio of LC3II/LC3I to actin was then calculated. The data are represented
Supplemental Figure 1
 1 Supplemental Figure 1 Effects of DATE shortening on HGF promoter activity. The HGF promoter region (-1037 to +56) containing wild-type (30As) or truncated DATE (26As, 27As, 28A, 29As) from breast cancer
SUPPLEMENTARY INFORMATION
 Figure S1 Treatment with both Sema6D and Plexin-A1 sirnas induces the phenotype essentially identical to that induced by treatment with Sema6D sirna alone or Plexin-A1 sirna alone. (a,b) The cardiac tube