CCMTA Road Safety Report Series
|
|
|
- Carol Harris
- 6 years ago
- Views:
Transcription
1 CCMTA Road Safety Report Series ALCOHOL-CRASH PROBLEM IN CANADA: 2010 Prepared For Canadian Council of Motor Transport Administrators Standing Committee on Road Safety Research and Policies and Transport Canada By Traffic Injury Research Foundation of Canada 171 Nepean Street, Suite 200 Ottawa, Ontario March 2013
2 Canadian Council of Motor Transport Administrators and the Minister of Public Works and Government Services, represented by the Minister of Transport, This publication may be reproduced without permission provided that its use is solely for the purposes of private study, research, criticism, review or newspaper summary and the source is fully acknowledged. Conseil canadien des administrateurs en transport motorisé et le Ministre des Travaux publics et des Services gouvernementaux Canada, représenté par le ministre des Transports, Cette publication peut être reproduite sans permission à condition qu'elle soit utilisée uniquement pour des études privées, de la recherche, de la critique, de l'analyse ou pour faire l'objet d'un sommaire dans un journal et que la source soit parfaitement identifiée. Canadian Council of Motor Transport Administrators 2323 St. Laurent Blvd. Ottawa, Ontario K1G 4J8 Telephone: (613) Fax: (613) Internet:
3 CANADIAN COUNCIL OF MOTOR TRANSPORT ADMINISTRATORS The Canadian Council of Motor Transport Administrators is a non-profit organization comprising representatives of the provincial, territorial and federal governments of Canada which, through the collective consultative process, makes decisions on administration and operational matters dealing with licensing, registration and control of motor vehicle transportation and highway safety. It also includes associate members from the private sector and other government departments whose expertise and opinions are sought in the development of strategies and programs. The work of CCMTA is conducted by three permanent standing committees which meet twice a year. The mandates of the standing committees are as follows: The Standing Committee on Drivers and Vehicles is responsible for all matters relating to motor vehicle registration and control, light vehicle standards and inspections, and driver licensing and control. The Standing Committee on Compliance and Regulatory Affairs is concerned with the compliance activities of programs related to commercial driver and vehicle requirements, transportation of dangerous goods and motor carrier operations in order to achieve standardized regulations and compliance programs in all jurisdictions. The Standing Committee on Road Safety Research and Policies is responsible for coordinating federal, provincial and territorial road safety efforts, making recommendations in support of road safety programs, and developing overall expertise and strategies to prevent road collisions and reduce their consequences. CCMTA s Board of Directors also meets twice per year to attend to the overall management of the organization, determine policy direction and provide overall guidance and direction to the standing committees. Recommendations of the standing committees are ratified by the CCMTA Board. All CCMTA standing committee meetings are open to industry stakeholders. Associate membership further allows private organizations and other government bodies with an interest in matters dealing with motor vehicle transportation and highway safety to be kept apprised of CCMTA activities and have formal access to CCMTA meetings and proceedings. For further information on CCMTA projects and programs or associate membership, please contact the Secretariat.
4
5 ABSTRACT This report describes the magnitude and characteristics of the alcohol-crash problem in Canada during 2010 as well as trends in the problem. Information contained in this report was drawn from two national databases compiled and maintained by the Traffic Injury Research Foundation (TIRF) and funded jointly by Transport Canada and the Canadian Council of Motor Transport Administrators (CCMTA). One database contains information on persons fatally injured in motor vehicle crashes; the other has information on persons seriously injured in motor vehicle crashes. This report examines: data on alcohol in fatally injured drivers and pedestrians; the number and percent of people who died in alcohol-related crashes; and alcohol involvement in those crashes in which someone was seriously injured but not killed. Thus, in the report, various indicators are used to estimate the magnitude and extent of the alcohol-crash problem in Canada during 2010 as well as changes in the problem over the past few years. The indicators include: > the number and percent of people who were killed in crashes that involved alcohol; > the number and percent of fatally injured drivers who had been drinking; > the number and percent of fatally injured pedestrians who had been drinking; and > the number and percent of drivers in serious injury crashes that involved alcohol. As well, these indicators are presented separately for each province and territory (see note on pp ). This report also examines progress in Canada and each province/territory, in meeting the Strategy to Reduce Impaired Driving (STRID) 2010 objective, to reduce by 40% the percent of fatalities and serious injuries involving a drinking driver by The 2010 data are compared to data from the baseline period. The opinions expressed in this report are those of the authors and do not necessarily represent the views or opinions of the reviewers, sponsor, or jurisdictions involved in this project.
6
7 TABLE OF CONTENTS Acknowledgements... v 1.0 Introduction Data Sources and Indicators of the Alcohol-crash Problem Sources of the Data The Fatality Database The Serious Injury Database Indicators of the Problem The number and percent of people killed in alcohol-related crashes The number and percent of fatally injured drivers who had been drinking The number and percent of fatally injured pedestrians who had been drinking The number and percent of drivers in serious injury crashes that involved alcohol Canada Deaths in Alcohol-Related Crashes Victim age Gender Victim type Type of vehicle occupied Alcohol in Fatally Injured Drivers Age differences Gender differences Vehicle differences Collision differences Alcohol in Fatally Injured Pedestrians Age differences Gender differences Jurisdictional differences Drivers Involved in Alcohol-related Serious Injury Crashes Driver age Driver gender Type of vehicle driven Type of collision Trends in the Alcohol-crash Problem Deaths in alcohol-related crashes: Fatally injured drivers: Fatally injured pedestrians: Drivers in serious injury crashes: British Columbia Alberta Saskatchewan iii
8 7.0 Manitoba Ontario Quebec New Brunswick Nova Scotia Prince Edward Island Newfoundland and Labrador Yukon Northwest Territories Nunavut References iv
9 ACKNOWLEDGEMENTS The Traffic Injury Research Foundation of Canada (TIRF) has compiled data on alcohol use among motor vehicle fatalities since the 1973 calendar year. Beginning in 1995, TIRF has also compiled data on alcohol use in serious injury motor vehicle crashes. All aspects of this work - but, in particular, the development, maintenance, and extension of the Fatality Database and the Serious Injury Database - would have been impossible without the generous support and cooperation of sponsors and collaborating agencies. The maintenance and extension of the Fatality Database and the Serious Injury Database are cofunded by CCMTA and the Road Safety and Motor Vehicle Regulation Directorate of Transport Canada. We gratefully acknowledge the following individuals, their organizations and members of their staff for ensuring that complete and accurate data were made available to us: S. Senghera Manager, Road Safety Policy and Programming Insurance Corp. of British Columbia J. Espie Executive Director Office of Traffic Safety Alberta Transportation M. Zhang Traffic Accident Information System Saskatchewan Government Insurance W.A. Keith Registrar of Motor Vehicles Manitoba Public Insurance R. Fleming Assistant Deputy Minister Road User Safety Division Ontario Ministry of Transportation L. Vézina Directrice des études et des stratégies en sécurité routière Société de l'assurance automobile du Québec L. Lapointe Chief Coroner Office of the Chief Coroner British Columbia A. Sauvageau, M.D. Chief Medical Examiner Alberta Attorney General K. Stewart Chief Coroner Saskatchewan Justice T. Balachandra, M.D. Chief Medical Examiner Manitoba Justice A. McCallum, M.D. Chief Coroner for Ontario Ontario Ministry of the Solicitor General Dre L. Nolet Le coroner en chef Bureau du Coroner Quebec v
10 C. O Donnell Registrar of Motor Vehicles Department of Public Safety New Brunswick P. Arsenault Registrar of Motor Vehicles Service Nova Scotia & Municipal Relations Nova Scotia C. Burggraaf Registrar of Motor Vehicles Department of Government Services and Lands Newfoundland and Labrador M. Conway Director Road Licensing and Safety Division Dept. of Transportation Northwest Territories W. Brennan Deputy Registrar Yukon Department of Motor Vehicles J. MacDonald Director, Highway Safety Department of Transportation and Public Works Prince Edward Island 1BL. Gee Director, Motor Vehicle Division Nunavut 0BG. Forestell Chief Coroner Department of Public Safety New Brunswick M. Bowes, M.D. Chief Medical Examiner Department of the Attorney General Nova Scotia Dr. S. Avis Chief Medical Examiner Newfoundland and Labrador C. Menard Chief Coroner Department of Justice Northwest Territories S. Hanley Chief Coroner Yukon Department of Justice R. Henderson, M.D. Director of Laboratory Medicine Queen Elizabeth Hospital Prince Edward Island C. Trainor, M.D. Chief Medical Examiner Prince Edward Island P. Suramala Chief Coroner Nunavut vi
11 INTRODUCTION 1.0 INTRODUCTION This report describes the magnitude and characteristics of the alcohol-crash problem in Canada during 2010 as well as trends in the problem. It includes data on alcohol in fatally injured drivers and pedestrians derived from the Fatality Database. For the past two and a half decades, the Fatality Database, developed and maintained by the Traffic Injury Research Foundation (TIRF), has provided objective data on alcohol use among persons fatally injured in motor vehicle crashes. Each year, TIRF compiles information from coroner and medical examiners files on the results of toxicological tests for alcohol in the blood of fatally injured drivers and pedestrians. Given a high testing rate in all jurisdictions, particularly among fatally injured drivers, the Fatality Database has proven a valid and reliable source of descriptive data on the magnitude and characteristics of the alcohol-fatal crash problem, a means for monitoring changes/trends in the problem as well as a valuable tool for research on alcohol-impaired driving. The Fatality Database is co-funded by CCMTA and Transport Canada. This report also uses supplemental data obtained from police collision reports and coroner files to examine the number and percent of people who died in alcohol-related crashes in Canada. Thus, it extends the focus beyond fatally injured drivers to include all persons killed in road crashes, to provide a better indication of the magnitude and nature of the drinking-driving problem. This report also examines alcohol involvement in those crashes in which someone was seriously injured but not killed. For this purpose, relevant information is derived from a Serious Injury Database, constructed and maintained by TIRF, under a related project funded by Transport Canada and CCMTA. Since few drivers involved in serious injury crashes are tested for alcohol, a surrogate or indirect measure is used to assess the incidence of alcohol involvement in these crashes (see note on pp ). The focus on alcohol-related serious injury crashes underscores the fact that serious injury is too often a consequence of drinking and driving. It also recognizes that the federal/ provincial/territorial Strategy to Reduce Impaired Driving (STRID 2010) seeks to reduce alcohol-related fatalities and serious injuries by 2010 by 40% compared to the baseline period. Thus, this report includes information on both fatal and serious injury crashes to provide as comprehensive a picture as possible of the magnitude and nature of the alcoholcrash problem in Canada during 2010, changes/trends in the problem, and progress in meeting the STRID 2010 objectives. 1
12 DATA SOURCES AND INDICATORS The report is divided into the following fifteen sections: Section 2.0 briefly describes the sources of the data the Fatality Database and Serious Injury Database and the various indicators of the alcohol-crash problem used in this report. Section 3.0 provides descriptive data on the incidence of alcohol involvement in fatal and serious injury crashes in Canada during 2010 as well as trends in the problem. In subsequent sections (4.0 through 16.0), descriptive data on alcohol involvement in fatal and serious injury crashes in each province and territory are summarized. Trends in the problem and progress in meeting the STRID 2010 objectives are also examined. Further information on STRID 2010 is contained on the CCMTA website at: Caution should be exercised in interpreting some of the numbers and percentages in Sections 4.0 through 16.0 as some of the subgroups examined are small in number.. 2
13 DATA SOURCES AND INDICATORS 2.0 DATA SOURCES AND INDICATORS OF THE ALCOHOL-CRASH PROBLEM Information contained in this report was drawn from two national databases compiled and maintained by TIRF and funded jointly by Transport Canada and the CCMTA. One database contains information on persons fatally injured in motor vehicle crashes; the other has information on persons seriously injured in motor vehicle crashes. These two sources of information are described in this section of the report. The section also describes the various indicators that are used to estimate the magnitude and extent of the alcohol-fatal and -serious injury crash problem in Canada during 2010 as well as changes in the problem over the past few years. The indicators include: > the number and percent of people who were killed in crashes that involved alcohol; > the number and percent of fatally injured drivers who had been drinking; > the number and percent of fatally injured pedestrians who had been drinking; and > the number and percent of drivers in serious injury crashes that involved alcohol. 2.1 SOURCES OF THE DATA Two national databases were used to generate the statistics for this report the Fatality Database and the Serious Injury Database. The Fatality Database was initially developed in the early 1970s to provide a comprehensive source of objective data on alcohol use among persons fatally injured in motor vehicle crashes occurring on and off public highways in Canada. It is historically intact from 1973 to 2010, inclusive, for seven provinces British Columbia, Alberta, Saskatchewan, Manitoba, Ontario, New Brunswick, and Prince Edward Island. Beginning with 1987, data are available from all jurisdictions in Canada. The Serious Injury Database was initially constructed in the mid-1990s to examine the incidence of alcohol in crashes that involve a serious injury i.e., a crash that resulted in a person being admitted to a hospital. It has been primarily used as a means to assess the extent to which the federal-provincial/territorial Strategy to Reduce Impaired Driving (STRID 2001 and now STRID 2010) have achieved a reduction in alcohol-related serious injury crashes. Since 1995, relevant information on crashes that involve serious injury has been assembled from all jurisdictions in Canada. 3
14 DATA SOURCES AND INDICATORS The Fatality Database. The Fatality Database consists of case files (records) of persons fatally injured in motor vehicle crashes. Two sources of information provide data for most case files: (1) police reports on fatal motor vehicle collisions and (2) coroners and medical examiners reports. In general, both sources must be accessed to obtain complete data on victims, crashes, vehicles, and toxicology. Police-reported data include characteristics of the victim (age and sex, position in the vehicle driver, passenger) and details of the crash (type of vehicle(s) and collision, time, date). Objective, toxicological data on alcohol use among victims are obtained from files in coroners' and medical examiners' offices. The alcohol data are the results of chemical tests, performed on body fluid samples (typically blood) by recognized forensic laboratories or other facilities. Uniform and rigorous testing procedures in each jurisdiction ensure reliable and accurate data on the prior use of alcohol by victims of motor vehicle collisions. As will be discussed in a subsequent section, there is a high rate of testing for alcohol in most jurisdictions, especially among drivers fatally injured in motor vehicle collisions. Details of the method used to access and collect relevant police-reported and coroner/medical examiner data on persons fatally injured in motor vehicle collisions as well as the approach used to create case files for the Fatality Database are contained in previous annual reports in this series (e.g., see Mayhew et al. 1999). The sections below provide a definition of a motor vehicle fatality, describe the number and type of victim contained in the Fatality Database, and discuss the testing rates for alcohol overall in Canada as well as in each jurisdiction. Motor vehicle fatality. A motor vehicle fatality is defined in the data capture procedures, and in this report, as any person dying within 12 months as a result of injuries sustained in a collision involving a motor vehicle. Since this definition of a motor vehicle fatality differs somewhat from those of some coroners/medical examiners and some provincial transportation agencies, the number of fatalities included in the Fatality Database may also differ slightly from those reported by other official sources (see Mayhew et al for a description of how these agencies define motor vehicle fatalities). Number of fatalities: Official sources compared to the Fatality Database. The Fatality Database contains information on 2,541 persons fatally injured in motor vehicle collisions in Canada during This figure is higher than the number that would be obtained by adding together the fatalities officially reported in each jurisdiction in Canada. The primary reason that the Fatality Database has more cases than the transportation agencies is that the Database typically includes victims of motor vehicle crashes that occurred off-road (e.g., ATV, 4
15 DATA SOURCES AND INDICATORS snowmobile) and on private property (e.g., farm tractors, industrial motor vehicles) cases which are not routinely contained in the files of transportation agencies. And, as mentioned previously, the definition of a motor vehicle fatality i.e., length of time from crash to death differs from those of the transportation agencies. Figure 2-1 and the data table provide a comparison of the number of traffic fatalities reported by transportation agencies with the number of motor vehicle fatalities included in the Fatality Database for For most of the jurisdictions, the number of cases in the TIRF database is higher than that officially reported by transportation agencies. Type of victim. The Fatality Database contains information on three types of victims fatally injured in motor vehicle crashes drivers/riders, passengers, and pedestrians. Drivers include operators of all types of vehicles, both on road (automobiles, trucks/vans, motorcycles, buses, emergency vehicles) and off-road (bicycles, all terrain vehicles, dirt bikes, snowmobiles, and farm tractors). Similarly, passengers include other vehicle occupants as well as persons riding on vehicles (motorcycles, bicycles, ATVs) but not driving or operating them. And, finally, pedestrians are those individuals travelling on foot who were struck and fatally injured by a motor vehicle. In Canada during 2010, almost 2 out of every 3 fatalities were operators of motor vehicles (63.8%); 21.6% were passengers; and 14.1% were pedestrians. From this perspective, vehicle occupants, particularly drivers, remain the major road-user group of concern for traffic safety. 5

16 DATA SOURCES AND INDICATORS Testing rates for alcohol. The inclusion of objective data on the presence of alcohol among traffic victims represents an important feature of the Fatality Database. The value of this information depends greatly on the frequency with which tests for the presence of alcohol are performed on the body fluids of victims. In Canada during 2010, fatally injured drivers were tested most frequently (82.9%), followed by pedestrians (59.8%) and passengers (27.7%). The testing rate among fatally injured pedestrians and passengers increases slightly if victims under the age of 16, who are less often tested, are excluded (63.1% and 29.0%, respectively). Testing rates also increase among fatally injured pedestrians if the analyses focus only on persons dying less than six hours after the crash (applying this restriction, the testing rate among pedestrians increases to 72.4%). The rate of testing for alcohol varies not only as a function of the type of victim but by jurisdiction as well. This is illustrated graphically in Figure 2-2, which shows the rate of testing for alcohol among fatally injured drivers in the various jurisdictions. 6 Most jurisdictions test over 80.0% of the driver fatalities. In some jurisdictions, there is clearly room for improvement the testing rates need to be increased to enhance the reliability and utility of the information. In those jurisdictions with a high rate of testing for fatally injured drivers, there are various reasons why tests are not done on some drivers. This occurs, for example, when the victim survived the initial crash and died much later the alcohol results at that time would be of little value. Or, if extensive transfusions were given to the victim prior to death, there is little point in taking a blood sample for an alcohol test. And, if the victim were

17 DATA SOURCES AND INDICATORS incinerated in a vehicle fire, or massive injuries resulted in exsanguination (i.e., excessive loss of blood), body fluids may not be available for testing. Figure 2-3 shows the rate of testing for alcohol among fatally injured pedestrians in the various jurisdictions. As can be seen, there is considerable variation in the rate of testing from 32.7% in Quebec to 100.0% in Prince Edward Island. The Yukon, Northwest Territories and Nunavut have been regrouped to ensure that one of the pedestrians cannot be identified The Serious Injury Database. The Serious Injury Database contains information on persons seriously injured in crashes and on all drivers involved in these crashes, whether the driver was injured or not. The data come from motor vehicle crash reports completed by investigating police officers. The information compiled for each seriously injured person and crashinvolved driver includes: personal characteristics (age and sex); factors contributing to the crash, including police-reported alcohol involvement; type of vehicle driven/occupied (e.g., automobile, truck/van, motorcycle) and the details of the crash (time, date, type of collision multiple vehicle/single vehicle). To construct the database, annual motor vehicle collision data are obtained from each jurisdiction in Canada. These data are either provided to TIRF by the relevant agency in the jurisdiction or, in some cases, provided to TIRF by Transport Canada who received the collision data from the jurisdiction. Relevant information on collisions in which someone was seriously injured is extracted from the provincial/territorial data files and then aggregated into 7
18 DATA SOURCES AND INDICATORS the national Serious Injury Database. The Serious Injury Database provides data from 1995 to 2010 for all jurisdictions except the Yukon and British Columbia. Only since 1998 in the Yukon and 2005 in British Columbia have investigating officers been able to record on the police report form whether the crash involved a serious injury or, at the person level, the severity of the injury a person sustained in the crash. Accordingly, it was not possible to identify persons who sustained a serious injury or drivers involved in serious injury crashes in those jurisdictions prior to the dates indicated. For this reason, the Canadian trend data presented in Section include data from neither the Yukon nor British Columbia. However, in the British Columbia and Yukon trends section of the report (Sections and , respectively), data are presented on drivers involved in alcohol-related injury crashes i.e., crashes that involve any severity of injury, from minimal to serious as opposed to other jurisdictions which report serious injury data. In the case of Nunavut (24.4%), British Columbia (19.0%), Manitoba (15.7%), and the Northwest Territories (7.1%), some injury severities are recorded as unspecified, so the number of drivers in serious injury crashes used in this report for these four jurisdictions might be underestimated. The sections below provide a definition of a serious injury crash, describe the number and type of cases contained in the Serious Injury Database, and discuss the use of a surrogate or indirect measure to assess alcohol involvement in these crashes. Serious injury. A serious injury crash is one that resulted in at least one person being admitted to a hospital. The serious injury may have been sustained by a driver, passenger or pedestrian involved in the crash (i.e., the driver involved in a serious injury crash may not have been the person seriously injured). Number of cases. In Canada during 2010, 11,338 persons were seriously injured in motor vehicle crashes; 14,476 drivers were involved in these crashes. These numbers for Canada exclude Newfoundland and Labrador because data on serious injury cases were not available at the time this report was being prepared. Table 2-1 shows the number of drivers for each province and territory. Alberta accounts for the largest number of the drivers involved in serious injury crashes (3,778 drivers or 26.1% of the national total); Nunavut accounts for the lowest number of drivers in such crashes, five drivers (or less than 0.1% of all drivers). 8
19 DATA SOURCES AND INDICATORS Table 2-1 Number and Percent of Drivers Involved in Serious Injury Crashes in Each Jurisdiction: Canada, 2010 Jurisdiction Number % of of Drivers Total British Columbia 2, Alberta 3, Saskatchewan Manitoba Ontario 3, Quebec 3, New Brunswick Nova Scotia Prince Edward Island Newfoundland and Labrador* Yukon Territory Northwest Territories Nunavut TOTAL 14, * excluding Newfoundland and Labrador; data not available at time of publication. Type of cases. The Serious Injury Database includes information on persons who sustained a serious injury in a motor vehicle crash and information on all drivers involved in these crashes. Drivers include operators of all types of vehicles: automobiles, trucks/vans, motorcycles, bicycles, all terrain vehicles, dirt bikes, and snowmobiles. It should be noted that analysis of the vehicle occupied by drivers in Canada involved in serious injury crashes in 2010 excludes Quebec. Since March 2010, Quebec has regrouped automobiles and light trucks into a single category in its collision data. Of all the drivers involved in serious injury crashes: almost half were automobile drivers (48.0%); one-third were truck/van drivers (33.1%); 8.3% were motorcycle riders; 5.2% were off-road vehicle drivers (e.g., snowmobiles, dirt bikes); 3.1% were tractor-trailer drivers; and 1.2% were drivers of other types of highway vehicles (e.g., buses, emergency vehicles). A surrogate measure of alcohol involvement. Drivers in serious injury crashes are seldom tested for alcohol. The investigating police officer may, however, indicate the condition of each of the drivers involved in the crash (e.g., whether or not they had been drinking), or in the case of Quebec, if alcohol was a probable cause in the crash. 9
20 DATA SOURCES AND INDICATORS Unfortunately, a judgement by police about the drivers use of alcohol is not always made. In addition, the investigating police officer may determine that some other factor e.g., driver fatigue, medical or physical defect would more accurately describe the condition of the driver. Thus, relying exclusively on police-reported alcohol involvement would underestimate the magnitude of the alcohol-related serious injury crash problem. To overcome this data limitation, a surrogate or indirect measure of alcohol involvement is used in this report. A description of this surrogate measure is provided in the next section. 2.2 INDICATORS OF THE PROBLEM The indicators used to describe the magnitude and nature of the alcohol-related fatal and serious injury crash problem include: > the number and percent of pople who are killed in alcohol-related crashes; > the number and percent of fatally injured drivers who had been drinking or were legally impaired; > the number and percent of pedestrians who had been drinking; > the number and percent of drivers in serious injury crashes that involved alcohol. Each of these indicators of the problem is described briefly below The number and percent of people killed in alcohol-related crashes. For each person killed in a motor vehicle crash, it was possible to determine if alcohol was a factor in the crash. A motor vehicle fatality was considered to be alcohol-related if there was at least one drinking driver or drinking pedestrian in the fatal crash. To determine if alcohol was involved in the fatal crash, information on the BAC of fatally injured drivers and pedestrians from the Fatality Database was supplemented with any other evidence of alcohol in the fatal crash identified from either the coroner s report or from the police collision report e.g., the police reported that a driver or pedestrian in the fatal crash had consumed alcohol. The review of coroner files and police reports provided information on the presence of alcohol among drivers who died but were not chemically tested for alcohol; drivers who survived (virtually all of whom are not tested), and pedestrians who were not tested. 10 Among all the people who died in motor vehicle crashes both on- and off-road in Canada during 2010, it was possible to determine if alcohol was a factor in the crash in 91.0% of the cases.
21 DATA SOURCES AND INDICATORS The number and percent of fatally injured drivers who had been drinking. The magnitude of the alcohol-fatal crash problem is usually stated in terms of the number and percent of fatally injured drivers who were positive for alcohol. As mentioned previously, this indicator of the problem is useful because of its validity and because the requisite data have been routinely compiled each year as part of the Fatality Database project. The indicator is a highly valid and reliable measure of the problem because almost all drivers who are killed in crashes are tested for the presence of alcohol i.e., similar to previous years, there was a high testing rate in Canada during 2010, with 82.9% of fatally injured drivers being tested for alcohol (see note on pp ) The number and percent of fatally injured pedestrians who had been drinking. Drinking pedestrians not just drinking drivers contribute to the overall magnitude of the alcohol-fatal crash problem each year in Canada. This occurs because walking on or beside the highways after drinking is extremely risky. Accordingly, this report uses information from the Fatality Database to examine the number and percent of fatally injured drinking pedestrians. This is possible because testing for alcohol, especially among those over 16 years of age is reasonably high 59.8% overall, which increases to 63.1% if victims under the age of 16 are excluded. Descriptive data on fatally injured drinking pedestrians are provided in the Canada section (3.0) but not in the provincial/territorial sections (4.0 through 16.0) of the report. The number of fatally injured pedestrians in most jurisdictions is relatively small, so detailed results for these jurisdictions would not be reliable. Jurisdictional results are also not reported to protect privacy. However, data on the overall incidence of fatally injured drinking pedestrians in each jurisdiction are presented in the Canada section of the report (3.3) The number and percent of drivers in serious injury crashes that involved alcohol. The extent to which alcohol is involved in serious injury crashes is not well documented and, consequently, poorly understood for two primary reasons. First, drivers involved in such crashes are seldom tested for the presence of alcohol. Second, investigating police officers do not always report the presence of alcohol in these crashes see Mayhew et al. (1997) for a discussion of the limitations of information on alcohol involvement contained in police collision reports. For these reasons, a surrogate or indirect measure of the alcohol-related serious injury crash problem has been used. A driver is identified as having been involved in an alcohol-related serious injury crash if the crash in which someone was seriously injured involved a single vehicle 11
22 DATA SOURCES AND INDICATORS at night, from 9:00 pm to 6:00 am (SVN), or if, in the case of a non-svn serious injury crash, the police reported alcohol involvement i.e., at least one drinking driver in the crash. Surrogate measures have been shown to correlate strongly with more objective measures of the alcohol-crash problem e.g., the number of drinking driver fatalities as determined by chemical tests in blood and provide a reasonably reliable estimate of trends in alcohol-related serious injury crashes. Such measures, however, have limited validity i.e., not all drinking drivers are identified so this measure likely provides a conservative estimate of the magnitude of the problem (see Mayhew et al. 1997) 12
23 CANADA 3.0 CANADA This section of the report reviews the major findings on alcohol involvement in fatal and serious injury motor vehicle collisions in Canada during It describes data on: > people who were killed in alcohol-related crashes (Section 3.1); > alcohol use among fatally injured drivers (Section 3.2); > alcohol use among fatally injured pedestrians (Section 3.3); > drivers involved in alcohol-related serious injury crashes (Section 3.4); and > trends in the alcohol-crash problem (Section 3.5). 3.1 DEATHS IN ALCOHOL-RELATED CRASHES Table 3-1 presents information on people who died in alcohol-related crashes in Canada during Motor vehicle deaths are categorized in terms of the victim s age, gender, type (i.e., driver, passenger, pedestrian) and the type of vehicle they occupied. The first data column in the table presents the number of deaths. The next two columns show the number and percent of these fatalities in which sufficient information was available to determine if alcohol was involved. A motor vehicle fatality was considered to be alcohol involved if there was at least one drinking driver or drinking pedestrian in the fatal crash. For example, 247 people age were killed in road crashes in Canada during And, in 233 of these cases (94.3%) it was possible to determine if alcohol was a factor in the crash. The next column shows the number of people killed in crashes that were known to be alcoholinvolved. For example, 110 people age died in alcohol-related crashes in Canada during The next column expresses this as a percentage e.g., 47.2% of the year olds died in an alcohol-related crash. The final column (percent of all alcohol-related deaths) expresses the number of deaths in alcohol-related crashes as a percent of all the deaths in such crashes. For example, the alcohol-related deaths among year olds represent 12.3% of all the people killed in alcohol-related crashes in Canada during
24 CANADA Table 3-1 Deaths* in Alcohol-Related Crashes: Canada, 2010 Category Number Alcohol Use Known Alcohol-Related Deaths of Victim of Deaths % of % of % of all alcohol- Number total Number known related deaths Age < > Gender Male Female Type Driver/Operator Passenger Pedestrian Unknown Vehicle Occupied Automobiles Trucks/Vans Motorcycles Tractor Trailers Other Hwy. Vehs Off-road Vehicles (Pedestrians) Unknown TOTAL *persons dying within 12 months in collisions on and off public roadways 14 The totals at the bottom of the table provide a summary. As can be seen, 2,541 persons died in motor vehicle crashes in Canada during In 2,312 (91.0%) of these cases, it was possible to determine if alcohol was a factor. Of these known cases, 895 (38.7%) involved alcohol. Extrapolating this figure to the total number of motor vehicle fatalities (2,541 x.387) it can be estimated that in Canada during 2010, 984 persons died in alcohol-related crashes.
 group accounted for only 1.8% of all people who died in alcohol-related crashes.")
25 CANADA Victim age. Of all the people who died in alcohol-related crashes (see last column of Table 3-1), 21.1% were aged 20-25; 19.8% were aged 26-35; 17.3% were aged 36-45; 15.5% were aged 46-55; 12.3% were aged 16-19; and 12.2% were over age 55. The youngest (<16) group accounted for only 1.8% of all people who died in alcohol-related crashes. Figure 3-1 shows the percent of alcohol-related deaths within each age group. The highest incidence of alcohol involvement occurred in the crashes in which persons aged and died (56.8% and 55.3%, respectively). The lowest incidence of alcohol involvement was found among the youngest and oldest fatalities only 17.0% of persons under 16 and 16.5% of persons over 55 years of age died in crashes involving alcohol Gender. Of all the people who died in alcohol-related crashes, 79.1% were males. The incidence of alcohol in crashes in which a male died (43.0%) was greater than the incidence of alcohol in crashes in which a female died (28.1%) Victim type. Of all the people who died in alcohol-related crashes, 65.9% were drivers/operators of a vehicle; 20.1% were passengers; 13.7% were pedestrians; and 0.2% were victims whose position was unknown. Within each of these victim types, there are some differences in alcohol involvement. Among the principal victim types, the highest incidence of alcohol involvement (40.3%) occurred in the crashes in which a pedestrian died. Alcohol was involved in 39.2% of the crashes in which a driver/operator died and in 36.1% of cases where a passenger died. 15
26 CANADA Type of vehicle occupied. Of all the people who died in alcohol-related crashes, over two-fifths (42.7%) were in an automobile; 24.4% were in a truck/van; 12.6% were on an offroad vehicle (e.g., bicycle, snowmobile, all-terrain vehicle); and 6.4% were on a motorcycle. The incidence of alcohol involvement in which a truck/van occupant died was greater than the incidence of alcohol in crashes in which an automobile occupant died (43.8% versus 36.7%). The incidence of alcohol involvement in which a person on a motorcycle died was 31.0%. Alcohol was involved in 48.1% of the crashes in which a person on an off-road vehicle died. 3.2 ALCOHOL IN FATALLY INJURED DRIVERS This section presents information on the presence of alcohol, exclusively among drivers fatally injured in Canada during Table 3-2 shows the information by age group, gender, vehicle type, and collision type (single vs. multiple). The data are presented for drivers of the principal types of vehicles (i.e., automobiles, trucks, vans, motorcycles, tractor-trailers). The first data column in the table shows the number of drivers killed. The next two columns show the number and percent of these victims who were tested for alcohol. The remaining columns provide information on the results of the alcohol tests this includes the percent of those tested who were positive for alcohol in each of five blood alcohol concentration (BAC) levels. To illustrate, among year olds there were 111 drivers killed during 2010; 95 of these fatally injured drivers (85.6%) were tested for alcohol. Of those who were tested, 62.1% showed no evidence of alcohol, 4.2% had BACs below 50 mg%, 3.2% had BACs from 50 to 80 mg%, 13.7% had BACs from 81 to 160 mg%, and 16.8% had BACs over 160 mg%. The main findings are shown by the totals at the bottom of the table. As can be seen, there were 1,372 drivers fatally injured in traffic crashes in Canada during The overall rate of testing for alcohol in drivers was 84.5%, slightly higher than the rate in %. Among tested drivers in Canada: > 62.6% showed no evidence of alcohol 37.4% had been drinking; > 4.1% had BACs from 1-49 mg%; > 2.2% had BACs from mg% > 11.1% had BACs from 81 to 160 mg%; and, > 19.9% had BACs over 160 mg%. Thus, 37.4% of fatally injured drivers in Canada had been drinking and most of these had illegal BACs 83.1% of fatally injured drinking drivers had BACs >80 mg%. 16
27 CANADA Table 3-2 Alcohol Use Among Fatally Injured Drivers: Canada, 2010 Category Number Drivers Tested Percent of Tested Drivers with BACs of: of of % of Driver Drivers* Number total Zero >160 Age < > Gender Male Female Vehicle Type Automobile Motorcycle Tractor Trailer Heavy Truck Van Light Truck Other Truck Other Hwy. Vehicle Collision Type Single-Vehicle Multiple-Vehicle TOTAL * Excludes operators of bicycles, snowmobiles, farm tractors and other non-highway vehicles. 1 Trucks over 4500 kg. 2 e.g., pickup trucks. 3 Utility vehicles, plows and trucks of unknown type. 4 Emergency vehicles and buses. Note: The vehicle types that appear in the shaded area correspond to the truck/van category used in the jurisdictional sections of this report. In Figure 3-2, the BAC distribution for tested fatally injured drivers is extrapolated to reflect the BAC distribution for all fatally injured drivers. In this figure, 510 of 1,372 drivers (37.2%) have a positive BAC. And among fatally injured drinking drivers, 425 (83.3%) have BACs over 80 mg% (see note on pp ). 17

28 CANADA Age differences. Figures 3-3 and 3-4 summarize the data from Table 3-2 for the various age groups. Figure 3-3 shows the percent of all drinking drivers accounted for by each age group. The bar on the left shows the percent of all fatally injured drivers with any evidence of alcohol accounted for by each age group. On the right is shown the percent of legally impaired drivers BACs over 80 mg% accounted for by each age group. Drivers under 16 are not included because very few of them had been drinking. 18
, 23.7% were aged 26-35; 20.")
29 CANADA Of all the fatally injured drinking drivers, 23.6% were aged 26-35; 19.9% were aged 20-25; 19.2% were aged 36-45; 17.6% were aged 46-55; and 11.3% were over age 55. Those aged accounted for only 8.3% of the fatally injured drinking drivers. Of all the fatally injured legally impaired drivers (i.e., those with BACs over 80 mg%), 23.7% were aged 26-35; 20.1% were aged 20-25; 19.8% were aged 36-45; 18.4% were aged 46-55; and 10.0% were over age 55. Those aged accounted for only 8.1% of fatally injured drivers who were over the legal limit. Figure 3-4 presents the information in a slightly different manner. For each age group, the percentage of drivers who were sober (zero BAC) is shown by the lower, black portion of the bar; the percent who were positive for alcohol but whose BAC was below the legal limit (1-80 mg%) is shown by the white section in the middle, and the percent with BACs over the legal limit (>80 mg%) is shown by the upper, grey part of the bar. Within each of the age groups, fatally injured drivers age were the most likely to have been drinking 51.3% of drivers in this age group had been drinking. By contrast, only 16.1% of tested drivers over age 55 had been drinking. 19
30 CANADA Gender differences. Males dominate the picture they account for 84.8% of all the fatally injured drivers who had been drinking and 84.4% of all of the fatally injured drivers who were legally impaired. Males dominate the picture largely because they account for 77.4% of the drivers who are killed (1,062 of the 1,372 fatalities are males). A comparison in the prevalence of alcohol use among male and female fatally injured drivers is shown in Figure 3-5. The pie chart shows within each gender, the percent who were sober (i.e., 0 BAC) and positive for alcohol (+ BAC). The bar to the right of the pie chart shows the distribution of alcohol levels found among those who were drinking the percent who had alcohol levels above and below the legal limit. Percentages are given inside the figures; the absolute number of cases is shown adjacent to the figure. Fatally injured male drivers were considerably more likely to have been drinking than female drivers (40.8% and 25.5%, respectively). And, most of the male and female drivers who were drinking had BACs over the legal limit (82.8% and 84.8%, respectively). 20
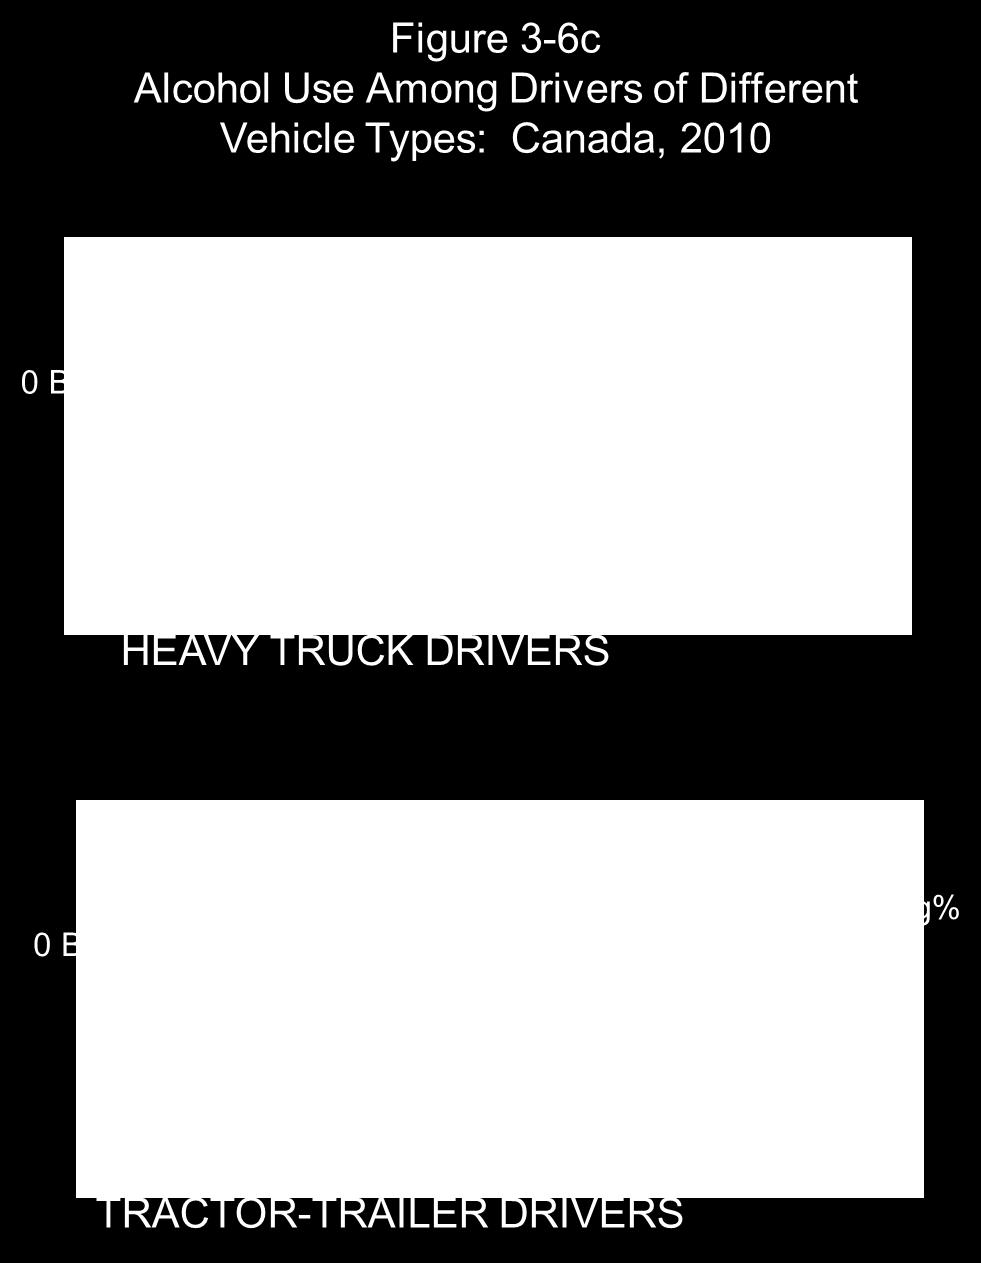
31 CANADA Vehicle differences. Table 3-3 shows the number and percent of drinking and legally impaired drivers accounted for by drivers of different types of vehicles. Of all the fatally injured drinking drivers (i.e., those with a positive BAC), 55.4% were automobile drivers; 24.2% were light truck drivers; 11.5% were motorcycle riders; and 8.3% were van drivers. Of all the fatally injured legally impaired drivers (i.e., those with BACs over 80 mg%), 55.6% were automobile drivers; 26.4% were light truck drivers; 9.2% were motorcycle riders; and 8.3% were van drivers. Figures 3-6a, 3-6b and 3-6c summarize the results of alcohol tests for drivers fatally injured in 2010 according to the type of vehicle being operated: automobile drivers and drivers of vans (Figure 3-6a); motorcycle riders and drivers of light trucks (Figure 3-6b); and drivers of heavy trucks and tractor-trailers (Figure 3-6c). A common format is used in all cases. The pie chart shows the number and percent of drivers who were sober as well as the number and percent of drivers who had been drinking. The bar chart displays the BAC distribution among those who were positive for alcohol. Among fatally injured automobile drivers, 36.7% had been drinking. Of those who were drinking, the vast majority (83.3%) had alcohol levels in excess of the legal limit. Among fatally injured van drivers, 41.9% had been drinking and most (83.3%) of these had BACs over the legal limit. Among motorcycle riders, 33.3% had been drinking and 66.0% of these had BACs over the legal limit. The highest incidence of drinking was found among drivers of light trucks 47.7% had been drinking and 90.5% of these had illegal BACs. Heavy truck and tractor-trailer drivers have a much lower frequency of alcohol involvement. Indeed, only 8.3% of heavy truck drivers had been drinking. And, the lowest incidence of drinking is found among tractor-trailer drivers only 3.2% had been drinking. 21
32 CANADA Table 3-3 Number and Percent of Fatally Injured Drinking and Legally Impaired Drivers Accounted for by Drivers* of Different Vehicle Types: Canada, 2010 Vehicle Number of % of All Number of Legally % of All Legally Type Drinking Drivers Drinking Drivers Impaired Drivers Impaired Drivers Automobile Motorcycle Tractor-Trailer Heavy Truck Van Light Truck TOTAL * Excludes operators of bicycles, snowmobiles, farm tractors and other non-highway vehicles. 1 Trucks over 4500 kg. 2 e.g., pickup trucks. 3 Utility vehicles, plows and trucks of unknown type. 22
33 CANADA 23
34 CANADA Figures 3-6d and 3-6e present similar information on the incidence of drinking among drivers operating recreational vehicles (results for these vehicle types are not included in Tables 3-2 or 3-3). As can be seen, the lowest incidence of drinking was found among bicyclists only 25.5% of fatally injured bicyclists had been drinking at the time of the collision. Among those bicyclists who had been drinking, 75.0% had BACs over the legal limit. Among snowmobile drivers, 72.4% had been drinking and 85.7% had BACs over the legal limit. Operators of all-terrain vehicles were less likely than snowmobile drivers to have been drinking 54.4% of them had been drinking and 74.4% of these drinking drivers had BACs over the legal limit. 24
35 CANADA Collision differences. Less than half of all drivers killed (639 out of 1,372, or 46.6%) were involved in single-vehicle collisions but these crashes accounted for almost threequarters of the drivers who had been drinking or were legally impaired (71.4% and 76.1%, respectively). The reason for this apparent disparity is because alcohol is overrepresented in single-vehicle crashes. As shown in Figure 3-7, over half of the drivers involved in single-vehicle crashes (56.0%) were positive for alcohol, compared to only 20.4% of those involved in multiple-vehicle collisions. Most drinking drivers in single-vehicle crashes had BACs over the legal limit (88.7%). By contrast, among drinking drivers in multiple-vehicle crashes, 69.4% had BACs over the legal limit. 3.3 ALCOHOL IN FATALLY INJURED PEDESTRIANS This section presents information on the presence of alcohol among pedestrians fatally injured as a result of being hit by a motor vehicle in Canada during Table 3-4 shows the information by age group, gender and jurisdiction. The first data column in the table shows the number of pedestrians killed. The next two columns show the number and percent of these victims who 25
36 CANADA were tested for alcohol. The remaining columns provide information on the results of the alcohol tests this includes the percent of those tested who were positive for alcohol in each of five BAC levels. During 2010, as shown by the totals at the bottom of the table, there were 358 pedestrians fatally injured; 214 (59.8%) of these pedestrians were tested for the presence of alcohol. Among tested pedestrians: > 54.2% showed no evidence of alcohol 45.8% had been drinking; > 0.9% had BACs below 50 mg%; > 2.3 had BACs from 50 to 80 mg%; > 10.7% had BACs from 81 to 160%; and > 31.8% had BACs over 160 mg%. Thus, 45.8% of fatally injured pedestrians had been drinking and most of these had BACs over 80 mg% Age difference. Of all the fatally injured pedestrians, two-fifths (40.5%) were over 55 years of age (145 of the 358 pedestrian fatalities). The oldest pedestrians, however, accounted for a much smaller portion of the drinking pedestrians and those with BACs over 80 mg%. This is illustrated in Figure 3-8. The figure shows the percent of all drinking pedestrians accounted for by each age group. The bar on the left shows the percent of all fatally injured pedestrians with any evidence of alcohol accounted for by each age group. On the right is shown the percent of pedestrians with BACs over 80 mg% accounted for by each age group. Of all the fatally injured drinking pedestrians, 21.4% were aged 20-25; 18.4% were aged and 46-55; 16.3% were aged 16-19; 13.3% were aged 26-35; and 12.2% were over age
37 CANADA Table 3-4 Alcohol Use Among Fatally Injured Pedestrians: Canada, 2010 Category Number Pedestrians Tested Percent of Tested Pedestrians with BACs of: of of % of Pedestrian Pedestrians Number total Zero >160 Age < > Gender Male Female Jurisdiction British Columbia Alberta Saskatchewan Manitoba Ontario Quebec New Brunswick Nova Scotia Prince Edward Island Nfld and Labrador Territories* TOTAL * The Yukon, Northwest Territories and Nunavut have been aggregated to protect the identity of one of the pedestrians. 27

38 CANADA Of all the fatally injured pedestrians with BACs over 80 mg%, 23.1% were aged 20-25; 19.8% were aged 36-45; 18.7% were aged 46-55; 14.3% were aged 26-35; 13.2% aged 16-19; and 11.0% were over age 55. Figure 3-9 presents the information in a slightly different manner. For each age group, the percent of pedestrians who were sober (zero BAC) is shown by the lower, dark portion of the bar; the percent who were positive for alcohol but whose BAC was less than or equal to 80 mg% is shown by the white section in the middle, and the percent with BACs over 80 mg% is shown by the upper, grey part of the bar. 28
39 CANADA Within each of the age groups, fatally injured pedestrians age were the most likely to have been drinking 80.7% of pedestrians in this age group had been drinking. By contrast, only 16.4% of tested pedestrians over age 55 had been drinking Gender differences. Males account for three-quarters (77.6%) of all the fatally injured pedestrians who had been drinking, and 78.0% of all of the fatally injured pedestrians who had BACs over 80 mg%. Males dominate the picture because they account for 61.7% of the pedestrians who are killed (221 of the 358 fatalities are male). Figure 3-10 summarizes the findings for alcohol use among fatally injured male and female pedestrians. The pie chart shows the proportion of those pedestrians who were sober (0 BAC) and those positive for alcohol (+ BAC). The bar to the right of the pie chart shows the distribution of alcohol levels found among those who had been drinking; the percent who had BACs above and below 80 mg%. Percentages are given inside the figures; the absolute number of cases is shown adjacent to the figure. Among fatally injured male pedestrians, 56.7% had been drinking and 93.4% of these pedestrians had BACs over 80 mg%. A slightly different picture emerges among fatally injured 29
40 CANADA female pedestrians only 27.5% had been drinking and 90.9% of these pedestrians had BACs over 80 mg% Jurisdictional differences. Of all the fatally injured pedestrians, 36.3% were killed in Ontario, 17.6% were killed in British Columbia and 14.5% were killed in Quebec. Ontario accounted for 29.6% and Alberta accounted for 24.4% of the fatally injured drinking pedestrians. Ontario accounted for 29.7% and Alberta accounted for 24.2% of the fatally injured pedestrians with BACs over 80 mg%. It should be noted that the figures for drinking and legally impaired pedestrians in Quebec and British Columbia are underestimated because they are based on tested pedestrians and the rate of testing for alcohol is low in these jurisdictions e.g., only 32.7% and 47.6% of pedestrians fatally injured in Quebec and British Columbia were tested, compared to 100.0% in Prince Edward Island, 88.2% in Manitoba and 87.5% in Nova Scotia. Pedestrians in the Northwest Territories, Yukon and Nunavut were grouped (into the Territories) to ensure that an individual pedestrian cannot be identified. As shown in Table 3-4, the highest incidence of alcohol in fatally injured pedestrians, however, was in the Territories and Saskatchewan (100.0% and 64.7%, respectively). The lowest incidence of alcohol in fatally injured pedestrians was in Prince Edward Island and Newfoundland and Labrador where 0.0% had been drinking. 3.4 DRIVERS INVOLVED IN ALCOHOL-RELATED SERIOUS INJURY CRASHES This section presents information on drivers involved in alcohol-related crashes in which someone was seriously injured in 2010 in Canada, excluding Newfoundland and Labrador because data from that province were not available at the time this report was being prepared. A surrogate or indirect measure is used to estimate alcohol involvement because drivers in serious injury crashes are seldom tested for alcohol. A driver is identified as having been involved in an alcohol-related serious injury crash if the crash in which someone was seriously injured involved a single vehicle, at night (SVN), or if, in the case of a non-svn serious injury crash, the police reported alcohol involvement i.e., they noted that at least one drinking driver was involved in the crash. The results are shown in Table 3-5 for drivers grouped in terms of age, gender, type of vehicle driven, and type of collision. The first data column shows the number of drivers involved in serious injury crashes. The number and percent of drivers in such crashes that involved alcohol is shown in the next two columns. The final column expresses the number of drivers involved in alcohol-related serious injury crashes in any row as a percent of all drivers involved 30
41 CANADA in alcohol-related serious injury crashes. Table 3-5 Drivers in Alcohol-Related Serious Injury Crashes: Canada*, 2010 Age Category Number Alcohol-Related of of % of % of all drivers in Drivers Drivers Number total alcohol-related crashes < > unknown Gender Male Female unknown Vehicle Type** Auto Truck/Van Motorcycle Tractor Trailer Other Hwy. Vehicle Off-Road Unknown Collision Type Single-Vehicle Multiple-Vehicle TOTAL * excluding Newfoundland and Labrador ** Vehicle type section excludes Quebec since this jurisdiction groups automobiles and light trucks together in its collision data since March As shown, by the totals at the bottom of the table, 14,476 drivers were involved in crashes in which someone was seriously injured. Among these, 18.9% were alcohol-related crashes. 31

42 CANADA Driver age. Of all the drivers involved in alcohol-related serious injury crashes, 22.5% were aged 26-35; 20.9% were aged 20-25; and 15.4% were aged Drivers under the age of 16 accounted for only 0.4% of all those involved in alcohol-related crashes. Figure 3-11 shows for each age group the percent of drivers who were in a serious injury crash that involved alcohol. The highest incidence of alcohol involvement was found for drivers aged (28.7%). The lowest incidence of involvement in alcohol-related crashes was found for the youngest age group of drivers those under 16 (7.3%) Driver gender. Of all the drivers involved in alcohol-related serious injury crashes, 75.2% were males. The incidence of involvement in alcohol-related serious injury crashes was also greater for males than for females (20.7% and 13.8%, respectively) Type of vehicle driven. Of all the drivers involved in alcohol-related serious injury crashes, 50.3% were automobile drivers and 33.8% were truck/van drivers. About one out of five of the serious injury crashes involving automobile and truck/van drivers were alcohol related (20.1% and 19.6%, respectively) as were 14.5% of motorcycle riders and 14.2% of drivers of other highway vehicles. The lowest incidence of involvement in alcoholrelated serious injury crashes was found among tractor-trailer drivers (13.5%) Type of collision. Of all the drivers involved in alcohol-related serious injury crashes, 68.8% of them were in single-vehicle crashes. The highest incidence of involvement in alcohol-related serious injury crashes was also found among drivers in single-vehicle crashes 38.7% of these drivers, compared to only 8.9% for drivers involved in multiple-vehicle crashes. 32
43 CANADA 3.5 TRENDS IN THE ALCOHOL-CRASH PROBLEM The previous sections examined four indicators of the alcohol-crash problem: the number and percent of people who died in crashes that involved alcohol; the number and percent of fatally injured drivers who had been drinking; the number and percent of fatally injured pedestrians who had been drinking; and the number and percent of drivers in serious injury crashes that involved alcohol. This section examines changes in these four indicators of the problem. Canada s progress in meeting the STRID 2010 objective of a 40% reduction in the alcohol-crash problem by 2010 is also reported by comparing findings in 2010 with those from the baseline period Deaths in alcohol-related crashes: Table 3-6 and Figure 3-12 show the number and percent of people who died in crashes involving a drinking driver from 1995 to These results differ slightly from those presented in Section 3.1 for two reasons. Table 3-6 Number* and Percent of Motor Vehicle Deaths** Involving a Drinking Driver: Canada, Year Number of Alcohol-Related Deaths Deaths Number % of total baseline * numbers are estimates based on the percent of deaths for which information was available to determine alcohol use. ** only on public roadways involving principal vehicle types. 33

44 CANADA First deaths that occur in crashes that involve a drinking pedestrian are not necessarily classified as alcohol-related deaths. The focus here is more restrictive, on deaths that occur in crashes involving at least one drinking driver. Second, the trend analyses focus on fatal crashes on public roadways involving principal vehicle types (where at least one of the vehicles involved is an automobile, truck/van, motorcycle or other highway vehicle). The previous analyses included all types of motorized vehicles (e.g., snowmobiles) on both public roadways and in off-road locations. As shown in the table and figure, the number of deaths in crashes that involved a drinking driver generally dropped from 1,296 to 815 between 1995 and 2004, rose to 907 in 2006, declined to a low of 714 in 2009, and rose again to 744 in The percentage of alcohol-related fatalities generally decreased from 38.8% in 1995 to a low of 29.6% in 2002, rose to 32.4% in 2003, decreased to 29.9% in 2005, rose to 32.7% in 2006, decreased to 32.4% in 2007, rose to 33.5% in 2008, decreased to 32.0% in 2009, and rose again to 33.6% in As shown at the bottom of the table, during the baseline period there was an average of 966 fatalities involving a drinking driver and they accounted for 33.1% of all fatalities. This means that the percent of fatalities involving a drinking driver increased by 1.5% from 33.1% in the baseline period ( ) to 33.6% in However, in terms of the number of persons killed in crashes involving a drinking driver, there has been a 23.0% decrease from an average of 966 in the baseline period ( ) to 744 in Fatally injured drivers: Data on alcohol use among fatally injured drivers over the 24-year period from 1987 to 2010 are shown in Table 3-7. Trends are illustrated in Figure 3-13 which shows changes in the percent of fatally injured drivers who: (1) showed no 34
45 CANADA evidence of alcohol represented by the white area; (2) had BACs below the legal limit shown by the light grey area; and (3) had BACs over the legal limit the dark grey area. The number of fatally injured drivers with BACs over the legal limit (> 80 mg%) generally declined from 742 to 384 between 1987 and 2004, rose to 459 in 2005, declined to 432 in 2007, rose slightly to 438 in 2008, and fell again to 360 in The percent of fatally injured drivers with BACs over the legal limit dropped from 43.1% to 27.1% between 1987 and 1999, fluctuated until 2005 (31.0%), declined to 30.2% in 2006, rose to 32.9% in 2008, and declined again to 31.1% in Table 3-7 Alcohol Use Among Fatally Injured Drivers: Canada, Drivers Grouped by BAC (mg%) Number of Number Percent Zero BAC 1-80 BAC >80 BAC YEAR Drivers* Tested Tested No. % Tested No. % Tested No. % Tested baseline * Excludes operators of bicycles, snowmobiles, farm tractors and other non-highway vehicles. 35

46 CANADA By contrast, the number of fatally injured drivers with zero BAC has fluctuated over this 24- year period, from 807 in 1987 to a high of 1,009 in In 2010, there were 726 fatally injured drivers with zero BAC. The percent of fatally injured drivers with zero BAC increased from 46.9% to 66.9% between 1987 and 1999, remained stable until 2004, decreased to 61.3% in 2008, and rose again to 62.6% in The number of fatally injured drivers with BACs between 1-80 mg% generally declined from 172 to 80 between 1987 and 2001, rose to 94 in 2004, decreased to 82 in 2005, rose to 104 in 2007, decreased to a low of 64 in 2009, and rose to 73 in The percent of fatally injured drivers with BACs between 1 and 80 mg% generally dropped from 10.0% in 1987 to 5.5% in 2005, rose in 2007 (7.4%), decreased to its lowest level in 2009 (5.3%), and rose again in 2010 (6.3%). When compared to the baseline period shown at the bottom of Table 3-7, the percentage of fatally injured drivers with zero BACs in 2010 increased by 0.5% (from 62.3% to 62.6%). Among drivers with BACs from 1-80 mg%, there was a 1.6% decrease (from 6.4% to 6.3%). And among those with BACs over 80 mg%, there was a 0.6% decrease (from 31.3% to 31.1%). Table 3-8 and Figure 3-14 show data on alcohol use among fatally injured drivers over a shorter period from These results also differ from those reported above for two reasons. First, the number of drivers is extrapolated to reflect the BAC distribution of drivers tested for alcohol (see Figure 3-2). Second, drivers are grouped in only two BAC categories: zero and positive. 36
47 CANADA As can be seen at the bottom of Table 3-8, the percentage of fatally injured drivers testing positive for alcohol from , the baseline period, is 37.7%. In 2010, 37.2% of fatally injured drivers tested positive for alcohol, which represents a 1.3% decrease from the baseline period. Table 3-8 Alcohol Use Among Fatally Injured Drivers*: Canada, Number of Drivers Grouped by BAC (mg%) YEAR Drivers* Zero (% Tested) Positive (% Tested) (54.6) 990 (45.4) (52.0) 992 (48.0) (51.9) 952 (48.1) (55.4) 912 (44.6) (56.1) 828 (43.9) (56.6) 835 (43.4) (58.3) 720 (41.7) (60.9) 704 (39.1) (60.9) 670 (39.1) (66.9) 593 (33.1) (64.4) 608 (35.6) (62.1) 623 (37.9) (65.0) 611 (35.0) (61.8) 639 (38.2) (65.3) 566 (34.7) (63.5) 651 (36.5) (62.9) 645 (37.1) (61.9) 635 (38.1) (61.3) 594 (38.7) (62.4) 540 (37.6) (62.8) 510 (37.2) (62.3) 653 (37.7) baseline * Numbers are estimates based on the BAC distribution of drivers tested for alcohol. 37
48 CANADA Fatally injured pedestrians: Data on alcohol use among fatally injured pedestrians over the 24-year period from 1987 to 2010 are shown in Table 3-9. Trends are illustrated in Figure 3-15 which shows changes in the percent of fatally injured pedestrians who: (1) showed no evidence of alcohol represented by the white area; (2) had BACs below the legal limit shown by the light grey area; and (3) had BACs over 80 mg% the dark grey area. Table 3-9 Alcohol Use Among Fatally Injured Pedestrians: Canada, Pedestrians Grouped by BAC (mg%) Number of Number Percent Zero BAC 1-80 BAC >80 BAC YEAR Pedestrians Tested Tested No. % Tested No. % Tested No. % Tested
49 CANADA The number of fatally injured pedestrians with a BAC over 80 mg% generally declined from a high of 171 in 1987 to 74 in 2002, rose to 92 in 2004, decreased to 85 in 2005, rose to 92 in 2006, decreased to a low of 70 in 2008, and rose again to 91 in The percent of fatally injured pedestrians with a BAC over 80 mg% generally declined from 41.3% in 1987 to its lowest level in 2002 (31.0%), rose to 37.1% in 2004, decreased to 35.0% in 2005, rose to 37.1% in 2006, decreased to 32.4% in 2007, and rose again to 42.5% in The number of fatally injured pedestrians with no evidence of alcohol generally decreased from 213 to 149 between 1987 and 2005, decreased to 144 in 2006, rose to 150 in 2007, decreased to a low of 114 in 2009, and rose slightly to 116 in The percent of fatally injured pedestrians with zero BAC has ranged from about 50% to 60% over this 24-year period 51.4% of fatally injured pedestrians showed no evidence of alcohol in 1987 compared to 54.2% in The number of fatally injured pedestrians with BACs between 1-80 mg% has fluctuated over this 24-year period with 30 in 1987, nine in 2005, 17 in 2007, 19 in 2009, and seven in The percent of fatally injured drivers with BACs between 1-80 mg% also fluctuated between 8.6% in 1991 and 3.7% in 2005, rose to 9.1% in 2009, and fell to a low of 3.3% in Drivers in serious injury crashes: Table 3-10 and Figure 3-16 show information on drivers involved in alcohol-related serious injury crashes. These results differ slightly from those reported earlier in Section 3-4. British Columbia and the Yukon are excluded from the Canada totals because relevant information on serious injury data was not available for these jurisdictions in all of the years examined. The 2009 and 2010 data do not include Newfoundland and Labrador because these data were not available at the time this report was being prepared. As can be seen, the incidence of alcohol-involvement in serious crashes has declined only slightly. Between 1995 and 2005 the number of drivers in serious injury crashes that involved alcohol declined from 4,106 to 2,919. This number rose to 3,048 in 2006 and fell to a low of 1,963 in The number of drivers in alcohol-related serious injury crashes in 2009 and 2010, however, is an underestimate since it excludes drivers for Newfoundland and Labrador. The percentage of drivers in serious injury crashes that involved alcohol generally dropped from 21.3% to 17.7% between 1995 and 2005, rose to 19.1% in 2006, decreased in 2008 (18.6%), rose slightly in 2009 (18.7%), and decreased again to 18.0% in
 1996 18174 3754 (20.7) 1997 17453 3506 (20.1) 1998 17405 3437 (19.7) 1999 17113 3368 (19.7) 2000 16466 3239 (19.7) 2001 16441 3164 (19.2) 2002 17328 3267 (18.9) 2003 16494 2917 (17.")
50 CANADA Table 3-10 Number and Percent of All Drivers in Serious Injury Crashes that Involved Alcohol 1 : Canada 2, Year Number of Alcohol Related Drivers Number % (21.3) (20.7) (20.1) (19.7) (19.7) (19.7) (19.2) (18.9) (17.7) (18.6) (17.7) (19.1) (19.0) (18.6) (18.7) (18.0) baseline (19.9) 1 single-vehicle nighttime crashes (SVN) as well as non-svn crashes that have police-reported alcohol involvement. 2 excludes drivers from BC and the Yukon; excludes Newfoundland and Labrador. 40
51 CANADA In the baseline period, an average of 19.9% of drivers in serious injury crashes were in an alcohol-involved crash. In 2010, the incidence of drivers in alcohol-involved crashes declined to 18.0%, a decrease of 9.5%. Table 3-11 and Figure 3-17 also show information on drivers involved in alcohol-related serious injury crashes. These results differ slightly from those reported earlier in Section 3-4 for two reasons. First, British Columbia and the Yukon are excluded from the Canada totals because relevant information on serious injury was not available for these jurisdictions in all of the years examined. Second, certain vehicle types e.g., bicycles, snowmobiles, farm tractors and other non-highway vehicles are excluded. And similar to Table 3-10, this table does not include 2009 and 2010 data for Newfoundland and Labrador. As can be seen, the incidence of alcohol-involvement in serious crashes has declined only slightly. Between 1995 and 2003 the number of drivers in serious injury crashes that involved alcohol declined from 3,918 to 2,761. This number increased in 2004 to 2,810, decreased to 2,767 in 2005, rose to 2,910 in 2006, and dropped to a low of 2,032 in 2010 (excluding drivers in Newfoundland and Labrador in 2009 and 2010). The percentage of drivers in serious injury crashes that involved alcohol dropped from 21.7% to 18.0% between 1995 and The percentage rose to 19.0% in 2004, declined to 18.1% in 2005, rose to 19.5% in 2006, and decreased to 18.0% in In the baseline period ( ), an average of 20.3% of drivers in serious injury crashes were in an alcohol-involved crash. In 2010, the incidence of drivers in alcohol-involved crashes was 18.0%, an 11.3% decrease. 41
 1996 17309 3658 (21.1) 1997 16396 3375 (20.6) 1998 16214 3272 (20.2) 1999 16043 3233 (20.2) 2000 15383 3095 (20.1) 2001 15336 3012 (19.6) 2002 15809 2997 (19.0) 2003 15344 2761 (18.")
52 CANADA Table 3-11 Number and Percent of All Drivers 1 in Serious Injury Crashes that Involved Alcohol 2 : Canada 3, Year Number of Alcohol Related Drivers Number % (21.7) (21.1) (20.6) (20.2) (20.2) (20.1) (19.6) (19.0) (18.0) (19.0) (18.1) (19.5) (19.4) (18.9) (18.9) (18.0) baseline (20.3) 1 excludes operators of bicycles, snowmobiles, farm tractors, and other non-highway vehicles. 2 single-vehicle nighttime crashes (SVN) as well as non-svn crashes that have policereported alcohol involvement 3 excludes drivers from BC and the Yukon; excludes Newfoundland and Labrador. 42
53 BRITISH COLUMBIA 4.0 BRITISH COLUMBIA This section of the report reviews the major findings on alcohol involvement in fatal and serious injury motor vehicle collisions in British Columbia during It describes data on: > people who were killed in alcohol-related crashes (Section 4.1); > alcohol use among fatally injured drivers (Section 4.2); > drivers involved in alcohol-related serious injury crashes (Section 4.3); and > trends in the alcohol-crash problem (Section 4.4). 4.1 DEATHS IN ALCOHOL-RELATED CRASHES Table 4-1 presents information on people who died in alcohol-related crashes in British Columbia during Motor vehicle deaths are categorized in terms of the victim s age, gender, type (i.e., driver, passenger, pedestrian) and the type of vehicle they occupied. The first data column in the table presents the number of deaths. The next two columns show the number and percent of these fatalities in which sufficient information was available to determine if alcohol was involved. A motor vehicle fatality was considered to be alcohol involved if there was at least one drinking driver or drinking pedestrian in the fatal crash. For example, 26 people age were killed in motor vehicle crashes in British Columbia during And, in 25 cases (96.2%) it was possible to determine if alcohol was a factor in the crash. The next column shows the number of people killed in crashes that were known to be alcoholinvolved. For example, 15 people aged died in alcohol-related crashes in British Columbia during The next column expresses this as a percentage i.e., 60.0% of the year olds who were killed died in an alcohol-related crash. The final column (percent of all alcohol-related deaths) expresses the number of deaths in alcohol-related crashes as a percent of all the deaths in such crashes. For example, the alcohol-related deaths among year olds represent 10.5% of all the people killed in alcohol-related crashes in British Columbia during The totals at the bottom of the table provide a summary. As can be seen, 387 persons died in motor vehicle crashes in British Columbia during In 365 (94.3%) of these cases, it was possible to determine if alcohol was a factor. Of these known cases, 143 (39.2%) involved alcohol. Extrapolating this figure to the total number of motor vehicle fatalities (387 x.392) it can be estimated that in British Columbia during 2010, 152 persons died in alcohol-related crashes Victim age. Of all the people who died in alcohol-related crashes, 24.5% (see last 43
54 BRITISH COLUMBIA column) were aged 26-35; 20.3% were aged 46-55; 16.1% were aged and 36-45; 11.2% were over age 55; 10.5% were aged 16-19; and 1.4% were under age 16. Within each of the age groups, the highest incidence of alcohol involvement occurred in the crashes in which a person aged and died (61.4% and 60.5%, respectively). The lowest incidence of alcohol involvement was found among the oldest and youngest fatalities 13.3% of persons under 16 and 15.0% of the fatalities over 55 years of age died in crashes involving alcohol. Table 4-1 Deaths* in Alcohol-Related Crashes: British Columbia, 2010 Category Number Alcohol Use Known Alcohol-Related Deaths of Victim of Deaths % of % of % of all alcohol- Number total Number known related deaths Age < > Gender Male Female Type Driver/Operator Passenger Pedestrian Vehicle Occupied Automobiles Trucks/Vans Motorcycles Other Hwy. Vehs Offroad Vehicles (Pedestrians) TOTAL *persons dying within 12 months in collisions on and off public roadways 44
55 BRITISH COLUMBIA Gender. Of all the people who died in alcohol-related crashes, 72.0% were males. The incidence of alcohol in crashes in which a male died (42.2%) was greater than the incidence of alcohol in crashes in which a female died (33.1%) Victim type. Of all the people who died in alcohol-related crashes, 55.9% were drivers/operators of a vehicle; 27.3% were passengers; and 16.8% were pedestrians. Within each of the victim types, the highest incidence of alcohol involvement (43.8%) occurred in the crashes in which a passenger died. Alcohol was involved in 40.0% of the crashes in which a pedestrian died and 37.0% of those in which a driver/operator died Type of vehicle occupied. Of all the people who died in alcohol-related crashes, 42.0% were in an automobile; 26.6% were in a truck/van; 7.7% were motorcyclists; 6.3% were off-road vehicle occupants; and 0.7% were occupants of other highway vehicles. Within each of these vehicle types, the incidence of alcohol involvement in which an automobile occupant died was greater than the incidence of alcohol in crashes in which a truck/van occupant or motorcyclist died (41.7% versus 38.4% and 30.6%). Among off-road vehicle occupants, 60.0% were in an alcohol-related crash. 4.2 ALCOHOL IN FATALLY INJURED DRIVERS This section presents information on the presence of alcohol, exclusively among drivers fatally injured in British Columbia during Table 4-2 shows the information by age group, gender, vehicle type, and collision type (single vs. multiple). The first data column in the table shows the number of drivers killed. The next columns show the number and percent of these victims who were tested for alcohol. The remaining columns provide information on the results of the alcohol tests the first three of these present results for drivers who showed any evidence of alcohol; the last three columns present information on drivers who had BACs over the statutory limit of 80 mg%. To illustrate, among year olds there were 13 drivers killed during 2010; 11 of these fatally injured drivers (84.6%) were tested for alcohol. Of those who were tested, three (27.3%) were positive for alcohol. This means that year old fatally injured drinking drivers accounted for 4.8% of all drinking drivers who were killed. Then, in the final three columns, it can be seen that three of the 11 (27.3%) fatally injured year olds who were tested for alcohol had BACs in excess of 80 mg%. This means that all three 45
56 BRITISH COLUMBIA Table 4-2 Alcohol Use Among Fatally Injured Drivers: British Columbia, 2010 Category Number Drivers Tested Positive BAC BAC > 80 mg% of of % of % of % of all drivers % of % of all drivers Driver Drivers* Number total Number tested with +BAC Number tested with BAC >80 mg% Age < > Gender Male Female Vehicle Type Automobile Truck/Van Motorcycle Tractor Trailer Other Hwy Veh Collision Type Single-Vehicle Multiple-Vehicle TOTAL * Excludes operators of bicycles, snowmobiles, farm tractors and other non-highway vehicles. of the drivers who were positive for alcohol had BACs in excess of the legal limit. The final column expresses the number of drivers with illegal BACs as a percent of all drivers with BACs over the limit. Thus, year old drivers accounted for 5.8% of all the drivers with BACs over the legal limit. The main findings are shown by the totals at the bottom of the table. British Columbia had a high testing rate in 2010, with 84.1% of fatally injured drivers being tested for alcohol use. 46 In British Columbia, 35.0% had been drinking and 52 of 63 (82.5%) fatally injured drinking drivers had BACs >80 mg%. Although not shown in the table, more refined analyses by different BAC categories show that among tested drivers:
57 BRITISH COLUMBIA > 65.0% had BACs of zero mg%; > 2.2% had BACs from 1-49 mg%; > 3.9% had BACs from mg% > 7.8% had BACs from 81 to 160 mg%; and, > 21.1% had BACs over 160 mg%. In Figure 4-1, the BAC distribution for tested fatally injured drivers is extrapolated to reflect the BAC distribution for all fatally injured drivers. In this figure, 75 of 214 (35.0%) fatally injured drivers have a positive BAC. And among fatally injured drinking drivers, 62 (82.7%) have BACs over 80 mg%. According to the British Columbia member jurisdiction of CCMTA, where information is presented on blood alcohol concentration (BAC) levels of deceased drivers (e.g., Figure 3-2 on page 18, Figure 4-1 on page 47 reflecting British Columbia data), the following must be taken into account: BAC values presented in these figures only represent BAC values for deceased drivers exclusively and therefore represent only a subset of the BAC levels of drivers involved in motor vehicle crashes that cause deaths and injuries. For example, where a driver is assigned alcohol as a contributing factor to a crash and that driver survives that crash but, another road user is killed (pedestrian, cyclist or another driver or occupants of any vehicle), that driver s BAC level is not reflected in the figures shown above or the similar figures assembled for other Canadian provinces and territories. Furthermore, where a driver is assigned alcohol as a contributing factor to a crash and that driver survives that crash but are themselves injured or 47
58 BRITISH COLUMBIA another road user is injured (pedestrian, cyclist or any driver or occupants of any vehicle involved in the crash), that driver s BAC level is again NOT reflected in the figures 3-2, 4-1, or the similar figures assembled for other Canadian provinces and territories. This is a major and prevailing limitation of these data and the BAC values represented herein. This means that the BAC levels reflected in these tables do not reflect the full range of BAC levels of drivers involved in serious crashes and should not be relied upon to draw conclusions about BAC levels and motor vehicle crash risk. In order to understand BAC levels and motor vehicle crash risk, a number of research studies exist to do that. Based on an extensive amount of research, there is overwhelming evidence that even BAC levels as low as.02 impair driving abilities and at.04 to.05 BAC there is a clear relationship between crash risk and alcohol (see Zador et al. 2000; Blomberg et al. 2009; Moskowitz et al. 2000) Age differences. Of all the fatally injured drinking drivers (i.e., those with a positive BAC), 28.6% were aged 26-35; 20.6% were aged and 46-55; 12.7% were aged and over 55; and 4.8% were aged Of all the fatally injured legally impaired drivers (i.e., those with BACs over 80 mg%), 28.8% were aged 26-35; 23.1% were aged 46-55; 21.2% were aged 36-45; 15.4% were aged 20-25; and 5.8% were aged and over age 55. Within each of the age groups, fatally injured drivers aged were the most likely to have been drinking 56.3% of drivers in this age group had been drinking. By contrast, the lone tested driver under 16 had not been drinking and only 15.4% of the tested drivers aged over 55 had been drinking Gender differences Males dominate the picture they account for 76.2% of all the fatally injured drivers who had been drinking, and 75.0% of all of the fatally injured drivers who were legally impaired. Males dominate the picture largely because they account for most of the drivers who are killed (162 of the 214 fatalities or 75.7% are males). Fatally injured male drivers were slightly more likely to have been drinking than female drivers (35.6% and 33.3%, respectively). And, 81.3% of the male and 86.7% of the female drivers who were drinking had BACs over the legal limit Vehicle differences. Of all the fatally injured drinking drivers (i.e., those with a positive BAC), 50.8% were automobile drivers; 34.9% were truck/van drivers; 12.7% were motorcyclists; and 1.6% were tractor-trailer drivers. Of all the fatally injured legally impaired drivers (i.e., those with BACs over 80 mg%), 50.0% were 48
59 BRITISH COLUMBIA automobile drivers, 36.5% were truck/van drivers; 11.5% were motorcyclists; and 1.9% were tractor-trailer drivers. Within each of the vehicle types, 39.3% of fatally injured drivers of truck/vans, 35.6% of automobile drivers, 30.8% of motorcyclists, and 12.5% of tractor-trailer drivers were found to have been drinking Collision differences. Just over half of the drivers killed (121 of the 214) were involved in single-vehicle collisions but these crashes accounted for four-fifths of the drivers who had been drinking or were legally impaired (81.0% and 86.5%, respectively). The reason for this apparent disparity is because alcohol is overrepresented in single-vehicle crashes. Over half of the drivers involved in single-vehicle crashes (52.6%) were positive for alcohol, compared to only 14.5% of those involved in multiple-vehicle collisions. 4.3 DRIVERS INVOLVED IN ALCOHOL-RELATED SERIOUS INJURY CRASHES This section presents information on drivers involved in alcohol-related crashes in which someone was seriously injured in 2010 in British Columbia. A surrogate or indirect measure is used to estimate alcohol involvement because drivers in serious injury crashes are seldom tested for alcohol. A driver is identified as having been involved in an alcohol-related serious injury crash if the crash in which someone was seriously injured involved a single vehicle at night (SVN), or if, in the case of a non-svn serious injury crash, the police reported alcohol involvement i.e., at least one drinking driver in the crash (see Section 2.2.4). The results are shown in Table 4-3 for drivers grouped in terms of age, gender, type of vehicle driven, and type of collision. The first data column shows the number of drivers involved in serious injury crashes. The number and percent of drivers in such crashes that involved alcohol is shown in the next two columns. The final column expresses the number of drivers involved in alcohol-related serious injury crashes in any row as a percent of all drivers involved in alcohol- related serious injury crashes. As shown, by the totals at the bottom of the table, 2,208 drivers were involved in crashes in which someone was seriously injured, and among these 23.4% were alcohol-related crashes Driver age. Of all the drivers involved in alcohol-related serious injury crashes, 21.1% were aged 26-35, 18.6% were aged 20-25; and 17.6% were aged Drivers under 16 and over 55 respectively accounted for only 0.2% and 12.8% of those involved in alcoholrelated serious injury crashes. 49
60 BRITISH COLUMBIA Within each of the age groups, over one-third of the drivers aged and were involved in alcohol-related serious injury crashes (36.4% and 33.4%). The lowest incidence of involvement in alcohol-related crashes was found for those under 16 years of age (7.7%) and over 55 (12.6%). Table 4-3 Drivers* in Alcohol-Related Serious Injury Crashes: British Columbia, 2010 Category Number Alcohol-Related of of % of % of all drivers in Drivers Drivers Number total alcohol-related crashes Age < > unknown Gender Male Female unknown Vehicle Type Auto Truck/Van Motorcycle Tractor Trailer Other Hwy. Vehicle Off-Road Unknown Collision Type Single-Vehicle Multiple-Vehicle TOTAL * These numbers are slightly underestimated since 19.0% of all injuries are recorded as unspecified Driver gender. Of all the drivers involved in alcohol-related serious injury crashes, 73.4% were males. The incidence of involvement in alcohol-related serious injury crashes was also greater for males than for females (24.5% and 19.9%, respectively) Type of vehicle driven. Of all the drivers involved in alcohol-related serious injury crashes, 50.2% were automobile drivers; 34.5% were truck/van drivers; 7.0% were motorcyclists;
61 BRITISH COLUMBIA 3.5% were tractor-trailer drivers; 3.3% were off-road vehicle drivers; and 0.6% were other highway vehicle drivers. The highest incidence of involvement in alcohol-related serious injury crashes was found for truck/van drivers 25.4% of these drivers were in crashes that involved alcohol, compared to 25.3% for automobile drivers, 23.1% for tractor-trailer drivers; 14.5% for motorcyclists; and 14.3% for drivers of other highway vehicles. Among off-road vehicle drivers, 13.9% were involved in alcohol-related crashes Type of collision. Of all the drivers involved in alcohol-related serious injury crashes, 66.7% of them were in single-vehicle crashes. The highest incidence of involvement in alcohol-related serious injury crashes was also found among drivers in single-vehicle crashes 39.7% of these drivers, compared to only 12.8% for drivers involved in multiple-vehicle crashes. 4.4 TRENDS IN THE ALCOHOL-CRASH PROBLEM The previous sections examined three indicators of the alcohol-crash problem: the number and percent of people who died in crashes that involved alcohol; the number and percent of fatally injured drivers who had been drinking; and the number and percent of drivers in serious injury crashes that involved alcohol. This section examines changes in these three indicators of the problem. British Columbia s progress in meeting the STRID 2010 objective of a 40% reduction in the alcohol-crash problem by 2010 is also reported by comparing findings in 2010 with those from the baseline period Deaths in alcohol-related crashes: Table 4-4 and Figure 4-2 show the number and percent of people who died in crashes involving a drinking driver from 1995 to These results differ slightly from those in Section 4.1 for two reasons. First, deaths that occur in crashes that involve a drinking pedestrian are not necessarily classified as alcoholrelated deaths. The focus here is more restrictive, on deaths that occur in crashes involving at least one drinking driver. Second, the trend analyses focus on fatal crashes on public roadways involving principal vehicle types (where at least one of the vehicles involved is an automobile, truck/van, motorcycle or other highway vehicle). The previous analyses included all types of motorized vehicles (e.g., snowmobiles) on both public roadways and in off-road locations. As shown in the figure, the number of deaths in crashes that involved a drinking driver generally dropped from 241 to 134 between 1995 and 2003, increased to 161 in 2005, decreased to 143 in 2006, rose to 150 in 2007, fell to a low of 121 in 2009, and remained at 121 in The percentage of alcohol-related fatalities in British Columbia generally decreased from 47.6% in 1995 to its lowest level in 2003 (29.5%), rose to 36.9% in 2005, decreased to 33.6% in 2006, rose in 2007 (35.6%), decreased in 2009 (31.3%), and rose again to 32.7% in

62 BRITISH COLUMBIA Table 4-4 Number* and Percent of Motor Vehicle Deaths** Involving a Drinking Driver: British Columbia, Year Number of Alcohol-Related Deaths Deaths Number % of total baseline * numbers are estimates based on the percent of deaths for which information was available to determine alcohol use. ** only on public roadways involving principal vehicle types. 52
63 BRITISH COLUMBIA As shown at the bottom of the table, during the baseline period there was an average of 163 fatalities involving a drinking driver and they accounted for 38.4% of all fatalities. This means that the percent of fatalities involving a drinking driver decreased by 14.8% from 38.4% in the baseline period ( ) to 32.7% in And, in terms of the number of persons killed in crashes involving a drinking driver, there has been a 25.8% decrease from an average of 163 in the baseline period ( ) to 121 in Fatally injured drivers: Data on alcohol use among fatally injured drivers over the 24-year period from are shown in Table 4-5. Trends are illustrated in Figure 4-3 which shows changes in the percent of fatally injured drivers who: (1) showed no evidence of alcohol (represented by the white area); (2) had BACs below the legal limit (shown by the light grey area); and (3) had BACs over the legal limit (the dark grey area). The data reported here are restricted to drivers who died in less than six hours after the crash. As can be seen, the percent of fatally injured drivers with BACs over the legal limit generally increased from 1989 (36.1%) to 1993 (50.4%), dropped to a low of 29.2% in 2004, rose to 36.6% in 2005, decreased in 2006 (32.6%), rose in 2007 (38.8%), and decreased in 2010 (28.9%). The percent of fatally injured drivers with zero BACs decreased from 1989 (55.0%) to its lowest point in 1992 (44.8%), generally increased until 2004 (62.2%), declined in 2005 (57.7%), increased in 2006 (60.0%), declined in 2007 (52.7%), and peaked in 2009 (65.1%), and decreased slightly in 2010 (64.8%). The percent of fatally injured drivers with BACs between 1 and 80 mg% was at its highest level in 1987 (10.2%), dropped to its lowest mark in 1991 (4.0%), remained stable from 1992 to 2005 (5.6%), rose in 2007 (8.5%), decreased in 2009 (4.2%), and rose again in 2010 (6.3%). When compared to the baseline period shown at the bottom of Table 4-5, the percentage of fatally injured drivers with zero BACs in 2010 increased by 15.7% (from 56.0% to 64.8%). Among drivers with BACs from 1-80 mg%, there was a 3.1% decrease (from 6.5% to 6.3%). And among drivers with BACs over 80 mg%, there was a 22.9% decrease (from 37.5% to 28.9%). 53
 >80 (% Tested) 1987 267 265 99.3 124 46.8 27 10.2 114 43.0 1988 284 270 95.1 138 51.1 22 8.1 110 40.7 1989 256 249 97.3 137 55.0 22 8.8 90 36.1 1990 288 282 97.9 146 51.8 27 9.6 109 38.")
64 BRITISH COLUMBIA Table 4-5 Alcohol Use Among Fatally Injured Drivers: British Columbia, Number of Drivers Drivers Grouped by BAC (mg%) YEAR Drivers* Tested (% Total) Zero (% Tested) 1-80 (% Tested) >80 (% Tested) baseline * dying in less than six hours. 54
65 BRITISH COLUMBIA Table 4-6 and Figure 4-4 show data on alcohol use among fatally injured drivers over a shorter period from These results also differ from those reported above for several reasons. First, the number of drivers is extrapolated to reflect the BAC distribution of drivers tested for alcohol (see Figure 4-1). Second, estimates are based on all fatally injured drivers, not just those who died in less than six hours from the crash. Third, drivers are grouped in only two BAC categories: zero and positive. As can be seen in Table 4-6, the baseline percentage of fatally injured drivers testing positive for alcohol from is 43.5%. In 2010, 35.0% of fatally injured drivers tested positive for alcohol, a 19.5% decrease from the baseline period Drivers in serious injury crashes: Tables and figures in this section show information on drivers involved in alcohol-related injury crashes and not those in alcohol-related serious injury crashes. Data on injury severity in crashes has only recently been reported in British Columbia so it is not possible to examine trends with this indicator. Table 4-7 and Figure 4-5 show information on drivers involved in alcohol-related injury crashes. As shown in Table 4-7, during the baseline period ( ), an average of 13.4% of drivers in injury crashes were in an alcohol-involved crash. This compares to 11.1% in 2010, a 17.2% decrease in the problem. Table 4-8 and Figure 4-6 also show information on drivers involved in alcohol-related injury crashes. These results differ from those in Section 4.3 which reports drivers involved in alcoholrelated serious injury crashes. These results also differ slightly from those found in Table 4-7 and Figure 4-5 above because they exclude certain vehicle types e.g., bicycles, snowmobiles, farm tractors and other non-highway vehicles. As can be seen, the incidence of alcohol-involvement in injury crashes has increased slightly over this 16-year period. Between 1995 and 2005 the percentage of drivers in injury crashes that involved alcohol generally increased from 12.7% to 14.8%, decreased to 14.3% in 2006, remained unchanged in 2007, rose slightly to 14.6% in 2008, and decreased again to 11.2% in As shown in Table 4-8, in the baseline period ( ), an average of 13.7% of drivers in injury crashes were in an alcohol-involved crash. In 2010, the incidence of drivers in alcoholinvolved injury crashes declined to 11.2%, an 18.2% decrease. 55
66 BRITISH COLUMBIA Table 4-6 Alcohol Use Among Fatally Injured Drivers*: British Columbia, Number of Drivers Grouped by BAC (mg%) YEAR Drivers* Zero (% Tested) Positive (% Tested) (50.8) 174 (49.2) (55.6) 134 (44.4) (45.1) 146 (54.9) (47.1) 144 (52.9) (54.9) 133 (45.1) (48.8) 147 (51.2) (50.4) 123 (49.6) (51.8) 123 (48.2) (56.7) 106 (43.3) (62.7) 90 (37.3) (61.1) 100 (38.9) (55.6) 107 (44.4) (57.6) 126 (42.4) (62.0) 92 (38.0) (62.2) 107 (37.8) (58.3) 120 (41.7) (60.1) 99 (39.9) (54.1) 119 (45.9) (57.7) 99 (42.3) (64.7) 85 (35.3) (65.0) 75 (35.0) (56.5) 108 (43.5) baseline * numbers are estimates based on the BAC distribution of drivers tested for alcohol 56

67 BRITISH COLUMBIA 57

68 58 BRITISH COLUMBIA
69 ALBERTA 5.0 ALBERTA This section of the report reviews the major findings on alcohol involvement in fatal and serious injury motor vehicle collisions in Alberta during It describes data on: > people who were killed in alcohol-related crashes (Section 5.1); > alcohol use among fatally injured drivers (Section 5.2); > drivers involved in alcohol-related serious injury crashes (Section 5.3); and > trends in the alcohol-crash problem (Section 5.4). 5.1 DEATHS IN ALCOHOL-RELATED CRASHES Table 5-1 presents information on people who died in alcohol-related crashes in Alberta during Motor vehicle deaths are categorized in terms of the victim s age, gender, type (i.e., driver, passenger, pedestrian) and the type of vehicle they occupied. The first data column in the table presents the number of deaths. The next two columns show the number and percent of these fatalities in which sufficient information was available to determine if alcohol was involved. A motor vehicle fatality was considered to be alcohol involved if there was at least one drinking driver or drinking pedestrian in the fatal crash. For example, 28 people age were killed in motor vehicle crashes in Alberta during And, in all 28 cases (100.0%) it was possible to determine if alcohol was a factor in the crash. The next column shows the number of people killed in crashes that were known to be alcoholinvolved. For example, 17 people aged died in alcohol-related crashes in Alberta during The next column expresses this as a percentage i.e., 60.7% of the year olds who were killed died in an alcohol-related crash. The final column (percent of all alcohol-related deaths) expresses the number of deaths in alcohol-related crashes as a percent of all the deaths in such crashes. For example, the alcohol-related deaths among year olds represent 10.2% of all the people killed in alcohol-related crashes in Alberta during The totals at the bottom of the table provide a summary. As can be seen, 382 persons died in motor vehicle crashes in Alberta during In 366 (95.8%) of these cases, it was possible to determine if alcohol was a factor. Of these known cases, 167 (45.6%) involved alcohol. Extrapolating this figure to the total number of motor vehicle fatalities (382 x.456) it can be estimated that in Alberta during 2010, 174 persons died in alcohol-related crashes. 59
70 ALBERTA Victim age. Of all the people who died in alcohol-related crashes, 29.3% (see last column) were aged 26-35; 18.6% were aged 36-45; 16.2% were aged 20-25; 13.2% were aged 46-55; 10.2% were aged 16-19; 9.6% were over age 55; and 3.0% were under 16. Within each of the age groups, the highest incidence of alcohol involvement occurred in the crashes in which a person aged and died (66.2% and 60.7%, respectively). The lowest incidence of alcohol involvement was found among the youngest and oldest fatalities 23.2% of persons over 55 and 27.8% of the fatalities under age 16 died in crashes involving alcohol. 60
71 ALBERTA Gender. Of all the people who died in alcohol-related crashes, 79.0% were males. The incidence of alcohol in crashes in which a male died (48.5%) was greater than the incidence of alcohol in crashes in which a female died (37.2%) Victim type. Of all the people who died in alcohol-related crashes, 63.5% were drivers/operators of a vehicle; 19.2% were passengers; 16.2% were pedestrians; and for 1.2% of the cases, the victim position was unknown. Within each of the principal victim types, the highest incidence of alcohol involvement (62.8%) occurred in the crashes in which a pedestrian died. Alcohol was involved in 44.2% of the crashes in which a driver/operator died and 40.5% of those in which a passenger died Type of vehicle occupied. Of all the people who died in alcohol-related crashes, 37.1% were in a truck/van; 31.1% were in an automobile; 7.8% were off-road vehicle occupants; 7.2% were motorcyclists; and 0.6% were occupants of other highway vehicles. Within each of these vehicle types, the incidence of alcohol involvement in which an automobile occupant died was greater than the incidence of alcohol in crashes in which a truck/van occupant or motorcyclist died (45.6% versus 43.1% and 37.5%). Among fatally injured off-road vehicle occupants, 50.0% were involved in an alcohol-related crash. 5.2 ALCOHOL IN FATALLY INJURED DRIVERS This section presents information on the presence of alcohol, exclusively among drivers fatally injured in Alberta during Table 5-2 shows the information by age group, gender, vehicle type, and collision type (single vs. multiple). The first data column in the table shows the number of drivers killed. The next columns show the number and percent of these victims who were tested for alcohol. The remaining columns provide information on the results of the alcohol tests the first three of these present results for drivers who showed any evidence of alcohol; the last three columns present information on drivers who had BACs over the statutory limit of 80 mg%. 61
72 ALBERTA To illustrate, among year olds there were 18 drivers killed during 2010; all 18 of these fatally injured drivers (100.0%) were tested for alcohol. Of those who were tested, nine (50.0%) were positive for alcohol. This means that year old fatally injured drinking drivers accounted for 10.5% of all drinking drivers who were killed. Then, in the final three columns, it can be seen that seven of the 18 (38.9%) fatally injured year olds who were tested for alcohol had BACs in excess of 80 mg%. This means that seven of the nine drivers who were positive for alcohol had BACs in excess of the legal limit. The final column expresses the number of drivers with illegal BACs as a percent of all drivers with BACs over the limit. As can be seen, year old drivers accounted for 10.3% of all the drivers with BACs over the legal limit. The main findings are shown by the totals at the bottom of the table. Alberta had a very high testing rate in 2010, with 97.3% of fatally injured drivers being tested for alcohol use. 62
73 ALBERTA In Alberta, 39.6% had been drinking and 68 of 86 (79.1%) fatally injured drinking drivers had BACs >80 mg%. Although not shown in the table, more refined analyses by different BAC categories show that among tested drivers: > 60.4% had BACs of zero mg%; > 5.5% had BACs from 1-49 mg%; > 2.8% had BACs from mg% > 10.6% had BACs from 81 to 160 mg%; and, > 20.7% had BACs over 160 mg%. In Figure 5-1, the BAC distribution for tested fatally injured drivers is extrapolated to reflect the BAC distribution for all fatally injured drivers. In this figure, 88 of 223 (39.5%) fatally injured drivers have a positive BAC. And among fatally injured drinking drivers, 70 (79.5%) have BACs over 80 mg% Age differences. Of all the fatally injured drinking drivers (i.e., those with a positive BAC), 32.6% were aged 26-35; 17.4% were aged 36-45; 15.1% were aged and 46-55; 10.5% were aged 16-19; and 9.3% were over age 55. Of all the fatally injured legally impaired drivers (i.e., those with BACs over 80 mg%), 29.4% were aged 26-35; 19.1% were aged 36-45; 17.6% were aged 46-55; 14.7% were aged 20-25; and 10.3% were over aged Of the fatally injured drivers who were over the legal limit, 8.8% were over age 55. Within each of the age groups, fatally injured drivers aged were the most likely to have been drinking 56.0% of drivers in this age group had been drinking. By contrast, only 17.0% of the tested drivers over age 55 had been drinking. 63
74 ALBERTA Gender differences. Males dominate the picture they account for 88.4% of all the fatally injured drivers who had been drinking, and 89.7% of all of the fatally injured drivers who were legally impaired. Males dominate the picture largely because they account for most of the drivers who are killed (185 of the 223 or 83.0% of the fatalities are males). Fatally injured male drivers were more likely to have been drinking than female drivers (42.5% and 26.3%, respectively). And, 80.3% of the male and 70.0% of the female drivers who were drinking had BACs over the legal limit Vehicle differences. Of all the fatally injured drinking drivers (i.e., those with a positive BAC), 46.5% were truck/van drivers; 39.5% were automobile drivers; and 14.0% were motorcyclists. Of all the fatally injured legally impaired drivers (i.e., those with BACs over 80 mg%), 51.5% were truck/van drivers, 36.8% were automobile drivers; and 11.8% were motorcyclists. Within each of the vehicle types, 41.5% of fatally injured automobile drivers, 41.4% of motorcyclists, and 40.4% of truck/van drivers had been drinking. None of the fatally injured tractor-trailer drivers had been drinking Collision differences. Two-fifths of the drivers killed (91 of the 223) were involved in single-vehicle collisions but these crashes accounted for three-fifths of the drivers who had been drinking or were legally impaired (58.1% and 64.7%, respectively). The reason for this apparent disparity is because alcohol is overrepresented in single-vehicle crashes. Over half of the drivers involved in single-vehicle crashes (55.6%) were positive for alcohol, compared to only 28.3% of those involved in multiple-vehicle collisions. 5.3 DRIVERS INVOLVED IN ALCOHOL-RELATED SERIOUS INJURY CRASHES This section presents information on drivers involved in alcohol-related crashes in which someone was seriously injured in 2010 in Alberta. A surrogate or indirect measure is used to estimate alcohol involvement because drivers in serious injury crashes are seldom tested for alcohol. A driver is identified as having been involved in an alcohol-related serious injury crash if the crash in which someone was seriously injured involved a single vehicle at night (SVN), or if, in the case of a non-svn serious injury crash, the police reported alcohol involvement i.e., at least one drinking driver in the crash (see Section 2.2.4). The results are shown in Table 5-3 for drivers grouped in terms of age, gender, type of vehicle 64
75 ALBERTA driven, and type of collision. The first data column shows the number of drivers involved in serious injury crashes. The number and percent of drivers in such crashes that involved alcohol is shown in the next two columns. The final column expresses the number of drivers involved in alcohol-related serious injury crashes in any row as a percent of all drivers involved in alcohol-related serious injury crashes. As shown, by the totals at the bottom of the table, 3,778 drivers were involved in crashes in which someone was seriously injured, and among these 18.5% were alcohol-related crashes. 65
76 ALBERTA Driver age. Of all the drivers involved in alcohol-related serious injury crashes, 26.5% were aged 26-35, 20.8% were aged 20-25; and 17.6% were aged Drivers under 16 and over 55 accounted for only 0.7% and 8.7%, respectively, of those involved in alcoholrelated serious injury crashes. Within each of the age groups, almost one-quarter of the drivers aged were involved in alcohol-related serious injury crashes (24.6%). The lowest incidence of involvement in alcoholrelated crashes was found for those over 55 (9.3%) Driver gender. Of all the drivers involved in alcohol-related serious injury crashes, 76.9% were males. The incidence of involvement in alcohol-related serious injury crashes was also greater for males than for females (20.9% and 12.8%, respectively) Type of vehicle driven. Of all the drivers involved in alcohol-related serious injury crashes, 42.4% were truck/van drivers; 40.0% were automobile drivers; 7.3% were off-road vehicle drivers; 6.9% were motorcyclists; and 0.6% were drivers of other highway vehicles. The highest incidence of involvement in alcohol-related serious injury crashes was found for offroad vehicle drivers 27.0% of these drivers were in crashes that involved alcohol, compared to 19.4% for motorcyclists; 19.3% for automobile drivers; 17.2% for truck/van drivers; and 13.1% for tractor-trailer drivers. Among drivers of other highway vehicles, 9.3% were involved in alcoholrelated crashes Type of collision. Of all the drivers involved in alcohol-related serious injury crashes, 67.3% of them were in single-vehicle crashes. The highest incidence of involvement in alcohol-related serious injury crashes was also found among drivers in single-vehicle crashes 41.2% of these drivers, compared to only 8.6% for drivers involved in multiple-vehicle crashes. 5.4 TRENDS IN THE ALCOHOL-CRASH PROBLEM The previous sections examined three indicators of the alcohol-crash problem: the number and percent of people who died in crashes that involved alcohol; the number and percent of fatally injured drivers who had been drinking; and the number and percent of drivers in serious injury crashes that involved alcohol. This section examines changes in these three indicators of the problem. Alberta s progress in meeting the STRID 2010 objective of a 40% reduction in the alcohol-crash problem is also reported by comparing findings in 2010 with those from the baseline period Deaths in alcohol-related crashes: Table 5-4 and Figure 5-2 show the number and percent of people who died in crashes involving a drinking driver from 1995 to 66
77 ALBERTA These results differ slightly from those in Section 5.1 for two reasons. First, deaths that occur in crashes that involve a drinking pedestrian are not necessarily classified as alcoholrelated deaths. The focus here is more restrictive, on deaths that occur in crashes involving at least one drinking driver. Second, the trend analyses focus on fatal crashes on public roadways involving principal vehicle types (where at least one of the vehicles involved is an automobile, truck/van, motorcycle or other highway vehicle). The previous analyses included all types of motorized vehicles (e.g., snowmobiles) on both public roadways and in off-road locations. Table 5-4 Number* and Percent of Motor Vehicle Deaths** Involving a Drinking Driver: Alberta, Year Number of Alcohol-Related Deaths Deaths Number % of total baseline * numbers are estimates based on the percent of deaths for which information was available to determine alcohol use. ** only on public roadways involving principal vehicle types. 67

78 ALBERTA As shown in the figure, the number of deaths in crashes that involved a drinking driver generally decreased from a high of 182 in 1995 to a low of 125 in The number fluctuated between 1999 and 2004, increased to 170 in 2007, and dropped to 139 in The percentage of alcohol-related fatalities generally decreased from a high of 45.1% in 1996 to a low of 34.0% in 2004, rose to 38.3% in 2006, decreased slightly to 38.0% in 2007, remained at this level in 2008, rose to 43.0% in 2009; and decreased again to 40.9% in As shown at the bottom of the table, during the baseline period, there was an average of 152 fatalities involving a drinking driver and they accounted for 39.7% of all fatalities. Thus, it can be seen that the percent of fatalities involving a drinking driver increased by 3.0% from 39.7% in the baseline period ( ) to 40.9% in However, in terms of the number of persons killed in crashes involving a drinking driver, there has been an 8.0% decrease from an average of 152 in the baseline period ( ) to 139 in Fatally injured drivers: Data on alcohol use among fatally injured drivers over the 24-year period from are shown in Table 5-5. Trends are illustrated in Figure 5-3 which shows changes in the percent of fatally injured drivers who: (1) showed no evidence of alcohol (represented by the white area); (2) had BACs below the legal limit (shown by the light grey area); and (3) had BACs over the legal limit (the dark grey area). The data reported here are restricted to drivers who died in less than six hours after the crash. 68 As can be seen, the percent of fatally injured drivers with BACs over the legal limit generally declined from 1987 (41.1%) to 2004 (28.5%), rose to 36.4% in 2007, dropped to 35.3% in 2008, rose slightly to 35.6% in 2009, and decreased again to 33.9% in The percent of fatally injured drivers with zero BACs generally increased from 1987 (51.0%) to a peak of
79 ALBERTA 67.9% in 1997, stabilized between 1999 and 2002, rose in 2004 (66.8%), decreased in 2007 (58.9%), rose in 2008 (60.1%) and decreased again in 2010 (58.3%). The percent of fatally injured drivers with BACs between 1 and 80 mg% peaked in 1988 (9.3%), fell to its lowest mark in 2001 (3.1%), rose in 2003 (7.0%), decreased in 2005 (4.0%), rose in 2006 (4.8%), remained at that level in 2007 (4.8%), decreased slightly in 2008 (4.6%), and rose again in 2010 (7.8%). 69
. Among drivers with BACs over 80 mg%, there was a 6.3% increase (from 31.9% to 33.9%).")
80 ALBERTA When compared to the baseline period, the percentage of fatally injured drivers with zero BACs in 2010 decreased by 6.5% (from 62.3% to 58.3%). Among drivers with BACs from 1-80 mg%, there was a 34.5% increase (from 5.8% to 7.8%). Among drivers with BACs over 80 mg%, there was a 6.3% increase (from 31.9% to 33.9%). Table 5-6 and Figure 5-4 show data on alcohol use among fatally injured drivers over a shorter period from These results also differ from those reported above for several reasons. First, the number of drivers is extrapolated to reflect the BAC distribution of drivers tested for alcohol (see Figure 5-1). Second, estimates are based on all fatally injured drivers, not just those who died in less than six hours from the crash. Third, drivers are grouped in only two BAC categories: zero and positive. As can be seen in Table 5-6, the baseline percentage of fatally injured drivers testing positive for alcohol from is 36.1%. In 2010, 39.5% of fatally injured drivers tested positive for alcohol, a 9.4% increase from the baseline period Drivers in serious injury crashes: Table 5-7 and Figure 5-5 show information on drivers involved in alcohol-related serious injury crashes. As shown in Table 5-7, during the baseline period ( ), an average of 23.0% of drivers in serious injury crashes were in an alcohol-involved crash. This compares to 18.5% in 2010, a 19.6% decrease in the problem. 70
81 ALBERTA 71

82 72 ALBERTA
83 ALBERTA Table 5-8 and Figure 5-6 also show information on drivers involved in alcohol-related serious injury crashes. These results differ slightly from those in Section 5.3 and in Table 5-7 and Figure 5-5 above because they exclude certain vehicle types e.g., bicycles, snowmobiles, farm tractors, and other non-highway vehicles. As can be seen, the incidence of alcohol-involvement in serious injury crashes has been relatively stable. Between 1995 and 2003 the percentage of drivers in serious injury crashes that involved alcohol dropped from 24.4% to 20.3%, rose to 20.7% in 2004, declined slightly to 20.6% in 2005, rose to 21.8% in 2006, and decreased again to 18.0% in As shown Table 5-8, in the baseline period ( ) an average of 23.3% of drivers in serious injury crashes were in an alcohol-involved crash. In 2010, the incidence of drivers in alcoholinvolved crashes decreased to 18.0%, a 22.7% decrease. Table 5-8 Number and Percent of All Drivers* in Serious Injury Crashes ** that Involved Alcohol: Alberta, Year Number of Alcohol Related Drivers Number % (24.4) (20.6) (25.5) (24.6) (23.3) (22.7) (23.1) (20.8) (20.3) (20.7) (20.6) (21.8) (20.0) (19.5) (18.7) (18.0) (23.3) baseline * excludes operators of bicycles, snowmobiles, farm tractors, and other non-highway vehicles. ** single-vehicle nighttime crashes (SVN) as well as non-svn crashes that have police-reported alcohol involvement. 73

84 74 ALBERTA
85 SASKATCHEWAN 6.0 SASKATCHEWAN This section of the report reviews the major findings on alcohol involvement in fatal and serious injury motor vehicle collisions in Saskatchewan during It describes data on: > people who were killed in alcohol-related crashes (Section 6.1); > alcohol use among fatally injured drivers (Section 6.2); > drivers involved in alcohol-related serious injury crashes (Section 6.3); and > trends in the alcohol-crash problem (Section 6.4). 6.1 DEATHS IN ALCOHOL-RELATED CRASHES Table 6-1 presents information on people who died in alcohol-related crashes in Saskatchewan during Motor vehicle deaths are categorized in terms of the victim s age, gender, type (i.e., driver, passenger, pedestrian) and the type of vehicle they occupied. The first data column in the table presents the number of deaths. The next two columns show the number and percent of these fatalities in which sufficient information was available to determine if alcohol was involved. A motor vehicle fatality was considered to be alcohol involved if there was at least one drinking driver or drinking pedestrian in the fatal crash. For example, 25 people aged were killed in motor vehicle crashes in Saskatchewan during And, in 22 cases (88.0%) it was possible to determine if alcohol was a factor in the crash. The next column shows the number of people killed in crashes that were known to be alcoholinvolved. For example, 13 people aged died in alcohol-related crashes in Saskatchewan during The next column expresses this as a percentage i.e., 59.1% of the year olds who were killed died in an alcohol-related crash. The final column (percent of all alcohol-related deaths) expresses the number of deaths in alcohol-related crashes as a percent of all the deaths in such crashes. For example, the alcohol-related deaths among year olds represent 14.9% of all the people killed in alcohol-related crashes in Saskatchewan during The totals at the bottom of the table provide a summary. As can be seen, 186 persons died in motor vehicle crashes in Saskatchewan during In 175 (94.1%) of these cases, it was possible to determine if alcohol was a factor. Of these known cases, 87 (49.7%) involved alcohol. Extrapolating this figure to the total number of motor vehicle fatalities (186 x.497) it can be estimated that in Saskatchewan during 2010, 92 persons died in alcohol-related crashes. 75
86 SASKATCHEWAN Victim age. Of all the people who died in alcohol-related crashes, 33.3% (see last column) were aged 20-25; 16.1% were aged 26-35; 14.9% were aged 16-19; 12.6% were over age 55; 10.3% were aged 36-45; 9.2% were aged 46-55; and 3.4% were under 16. Within each of the age groups, the highest incidence of alcohol involvement occurred in the crashes in which a person aged and died (82.9% and 59.1%, respectively). The lowest incidence of alcohol involvement was found among the youngest and oldest fatalities 0.0% of persons under 16 and 25.0% of the fatalities over 55 years of age died in crashes involving alcohol. 76
87 SASKATCHEWAN Gender. Of all the people who died in alcohol-related crashes, 71.3% were males. The incidence of alcohol in crashes in which male died (52.5%) was greater than the incidence of alcohol in crashes in which a female died (43.9%) Victim type. Of all the people who died in alcohol-related crashes, 56.3% were drivers/operators of a vehicle; 29.9% were passengers; and 13.8% were pedestrians. Within each of the principal victim types, the highest incidence of alcohol involvement (70.6%) occurred in the crashes in which a pedestrian died. Alcohol was involved in 54.2% of the crashes in which a passenger died and 44.5% of those in which a driver/operator died Type of vehicle occupied. Of all the people who died in alcohol-related crashes, 44.8% were truck/van occupants; 33.3% were automobile occupants; 4.6% were off-road vehicle occupants; and 3.4% were motorcyclists. Within each of these vehicle types, the incidence of alcohol involvement in which a motorcyclist died was greater than the incidence of alcohol crashes in which a truck/van occupant, automobile occupant or off-road vehicle occupant died (60.0% versus 57.4%, 42.0% and 30.8%). 6.2 ALCOHOL IN FATALLY INJURED DRIVERS This section presents information on the presence of alcohol, exclusively among drivers fatally injured in Saskatchewan during Table 6-2 shows the information by age group, gender, vehicle type, and collision type (single vs. multiple). 77
88 SASKATCHEWAN The first data column in the table shows the number of drivers killed. The next columns show the number and percent of these victims who were tested for alcohol. The remaining columns provide information on the results of the alcohol tests the first three of these present results for drivers who showed any evidence of alcohol; the last three columns present information on drivers who had BACs over the statutory limit of 80 mg%. To illustrate, among year olds there were 15 drivers killed during 2010; 14 of these fatally injured drivers (93.3%) were tested for alcohol. Of those who were tested, 13 (92.9%) were positive for alcohol. This means that fatally injured drinking drivers aged accounted for 31.7% of all drinking drivers who were killed. 78 Then, in the final three columns, it can be seen that 11 of the 14 (78.6%) fatally injured drivers aged who were tested for alcohol had BACs in excess of 80 mg%. This means that 11 of
89 SASKATCHEWAN the 13 drivers who were positive for alcohol had BACs in excess of the legal limit. The final column expresses the number of drivers with illegal BACs as a percent of all drivers with BACs over the limit. Thus, drivers aged accounted for 31.4% of all the drivers with BACs over the legal limit. The main findings are shown by the totals at the bottom of the table. Saskatchewan had a very high testing rate in 2010, with 92.0% of fatally injured drivers being tested for alcohol use. In Saskatchewan, 44.6% had been drinking and 35 of 41 (85.4%) fatally injured drinking drivers had BACs >80 mg%. Although not shown in the table, more refined analyses by different BAC categories show that among tested drivers: > 55.4% had BACs of zero mg%; > 5.4% had BACs from 1-49 mg%; > 1.1% had BACs from mg% > 6.5% had BACs from 81 to 160 mg%; and, > 31.5% had BACs over 160 mg%. In Figure 6-1, the BAC distribution for tested fatally injured drivers is extrapolated to reflect the BAC distribution for all fatally injured drivers. In this figure 45 of 100 (45.0%) fatally injured drivers have a positive BAC. And among fatally injured drinking drivers, 39 (86.7%) have BACs over 80 mg% Age differences. Of all the fatally injured drinking drivers (i.e., those with a positive BAC), 31.7% were aged 20-25; 24.4% were aged 26-35, 14.6% were over age 55, 12.2% were aged under 20 (a grouping of under 16 year olds and year olds so that an individual driver will not be identified) and 46-55; and 4.9% were aged
90 SASKATCHEWAN Of all the fatally injured legally impaired drivers (i.e., those with BACs over 80 mg%), 31.4% were aged 20-25; 25.7% were aged 26-35; 17.1% were aged over 55; 11.4% were aged under 20; 8.6% were aged 46-55; and 5.7% were aged Within each of the age groups, fatally injured drivers aged were the most likely to have been drinking 92.9% of drivers in this age group had been drinking. By contrast, only 18.2% of the tested drivers aged had been drinking Gender differences. Males dominate the picture they account for 70.7% of all the fatally injured drivers who had been drinking, and 71.4% of all of the fatally injured drivers who were legally impaired. Males dominate the picture largely because they account for most of the drivers who are killed (67 of the 100 fatalities are males). Fatally injured male drivers were more likely to have been drinking than female drivers (46.0% and 41.4%, respectively). And, 86.2% of the male and 83.3% of the female drivers who were drinking had BACs over the legal limit Vehicle differences. Of all the fatally injured drinking drivers (i.e., those with a positive BAC), 53.7% were truck/van drivers; 39.0% were automobile drivers; and 7.3% were motorcyclists. Of all the fatally injured legally impaired drivers (i.e., those with BACs over 80 mg%), 54.3% were truck/van drivers, 40.0% were automobile drivers; and 5.7% were motorcyclists. Within each of the vehicle types, 60.0% of fatally injured motorcyclists, 51.2% of truck/van drivers, and 39.0% of automobile drivers were found to have been drinking. Neither of the tractor-trailer drivers had been drinking Collision differences. Slightly less than half of the drivers killed (46 of the 100) were involved in single-vehicle collisions but these crashes accounted for over two-thirds of the drivers who had been drinking or were legally impaired (70.7% and 71.4%, respectively). The reason for this apparent disparity is because alcohol is overrepresented in single-vehicle crashes. Over two-thirds of the drivers involved in single-vehicle crashes (67.4%) were positive for alcohol, compared to only 24.5% of those involved in multiple-vehicle collisions. 80
91 SASKATCHEWAN 6.3 DRIVERS INVOLVED IN ALCOHOL-RELATED SERIOUS INJURY CRASHES This section presents information on drivers involved in alcohol-related crashes in which someone was seriously injured in 2010 in Saskatchewan. A surrogate or indirect measure is used to estimate alcohol involvement because drivers in serious injury crashes are seldom tested for alcohol. A driver is identified as having been involved in an alcohol-related serious injury crash if the crash in which someone was seriously injured involved a single vehicle at night (SVN), or if, in the case of a non-svn serious injury crash, the police reported alcohol involvement i.e., at least one drinking driver in the crash (see Section 2.2.4). The results are shown in Table 6-3 for drivers grouped in terms of age, gender, type of vehicle driven, and type of collision. The first data column shows the number of drivers involved in serious injury crashes. The number and percent of drivers in such crashes that involved alcohol is shown in the next two columns. The final column expresses the number of drivers involved in alcohol-related serious injury crashes in any row as a percent of all drivers involved in alcohol-related serious injury crashes. As shown, by the totals at the bottom of the table, 528 drivers were involved in crashes in which someone was seriously injured, and among these 29.2% were alcohol-related crashes Driver age. Of all the drivers involved in alcohol-related serious injury crashes, 26.0% were aged 20-25, 23.4% were aged 26-35; and 13.6% were aged Drivers under 16 and over 55 accounted for only 0.0% and 9.7% respectively of those involved in alcoholrelated serious injury crashes. 81
92 SASKATCHEWAN Within each of the age groups, over two-fifths of the drivers aged and were involved in alcohol-related serious injury crashes (46.0% and 42.0%, respectively). The lowest incidence of involvement in alcohol-related crashes was found for those under 16 and over 55 (0.0% and 13.8%, respectively). 82
93 SASKATCHEWAN Driver gender. Of all the drivers involved in alcohol-related serious injury crashes, 67.5% were males. The incidence of involvement in alcohol-related serious injury crashes was also greater for males than for females (29.0% and 25.8%, respectively) Type of vehicle driven. Of all the drivers involved in alcohol-related serious injury crashes, 48.7% were automobile drivers; 37.7% were truck/van drivers; 6.5% were off-road vehicle drivers; 3.2% were motorcyclists; and 2.6% were tractor-trailer drivers. The highest incidence of involvement in alcohol-related serious injury crashes was found for automobile drivers 37.5% of these drivers were in crashes that involved alcohol, compared to 29.4% for off-road vehicle drivers; 26.1% for truck/van drivers; 14.3% for tractor-trailer drivers; and 13.5% for motorcyclists Type of collision. Of all the drivers involved in alcohol-related serious injury crashes, 55.2% of them were in single-vehicle crashes. The highest incidence of involvement in alcohol-related serious injury crashes was also found among drivers in single-vehicle crashes 43.1% of these drivers, compared to only 20.8% for drivers involved in multiple-vehicle crashes. 6.4 TRENDS IN THE ALCOHOL-CRASH PROBLEM The previous sections examined three indicators of the alcohol-crash problem: the number and percent of people who died in crashes that involved alcohol; the number and percent of fatally injured drivers who had been drinking; and the number and percent of drivers in serious injury crashes that involved alcohol. This section examines changes in these three indicators of the problem. Saskatchewan s progress in meeting the STRID 2010 objective of a 40% reduction in the alcohol-crash problem by 2010 is also reported by comparing findings in 2010 with those from the baseline period Deaths in alcohol-related crashes: Table 6-4 and Figure 6-2 show the number and percent of people who died in crashes involving a drinking driver from 1995 to These results differ slightly from those in Section 6.1 for two reasons. First, deaths that occur in crashes that involve a drinking pedestrian are not necessarily classified as alcoholrelated deaths. The focus here is more restrictive, on deaths that occur in crashes involving at least one drinking driver. Second, the trend analyses focus on fatal crashes on public roadways involving principal vehicle types (where at least one of the vehicles involved is an automobile, truck/van, motorcycle or other highway vehicle). The previous analyses included all types of motorized vehicles (e.g., snowmobiles) on both public roadways and in off-road locations. 83
94 84 SASKATCHEWAN
95 SASKATCHEWAN As shown in the table and figure, the number of deaths in crashes that involved a drinking driver generally rose from 64 in 1995 to 79 in The number of alcohol-related fatalities rose from a low of 44 in 2004, increased to 74 in 2008, decreased to 63 in 2009, and rose again to 68 in The percentage of alcohol-related fatalities generally decreased from 43.8% in 1995 to a low of 31.3% in 2005, rose to a high of 51.0% in 2008, decreased to 40.6% in 2009, and rose again to 43.9% in As shown at the bottom of the table, during the baseline period there was an average of 61 fatalities involving a drinking driver and they accounted for 40.7% of all fatalities. This means that the percent of fatalities involving a drinking driver increased by 7.9% from 40.7% in the baseline period ( ) to 43.9% in And, in terms of the number of persons killed in crashes involving a drinking driver, there has been an 11.5% increase from an average of 61 in the baseline period ( ) to 68 in Fatally injured drivers: Data on alcohol use among fatally injured drivers over the 24-year period from are shown in Table 6-5. Trends are illustrated in Figure 6-3 which shows changes in the percent of fatally injured drivers who: (1) showed no evidence of alcohol (represented by the white area); (2) had BACs below the legal limit (shown by the light grey area); and (3) had BACs over the legal limit (the dark grey area). The data reported here are restricted to drivers who died in less than six hours after the crash. As can be seen, the percent of fatally injured drivers with BACs over the legal limit generally declined from 1987 (52.9%) to its lowest mark in 2006 (30.6%), rose in 2008 (49.4%), and decreased again in 2010 (36.9%). The percent of fatally injured drivers with zero BACs increased from 1987 (40.0%) to its highest mark in 2000 (65.7%), fluctuated until 2004 (56.7%), rose in 2005 (61.3%), remained stable until 2007 (61.4%), declined in 2008 (45.8%), and rose again in 2010 (58.3%). The percent of fatally injured drivers with BACs between 1 and 80 mg% peaked in 1991 (14.1%), dropped to its lowest mark in 1998 (1.4%), fluctuated until 2003 (3.7%), generally rose until 2006 (8.3%), decreased in 2008 (4.8%), rose in 2009 (5.4%), and decreased again in 2010 (4.8%). 85
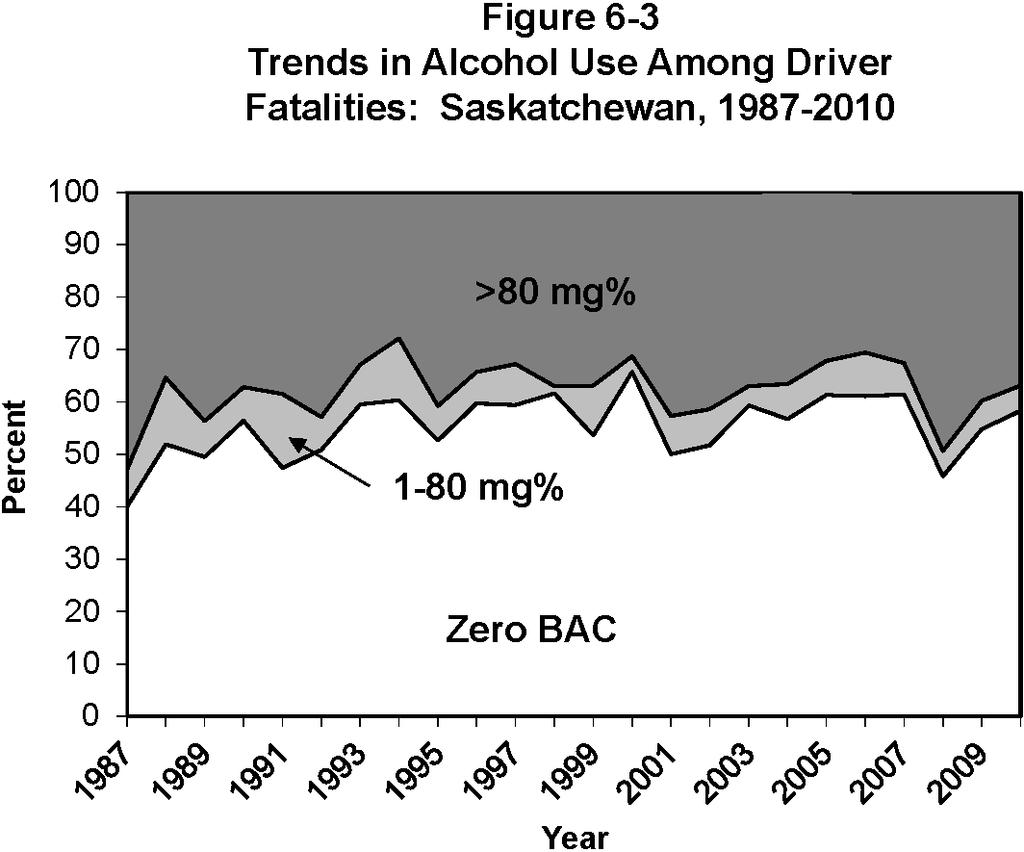
96 86 SASKATCHEWAN
97 SASKATCHEWAN When compared to the baseline period shown at the bottom of Table 6-5, the percentage of fatally injured drivers with zero BACs in 2009 decreased by 4.7% (from 57.5% to 54.8%). Among drivers with BACs from 1-80 mg%, there was a 20.6% decrease (from 6.8% to 5.4%). And among those with BACs over 80 mg%, there was an 11.8% increase (from 35.6% to 39.8%). Table 6-6 and Figure 6-4 show data on alcohol use among fatally injured drivers over a shorter period from These results also differ from those reported above for several reasons. First, the number of drivers is extrapolated to reflect the BAC distribution of drivers tested for alcohol (see Figure 6-1). Second, estimates are based on all fatally injured drivers, not just those who died in less than six hours from the crash. Third, drivers are grouped in only two BAC categories: zero and positive. As can be seen at the bottom of Table 6-6, the percentage of fatally injured drivers testing positive for alcohol from , the baseline period, is 41.9%. In 2010, 45.0% of fatally injured drivers tested positive for alcohol, a 7.4% increase from the baseline period Drivers in serious injury crashes: Table 6-7 and Figure 6-5 show information on drivers involved in alcohol-related serious injury crashes. During the baseline period ( ), an average of 25.5% of drivers in serious injury crashes were in an alcohol-involved crash. This compares to 29.2% in 2010, a 14.5% increase in the problem. Table 6-8 and Figure 6-6 also show information on drivers involved in alcohol-related serious injury crashes. These results differ slightly from those in Section 6.3 and in Table 6-7 and Figure 6-5 above because they exclude certain vehicle types e.g., bicycles, snowmobiles, farm tractors and other non-highway vehicles. As can be seen, the incidence of alcohol-involvement in serious injury crashes has increased gradually until 2002, declined until 2004, and generally increased in the past six years. Between 1995 and 2002 the percentage of all drivers in serious injury crashes that involved alcohol generally rose from 25.0% to 29.5%, dropped to 25.4% in 2004, rose to 27.5% in 2005, declined slightly to 26.8% in 2006, peaked at 33.2% in 2008, decreased to 27.7% in 2009, and rose again to 28.9% in
98 88 SASKATCHEWAN

99 SASKATCHEWAN In the baseline period ( ), an average of 25.8% of drivers in serious injury crashes were in an alcohol-involved crash. In 2010, the incidence of drivers in alcohol-involved crashes rose to 28.9%, a 12.0% increase. 89
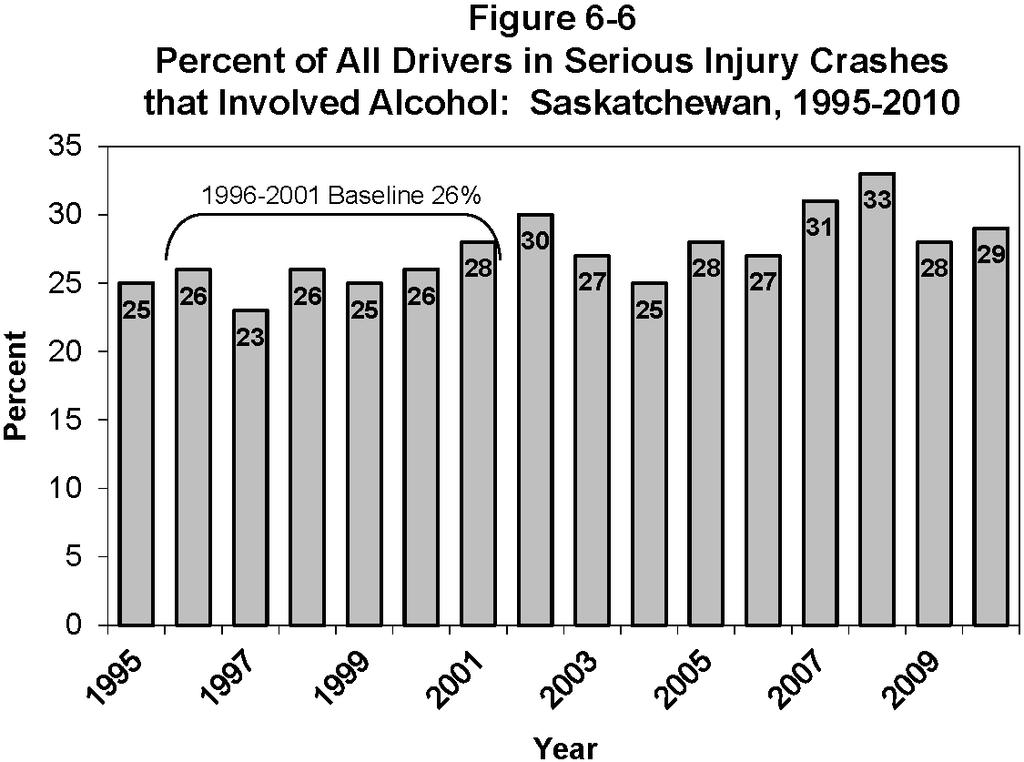
100 90 SASKATCHEWAN
101 MANITOBA 7.0 MANITOBA This section of the report reviews the major findings on alcohol involvement in fatal and serious injury motor vehicle collisions in Manitoba during It describes data on: > people who were killed in alcohol-related crashes (Section 7.1); > alcohol use among fatally injured drivers (Section 7.2); > drivers involved in alcohol-related serious injury crashes (Section 7.3); and > trends in the alcohol-crash problem (Section 7.4). 7.1 DEATHS IN ALCOHOL-RELATED CRASHES Table 7-1 presents information on people who died in alcohol-related crashes in Manitoba during Motor vehicle deaths are categorized in terms of the victim s age, gender, type (i.e., driver, passenger, pedestrian) and the type of vehicle they occupied. The first data column in the table presents the number of deaths. The next two columns show the number and percent of these fatalities in which sufficient information was available to determine if alcohol was involved. A motor vehicle fatality was considered to be alcohol involved if there was at least one drinking driver or drinking pedestrian in the fatal crash. For example, 11 people age were killed in motor vehicle crashes in Manitoba during And, in all 11 cases (100.0%) it was possible to determine if alcohol was a factor in the crash. The next column shows the number of people killed in crashes that were known to be alcoholinvolved. For example, nine people aged died in alcohol-related crashes in Manitoba during The next column expresses this as a percentage i.e., 81.8% of the year olds who were killed died in an alcohol-related crash. The final column (percent of all alcohol-related deaths) expresses the number of deaths in alcohol-related crashes as a percent of all the deaths in such crashes. For example, the alcohol-related deaths among year olds represent 19.6% of all the people killed in alcohol-related crashes in Manitoba during The totals at the bottom of the table provide a summary. As can be seen, 98 persons died in motor vehicle crashes in Manitoba during In 93 (94.9%) of these cases, it was possible to determine if alcohol was a factor. Of these known cases, 46 (49.5%) involved alcohol. 91
102 MANITOBA Extrapolating this figure to the total number of motor vehicle fatalities (98 x.478) it can be estimated that in Manitoba during 2010, 48 persons died in alcohol-related crashes Victim age. Of all the people who died in alcohol-related crashes, 23.9% (see last column) were aged 20-25; 19.6% were aged and 36-45; 13.0% were aged and 46-55; 6.5% were over age 55; and 4.3% were under 16. Table 7-1 Deaths* in Alcohol-Related Crashes: Manitoba, 2010 Category Number Alcohol Use Known Alcohol-Related Deaths of Victim of Deaths % of % of % of all alcohol- Number total Number known related deaths Age < > Gender Male Female Type Driver/Operator Passenger Pedestrian Vehicle Occupied Automobiles Trucks/Vans Motorcycles Offroad Vehicles (Pedestrians) TOTAL *persons dying within 12 months in collisions on and off public roadways 92 Within each of the age groups, the highest incidence of alcohol involvement occurred in the crashes in which a person aged and died (81.8% and 78.6%, respectively). The lowest incidence of alcohol involvement was found among the oldest fatalities only 15.8% of the fatalities over 55 years of age died in crashes involving alcohol.
103 MANITOBA Gender. Of all the people who died in alcohol-related crashes, 76.1% were males. The incidence of alcohol in crashes in which male died (58.3%) was greater than the incidence of alcohol in crashes in which a female died (33.3%) Victim type. Of all the people who died in alcohol-related crashes, 63.0% were drivers/operators of a vehicle; 26.1% were passengers; and 10.9% were pedestrians. Within each of the victim types, the highest incidence of alcohol involvement (52.7%) occurred in the crashes in which a driver/operator died. Alcohol was involved in 50.0% of the crashes in which a passenger died and 35.7% of those in which a pedestrian died Type of vehicle occupied. Of all the people who died in alcohol-related crashes, 45.7% were in an automobile; 26.1% were in a truck/van; 15.2% were off-road vehicle occupants; and 2.2% were motorcyclists. Within each of these vehicle types, the incidence of alcohol involvement in which a truck/van occupant died was greater than the incidence of alcohol in crashes in which an automobile occupant or motorcyclist died (52.2% versus 50.0% and 33.3%). Among off-road vehicle occupants, 63.6% died in an alcohol-related crash. 7.2 ALCOHOL IN FATALLY INJURED DRIVERS This section presents information on the presence of alcohol, exclusively among drivers fatally injured in Manitoba during Table 7-2 shows the information by age group, gender, vehicle type, and collision type (single vs. multiple). 93
104 MANITOBA Table 7-2 Alcohol Use Among Fatally Injured Drivers: Manitoba, 2010 Category Number Drivers Tested Positive BAC BAC > 80 mg% of of % of % of % of all drivers % of % of all drivers Driver Drivers* Number total Number tested with +BAC Number tested with BAC >80 mg% Age < > Gender Male Female Vehicle Type Automobile Truck/Van Motorcycle Collision Type Single-Vehicle Multiple-Vehicle TOTAL * Excludes operators of bicycles, snowmobiles, farm tractors and other non-highway vehicles. The first data column in the table shows the number of drivers killed. The next columns show the number and percent of these victims who were tested for alcohol. The remaining columns provide information on the results of the alcohol tests the first three of these present results for drivers who showed any evidence of alcohol; the last three columns present information on drivers who had BACs over the statutory limit of 80 mg%. To illustrate, among those aged there were three drivers killed during 2010; all three of these fatally injured drivers (100.0%) were tested for alcohol. Of those who were tested, two (66.7%) were positive for alcohol. This means fatally injured drinking drivers aged accounted for 11.1% of all drinking drivers who were killed. 94
105 MANITOBA Then, in the final three columns, it can be seen that two of the three (66.7%) fatally injured drivers aged who were tested for alcohol had BACs in excess of 80 mg%. This means that both of the drivers who were positive for alcohol had BACs in excess of the legal limit. The final column expresses the number of drivers with illegal BACs as a percent of all drivers with BACs over the limit. Thus, drivers aged accounted for 14.3% of all the drivers with BACs over the legal limit. The main findings are shown by the totals at the bottom of the table. Manitoba had a high testing rate in 2010, with 93.3% of fatally injured drivers being tested for alcohol use. In Manitoba, 42.9% had been drinking and 14 of 18 (77.8%) fatally injured drinking drivers had BACs >80 mg%. Although not shown in the table, more refined analyses by different BAC categories show that among tested drivers: > 57.1% had BACs of zero mg%; > 4.8% had BACs from 1-49 mg%; > 4.8% had BACs from mg% > 14.3% had BACs from 81 to 160 mg%; and, > 19.0% had BACs over 160 mg%. In Figure 7-1, the BAC distribution for tested fatally injured drivers is extrapolated to reflect the BAC distribution for all fatally injured drivers. In this figure, 19 of 45 (42.2%) fatally injured drivers have a positive BAC. And among fatally injured drinking drivers, 15 (78.9%) have BACs over 80 mg% Age differences. Of all the fatally injured drinking drivers (i.e., those with a positive BAC), 33.3% were aged 20-25; 22.2% were aged 36-45; 16.7% were aged and 46-55; and 95
106 MANITOBA 11.1% were aged Of all the fatally injured legally impaired drivers (i.e., those with BACs over 80 mg%), 28.6% were aged 20-25; 21.4% were aged and 36-45; and 14.3% were aged and Within each of the age groups, fatally injured drivers aged were the most likely to have been drinking 75.0% of drivers in this age group had been drinking. By contrast, 0.0% of the tested drivers over age 55 had been drinking Gender differences. Males dominate the picture they account for 94.4% of all the fatally injured drivers who had been drinking, and 92.9% of all of the fatally injured drivers who were legally impaired. Males dominate the picture largely because they account for most of the drivers who are killed (35 of the 45 fatalities or 77.8% are males). Fatally injured male drivers were more likely to have been drinking than female drivers (54.5% and 11.1%, respectively). And, 76.5% of the male drivers and 100.0% of the female drivers who were drinking had BACs over the legal limit Vehicle differences. Of all the fatally injured drinking drivers (i.e., those with a positive BAC), 50.0% were automobile drivers; 44.4% were truck/van drivers; and 5.6% were motorcyclists. Of all the fatally injured legally impaired drivers (i.e., those with BACs over 80 mg%), 50.0% were automobile drivers and truck/van drivers. Within each of the vehicle types, 53.3% of fatally injured truck/van drivers, 50.0% of motorcyclists, and 36.0% of automobile drivers had been drinking Collision differences. Slightly less than half of the drivers killed (22 of the 45) were involved in single-vehicle collisions but these crashes accounted for three-quarters of the drivers who had been drinking or were legally impaired (77.8% and 71.4%, respectively). The reason for this apparent disparity is because alcohol is overrepresented in single-vehicle crashes. Two-thirds of the drivers involved in single-vehicle crashes (66.7%) were positive for alcohol, compared to 19.0% of those involved in multiple-vehicle collisions. 7.3 DRIVERS INVOLVED IN ALCOHOL-RELATED SERIOUS INJURY CRASHES This section presents information on drivers involved in alcohol-related crashes in which someone was seriously injured in 2010 in Manitoba. A surrogate or indirect measure is used to estimate alcohol involvement because drivers in serious injury crashes are seldom 96
107 MANITOBA tested for alcohol. A driver is identified as having been involved in an alcohol-related serious injury crash if the crash in which someone was seriously injured involved a single vehicle at night (SVN), or if, in the case of a non-svn serious injury crash, the police reported alcohol involvement i.e., at least one drinking driver in the crash (see Section 2.2.4). The results are shown in Table 7-3 for drivers grouped in terms of age, gender, type of vehicle driven, and type of collision. The first data column shows the number of drivers involved in serious injury crashes. The number and percent of drivers in such crashes that involved alcohol is shown in the next two columns. The final column expresses the number of drivers involved in alcohol-related serious injury crashes in any row as a percent of all drivers involved in alcohol- related serious injury crashes. As shown, by the totals at the bottom of the table, 398 drivers were involved in crashes in which someone was seriously injured, and among these 19.6% were alcohol-related crashes Driver age. Of all the drivers involved in alcohol-related serious injury crashes, 23.1% were aged 26-35; 20.5% were over aged 55; and 12.8% were aged and Drivers aged and each accounted for 7.7% of those involved in alcohol-related serious injury crashes. 97
108 MANITOBA Table 7-3 Drivers in Alcohol-Related Serious Injury Crashes: Manitoba, 2010 Category Number Alcohol-Related of of % of % of all drivers in Drivers Drivers* Number total alcohol-related crashes Age < > unknown Gender Male Female unknown Vehicle Type Auto Truck/Van Motorcycle Tractor Trailer Other Hwy. Vehicle Off-Road Unknown Collision Type Single-Vehicle Multiple-Vehicle TOTAL * These numbers are slightly underestimated since 15.7% of all injuries are recorded as unspecified. Within each of the age groups, almost one-quarter of the drivers aged and over 55 were involved in alcohol-related serious injury crashes (24.3% and 22.5%, respectively). The lowest incidence of involvement in alcohol-related crashes was found for those under 16 (0.0%) Driver gender. Of all the drivers involved in alcohol-related serious injury crashes, 60.3% were males. The incidence of involvement in alcohol-related serious injury crashes was greater for males than for females (20.3% and 15.8%) Type of vehicle driven. Of all the drivers involved in alcohol-related serious injury crashes, 37.2% were automobile drivers; 34.6% were truck/van drivers; 5.1% were off-road
109 MANITOBA vehicle drivers; 3.8% were motorcyclists; and 2.6% were tractor-trailer drivers. The highest incidence of involvement in alcohol-related serious injury crashes was found for drivers of other highway vehicles 50.0% of these drivers were in crashes that involved alcohol, compared to 22.3% for motorcyclists; 21.1% for off-road vehicle drivers, 19.0% for truck/van drivers; 17.0% for automobile drivers; and 15.4% for tractor-trailer drivers Type of collision. Of all the drivers involved in alcohol-related serious injury crashes, 80.8% of them were in single-vehicle crashes. The highest incidence of involvement in alcohol-related serious injury crashes was also found among drivers in single-vehicle crashes 38.9% of these drivers, compared to only 6.4% for drivers involved in multiple-vehicle crashes. 7.4 TRENDS IN THE ALCOHOL-CRASH PROBLEM The previous sections examined three indicators of the alcohol-crash problem: the number and percent of people who died in crashes that involved alcohol; the number and percent of fatally injured drivers who had been drinking; and the number and percent of drivers in serious injury crashes that involved alcohol. This section examines changes in these three indicators of the problem. Manitoba s progress in meeting the STRID 2010 objective of a 40% reduction in the alcohol-crash problem by 2010 is also reported by comparing findings in 2010 with those from the baseline period Deaths in alcohol-related crashes: Table 7-4 and Figure 7-2 show the number and percent of people who died in crashes involving a drinking driver from 1995 to These results differ slightly from those in Section 7.1 for two reasons. First, deaths that occur in crashes that involve a drinking pedestrian are not necessarily classified as alcoholrelated deaths. The focus here is more restrictive, on deaths that occur in crashes involving at least one drinking driver. Second, the trend analyses focus on fatal crashes on public roadways involving principal vehicle types (where at least one of the vehicles involved is an automobile, truck/van, motorcycle or other highway vehicle). The previous analyses included all types of motorized vehicles (e.g., snowmobiles) on both public roadways and in off-road locations. 99
110 MANITOBA Table 7-4 Number* and Percent of Motor Vehicle Deaths** Involving a Drinking Driver: Manitoba, Year Number of Alcohol-Related Deaths Deaths Number % of total baseline * numbers are estimates based on the percent of deaths for which information was available to determine alcohol use. ** only on public roadways involving principal vehicle types. 100
111 MANITOBA As shown in the table and figure, the number of deaths in crashes that involved a drinking driver generally dropped from 46 to a low of 29 between 1995 and The number of alcohol-related fatalities increased to 43 in 2003, decreased to 30 in 2005, rose to 46 in 2007, decreased to 34 in 2009 and rose to 37 in The percentage of alcohol-related fatalities increased from 34.8% in 1995 to 37.5% in In 1998, the percentage of alcohol-related fatalities in Manitoba decreased 29.0%, rose to 34.2% in 1999, decreased to 29.6% in 2000, rose to 40.2% in 2003, decreased to a low of 28.0% in 2005, reached a high of 55.7% in 2008, decreased to 38.2% in 2009, and rose again to 42.0% in As shown at the bottom of the table, during the baseline period there was an average of 36 fatalities involving a drinking driver and they accounted for 32.7% of all fatalities. This means that the percent of fatalities involving a drinking driver increased by 28.4% from 32.7% in the baseline period ( ) to 42.0% in In terms of the number of persons killed in crashes involving a drinking driver, there has been a 2.8% increase from an average of 36 in the baseline period ( ) to 37 in Fatally injured drivers: Data on alcohol use among fatally injured drivers over the 24-year period from are shown in Table 7-5. Trends are illustrated in Figure 7-3 which shows changes in the percent of fatally injured drivers who: (1) showed no evidence of alcohol (represented by the white area); (2) had BACs below the legal limit (shown by the light grey area); and (3) had BACs over the legal limit (the dark grey area). The data reported here are restricted to drivers who died in less than six hours after the crash. As can be seen, the percent of fatally injured drivers with BACs over the legal limit generally declined from 1987 (60.0%) to a low of 18.8% in 2005, rose in 2008 (45.2%), decreased in 2009 (30.4%), and rose again in 2010 (35.9%). The percent of fatally injured drivers with zero BACs generally increased from a low of 33.0% in 1987 to its highest level in 2005 (79.2%), decreased in 2008 (38.1%), rose in 2009 (57.1%), and decreased in 2010 (53.8%). The percent of fatally injured drivers with BACs between 1 and 80 mg% peaked in 1994 (18.9%), dropped to a low of 1.9% in 2001, increased in 2003 (7.5%), decreased in 2005 (2.1%), rose in 2008 (16.7%), and decreased again in 2010 (10.3%). 101
 1987 67 60 89.6 20 33.3 4 6.7 36 60.0 1988 64 58 90.6 23 39.7 5 8.6 30 51.7 1989 70 66 94.3 32 48.5 10 15.2 24 36.4 1990 54 49 90.7 25 51.0 1 2.0 23 46.9 1991 63 54 85.7 22 40.7 6 11.1 26 48.")
112 MANITOBA Table 7-5 Alcohol Use Among Fatally Injured Drivers: Manitoba, Number of Drivers Drivers Grouped by BAC (mg%) YEAR Drivers* Tested (% Total) Zero (% Tested) 1-80 (% Tested) >80 (% Tested) (98.1) 30 (58.8) 4 (7.8) 17 (33.3) baseline * dying in less than six hours. 102
113 MANITOBA When compared to the baseline period shown at the bottom of Table 7-5, the percentage of fatally injured drivers with zero BACs in 2010 decreased by 8.5% (from 58.8% to 53.8%). Among drivers with BACs from 1-80 mg%, there was a 32.1% increase (from 7.8% to 10.3%) and among those with BACs over 80 mg%, there was a 7.8% increase (from 33.3% to 35.9%). Table 7-6 and Figure 7-4 show data on alcohol use among fatally injured drivers over a shorter period from These results also differ from those reported above for several reasons. First, the number of drivers is extrapolated to reflect the BAC distribution of drivers tested for alcohol (see Figure 7-1). Second, estimates are based on all fatally injured drivers, not just those who died in less than six hours from the crash. Third, drivers are grouped in only two BAC categories: zero and positive. As can be seen at the bottom of Table 7-6, the percentage of fatally injured drivers testing positive for alcohol from , the baseline period, is 40.3%. In % of fatally injured drivers tested positive for alcohol, a 4.7% increase from the baseline period Drivers in serious injury crashes: Table 7-7 and Figure 7-5 show information on drivers involved in alcohol-related serious injury crashes. As shown in Table 7-7, during the baseline period ( ), an average of 21.3% of drivers in serious injury crashes were in an alcohol-involved crash. This compares to 19.6% in 2010, an 8.0% decrease in the problem. Table 7-8 and Figure 7-6 also show information on drivers involved in alcohol-related serious injury crashes. These results differ slightly from those in Section 7.3 and in Table 7-7 and Figure 7-5 above because they exclude certain vehicle types e.g., bicycles, snowmobiles, farm tractors and other non-highway vehicles. As can be seen, the incidence of alcohol-involvement in serious injury crashes has generally declined. Between 1995 and 2004 the percentage of all drivers in serious injury crashes that involved alcohol generally decreased from 22.9% to 17.3%, rose to 19.1% in 2005, decreased to 17.3% in 2006, rose to 22.1% in 2007, decreased to a low of 15.6% in 2008, rose to 18.8% in 2009, and decreased slightly to 18.5% in
114 MANITOBA Table 7-6 Alcohol Use Among Fatally Injured Drivers*: Manitoba, Number of Drivers Grouped by BAC (mg%) YEAR Drivers* Zero (% Tested) Positive (% Tested) (50.0) 32 (50.0) (43.1) 41 (56.9) (50.0) 29 (50.0) (51.5) 33 (48.5) (45.3) 35 (54.7) (60.0) 28 (40.0) (43.8) 27 (56.3) (60.0) 26 (40.0) (65.7) 23 (34.3) (66.7) 20 (33.3) (62.7) 25 (37.3) (62.9) 23 (37.1) (62.7) 22 (37.3) (46.8) 33 (53.2) (59.6) 23 (40.4) (76.4) 13 (23.6) (61.1) 28 (38.9) (56.5) 30 (43.5) (38.3) 29 (61.7) (55.6) 28 (44.4) (57.8) 19 (42.2) (59.7) 25 (40.3) baseline * numbers are estimates based on the BAC distribution of drivers tested for alcohol 104

115 MANITOBA As shown in Table 7-8, in the baseline period ( ), an average of 21.6% of drivers in serious injury crashes were in an alcohol-involved crash. In 2010, the incidence of drivers in alcohol-involved crashes dropped to 18.5%, a 14.4% decrease. 105
 1996 804 174 (21.6) 1997 630 162 (25.7) 1998 657 151 (23.0) 1999 595 120 (20.2) 2000 587 110 (18.7) 2001 597 115 (19.3) 2002 525 108 (20.6) 2003 532 102 (19.2) 2004 550 95 (17.3) 2005 482 92 (19.")
116 MANITOBA Table 7-8 Number and Percent of All Drivers* in Serious Injury Crashes ** that Involved Alcohol: Manitoba, Year Number of Alcohol Related Drivers Number % (22.9) (21.6) (25.7) (23.0) (20.2) (18.7) (19.3) (20.6) (19.2) (17.3) (19.1) (17.3) (22.1) (15.6) (18.8) (18.5) (21.6) baseline * excludes operators of bicycles, snowmobiles, farm tractors, and other non-highway vehicles. ** single-vehicle nighttime crashes (SVN) as well as non-svn crashes that have police-reported alcohol involvement 106
117 ONTARIO 8.0 ONTARIO This section of the report reviews the major findings on alcohol involvement in fatal and serious injury motor vehicle collisions in Ontario during It describes data on: > people who were killed in alcohol-related crashes (Section 8.1); > alcohol use among fatally injured drivers (Section 8.2); > drivers involved in alcohol-related serious injury crashes (Section 8.3); and > trends in the alcohol-crash problem (Section 8.4). 8.1 DEATHS IN ALCOHOL-RELATED CRASHES Table 8-1 presents information on people who died in alcohol-related crashes in Ontario during Motor vehicle deaths are categorized in terms of the victim s age, gender, type (i.e., driver, passenger, pedestrian) and the type of vehicle they occupied. The first data column in the table presents the number of deaths. The next two columns show the number and percent of these fatalities in which sufficient information was available to determine if alcohol was involved. A motor vehicle fatality was considered to be alcohol involved if there was at least one drinking driver or drinking pedestrian in the fatal crash. For example, 70 people age were killed in motor vehicle crashes in Ontario during And, in 64 cases (91.4%) it was possible to determine if alcohol was a factor in the crash. The next column shows the number of people killed in crashes that were known to be alcoholinvolved. For example, 27 people aged died in alcohol-related crashes in Ontario during The next column expresses this as a percentage i.e., 42.2% of the year olds who were killed died in an alcohol-related crash. The final column (percent of all alcohol-related deaths) expresses the number of deaths in alcohol-related crashes as a percent of all the deaths in such crashes. For example, the alcohol-related deaths among year olds represent 11.6% of all the people killed in alcohol-related crashes in Ontario during The totals at the bottom of the table provide a summary. As can be seen, 728 persons died in motor vehicle crashes in Ontario during In 655 (90.0%) of these cases, it was possible to determine if alcohol was a factor. Of these known cases, 233 (35.6%) involved alcohol. 107
118 ONTARIO Extrapolating this figure to the total number of motor vehicle fatalities (728 x.356) it can be estimated that in Ontario during 2010, 259 persons died in alcohol-related crashes Victim age. Of all the people who died in alcohol-related crashes, 21.9% (see last column) were aged 20-25; 18.5% were aged 36-45; 16.7% were aged and 46-55; 13.7% were over age 55; 11.6% were aged 16-19; and 0.9% were under 16. Within each of the age groups, the highest incidence of alcohol involvement occurred in the crashes in which a person aged and died (58.6% and 51.8% respectively). Table 8-1 Deaths* in Alcohol-Related Crashes: Ontario, 2010 Category Number Alcohol Use Known Alcohol-Related Deaths of Victim of Deaths % of % of % of all alcohol- Number total Number known related deaths Age < > Gender Male Female Type Driver/Operator Passenger Pedestrian Vehicle Occupied Automobiles Trucks/Vans Motorcycles Other Hwy. Vehs Offroad Vehicles (Pedestrians) TOTAL *persons dying within 12 months in collisions on and off public roadways The lowest incidence of alcohol involvement was found among the youngest and oldest 108
119 ONTARIO fatalities 20.0% of persons under 16 and 14.0% of the fatalities over 55 years of age died in crashes involving alcohol Gender. Of all the people who died in alcohol-related crashes, 85.4% were males. The incidence of alcohol in crashes in which a male died (41.3%) was greater than the incidence of alcohol in crashes in which a female died (19.7%) Victim type. Of all the people who died in alcohol-related crashes, 70.8% were driver/operators of a vehicle; 16.3% were pedestrians; and 12.9% were passengers. Within each of the victim types, the highest incidence of alcohol involvement (37.7%) occurred in the crashes in which a driver/operator died. Alcohol was involved in 35.5% of the crashes in which a pedestrian died and 27.3% of the crashes in which a passenger died Type of vehicle occupied. Of all the people who died in alcohol-related crashes, 42.9% were in an automobile; 18.5% were off-road vehicle occupants; 17.6% were truck/van occupants; and 4.7% were motorcyclists. Within each of these vehicle types, the incidence of alcohol involvement in which a truck/van occupant died was greater than the incidence of alcohol in crashes in which an automobile occupant or motorcyclist died (36.9% versus 33.1% and 23.4%). Among off-road vehicle occupants, 60.6% were involved in an alcohol-related crash. 8.2 ALCOHOL IN FATALLY INJURED DRIVERS This section presents information on the presence of alcohol, exclusively among drivers fatally injured in Ontario during Table 8-2 shows the information by age group, gender, vehicle type, and collision type (single vs. multiple). 109
120 ONTARIO Table 8-2 Alcohol Use Among Fatally Injured Drivers: Ontario, 2010 Category Number Drivers Tested Positive BAC BAC > 80 mg% of of % of % of % of all drivers % of % of all drivers Driver Drivers* Number total Number tested with +BAC Number tested with BAC >80 mg% Age > Gender Male Female Vehicle Type Automobile Truck/Van Motorcycle Tractor Trailer Other Vehicle Collision Type Single-Vehicle Multiple-Vehicle TOTAL * Excludes operators of bicycles, snowmobiles, farm tractors and other non-highway vehicles. The first data column in the table shows the number of drivers killed. The next columns show the number and percent of these victims who were tested for alcohol. The remaining columns provide information on the results of the alcohol tests the first three of these present results for drivers who showed any evidence of alcohol; the last three columns present information on drivers who had BACs over the statutory limit of 80 mg%. To illustrate, among year olds there were 28 drivers killed during 2010; 22 of these fatally injured drivers (78.6%) were tested for alcohol. Of those who were tested, eight (36.4%) were positive for alcohol. This means that year old fatally injured drinking drivers accounted for 7.3% of all drinking drivers who were killed. 110 Then, in the final three columns, it can be seen that seven of the 22 (31.8%) fatally injured year olds who were tested for alcohol had BACs in excess of 80 mg%. This means that seven of
121 ONTARIO the eight drivers who were positive for alcohol had BACs in excess of the legal limit. The final column expresses the number of drivers with illegal BACs as a percent of all drivers with BACs over the limit. Thus, year old drivers accounted for 7.5% of all the drivers with BACs over the legal limit. The main findings are shown by the totals at the bottom of the table. Ontario had a high testing rate in 2010, with 84.3% of fatally injured drivers being tested for alcohol use. In Ontario, 32.8% had been drinking and 93 of 109 (85.3%) fatally injured drinking drivers had BACs >80 mg%. Although not shown in the table, more refined analyses by different BAC categories show that among tested drivers: > 67.2% had BACs of zero mg%; > 3.9% had BACs from 1-49 mg%; > 0.9% had BACs from mg% > 10.2% had BACs from 81 to 160 mg%; and, > 17.8% had BACs over 160 mg%. In Figure 8-1, the BAC distribution for tested fatally injured drivers is extrapolated to reflect the BAC distribution for all fatally injured drivers. In this figure, 129 of 394 (32.7%) fatally injured drivers have a positive BAC. And among fatally injured drinking drivers, 110 (85.3%) have BACs over 80 mg% Age differences. Of all the fatally injured drinking drivers (i.e., those with a positive BAC), 21.1% were aged 36-45; 19.3% were aged 20-25, and 46-55; 13.8% were over 55; and 7.3% were aged
122 ONTARIO Of all the fatally injured legally impaired drivers (i.e., those with BACs over 80 mg%), 21.5% were aged 36-45; 19.4% were aged 20-25, and 46-55; 12.9% were over age 55; and 7.5% were aged Within each of the age groups, fatally injured drivers aged were the most likely to have been drinking 48.9% of drivers in this age group had been drinking. By contrast, only 14.3% of the tested drivers aged over 55 had been drinking Gender differences. Males dominate the picture they account for 88.1% of all the fatally injured drivers who had been drinking, and 88.2% of all of the fatally injured drivers who were legally impaired. Males dominate the picture largely because they account for most of the drivers who are killed (312 of the 394 fatalities are males). Fatally injured male drivers were more likely to have been drinking than female drivers (36.8% and 18.3%, respectively). And, 85.4% of the male and 84.6% of the female drivers who were drinking had BACs over the legal limit Vehicle differences. Of all the fatally injured drinking drivers (i.e., those with a positive BAC), 63.3% were automobile drivers; 29.4% were truck/van drivers; and 7.3% were motorcyclists. Of all the fatally injured legally impaired drivers (i.e., those with BACs over 80 mg%), 62.4% were automobile drivers, 31.2% were truck/van drivers; and 6.5% were motorcyclists. Within each of the vehicle types, 44.4% of truck/van drivers, 33.8% of fatally injured automobile drivers, and 18.6% of motorcyclists had been drinking. None of the fatally injured tractor-trailer drivers had been drinking Collision differences. Less than half of the drivers killed (171 of the 394) were involved in single-vehicle collisions but these crashes accounted for three-quarters of the drivers who had been drinking or were legally impaired (73.4% and 77.4%, respectively). The reason for this apparent disparity is because alcohol is over represented in single-vehicle crashes. Over half of the drivers involved in single-vehicle crashes (54.4%) were positive for alcohol, compared to only 15.7% of those involved in multiple-vehicle collisions. 8.3 DRIVERS INVOLVED IN ALCOHOL-RELATED SERIOUS INJURY CRASHES This section presents information on drivers involved in alcohol-related crashes in which someone was seriously injured in 2010 in Ontario. A surrogate or indirect measure is used 112
123 ONTARIO to estimate alcohol involvement because drivers in serious injury crashes are seldom tested for alcohol. A driver is identified as having been involved in an alcohol-related serious injury crash if the crash in which someone was seriously injured involved a single vehicle at night (SVN), or if, in the case of a non-svn serious injury crash, the police reported alcohol involvement i.e., at least one drinking driver in the crash (see Section 2.2.4). The results are shown in Table 8-3 for drivers grouped in terms of age, gender, type of vehicle driven, and type of collision. The first data column shows the number of drivers involved in serious injury crashes. The number and percent of drivers in such crashes that involved alcohol is shown in the next two columns. The final column expresses the number of drivers involved in alcohol-related serious injury crashes in any row as a percent of all drivers involved in alcohol- related serious injury crashes. As shown, by the totals at the bottom of the table, 3,493 drivers were involved in crashes in which someone was seriously injured, and among these 14.2% were alcohol-related crashes Driver age. Of all the drivers involved in alcohol-related serious injury crashes, 26.6% were aged 20-25, 19.7% were aged and 16.1% were aged Drivers under 16 accounted for 0.2% and drivers over 55 accounted for only 9.1% of those involved in alcohol-related serious injury crashes. 113
124 ONTARIO Age Table 8-3 Drivers in Alcohol-Related Serious Injury Crashes: Ontario, 2010 Category Number Alcohol-Related of of % of % of all drivers in Drivers Drivers Number total alcohol-related crashes < > unknown Gender Male Female Vehicle Type Auto Truck/Van Motorcycle Tractor Trailer Other Hwy. Vehicle Off-Road Unknown Collision Type Single-Vehicle Multiple-Vehicle TOTAL Within each of the age groups, over one-quarter of the drivers aged were involved in alcohol-related serious injury crashes (28.7%). The lowest incidence of involvement in alcoholrelated crashes was found for those over 55 (6.2%) Driver gender. Of all the drivers involved in alcohol-related serious injury crashes, 80.9% were males. The incidence of involvement in alcohol-related serious injury crashes was also greater for males than for females (16.1% and 9.5%, respectively) Type of vehicle driven. Of all the drivers involved in alcohol-related serious injury crashes, 66.4% were automobile drivers; 20.3% were truck/van drivers; 6.6% were motorcyclists
125 ONTARIO and 3.8% were off-road vehicle drivers. The highest incidence of involvement in alcohol-related serious injury crashes was found for automobile drivers 15.6% of these drivers were in crashes that involved alcohol, compared to 14.3% of truck/van drivers; 12.2% of other highway vehicle drivers; 10.7% for off-road vehicle drivers and 10.5% for motorcyclists. Among tractor-trailer drivers, 6.5% were involved in alcoholrelated crashes Type of collision. Of all the drivers involved in alcohol-related serious injury crashes, 66.4% of them were in single-vehicle crashes. The highest incidence of involvement in alcohol-related serious injury crashes was also found among drivers in single-vehicle crashes 33.6% of these drivers, compared to only 6.6% for drivers involved in multiple-vehicle crashes. 8.4 TRENDS IN THE ALCOHOL-CRASH PROBLEM The previous sections examined three indicators of the alcohol-crash problem: the number and percent of people who died in crashes that involved alcohol; the number and percent of fatally injured drivers who had been drinking; and the number and percent of drivers in serious injury crashes that involved alcohol. This section examines changes in these three indicators of the problem. Ontario s progress in meeting the STRID 2010 objective of a 40% reduction in the alcohol-crash problem is also reported by comparing findings in 2010 with those from the baseline period Deaths in alcohol-related crashes: Table 8-4 and Figure 8-2 show the number and percent of people who died in crashes involving a drinking driver from 1995 to These results differ slightly from those in Section 8.1 for two reasons. First, deaths that occur in crashes that involve a drinking pedestrian are not necessarily classified as alcoholrelated deaths. The focus here is more restrictive, on deaths that occur in crashes involving at least one drinking driver. Second, the trend analyses focus on fatal crashes on public roadways involving principal vehicle types (where at least one of the vehicles involved is an automobile, truck/van, motorcycle or other highway vehicle). The previous analyses included all types of motorized vehicles (e.g., snowmobiles) on both public roadways and in off-road locations. 115
126 ONTARIO Table 8-4 Number* and Percent of Motor Vehicle Deaths** Involving a Drinking Driver: Ontario, Year Number of Alcohol-Related Deaths Deaths Number % of total baseline * numbers are estimates based on the percent of deaths for which information was available to determine alcohol use. ** only on public roadways involving principal vehicle types. 116
127 ONTARIO As shown in the figure, the number of deaths in crashes that involved a drinking driver generally dropped from 398 to 210 between 1995 and There was an increase to 232 in 2006, a decrease to a low of 169 in 2009, and an increase to 181 in The percentage of alcoholrelated fatalities generally declined from 37.6% in 1995 to 25.6% in 2002, rose to 28.9% in 2006 and 2007, decreased to 26.9% in 2009, and rose to 28.9% in As shown at the bottom of the table, during the baseline period there was an average of 285 fatalities involving a drinking driver and they accounted for 31.0% of all fatalities. Thus, it can be seen that the percent of fatalities involving a drinking driver decreased by 6.8% from 31.0% in the baseline period ( ) to 28.9% in And, in terms of the number of persons killed in crashes involving a drinking driver, there has been a 36.5% decrease from an average of 285 in the baseline period ( ) to 181 in Fatally injured drivers: Data on alcohol use among fatally injured drivers over the 24-year period from are shown in Table 8-5. Trends are illustrated in Figure 8-3 which shows changes in the percent of fatally injured drivers who: (1) showed no evidence of alcohol (represented by the white area); (2) had BACs below the legal limit (shown by the light grey area); and (3) had BACs over the legal limit (the dark grey area). The data reported here are restricted to drivers who died in less than six hours after the crash. As can be seen, the percent of fatally injured drivers with BACs over the legal limit generally declined from 1987 (39.6%) to 2002 (22.9%), generally rose until 2005 (25.7%), decreased in 2008 (21.1%), and rose again in 2010 (26.6%). The percent of fatally injured drivers with zero BACs generally increased from 1987 (53.0%) to 2002 (72.2%), generally decreased until 2006 (67.0%), rose to its highest level in 2008 (74.2%), and decreased again in 2010 (69.2%). The percent of fatally injured drivers with BACs between 1 and 80 mg% peaked in 1988 (12.5%), dropped in 2001 (4.3%), rose in 2003 (5.9%), dropped in 2005 (4.8%), rose in 2007 (8.5%), decreased to its lowest mark in 2009 (3.9%), and rose again in 2010 (4.2%). 117
 1987 613 540 88.1 286 53.0 40 7.4 214 39.6 1988 555 521 93.9 281 53.9 65 12.5 175 33.6 1989 642 586 91.3 345 58.9 49 8.4 192 32.8 1990 545 486 89.2 287 59.1 37 7.6 162 33.3 1991 531 462 87.")
128 ONTARIO Table 8-5 Alcohol Use Among Fatally Injured Drivers: Ontario, Number of Drivers Drivers Grouped by BAC (mg%) YEAR Drivers* Tested (% Total) Zero (% Tested) 1-80 (% Tested) >80 (% Tested) (94.1) 280 (67.1) 27 (6.5) 110 (26.4) baseline * dying in less than six hours. 118
129 ONTARIO When compared to the baseline period, the percentage of fatally injured drivers with zero BACs in 2009 increased by 3.1% (from 67.1% to 69.2%). Among drivers with BACs from 1-80 mg%, there was a 35.4% decrease (from 6.5% to 4.2%). Among drivers with BACs over 80 mg%, there was a 0.8% increase (from 26.4% to 26.6%). Table 8-6 and Figure 8-4 show data on alcohol use among fatally injured drivers over a shorter period from These results also differ from those reported above for several reasons. First, the number of drivers is extrapolated to reflect the BAC distribution of drivers tested for alcohol (see Figure 8-1). Second, estimates are based on all fatally injured drivers, not just those who died in less than six hours from the crash. Third, drivers are grouped in only two BAC categories: zero and positive. As can be seen in Table 8-6, the baseline percentage of fatally injured drivers testing positive for alcohol from is 33.1%. In 2010, 32.7% of fatally injured drivers tested positive for alcohol, a 1.2% decrease from the baseline period Drivers in serious injury crashes: Table 8-7 and Figure 8-5 show information on drivers involved in alcohol-related serious injury crashes. As shown in Table 8-7, during the baseline period ( ), an average of 19.5% of drivers in serious injury crashes were in an alcohol-involved crash. This compares to 14.2% in 2010, a 27.2% decrease in the problem. Table 8-8 and Figure 8-6 also show information on drivers involved in alcohol-related serious injury crashes. These results differ slightly from those in Section 8.3 and in Table 8-7 and Figure 8-5 above because they exclude certain vehicle types e.g., bicycles, snowmobiles, farm tractors, and other non-highway vehicles. As can be seen, the incidence of alcohol-involvement in serious injury crashes has been relatively stable. Between 1995 and 2003 the percentage of drivers in serious injury crashes that involved alcohol generally decreased from 22.9% to 16.3%, rose to 17.2% in 2004, dropped to 16.6% in 2005, rose to 18.3% in 2006, decreased to 16.6% in 2008, rose slightly to 16.8% in 2009, and decreased to 14.5% in As shown in Table 8-8, in the baseline period ( ) an average of 19.9% of drivers in serious injury crashes were in an alcohol-involved crash. In 2010, the incidence of drivers in alcohol-involved crashes dropped to 14.5%, a 27.1% decrease from the baseline period. 119
130 ONTARIO Table 8-6 Alcohol Use Among Fatally Injured Drivers*: Ontario, Number of Drivers Grouped by BAC (mg%) YEAR Drivers* Zero (% Tested) Positive (% Tested) (59.1) 268 (40.9) (54.7) 300 (45.3) (53.7) 314 (46.3) (55.0) 320 (45.0) (56.4) 274 (43.6) (58.3) 263 (41.7) (63.1) 193 (36.9) (64.6) 210 (35.4) (64.4) 186 (35.6) (70.6) 167 (29.4) (68.5) 163 (31.5) (70.2) 155 (29.8) (73.0) 140 (27.0) (68.9) 161 (31.1) (70.0) 151 (30.0) (70.1) 144 (29.9) (68.0) 148 (32.0) (68.5) 157 (31.5) (73.6) 112 (26.4) (69.9) 110 (30.1) (67.3) 129 (32.7) (66.9) 179 (33.1) baseline * numbers are estimates based on the BAC distribution of drivers tested for alcohol 120
 1996 6221 1355 (21.8) 1997 5673 1134 (20.0) 1998 5722 1074 (18.8) 1999 5692 1113 (19.6) 2000 5329 1047 (19.6) 2001 5435 934 (17.2) 2002 6165 1092 (17.7) 2003 5327 858 (16.1) 2004 4797 809 (16.")
131 ONTARIO Table 8-7 Number and Percent of All Drivers in Serious Injury Crashes * that Involved Alcohol: Ontario, Year Number of Alcohol Related Drivers Number % (22.6) (21.8) (20.0) (18.8) (19.6) (19.6) (17.2) (17.7) (16.1) (16.9) (16.3) (18.1) (17.2) (16.3) (16.6) (14.2) (19.5) baseline * single-vehicle nighttime crashes (SVN) as well as non-svn crashes that have police-reported alcohol involvement 121
 1996 6003 1326 (22.1) 1997 5442 1106 (20.3) 1998 5402 1026 (19.0) 1999 5486 1088 (19.8) 2000 5126 1030 (20.1) 2001 5199 916 (17.6) 2002 5468 939 (17.2) 2003 5086 829 (16.3) 2004 4568 787 (17.")
132 ONTARIO Table 8-8 Number and Percent of All Drivers* in Serious Injury Crashes ** that Involved Alcohol: Ontario, Year Number of Alcohol Related Drivers Number % (22.9) (22.1) (20.3) (19.0) (19.8) (20.1) (17.6) (17.2) (16.3) (17.2) (16.6) (18.3) (17.7) (16.6) (16.8) (14.5) (19.9) baseline * excludes operators of bicycles, snowmobiles, farm tractors, and other non-highway vehicles. ** single-vehicle nighttime crashes (SVN) as well as non-svn crashes that have police-reported alcohol involvement 122
133 QUEBEC 9.0 QUEBEC This section of the report reviews the major findings on alcohol involvement in fatal and serious injury motor vehicle collisions in Quebec during It describes data on: > people who were killed in alcohol-related crashes (Section 9.1); > alcohol use among fatally injured drivers (Section 9.2); > drivers involved in alcohol-related serious injury crashes (Section 9.3); and > trends in the alcohol-crash problem (Section 9.4). 9.1 DEATHS IN ALCOHOL-RELATED CRASHES Table 9-1 presents information on people who died in alcohol-related crashes in Quebec during Motor vehicle deaths are categorized in terms of the victim s age, gender, type (i.e., driver, passenger, pedestrian) and the type of vehicle they occupied. The first data column in the table presents the number of deaths. The next two columns show the number and percent of these fatalities in which sufficient information was available to determine if alcohol was involved. A motor vehicle fatality was considered to be alcohol involved if there was at least one drinking driver or drinking pedestrian in the fatal crash. For example, 55 people age were killed in motor vehicle crashes in Quebec during And, in 51 cases (92.7%) it was possible to determine if alcohol was a factor in the crash. The next column shows the number of people killed in crashes that were known to be alcoholinvolved. For example, 19 people aged died in alcohol-related crashes in Quebec during The next column expresses this as a percentage i.e., 37.3% of the year olds who were killed died in an alcohol-related crash. The final column (percent of all alcohol-related deaths) expresses the number of deaths in alcohol-related crashes as a percent of all the deaths in such crashes. For example, the alcohol-related deaths among year olds represent 14.8% of all the people killed in alcohol-related crashes in Quebec during The totals at the bottom of the table provide a summary. As can be seen, 516 persons died in motor vehicle crashes in Quebec during In 421 (81.6%) of these cases, it was possible to determine if alcohol was a factor. Of these known cases, 128 (30.4%) involved alcohol. Extrapolating this figure to the total number of motor vehicle fatalities (516 x.304) it can be estimated that in Quebec during 2010, 157 persons died in alcohol-related crashes. 123
134 QUEBEC Victim age. Of all the people who died in alcohol-related crashes, 25.0% (see last column) were aged 20-25; 16.4% were over age 55; 15.6% were aged 46-55; 14.8% were aged and 26-35; 13.3% were aged 36-45; and 0.0% were under 16. Table 9-1 Deaths* in Alcohol-Related Crashes: Quebec, 2010 Category Number Alcohol Use Known Alcohol-Related Deaths of Victim of Deaths % of % of % of all alcohol- Number total Number known related deaths Age < > Gender Male Female Type Driver/Operator Passenger Pedestrian Unknown Vehicle Occupied Automobiles Trucks/Vans Motorcycles Other Hwy. Vehs Offroad Vehicles (Pedestrians) Unknown TOTAL *persons dying within 12 months in collisions on and off public roadways Within each of the age groups, the highest incidence of alcohol involvement occurred in the crashes in which a person aged and died (50.0% and 43.2% respectively). The lowest incidence of alcohol involvement was found among the youngest and oldest fatalities 0.0% of persons under 16 and 15.4% of the fatalities over 55 years of age died in crashes 124
135 QUEBEC involving alcohol Gender. Of all the people who died in alcohol-related crashes, 81.3% were males. The incidence of alcohol in crashes in which male died (34.3%) was greater than the incidence of alcohol in crashes in which a female died (20.3%) Victim type. Of all the people who died in alcohol-related crashes, 74.2% were drivers/operators of a vehicle; 18.8% were passengers; and 7.0% were pedestrians. Within each of the victim types, the highest incidence of alcohol involvement (32.8%) occurred in the crashes in which a driver/operator died. Alcohol was involved in 27.3% of the crashes in which a passenger died and 20.9% of those in which a pedestrian died Type of vehicle occupied. Of all the people who died in alcohol-related crashes, 57.8% were in an automobile; 17.2% were off-road vehicle occupants; 10.2% were motorcyclists; and 7.8% were truck/van occupants. Within each of these vehicle types, the incidence of alcohol involvement in which a truck/van occupant died was greater than the incidence of alcohol in crashes in which an automobile occupant died (47.6% versus 29.8%). Among motorcyclists, 38.2% died in an alcohol-related crash compared to 32.8% of off-road vehicle occupants. 9.2 ALCOHOL IN FATALLY INJURED DRIVERS This section presents information on the presence of alcohol, exclusively among drivers fatally injured in Quebec during Table 9-2 shows the information by age group, gender, vehicle type, and collision type (single vs. multiple). 125
136 QUEBEC Table 9-2 Alcohol Use Among Fatally Injured Drivers: Quebec, 2010 Category Number Drivers Tested Positive BAC BAC > 80 mg% of of % of % of % of all drivers % of % of all drivers Driver Drivers Number total Number tested with +BAC Number tested with BAC >80 mg% Age > Gender Male Female Vehicle Type Automobile Truck/Van Motorcycle Tractor Trailer Other Vehicle Collision Type Single-Vehicle Multiple-Vehicle TOTAL * Excludes operators of bicycles, snowmobiles, farm tractors and other non-highway vehicles. The first data column in the table shows the number of drivers killed. The next columns show the number and percent of these victims who were tested for alcohol. The remaining columns provide information on the results of the alcohol tests the first three of these present results for drivers who showed any evidence of alcohol; the last three columns present information on drivers who had BACs over the statutory limit of 80 mg%. To illustrate, among year olds there were 27 drivers killed during 2010; 22 of these fatally injured drivers (81.5%) were tested for alcohol. Of those who were tested, seven (31.8%) were positive for alcohol. This means that year old fatally injured drinking drivers accounted for 10.8% of all drinking drivers who were killed. 126 Then, in the final three columns, it can be seen that four of the 22 (18.2%) fatally injured year olds who were tested for alcohol had BACs in excess of 80 mg%. This means that four of

137 QUEBEC the seven drivers who were positive for alcohol had BACs in excess of the legal limit. The final column expresses the number of drivers with illegal BACs as a percent of all drivers with BACs over the limit. Thus, year old drivers accounted for 7.5% of all the drivers with BACs over the legal limit. The main findings are shown by the totals at the bottom of the table. Quebec had a low testing rate in 2010, with 63.8% of fatally injured drivers being tested for alcohol use. In Quebec, 38.0% had been drinking and 53 of 65 (81.5%) fatally injured drinking drivers had BACs >80 mg%. Although not shown in the table, more refined analyses by different BAC categories show that among tested drivers: > 62.0% had BACs of zero mg%; > 4.7% had BACs from 1-49 mg%; > 2.3% had BACs from mg% > 12.3% had BACs from 81 to 160 mg%; and, > 18.7% had BACs over 160 mg%. In Figure 9-1, the BAC distribution for tested fatally injured drivers is extrapolated to reflect the BAC distribution for all fatally injured drivers. In this figure, 102 of 268 (38.1%) fatally injured drivers have a positive BAC. And among fatally injured drinking drivers, 83 (81.4%) have BACs over 80 mg% Age differences. Of all the fatally injured drinking drivers (i.e., those with positive BAC), 21.5% were aged 26-35; 20.0% were aged and 46-55; 15.4% were over age 55; 12.3% were aged 36-45; and 10.8% were aged
138 QUEBEC Of all the fatally injured legally impaired drivers (i.e., those with BACs over 80 mg%), 24.5% were aged 26-35; 22.6% were aged and 46-55; 13.2% were over age 55; 9.4% were aged 36-45; and 7.5% were aged Within each of the principal age groups, fatally injured drivers aged were the most likely to have been drinking 53.8% of drivers in this age group had been drinking. By contrast, only 23.8% of the tested drivers aged over 55 had been drinking Gender differences. Males dominate the picture they account for 89.2% of all the fatally injured drivers who had been drinking, and 88.7% of all of the fatally injured drivers who were legally impaired. Males dominate the picture largely because they account for most of the drivers who are killed (200 of the 268 fatalities or 74.6% are males). Fatally injured male drivers were more likely to have been drinking than female drivers (44.6% and 17.1%, respectively). And, 81.0% of the male and 85.7% of the female drivers who were drinking had BACs over the legal limit Vehicle differences. Of all the fatally injured drinking drivers (i.e., those with a positive BAC), 69.2% were automobile drivers; 18.5% were motorcyclists; and 12.3% were truck/van drivers. Of all the fatally injured legally impaired drivers (i.e., those with BACs over 80 mg%), 69.8% were automobile drivers; 17.0% were motorcyclists; and 13.2% were truck/van drivers. Within each of the vehicle types, 61.5% of fatally injured truck/van drivers, 54.5% of motorcyclists, and 33.6% of automobile drivers were found to have been drinking. Neither the fatally injured tractor-trailer driver nor the driver of the other highway vehicle had been drinking Collision differences. Two-fifths of the drivers killed (112 of the 268) were involved in single-vehicle collisions but these crashes accounted for three-fifths of the drivers who had been drinking or were legally impaired (61.5% and 66.0%, respectively). The reason for this apparent disparity is because alcohol is overrepresented in single-vehicle crashes. Half of the drivers involved in single-vehicle crashes (51.3%) were positive for alcohol, compared to only 26.9% of those involved in multiple-vehicle collisions. 9.3 DRIVERS INVOLVED IN ALCOHOL-RELATED SERIOUS INJURY CRASHES 128 This section presents information on drivers involved in alcohol-related crashes in which someone was seriously injured in 2010 in Quebec. A surrogate or indirect measure is used to estimate alcohol involvement because drivers in serious injury crashes are seldom tested
139 QUEBEC for alcohol. A driver is identified as having been involved in an alcohol-related serious injury crash if the crash in which someone was seriously injured involved a single vehicle at night (SVN), or if, in the case of a non-svn serious injury crash, the police reported alcohol involvement i.e., at least one drinking driver in the crash (see Section 2.2.4). The results are shown in Table 9-3 for drivers grouped in terms of age, gender, type of vehicle driven, and type of collision. The first data column shows the number of drivers involved in serious injury crashes. The number and percent of drivers in such crashes that involved alcohol is shown in the next two columns. The final column expresses the number of drivers involved in alcohol-related serious injury crashes in any row as a percent of all drivers involved in alcohol- related serious injury crashes. As shown by the totals at the bottom of the table, 3,313 drivers were involved in crashes in which someone was seriously injured, and among these 17.7% were alcohol-related crashes Driver age. Of all the drivers involved in alcohol-related serious injury crashes, 21.0% were aged 26-35, 20.1% were aged 20-25; and 14.0% were aged Drivers under 16 accounted for only 0.7% of those involved in alcohol-related serious injury crashes. 129
140 QUEBEC Table 9-3 Drivers in Alcohol-Related Serious Injury Crashes: Quebec, 2010 Category Number Alcohol-Related of of % of % of all drivers in Drivers Drivers Number total alcohol-related crashes Age < > unknown Gender Male Female unknown Vehicle Type Auto and Truck/Van* Motorcycle Tractor Trailer Other Hwy. Vehicle Off-Road Unknown Collision Type Single-Vehicle Multiple-Vehicle TOTAL * Automobiles and light trucks have been regrouped in collision data as of March Within each of the age groups, over one-quarter of the drivers aged were involved in alcohol-related serious injury crashes (28.1%). The lowest incidence of involvement in alcoholrelated crashes was found for those under 16 (4.6%) Driver gender. Of all the drivers involved in alcohol-related serious injury crashes, 75.8% were males. The incidence of involvement in alcohol-related serious injury crashes was also greater for males than for females (19.4% and 12.4%, respectively) Type of vehicle driven. Drivers of automobiles and light trucks have been merged in this table as Quebec has regrouped these vehicle types into one category in its collision data 130
141 QUEBEC since March Of all the drivers involved in alcohol-related serious injury crashes, 83.5% were automobile-truck/van drivers; 7.8% were off-road vehicle drivers; and 5.5% were motorcyclists. The highest incidence of involvement in alcohol-related serious injury crashes was found for automobile-truck/van drivers 20.1% of these drivers were in crashes that involved alcohol, compared to 12.4% for off-road vehicle drivers, 10.4% for motorcyclists; and 9.4% for drivers of other highway vehicles. Among tractor-trailer drivers, 4.0% were involved in alcohol-related crashes Type of collision. Of all the drivers involved in alcohol-related serious injury crashes, 74.4% of them were in single-vehicle crashes. The highest incidence of involvement in alcohol-related serious injury crashes was also found among drivers in single-vehicle crashes 36.8% of these drivers, compared to only 7.1% for drivers involved in multiple-vehicle crashes. 9.4 TRENDS IN THE ALCOHOL-CRASH PROBLEM The previous sections examined three indicators of the alcohol-crash problem: the number and percent of people who died in crashes that involved alcohol; the number and percent of fatally injured drivers who had been drinking; and the number and percent of drivers in serious injury crashes that involved alcohol. This section examines changes in these three indicators of the problem. Quebec s progress in meeting the STRID 2010 objective of a 40% reduction in the alcohol-crash problem by 2010 is also reported by comparing findings in 2010 with those from the baseline period Deaths in alcohol-related crashes: Table 9-4 and Figure 9-2 show the number and percent of people who died in crashes involving a drinking driver from 1995 to These results differ slightly from those in Section 9.1 for two reasons. First, deaths that occur in crashes that involve a drinking pedestrian are not necessarily classified as alcoholrelated deaths. The focus here is more restrictive, on deaths that occur in crashes involving at least one drinking driver. Second, the trend analyses focus on fatal crashes on public roadways involving principal vehicle types (where at least one of the vehicles involved is an automobile, truck/van, motorcycle or other highway vehicle). The previous analyses included all types of motorized vehicles (e.g., snowmobiles) on both public roadways and in off-road locations. 131
142 QUEBEC Table 9-4 Number* and Percent of Motor Vehicle Deaths** Involving a Drinking Driver: Quebec, Year Number of Alcohol-Related Deaths Deaths Number % of total baseline * numbers are estimates based on the percent of deaths for which information was available to determine alcohol use. ** only on public roadways involving principal vehicle types. 132
143 QUEBEC As shown in the table and figure, the number of deaths in crashes that involved a drinking driver generally dropped from 255 to 111 between 1995 and 2007, increased to 130 in 2008, decreased to 109 in 2009, and rose to 120 in The percentage of alcohol-related fatalities generally decreased from 31.6% in 1995 to 24.2% in 2005, rose to 29.6% in 2006, decreased to a low of 21.8% in 2007, rose to 27.0% in 2008, decreased to 25.2% in 2009, and rose again to 28.6% in As shown at the bottom of the table, during the baseline period there was an average of 179 fatalities involving a drinking driver and they accounted for 26.5% of all fatalities. This means that the percent of fatalities involving a drinking driver increased by 7.9% from 26.5% in the baseline period ( ) to 28.6% in However, in terms of the number of persons killed in crashes involving a drinking driver, there has been a 33.0% decrease from an average of 179 in the baseline period ( ) to 120 in Fatally injured drivers: Data on alcohol use among fatally injured drivers over the 24-year period from are shown in Table 9-5. Trends are illustrated in Figure 9-3 which shows changes in the percent of fatally injured drivers who: (1) showed no evidence of alcohol (represented by the white area); (2) had BACs below the legal limit (shown by the light grey area); and (3) had BACs over the legal limit (the dark grey area). As can be seen, the percent of fatally injured drivers with BACs over the legal limit generally declined from 1987 (49.5%) to its lowest point in 1999 (22.3%), generally rose until 2003 (38.4%), declined in 2005 (29.6%), rose in 2006 (30.8%), decreased in 2007 (26.0%), rose in 2009 (35.7%), and decreased again in 2010 (31.0%). The percent of fatally injured drivers with zero BACs generally increased from 1987 (30.9%) to 1999 (71.5%), fluctuated until 2007 (68.5%), decreased in 2009 (57.1%), and rose again in 2010 (62.0%). The percent of fatally injured drivers with BACs between 1 and 80 mg% peaked in 1987 (19.6%), fell to its lowest mark in 2002 (4.4%), increased in 2004 (8.7%), decreased in 2005 (6.7%), rose in 2006 (8.3%), decreased in 2008 (5.3%), rose in 2009 (7.1%), and decreased slightly in 2010 (7.0%). 133
 1987 567 301 53.1 93 30.9 59 19.6 149 49.5 1988 631 392 62.1 162 41.3 41 10.5 189 48.2 1989 657 426 64.8 203 47.7 29 6.8 194 45.5 1990 582 395 67.9 193 48.9 40 10.1 162 41.0 1991 559 380 68.")
144 QUEBEC Table 9-5 Alcohol Use Among Fatally Injured Drivers: Quebec, Number of Drivers Drivers Grouped by BAC (mg%) YEAR Drivers Tested (% Total) Zero (% Tested) 1-80 (% Tested) >80 (% Tested) (72.9) 191 (62.4) 20 (6.5) 95 (31.0) baseline 134
145 QUEBEC When compared to the baseline period shown at the bottom of Table 9-5, the percentage of fatally injured drivers with zero BACs in 2010 decreased by 0.6% (from 62.4% to 62.0%). Among drivers with BACs from 1-80 mg%, there was a 7.7% increase (from 6.5% to 7.0%). And among those with BACs over 80 mg%, there has been no change (from 31.0% to 31.0%). Table 9-6 and Figure 9-4 show data on alcohol use among fatally injured drivers over a shorter period from These results also differ from those reported above for two reasons. First, the number of drivers is extrapolated to reflect the BAC distribution of drivers tested for alcohol (see Figure 9-1). Second, drivers are grouped in only two BAC categories: zero and positive. As can be seen at the bottom of Table 9-6, the percentage of fatally injured drivers testing positive for alcohol from , the baseline period, is 37.6%. In 2010, 38.1% of fatally injured drivers tested positive for alcohol, a 1.3% increase from the baseline period Drivers in serious injury crashes: Table 9-7 and Figure 9-5 show information on drivers involved in alcohol-related serious injury crashes. During the baseline period ( ), an average of 16.5% of drivers in serious injury crashes were in an alcohol-involved crash. This compares to 17.7% in 2010, resulting in a 7.3% increase in the problem. Table 9-8 and Figure 9-6 also show information on drivers involved in alcohol-related serious injury crashes. These results differ slightly from those in Section 9.3 and in Table 9-7 and Figure 9-5 above because they exclude certain vehicle types e.g., bicycles, snowmobiles, farm tractors and other non-highway vehicles. As can be seen, the incidence of alcohol-involvement in serious injury crashes has been relatively stable from 1997 until 2005 and then risen in the past three years. Between 1995 and 1996 the percentage of all drivers in serious injury crashes that involved alcohol rose only slightly from 17.7% to 18.9%. The incidence generally dropped to a low of 15.3% in 2005, rose to 18.8% in 2009, and decreased again to 18.3% in As shown in Table 9-8, in the baseline period ( ), an average of 17.1% of drivers in serious injury crashes were in an alcohol-involved crash. In 2010, the incidence of drivers in alcohol-involved crashes was 18.3% a 7.0% increase. 135
146 QUEBEC Table 9-6 Alcohol Use Among Fatally Injured Drivers*: Quebec, Number of Drivers Grouped by BAC (mg%) YEAR Drivers* Zero (% Tested) Positive (% Tested) (48.9) 298 (51.1) (47.3) 295 (52.7) (54.7) 232 (45.3) (58.9) 205 (41.1) (55.1) 201 (44.9) (55.7) 206 (44.3) (57.8) 200 (42.2) (59.0) 170 (41.0) (59.3) 162 (40.7) (71.6) 128 (28.4) (63.9) 154 (36.1) (62.5) 133 (37.5) (66.4) 141 (33.6) (55.7) 168 (44.3) (60.8) 144 (39.2) (63.6) 162 (36.4) (60.9) 167 (39.1) (68.4) 108 (31.6) (59.5) 130 (40.5) (57.0) 129 (43.0) (61.9) 102 (38.1) (62.4) 158 (37.6) baseline * numbers are estimates based on the BAC distribution of drivers tested for alcohol 136

147 QUEBEC 137
 1996 5382 1018 (18.9) 1997 5146 871 (16.9) 1998 4782 800 (16.7) 1999 4557 740 (16.2) 2000 4455 750 (16.8) 2001 4179 699 (16.7) 2002 4323 746 (17.3) 2003 4386 679 (15.5) 2004 4337 761 (17.")
148 QUEBEC Table 9-8 Number and Percent of All Drivers* in Serious Injury Crashes ** that Involved Alcohol: Quebec, Year Number of Alcohol Related Drivers Number % (17.7) (18.9) (16.9) (16.7) (16.2) (16.8) (16.7) (17.3) (15.5) (17.5) (15.3) (16.8) (17.4) (18.1) (18.8) (18.3) (17.1) baseline * excludes operators of bicycles, snowmobiles, farm tractors, and other non-highway vehicles. ** single-vehicle nighttime crashes (SVN) as well as non-svn crashes that have police-reported alcohol involvement 138
149 NEW BRUNSWICK 10.0 NEW BRUNSWICK This section of the report reviews the major findings on alcohol involvement in fatal and serious injury motor vehicle collisions in New Brunswick during It describes data on: > people who were killed in alcohol-related crashes (Section 10.1); > alcohol use among fatally injured drivers (Section 10.2); > drivers involved in alcohol-related serious injury crashes (Section 10.3); and > trends in the alcohol-crash problem (Section 10.4) DEATHS IN ALCOHOL-RELATED CRASHES Table 10-1 presents information on people who died in alcohol-related crashes in New Brunswick during Motor vehicle deaths are categorized in terms of the victim s age, gender, type (i.e., driver, passenger, pedestrian) and the type of vehicle they occupied. The first data column in the table presents the number of deaths. The next two columns show the number and percent of these fatalities in which sufficient information was available to determine if alcohol was involved. A motor vehicle fatality was considered to be alcohol involved if there was at least one drinking driver or drinking pedestrian in the fatal crash. For example, 13 people aged were killed in motor vehicle crashes in New Brunswick during And, in all 13 cases (100.0%) it was possible to determine if alcohol was a factor in the crash. The next column shows the number of people killed in crashes that were known to be alcoholinvolved. For example, seven people aged died in alcohol-related crashes in New Brunswick during The next column expresses this as a percentage i.e., 53.8% of those aged who were killed died in an alcohol-related crash. The final column (percent of all alcohol-related deaths) expresses the number of deaths in alcohol-related crashes as a percent of all the deaths in such crashes. For example, the alcohol-related deaths among those aged represent 14.6% of all the people killed in alcohol-related crashes in New Brunswick during The totals at the bottom of the table provide a summary. As can be seen, 105 persons died in motor vehicle crashes in New Brunswick during In 102 (97.1%) of these cases, it was possible to determine if alcohol was a factor. Of these known cases, 48 (47.1%) involved alcohol. Extrapolating this figure to the total number of motor vehicle fatalities (105 x.471) it can be estimated that in New Brunswick during 2010, 49 persons died in alcohol-related crashes. 139
150 NEW BRUNSWICK Victim age. Of all the people who died in alcohol-related crashes, 27.1% (see last column) were aged 36-45; 18.8% were aged 46-55; 16.7% were aged 20-25; 14.6% were aged 16-19; 10.4% were over age 55; 8.3% were aged 26-35; and 4.2% were under 16 years of age. Within each of the age groups, the highest incidence of alcohol involvement occurred in the crashes in which a person aged and died (72.2% and 57.1%, respectively). The lowest incidence of alcohol involvement was found among fatalities under 16 and over % of persons under 16 and 20.8% of the fatalities over 55 died in crashes involving alcohol. 140
151 NEW BRUNSWICK Gender. Of all the people who died in alcohol-related crashes, 72.9% were males. The incidence of alcohol in crashes in which a male died (49.3%) was greater than the incidence of alcohol in crashes in which a female died (41.9%) Victim type. Of all the people who died in alcohol-related crashes, 75.0% were drivers/operators of a vehicle; 18.8% were passengers; and 6.3% were pedestrians. Within each of the victim types, the highest incidence of alcohol involvement (51.4%) occurred in the crashes in which a driver/operator died. Alcohol was involved in 40.9% of the crashes in which a passenger died and 30.0% of those in which a pedestrian died Type of vehicle occupied. Of all the people who died in alcohol-related crashes, 50.0% were in an automobile; 20.3% were truck/van occupants; 16.7% were off-road vehicle occupants; and 6.3% were motorcyclists. Within each of these vehicle types, the incidence of alcohol involvement in which a truck/van occupant died was greater than the incidence of alcohol in crashes in which an off-road vehicle occupant died (71.4% versus 66.7%). Among automobile occupants and motorcyclists, 44.4% and 30.0% died in alcohol-related crashes, respectively ALCOHOL IN FATALLY INJURED DRIVERS This section presents information on the presence of alcohol, exclusively among drivers fatally injured in New Brunswick during Table 10-2 shows the information by age group, gender, vehicle type, and collision type (single vs. multiple). 141
152 NEW BRUNSWICK The first data column in the table shows the number of drivers killed. The next columns show the number and percent of these victims who were tested for alcohol. The remaining columns provide information on the results of the alcohol tests the first three of these present results for drivers who showed any evidence of alcohol; the last three columns present information on drivers who had BACs over the statutory limit of 80 mg%. To illustrate, among year olds there were four drivers killed during 2010; three of these fatally injured drivers (75.0%) were tested for alcohol. Of those who were tested, one (33.3%) were positive for alcohol. This means that year old fatally injured drinking drivers accounted for 3.6% of all drinking drivers who were killed. Then, in the final three columns, it can be seen that one of the three (33.3%) fatally injured year olds who were tested for alcohol had BACs in excess of 80 mg%. This means that the driver 142

153 NEW BRUNSWICK who was positive for alcohol had a BAC above the legal limit. The final column expresses the number of drivers with illegal BACs as a percent of all drivers with BACs over the limit. Thus, year old drivers accounted for 3.8% of all the drivers with BACs over the legal limit. The main findings are shown by the totals at the bottom of the table. New Brunswick had a very high testing rate in 2010, with 95.0% of fatally injured drivers being tested for alcohol use. In New Brunswick, 49.1% had been drinking and 26 of 28 (92.9%) fatally injured drinking drivers had BACs >80 mg%. Although not shown in the table, more refined analyses by different BAC categories show that among tested drivers: > 50.9% had BACs of zero mg%; > 1.8% had BACs from 1-49 mg%; > 1.8% had BACs from mg% > 31.6% had BACs from 81 to 160 mg%; and, > 14.0% had BACs over 160 mg%. In Figure 10-1, the BAC distribution for tested fatally injured drivers is extrapolated to reflect the BAC distribution for all fatally injured drivers. In this figure 29 of 60 (48.3%) fatally injured drivers have a positive BAC. And among fatally injured drinking drivers, 27 (93.1%) have BACs over 80 mg% Age differences. Of all the fatally injured drinking drivers (i.e., those with positive BAC), 42.9% were aged 36-45; 25.0% were aged 20-25; 17.9% were aged 46-55; 7.1% were over age 55; and 3.6% were aged and
154 NEW BRUNSWICK Of all the fatally injured legally impaired drivers (i.e., those with BACs over 80 mg%), 46.2% were aged 36-45; 19.2% were aged and 46-55; 7.7% were over age 55; and 3.8% were aged and Within each of the age groups, fatally injured drivers aged were the most likely to have been drinking 80.0% of drivers in this age group had been drinking. By contrast, 14.3% of the tested drivers over age 55 had been drinking Gender differences. Males dominate the picture they account for 78.6% of the fatally injured drivers who had been drinking and 76.9% of those who were legally impaired. Males dominate the picture largely because they account for most of the drivers who are killed (50 of the 60 fatalities or 83.3% are males). However, fatally injured female drivers were more likely to have been drinking than male drivers (66.7% and 45.8%, respectively). And, 100.0% of the female drivers and 90.9% of the male drivers who were drinking had BACs over the legal limit Vehicle differences. Of all the fatally injured drinking drivers (i.e., those with a positive BAC), 64.3% were automobile drivers; 25.7% were truck/van drivers; and 10.7% were motorcyclists. Of all the fatally injured legally impaired drivers (i.e., those with BACs over 80 mg%), 65.4% were automobile drivers, 26.9% were truck/van drivers; and 7.7% were motorcyclists. Within each of the vehicle types, 63.6% of fatally injured truck/van drivers, 51.4% of automobile drivers and 33.3% of motorcyclists had been drinking. Neither of the fatally injured tractor-trailer drivers had been drinking Collision differences. Two-thirds of the drivers killed (40 of the 60) were involved in single-vehicle collisions but these crashes accounted for almost all of the drivers who had been drinking or were legally impaired (89.3% and 96.2%, respectively). The reason for this apparent disparity is because alcohol is overrepresented in single-vehicle crashes. Over three-fifths of the drivers involved in single-vehicle crashes (62.5%) were positive for alcohol, compared to only 17.6% of those involved in multiple-vehicle collisions DRIVERS INVOLVED IN ALCOHOL-RELATED SERIOUS INJURY CRASHES This section presents information on drivers involved in alcohol-related crashes in which someone was seriously injured in 2010 in New Brunswick. A surrogate or indirect measure 144
155 NEW BRUNSWICK is used to estimate alcohol involvement because drivers in serious injury crashes are seldom tested for alcohol. A driver is identified as having been involved in an alcohol-related serious injury crash if the crash in which someone was seriously injured involved a single vehicle at night (SVN), or if, in the case of a non-svn serious injury crash, the police reported alcohol involvement i.e., at least one drinking driver in the crash (see Section 2.2.4). The results are shown in Table 10-3 for drivers grouped in terms of age, gender, type of vehicle driven, and type of collision. The first data column shows the number of drivers involved in serious injury crashes. The number and percent of drivers in such crashes that involved alcohol is shown in the next two columns. The final column expresses the number of drivers involved in alcohol-related serious injury crashes in any row as a percent of all drivers involved in alcohol- related serious injury crashes. As shown, by the totals at the bottom of the table, 325 drivers were involved in crashes in which someone was seriously injured, and among these 26.8% were involved in alcoholrelated crashes Driver age. Of all the drivers involved in alcohol-related serious injury crashes, 23.0% were aged 26-35, 20.7% were aged 46-55; and 14.9% were aged and Drivers aged under 16 and respectively accounted for only 0.0% and 11.5% of those involved in alcohol-related serious injury crashes. 145
156 NEW BRUNSWICK Table 10-3 Drivers in Alcohol-Related Serious Injury Crashes: New Brunswick, 2010 Category Number Alcohol-Related of of % of % of all drivers in Drivers Drivers Number total alcohol-related crashes Age < > unknown Gender Male Female Unknown Vehicle Type Auto Truck/Van Motorcycle Tractor Trailer Other Hwy. Vehicle Off-Road Collision Type Single-Vehicle Multiple-Vehicle TOTAL Within each of the age groups, two-fifths of the drivers aged were involved in alcoholrelated serious injury crashes (39.4%). The lowest incidence of involvement in alcohol-related crashes was found for those aged under 16 and over 55 (0.0% and 19.4%, respectively) Driver gender. Of all the drivers involved in alcohol-related serious injury crashes, 65.5% were males. The incidence of involvement in alcohol-related serious injury crashes was also greater for males than for females (38.7% and 16.7%, respectively) Type of vehicle driven. Of all the drivers involved in alcohol-related serious injury crashes, 56.3% were automobile drivers; 33.3% were truck/van drivers; 5.7% were motorcyclists; 2.3% were off-road vehicle drivers; and 1.1% were tractor-trailer drivers and drivers
157 NEW BRUNSWICK of other highway vehicles. The highest incidence of involvement in alcohol-related serious injury crashes was found for drivers of other highway vehicles 50.0% of these drivers were in crashes that involved alcohol, compared to 32.6% for truck/van drivers, 27.7% for automobile drivers, 15.2% for motorcyclists, and 12.5% for tractor-trailer drivers and off-road vehicle drivers Type of collision. Of all the drivers involved in alcohol-related serious injury crashes, 77.0% of them were in single-vehicle crashes. The highest incidence of involvement in alcohol-related serious injury crashes was also found among drivers in single-vehicle crashes 49.3% of these drivers, compared to only 10.6% for drivers involved in multiple-vehicle crashes TRENDS IN THE ALCOHOL-CRASH PROBLEM The previous sections examined three indicators of the alcohol-crash problem: the number and percent of people who died in crashes that involved alcohol; the number and percent of fatally injured drivers who had been drinking; and the number and percent of drivers in serious injury crashes that involved alcohol. This section examines changes in these three indicators of the problem. New Brunswick s progress in meeting the STRID 2010 objective of a 40% reduction in the alcohol-crash problem by 2010 is also reported by comparing findings in 2010 with those from the baseline period Deaths in alcohol-related crashes: Table 10-4 and Figure 10-2 show the number and percent of people who died in crashes involving a drinking driver from 1995 to These results differ slightly from those in Section 10.1 for two reasons. First, deaths that occur in crashes that involve a drinking pedestrian are not necessarily classified as alcoholrelated deaths. The focus here is more restrictive, on deaths that occur in crashes involving at least one drinking driver. Second, the trend analyses focus on fatal crashes on public roadways involving principal vehicle types (where at least one of the vehicles involved is an automobile, truck/van, motorcycle or other highway vehicle). The previous analyses included all types of motorized vehicles (e.g., snowmobiles) on both public roadways and in off-road locations. 147
158 148 NEW BRUNSWICK
159 NEW BRUNSWICK As shown in the figure, the number of deaths in crashes that involved a drinking driver generally dropped from 42 in 1995 to a low of 25 in 2004, rose to 36 in 2005, decreased to 30 in 2006, rose to 35 in 2007, decreased to 26 in 2009, and rose again to 40 in The percentage of alcoholrelated fatalities generally decreased from 37.5% in 1995 to its lowest level in 2000 (27.4%), fluctuated until 2006, peaked at 38.9% in 2007, decreased to 35.1% in 2008, and rose in 2010 (41.2%). As shown at the bottom of the table, during the baseline period there was an average of 32 fatalities involving a drinking driver and they accounted for 32.0% of all fatalities. This means that the percent of fatalities involving a drinking driver increased by 28.8% from 32.0% in the baseline period ( ) to 41.2% in Also, in terms of the number of persons killed in crashes involving a drinking driver, there has been a 25.0% increase from an average of 32 in the baseline period ( ) to 40 in Fatally injured drivers: Data on alcohol use among fatally injured drivers over the 24-year period from are shown in Table Trends are illustrated in Figure 10-3 which shows changes in the percent of fatally injured drivers who: (1) showed no evidence of alcohol (represented by the white area); (2) had BACs below the legal limit (shown by the light grey area); and (3) had BACs over the legal limit (the dark grey area). The data reported here are restricted to drivers who died in less than six hours after the crash. As can be seen, since 1987 the percent of fatally injured drivers with BACs over the legal limit fluctuated, peaking in 1993 (56.0%), declining to its lowest mark in 2005 (27.5%), rising to 41.2% in 2008, declining in 2009 (35.9%), and rising again to 2010 (42.0%). The percent of fatally injured drivers with zero BACs increased from 1987 (46.8%) to 1990 (64.9%), declined in 1993 (36.0%), gradually increased to its highest mark in 2000 and 2005 (66.7%), declined in 2007 (51.1%), rose in 2009 (59.0%), and declined again in 2010 (54.0%). The percent of fatally injured drivers with BACs between 1 and 80 mg% declined until 1990 (0.0%), fluctuated until 2006 (3.8%), rose to its highest level in 2007 (11.1%), and decreased again in 2010 (4.0%). 149

160 150 NEW BRUNSWICK
161 NEW BRUNSWICK When compared to the baseline period shown at the bottom of Table 10-5, the percentage of fatally injured drivers with zero BACs in 2010 decreased by 6.6% (from 57.8% to 54.0%). Among drivers with BACs from 1-80 mg%, there was a 40.3% decrease (from 6.7% to 4.0%). And among drivers with BACs over 80 mg%, there was an 18.0% increase (from 35.6% to 42.0%). Table 10-6 and Figure 10-4 show data on alcohol use among fatally injured drivers over a shorter period from These results also differ from those reported above for several reasons. First, the number of drivers is extrapolated to reflect the BAC distribution of drivers tested for alcohol (see Figure 10-1). Second, estimates are based on all fatally injured drivers, not just those who died in less than six hours from the crash. Third, drivers are grouped in only two BAC categories: zero and positive. As can be seen in Table 10-6, the baseline percentage of fatally injured drivers testing positive for alcohol from is 42.1%. In 2010, 48.3% of fatally injured drivers tested positive for alcohol, a 14.7% increase from the baseline period Drivers in serious injury crashes: Table 10-7 and Figure 10-5 show information on drivers involved in alcohol-related serious injury crashes. During the baseline period ( ), an average of 23.5% of drivers in serious injury crashes were in an alcohol-involved crash. This compares to 26.8% in 2010, a 14.0% increase. Table 10-8 and Figure 10-6 also show information on drivers involved in alcohol-related serious injury crashes. These results differ slightly from those in Section 10.3 and in Table 10-7 and Figure 10-5 because they exclude certain vehicle types e.g., bicycles, snowmobiles, farm tractors and other non-highway vehicles. As can be seen, the incidence of alcohol-involvement in serious injury crashes has fluctuated over this 16-year period. Between 1995 and 1997 the percentage of all drivers in serious injury crashes that involved alcohol dropped from 29.2% to 21.0%. Since then, the incidence fluctuated until 2007 (26.0%), declined slightly to 25.6% in 2009, and rose again in 2010 (27.5%). In the baseline period ( ), an average of 23.7% of drivers in serious injury crashes were in an alcohol-involved crash. In 2010, the incidence of drivers in alcohol-involved crashes increased to 27.5% a 16.0% increase. 151
162 152 NEW BRUNSWICK

163 NEW BRUNSWICK 153

164 154 NEW BRUNSWICK
165 NOVA SCOTIA 11.0 NOVA SCOTIA This section of the report reviews the major findings on alcohol involvement in fatal and serious injury motor vehicle collisions in Nova Scotia during It describes data on: > people who were killed in alcohol-related crashes (Section 11.1); > alcohol use among fatally injured drivers (Section 11.2); > drivers involved in alcohol-related serious injury crashes (Section 11.3); and > trends in the alcohol-crash problem (Section 11.4) DEATHS IN ALCOHOL-RELATED CRASHES Table 11-1 presents information on people who died in alcohol-related crashes in Nova Scotia during Motor vehicle deaths are categorized in terms of the victim s age, gender, type (i.e., driver, passenger, pedestrian) and the type of vehicle they occupied. The first data column in the table presents the number of deaths. The next two columns show the number and percent of these fatalities in which sufficient information was available to determine if alcohol was involved. A motor vehicle fatality was considered to be alcohol involved if there was at least one drinking driver or drinking pedestrian in the fatal crash. For example, 11 people aged were killed in motor vehicle crashes in Nova Scotia during And, in all 11 cases (100.0%) it was possible to determine if alcohol was a factor in the crash. The next column shows the number of people killed in crashes that were known to be alcoholinvolved. For example, two people aged died in alcohol-related crashes in Nova Scotia during The next column expresses this as a percentage i.e., 18.2% of those aged who were killed died in an alcohol-related crash. The final column (percent of all alcohol-related deaths) expresses the number of deaths in alcohol-related crashes as a percent of all the deaths in such crashes. For example, the alcohol-related deaths among those aged represent 8.3% of all the people killed in alcohol-related crashes in Nova Scotia during The totals at the bottom of the table provide a summary. As can be seen, 74 persons died in motor vehicle crashes in Nova Scotia during In 73 (98.6%) of these cases, it was possible to determine if alcohol was a factor. Of these known cases, 24 (32.9%) involved alcohol. Extrapolating this figure to the total number of motor vehicle fatalities (74 x.329) it can be estimated that in Nova Scotia during 2010, 24 persons died in alcohol-related crashes. 155
166 NOVA SCOTIA Victim age. Of all the people who died in alcohol-related crashes, 25.0% (see last column) were aged and 26-35; 16.7% were aged 36-45; 12.5% were aged and over 55; and 8.3% were aged Within each of the age groups, the highest incidence of alcohol involvement occurred in the crashes in which a person aged died (75.0%). The lowest incidence of alcohol involvement was found among the youngest and oldest fatalities 0.0% of persons under 16 years of age and 16.7% of the fatalities over 55 years of age died in crashes involving alcohol Gender. Of all the people who died in alcohol-related crashes, 95.8% were males. The incidence of alcohol in crashes in which a male died (44.2%) was greater than the incidence of alcohol in crashes in which a female died (4.8%). 156
167 NOVA SCOTIA Victim type. Of all the people who died in alcohol-related crashes, 70.8% were drivers/operators of a vehicle; 16.7% were pedestrians; and 12.5% were passengers. Within each of the victim types, the highest incidence of alcohol involvement (57.1%) occurred in the crashes in which a pedestrian died. Alcohol was involved in 35.4% of the crashes in which a driver/operator died and 16.7% of those in which a passenger died Type of vehicle occupied. Of all the people who died in alcohol-related crashes, 50.0% were in an automobile; 16.7% were truck/van occupants; and 8.3% were motorcyclists and off-road vehicle occupants. Within each of these vehicle types, the incidence of alcohol involvement in which a truck/van occupant died was greater than the incidence of alcohol in crashes in which an automobile occupant died (57.1% versus 28.6%). The number of fatalities in each of the other types of vehicles is too small to produce reliable estimates of alcohol-involvement ALCOHOL IN FATALLY INJURED DRIVERS This section presents information on the presence of alcohol, exclusively among drivers fatally injured in Nova Scotia during Table 11-2 shows the information by age group, gender, vehicle type, and collision type (single vs. multiple). 157
168 NOVA SCOTIA The first data column in the table shows the number of drivers killed. The next columns show the number and percent of these victims who were tested for alcohol. The remaining columns provide information on the results of the alcohol tests the first three of these present results for drivers who showed any evidence of alcohol; the last three columns present information on drivers who had BACs over the statutory limit of 80 mg%. To illustrate, among year olds there were three drivers killed during 2010; all three of these fatally injured drivers (100.0%) were tested for alcohol. Of those who were tested, one (33.3%) was positive for alcohol. This means that year old fatally injured drinking drivers accounted for 7.1% of all drinking drivers who were killed. Then, in the final three columns, it can be seen that one of the three (33.3%) fatally injured year olds who were tested for alcohol had BACs in excess of 80 mg%. The final column expresses the number of drivers with illegal BACs as a percent of all drivers with BACs over the 158
169 NOVA SCOTIA limit. Thus, year old drivers accounted for 9.1% of all the drivers with BACs over the legal limit. The main findings are shown by the totals at the bottom of the table. Nova Scotia had a very high testing rate in 2010, with 100.0% of fatally injured drivers being tested for alcohol use. In Nova Scotia, 34.1% had been drinking and 11 of 14 (78.6%) fatally injured drinking drivers had BACs >80 mg%. Although not shown in the table, more refined analyses by different BAC categories show that among tested drivers: > 65.9% had BACs of zero mg% > 4.9% had BACs from 1-49 mg%; > 2.4% had BACs from mg% > 12.2% had BACs from 81 to 160 mg%; and, > 14.6% had BACs over 160 mg%. The BAC distribution for fatally injured drivers is shown in Figure In this figure 14 of 41 (34.1%) fatally injured drivers have a positive BAC. And among fatally injured drinking drivers, 11 (78.6%) have BACs over 80 mg% Age differences. Of all the fatally injured drinking drivers (i.e., those with a positive BAC), 35.7% were aged 20-25; 28.6% were aged 26-35; and 14.3% were aged and Of all the fatally injured legally impaired drivers (i.e., those with BACs over 80 mg%), 36.4% were aged 20-25; 27.3% were aged 26-35; 18.2% were aged 36-45; and 9.1% were aged and Within each of the age groups, fatally injured drivers age were the most likely to have 159
170 NOVA SCOTIA been drinking 66.7% of drivers in this age group had been drinking. By contrast, none of the tested drivers over age 55 had been drinking Gender differences. Males dominate the picture they account for 100.0% of all of the fatally injured drivers who had been drinking and who were legally impaired. Males dominate the picture largely because they account for most of the drivers who are killed (31 of the 41 fatalities or 75.6% are males). Fatally injured male drivers were more likely to have been drinking than female drivers (45.2% and 0.0%, respectively). And, 78.6% of the male drivers who were drinking had BACs over the legal limit Vehicle differences. Of all the fatally injured drinking drivers (i.e., those with a positive BAC), 71.4% were automobile drivers and 14.3% were truck/van drivers and motorcyclists. Of all the fatally injured legally impaired drivers (i.e., those with BACs over 80 mg%), 81.8% were automobile drivers and 18.2% were truck/van drivers. Within each of the vehicle types, 40.0% of fatally injured truck/van drivers, 37.0% of automobile drivers, and 22.2% of motorcyclists were found to have been drinking Collision differences. Less than half of the drivers killed (18 of the 41) were involved in single-vehicle collisions but these crashes accounted for 92.9% of the drivers who had been drinking and 100.0% of the drivers who were legally impaired. The reason for this apparent disparity is because alcohol is overrepresented in single-vehicle crashes. Almost three-quarters of the drivers involved in single-vehicle crashes (72.2%) were positive for alcohol, compared to 4.3% of those involved in multiple-vehicle collisions DRIVERS INVOLVED IN ALCOHOL-RELATED SERIOUS INJURY CRASHES This section presents information on drivers involved in alcohol-related crashes in which someone was seriously injured in Nova Scotia. A surrogate or indirect measure is used to estimate alcohol involvement because drivers in serious injury crashes are seldom tested for alcohol. A driver is identified as having been involved in an alcohol-related serious injury crash if the crash in which someone was seriously injured involved a single vehicle at night (SVN), or if, in the case of a non-svn serious injury crash, the police reported alcohol involvement i.e., at least one drinking driver in the crash (see Section 2.2.4). The results are shown in Table 11-3 for drivers grouped in terms of age, gender, type of 160
171 NOVA SCOTIA vehicle driven, and type of collision. The first data column shows the number of drivers involved in serious injury crashes. The number and percent of drivers in such crashes that involved alcohol is shown in the next two columns. The final column expresses the number of drivers involved in alcohol-related serious injury crashes in any row as a percent of all drivers involved in alcohol- related serious injury crashes. As shown, by the totals at the bottom of the table, 317 drivers were involved in crashes in which someone was seriously injured, and among these 25.9% were alcohol-related crashes Driver age. Of all the drivers involved in alcohol-related serious injury crashes, 23.2% were aged 26-35; 18.3% were aged and over 55; 14.6% were aged 36-45; 11.0% were aged 46-55; and 9.8% were aged
172 NOVA SCOTIA Within each of the age groups, over two-fifths of the drivers aged were involved in alcohol-related serious injury crashes (44.2%). The lowest incidence of involvement in alcoholrelated crashes was found for those under 16 and aged (0.0 and 18.0%, respectively) Driver gender. Of all the drivers involved in alcohol-related serious injury crashes, 70.7% were males. The incidence of involvement in alcohol-related serious injury crashes was greater for males than for females (27.8% and 19.6%, respectively) Type of vehicle driven. Of all the drivers involved in alcohol-related serious injury crashes, 54.9% were automobile drivers and 32.9% were truck/van drivers. 162
173 NOVA SCOTIA The highest incidence of involvement in alcohol-related serious injury crashes was found for drivers of off-road vehicles 50.0% of these drivers were in crashes that involved alcohol, compared to 31.0% for truck/van drivers; 26.5% for automobile drivers; and 20.0% for off-road vehicle drivers. Among motorcyclists, 11.8% were involved in alcohol-related crashes Type of collision. Of all the drivers involved in alcohol-related serious injury crashes, 67.1% of them were in single-vehicle crashes. The highest incidence of involvement in alcohol-related serious injury crashes was also found among drivers in single-vehicle crashes 41.0% of these drivers, compared to only 14.8% for drivers involved in multiple-vehicle crashes TRENDS IN THE ALCOHOL-CRASH PROBLEM The previous sections examined three indicators of the alcohol-crash problem: the number and percent of people who died in crashes that involved alcohol; the number and percent of fatally injured drivers who had been drinking; and the number and percent of drivers in serious injury crashes that involved alcohol. This section examines changes in these three indicators of the problem. Nova Scotia s progress in meeting the STRID 2010 objective of a 40% reduction in the alcohol-crash problem by 2010 is also reported by comparing findings in 2010 with those from baseline period Deaths in alcohol-related crashes: Table 11-4 and Figure 11-2 show the number and percent of people who died in crashes involving a drinking driver from 1995 to These results differ slightly from those in Section 11.1 for two reasons. First, deaths that occur in crashes that involve a drinking pedestrian are not necessarily classified as alcoholrelated deaths. The focus here is more restrictive, on deaths that occur in crashes involving at least one drinking driver. Second, the trend analyses focus on fatal crashes on public roadways involving principal vehicle types (where at least one of the vehicles involved is an automobile, truck/van, motorcycle or other highway vehicle). The previous analyses included all types of motorized vehicles (e.g., snowmobiles) on both public roadways and in off-road locations. 163
174 164 NOVA SCOTIA
175 NOVA SCOTIA As shown in the figure, the number of deaths in crashes that involved a drinking driver dropped from 56 to 22 between 1995 and There was an increase to 35 alcohol-related fatalities in 2007, a decrease to a low of 17 in 2008, an increase to 25 in 2009, and another decrease to 18 in The percentage of alcohol-related fatalities generally decreased from 50.9% in 1995 to 24.4% in 2004, rose to 35.7% in 2006, fell to a low of 21.3% in 2008, increased to 36.8% in 2009, and decreased again to 26.9% in As shown at the bottom of the table, during the baseline period there was an average of 33 fatalities involving a drinking driver and they accounted for 36.7% of all fatalities. This means that the percent of fatalities involving a drinking driver decreased by 26.7% from 36.7% in the baseline period ( ) to 26.9% in And, in terms of the number of persons killed in crashes involving a drinking driver, there has been a 45.5% decrease from an average of 33 in the baseline period ( ) to 18 in Fatally injured drivers: Data on alcohol use among fatally injured drivers over the 24-year period from are shown in Table Trends are illustrated in Figure 11-3 which shows changes in the percent of fatally injured drivers who: (1) showed no evidence of alcohol (represented by the white area); (2) had BACs below the legal limit (shown by the light grey area); and (3) had BACs over the legal limit (the dark grey area). The data reported here are restricted to drivers who died in less than six hours after the crash. As can be seen, the percent of fatally injured drivers with BACs over the legal limit peaked in 1989 (53.5%), fluctuated until 2003 (37.2%), fell in 2004 (18.9%), rose in 2005 (41.0%), decreased to a low in 2008 (18.4%), rose to 39.5% in 2009, and decreased again in 2010 (25.0%). The percent of fatally injured drivers with zero BACs dropped to its lowest point in 1989 (35.6%) fluctuated until 2005 (53.8%), rose in 2006 (70.3%), decreased in 2007 (62.8%), peaked in 2008 (77.6%), decreased in 2009 (58.1%), and rose again in 2010 (67.5%). The percent of fatally injured drivers with BACs between 1 and 80 mg% dropped to its lowest mark in 1993 and 2000 (0.0%), peaked at 20.0% in 2002, fell to 2.3% in 2003, increased in 2004 (5.4%), decreased in 2006 (2.7%), rose in 2007 (9.3%), decreased in 2009 (2.3%), and rose again in 2010 (7.5%). 165

176 166 NOVA SCOTIA
177 NOVA SCOTIA When compared to the baseline period shown at the bottom of Table 11-5, the percentage of fatally injured drivers with zero BACs in 2010 increased by 28.3% (from 52.6% to 67.5%). Among drivers with BACs from 1-80 mg%, there was a 41.5% increase (from 5.3% to 7.5%). And among drivers with BACs over 80 mg%, there was a 40.6% decrease (from 42.1% to 25.0%). Table 11-6 and Figure 11-4 show data on alcohol use among fatally injured drivers over a shorter period from These results also differ from those reported above for several reasons. First, the number of drivers is extrapolated to reflect the BAC distribution of drivers tested for alcohol (see Figure 11-1). Second, estimates are based on all fatally injured drivers, not just those who died in less than six hours from the crash. Third, drivers are grouped in only two BAC categories: zero and positive. As can be seen in Table 11-6, the baseline percentage of fatally injured drivers testing positive for alcohol from is 46.3%. In 2010, 34.1% of fatally injured drivers tested positive for alcohol, a 26.3% decrease from the baseline period Drivers in serious injury crashes: Table 11-7 and Figure 11-5 show information on drivers involved in alcohol-related serious injury crashes. During the baseline period ( ), an average of 22.0% of drivers in serious injury crashes were in an alcoholinvolved crash. This compares to 25.9% in 2010, a 17.7% increase in the problem. Table 11-8 and Figure 11-6 also show information on drivers involved in alcohol-related serious injury crashes. These results differ slightly from those in Section 11.3 and in Table 11-7 and Figure 11-5 because they exclude certain vehicle types e.g., bicycles, snowmobiles, farm tractors and other non-highway vehicles. As can be seen, the incidence of alcohol-involvement in serious injury crashes has fluctuated over this 16-year period. Between 1995 and 1996 the percentage of all drivers in serious injury crashes that involved alcohol rose from 18.5% to 24.9%. Since then, the incidence has fluctuated until 2005 (26.1%), declined to 24.9% in 2006, peaked in 2007 (26.2%), decreased in 2008 (20.0%), and rose again in 2010 (25.8%). In the baseline period ( ), an average of 22.6% of drivers in serious injury crashes were in an alcohol-involved crash. In 2010, the incidence of drivers in alcohol-involved crashes rose to 25.8%, a 14.2% increase. 167
178 168 NOVA SCOTIA

179 NOVA SCOTIA 169
180 NOVA SCOTIA Table 11-8 Number and Percent of All Drivers* in Serious Injury Crashes** that Involved Alcohol: Nova Scotia, Year Number of Alcohol Related Drivers Number % (18.5) (24.9) (22.3) (20.4) (21.7) (23.6) (23.3) (21.1) (23.5) (23.1) (26.1) (24.9) (26.2) (20.0) (22.0) (25.8) (22.6) baseline * excludes operators of bicycles, snowmobiles, farm tractors, and other non-highway vehicles. ** single-vehicle nighttime crashes (SVN) as well as non-svn crashes that have police-reported alcohol involvement 170
181 PRINCE EDWARD ISLAND 12.0 PRINCE EDWARD ISLAND This section of the report reviews the major findings on alcohol involvement in fatal and serious injury motor vehicle collisions in Prince Edward Island during It describes data on: > people who were killed in alcohol-related crashes (Section 12.1); > alcohol use among fatally injured drivers (Section 12.2); > drivers involved in alcohol-related serious injury crashes (Section 12.3); and > trends in the alcohol-crash problem (Section 12.4) DEATHS IN ALCOHOL-RELATED CRASHES Table 12-1 presents information on people who died in alcohol-related crashes in Prince Edward Island during Motor vehicle deaths are categorized in terms of the victim s age, gender, type (i.e., driver, passenger, pedestrian) and the type of vehicle they occupied. The first data column in the table presents the number of deaths. The next two columns show the number and percent of these fatalities in which sufficient information was available to determine if alcohol was involved. A motor vehicle fatality was considered to be alcohol involved if there was at least one drinking driver or drinking pedestrian in the fatal crash. For example, two people aged were killed in motor vehicle crashes in Prince Edward Island during And, in both cases (100.0%) it was possible to determine if alcohol was a factor in the crash. The next column shows the number of people killed in crashes that were known to be alcoholinvolved. For example, one person aged died in alcohol-related crashes in Prince Edward Island during The next column expresses this as a percentage i.e., 50.0% of the year olds who were killed died in an alcohol-related crash. The final column (percent of all alcohol-related deaths) expresses the number of deaths in alcohol-related crashes as a percent of all the deaths in such crashes. For example, the alcohol-related deaths among year olds represent 100.0% of all the people killed in alcohol-related crashes in Prince Edward Island during The totals at the bottom of the table provide a summary. As can be seen, 12 persons died in motor vehicle crashes in Prince Edward Island during In all 12 (100.0%) of these cases, it was possible to determine if alcohol was a factor. Of these known cases, one (8.3%) involved alcohol Victim age. Persons aged and have been regrouped to ensure that individuals cannot be identified. Of all the people who died in alcohol-related crashes, 100.0% 171
182 PRINCE EDWARD ISLAND (see last column) were aged Within each of the age groups, the highest incidence of alcohol involvement occurred in the crashes in which a person aged died (25.0%). The lowest incidence of alcohol involvement was found among the persons aged under 16, 16-19, 20-25, and over % of persons in these age groups died in crashes involving alcohol Gender. Of all the people who died in alcohol-related crashes, 100.0% were males. The incidence of alcohol in crashes in which a male died was 11.1% Victim type. Of all the people who died in alcohol-related crashes, 100.0% were drivers/operators. Within each of the principal victim types, the highest incidence of alcohol involvement (11.1%) 172
183 PRINCE EDWARD ISLAND occurred in the crashes in which a driver/operator died. Alcohol was involved in 0.0% of the crashes in which a passenger or pedestrian died Type of vehicle occupied. Of all the people who died in alcohol-related crashes, 100.0% were motorcyclists. Within each of these vehicle types, the incidence of alcohol involvement in which a motorcyclist died was greater than the incidence of alcohol in crashes in which an automobile occupant or truck/van vehicle occupant died (33.3% versus 0.0% and 0.0%) ALCOHOL IN FATALLY INJURED DRIVERS This section presents information on the presence of alcohol, exclusively among drivers fatally injured in Prince Edward Island during Table 12-2 shows the information by age group, gender, vehicle type, and collision type (single vs. multiple). The first data column in the table shows the number of drivers killed. The next columns show the number and percent of these victims who were tested for alcohol. The remaining columns provide information on the results of the alcohol tests the first three of these present results for drivers who showed any evidence of alcohol; the last three columns present information on drivers who had BACs over the statutory limit of 80 mg%. 173
184 PRINCE EDWARD ISLAND To illustrate, among year olds there were three drivers killed during 2010; all of these fatally injured drivers (100.0%) were tested for alcohol. Of those who were tested, one (33.3%) was positive for alcohol. This means that fatally injured drinking drivers aged accounted for 100.0% of all drinking drivers who were killed. Then, in the final three columns, it can be seen that none (0.0%) of the fatally injured drivers aged years of age who were tested for alcohol had BACs in excess of 80 mg%. This means that the driver who was positive for alcohol did not have a BAC in excess of the legal limit. The final column expresses the number of drivers with illegal BACs as a percent of all drivers with BACs over the limit. As can be seen, drivers aged accounted for 0.0% of all the drivers with BACs over the legal limit. 174 The main findings are shown by the totals at the bottom of the table. Prince Edward Island had a very high testing rate in 2010, with 100.0% of fatally injured drivers being tested for alcohol use.
185 PRINCE EDWARD ISLAND In Prince Edward Island, 16.7% had been drinking and none (0.0%) of the fatally injured drinking drivers had BACs >80 mg%. Although not shown in the table, more refined analyses by different BAC categories show that among tested drivers: > 83.3% had BACs of zero mg%; and, > 16.7% had BACs from 1-49 mg%. The BAC distribution for fatally injured drivers is shown in Figure As can be seen, one of six (16.7%) fatally injured drivers has a positive BAC. And among fatally injured drinking drivers, one (100.0%) has a BAC from 1-80 mg% Age differences. Of all the fatally injured drinking drivers (i.e., those with a positive BAC), 100.0% were aged (a regrouping of and year olds so that an individual driver cannot be identified); and 0.0% were aged 16-19, and over age 55. Of all the fatally injured legally impaired drivers (i.e., those with BACs over 80 mg%), 100.0% were aged Within each of the age groups, fatally injured drivers aged were the most likely to have been drinking 33.3% of drivers in this age group had been drinking. By contrast, none (0.0%) of the drivers aged 16-19, and over 55 had been drinking Gender differences. Males dominate the picture they account for 100.0% of all the fatally injured drivers who had been drinking. Males dominate the picture largely because they account for most of the drivers who are killed (five of the six fatalities or 83.3% are males). Fatally injured male drivers were more likely to have 175
186 PRINCE EDWARD ISLAND been drinking than female drivers (20.0% and 0.0%, respectively). And, the male driver who was drinking did not have a BAC over the legal limit Vehicle differences. Of all the fatally injured drinking drivers (i.e., those with a positive BAC), 100.0% were motorcyclists. There were no fatally injured legally impaired drivers (i.e., those with BACs over 80 mg%) among drivers of any vehicle type. Within each of the vehicle types, 50.0% of fatally injured motorcyclists had been drinking. None of the fatally injured automobile drivers or truck/van drivers had been drinking Collision differences. All six of the drivers killed (100.0%) were involved in multiple-vehicle collisions. Among these drivers, one (16.7%) was positive for alcohol DRIVERS INVOLVED IN ALCOHOL-RELATED SERIOUS INJURY CRASHES This section presents information on drivers involved in alcohol-related crashes in which someone was seriously injured in 2010 in Prince Edward Island. A surrogate or indirect measure is used to estimate alcohol involvement because drivers in serious injury crashes are seldom tested for alcohol. A driver is identified as having been involved in an alcohol-related serious injury crash if the crash in which someone was seriously injured involved a single vehicle at night (SVN), or if, in the case of a non-svn serious injury crash, the police reported alcohol involvement i.e., at least one drinking driver in the crash (see Section 2.2.4). The results are shown in Table 12-3 for drivers grouped in terms of age, gender, type of vehicle driven, and type of collision. The first data column shows the number of drivers involved in serious injury crashes. The number and percent of drivers in such crashes that involved alcohol is shown in the next two columns. The final column expresses the number of drivers involved in alcohol-related serious injury crashes in any row as a percent of all drivers involved in alcohol-related serious injury crashes. As shown, by the totals at the bottom of the table, 66 drivers were involved in crashes in which someone was seriously injured, and among these 19.7% were alcohol-related crashes Driver age. Of all the drivers involved in alcohol-related serious injury crashes, 30.8% were aged and 36-45, 15.4% were over age 55; and 7.7% were aged 16-19, and
187 PRINCE EDWARD ISLAND Within each of the age groups, over two-fifths of the drivers aged were involved in alcohol-related serious injury crashes (40.0%). The lowest incidence of involvement in alcoholrelated crashes was found for those aged (9.1%) Driver gender. Of all the drivers involved in alcohol-related serious injury crashes, 84.6% were males. The incidence of involvement in alcohol-related serious injury crashes was also greater for males than for females (26.2% and 8.3%, respectively) Type of vehicle driven. Of all the drivers involved in alcohol-related serious injury crashes, 53.8% were automobile drivers; 30.8% were truck/van drivers; and 15.4% were drivers of other highway vehicles. The highest incidence of involvement in alcohol-related serious injury crashes was found for 177
188 PRINCE EDWARD ISLAND truck/van drivers 28.6% of these drivers were in crashes that involved alcohol, compared to 25.0% for other highway vehicle drivers and 16.7% for automobile drivers. Among motorcyclists, none (0.0%) were involved in alcohol-related crashes Type of collision. Of all the drivers involved in alcohol-related serious injury crashes, 84.6% of them were in single-vehicle crashes. The highest incidence of involvement in alcohol-related serious injury crashes was also found among drivers in single-vehicle crashes 42.3% of these drivers, compared to only 5.0% for drivers involved in multiple-vehicle crashes TRENDS IN THE ALCOHOL-CRASH PROBLEM The previous sections examined three indicators of the alcohol-crash problem: the number and percent of people who died in crashes that involved alcohol; the number and percent of fatally injured drivers who had been drinking; and the number and percent of drivers in serious injury crashes that involved alcohol. This section examines changes in these three indicators of the problem. Prince Edward Island s progress in meeting the STRID 2010 objective of a 40% reduction in the alcohol-crash problem is also reported by comparing findings in 2010 with those from the baseline period Deaths in alcohol-related crashes: Table 12-4 and Figure 12-2 show the number and percent of people who died in crashes involving a drinking driver from 1995 to These results differ slightly from those in Section 12.1 for two reasons. First, deaths that occur in crashes that involve a drinking pedestrian are not necessarily classified as alcoholrelated deaths. The focus here is more restrictive, on deaths that occur in crashes involving at least one drinking driver. Second, the trend analyses focus on fatal crashes on public roadways involving principal vehicle types (where at least one of the vehicles involved is an automobile, truck/van, motorcycle or other highway vehicle). The previous analyses included all types of motorized vehicles (e.g., snowmobiles) on both public roadways and in off-road locations. 178
189 PRINCE EDWARD ISLAND 179
190 PRINCE EDWARD ISLAND As shown in the figure, the number of deaths in crashes that involved a drinking driver generally dropped from nine to three between 1995 and There was a fluctuation between 2002 and 2005, an increase to a high of 14 in 2006, a decrease to four in 2007, an increase to nine in 2008, and a decrease to a low of one in The percentage of alcohol-related fatalities generally decreased from 56.3% in 1995 to 14.3% in Since then, the percentage of alcohol-related fatalities in Prince Edward Island rose to 56.3% in 2003, decreased to 20.0% in 2005, rose to 51.9% in 2006, and fell to a low of 11.1% in As shown at the bottom of the table, during the baseline period, there was an average of five fatalities involving a drinking driver and they accounted for 26.3% of all fatalities. Thus, it can be seen that the percent of fatalities involving a drinking driver decreased by 58.8% from 26.3% in the baseline period ( ) to 11.1% in And, in terms of the number of persons killed in crashes involving a drinking driver, there has been an 80.0% decrease from an average of five in the baseline period ( ) to one in Fatally injured drivers: Data on alcohol use among fatally injured drivers over the 24-year period from are shown in Table Trends are illustrated in Figure 12-3 which shows changes in the percent of fatally injured drivers who: (1) showed no evidence of alcohol (represented by the white area); (2) had BACs below the legal limit (shown by the light grey area); and (3) had BACs over the legal limit (the dark grey area). The data reported here are restricted to drivers who died in less than six hours after the crash. As can be seen, the percent of fatally injured drivers with BACs over the legal limit generally declined from 1987 (60.0%) to its lowest level in 1997 (11.1%), generally increased until 2005 (42.9%), decreased in 2006 (27.3%), rose in 2007 and decreased again in 2010 (0.0%). The percent of fatally injured drivers with zero BACs generally increased from 1987 (40.0%) to its highest level in 1998 (87.5%), stabilized until 2006 (72.7%), dropped to its lowest point in 2007 and 2008 (33.3%), and rose again in 2010 (83.3%). The percent of fatally injured drivers with BACs between 1 and 80 mg% peaked in 1990 (33.3%), fell to its lowest mark from 1998 to 2002 (0.0%), increased in 2003 (14.3%), returned to a low of 0.0% from 2005 to 2009, and increased again in 2010 (16.7%). 180

191 PRINCE EDWARD ISLAND 181
192 PRINCE EDWARD ISLAND When compared to the baseline period, the percentage of fatally injured drivers with zero BACs in 2010 increased by 24.9% (from 66.7% to 83.3%). Among drivers with BACs from 1-80 mg%, there was a 50.5% increase from 11.1% to 16.7%. Among drivers with BACs over 80 mg%, there was a decrease from 22.2% to 0.0%. Table 12-6 and Figure 12-4 show data on alcohol use among fatally injured drivers over a shorter period from These results also differ from those reported above for several reasons. First, the number of drivers is extrapolated to reflect the BAC distribution of drivers tested for alcohol (see Figure 12-1). Second, estimates are based on all fatally injured drivers, not just those who died in less than six hours from the crash. Third, drivers are grouped in only two BAC categories: zero and positive. As can be seen in Table 12-6, the baseline percentage of fatally injured drivers testing positive for alcohol from is 27.3%. In 2010, 16.7% of fatally injured drivers tested positive for alcohol, a 38.8% decrease from the baseline period Drivers in serious injury crashes: Table 12-7 and Figure 12-5 show information on drivers involved in alcohol-related serious injury crashes. As shown in Table 12-7, during the baseline period ( ), an average of 23.4% of drivers in serious injury crashes were in an alcohol-involved crash. This compares to 19.7% in 2010, a 15.8% decrease in the problem. Table 12-8 and Figure 12-6 also show information on drivers involved in alcohol-related serious injury crashes. These results differ slightly from those in Section 12.3 and in Table 12-7 and Figure 12-5 above because they exclude certain vehicle types e.g., bicycles, snowmobiles, farm tractors, and other non-highway vehicles. As can be seen, the incidence of alcohol-involvement in serious injury crashes has fluctuated over this 16-year period. Between 1995 and 1996 the percentage of drivers in serious injury crashes that involved alcohol rose from 15.1% to 29.7%. Since then, the incidence fluctuated until 2003, rose to 29.3% in 2004, declined to 22.1% in 2007, rose slightly to 31.0% in 2009, and decreased to 19.7% in As shown Table 12-8, in the baseline period ( ) an average of 23.8% of drivers in serious injury crashes were in an alcohol-involved crash. In 2010, the incidence of drivers in alcohol-involved crashes declined to 19.7%, a 17.2% decrease. 182
193 PRINCE EDWARD ISLAND 183

194 184 PRINCE EDWARD ISLAND

195 PRINCE EDWARD ISLAND 185
196
197 NEWFOUNDLAND AND LABRADOR 13.0 NEWFOUNDLAND AND LABRADOR This section of the report reviews the major findings on alcohol involvement in fatal and serious injury motor vehicle collisions in Newfoundland and Labrador during It describes data on: > people who were killed in alcohol-related crashes (Section 13.1); > alcohol use among fatally injured drivers (Section 13.2); > drivers involved in alcohol-related serious injury crashes (Section 13.3); and > trends in the alcohol-crash problem (Section 13.4) DEATHS IN ALCOHOL-RELATED CRASHES Table 13-1 presents information on people who died in alcohol-related crashes in Newfoundland and Labrador during Motor vehicle deaths are categorized in terms of the victim s age, gender, type (i.e., driver, passenger, pedestrian) and the type of vehicle they occupied. The first data column in the table presents the number of deaths. The next two columns show the number and percent of these fatalities in which sufficient information was available to determine if alcohol was involved. A motor vehicle fatality was considered to be alcohol involved if there was at least one drinking driver or drinking pedestrian in the fatal crash. For example, six people aged years of age were killed in motor vehicle crashes in Newfoundland and Labrador during And, in all cases (100.0%) it was possible to determine if alcohol was a factor in the crash. The next column shows the number of people killed in crashes that were known to be alcoholinvolved. For example, one person aged died in alcohol-related crashes in Newfoundland and Labrador during The next column expresses this as a percentage i.e., 16.7% of those aged who were killed died in an alcohol-related crash. The final column (percent of all alcohol-related deaths) expresses the number of deaths in alcohol-related crashes as a percent of all the deaths in such crashes. For example, the alcohol-related deaths among those aged represent 8.3% of all the people killed in alcohol-related crashes in Newfoundland and Labrador during The totals at the bottom of the table provide a summary. As can be seen, 43 persons died in motor vehicle crashes in Newfoundland and Labrador during In 40 (93.0%) of these cases, it was possible to determine if alcohol was a factor. Of these known cases, 12 (30.0%) involved alcohol. Extrapolating this figure to the total number of motor vehicle fatalities (43 x.3) it can be estimated that in Newfoundland and Labrador during 2010, 13 persons died in alcohol-related crashes. 187
198 NEWFOUNDLAND AND LABRADOR Victim age. Of all the people who died in alcohol-related crashes, 25.0% (see last column) were aged 26-35, and 46-55; and 8.3% were aged 16-19, and over 55. Within each of the age groups, the highest incidence of alcohol involvement occurred in the crashes in which a person aged died (60.0%). The lowest incidence of alcohol involvement was found among the youngest and oldest fatalities 0.0% of persons under age 16 and 9.1% of persons over age 55 died in crashes involving alcohol. 188
199 NEWFOUNDLAND AND LABRADOR Gender. Of all the people who died in alcohol-related crashes, 75.0% were males. The incidence of alcohol in crashes in which a male died (32.1%) was greater than the incidence of alcohol in crashes in which a female died (25.0%) Victim type. Of all the people who died in alcohol-related crashes, 75.0% were drivers/operators of a vehicle and 25.0% were passengers. Within each of the victim types, the highest incidence of alcohol involvement (33.3%) occurred in the crashes in which a driver/operator died. Alcohol was involved in 25.0% of the crashes in which a passenger died and 0.0% of the crashes in which a pedestrian died Type of vehicle occupied. Of all the people who died in alcohol-related crashes, 66.7% were automobile occupants and 33.3% were off-road vehicle occupants. Within each of these vehicle types, the incidence of alcohol involvement in which an automobile occupant died (40.0%) was greater than the incidence of alcohol in crashes in which an off-road vehicle occupant died (36.4%) ALCOHOL IN FATALLY INJURED DRIVERS This section presents information on the presence of alcohol, exclusively among drivers fatally injured in Newfoundland and Labrador during Table 13-2 shows the information by age group, gender, vehicle type, and collision type (single vs. multiple). 189
200 NEWFOUNDLAND AND LABRADOR The first data column in the table shows the number of drivers killed. The next columns show the number and percent of these victims who were tested for alcohol. The remaining columns provide information on the results of the alcohol tests the first three of these present results for drivers who showed any evidence of alcohol; the last three columns present information on drivers who had BACs over the statutory limit of 80 mg%. To illustrate, among drivers aged there were three drivers killed during 2010; all of these fatally injured drivers (100.0%) were tested for alcohol. Of those who were tested, one (33.3%) was positive for alcohol. This means that fatally injured drinking drivers aged accounted for 16.7% of all drinking drivers who were killed. 190 Then, in the final three columns, it can be seen that one of the three (33.3%) fatally injured drivers aged who were tested for alcohol had BACs in excess of 80 mg%. This means that the
201 NEWFOUNDLAND AND LABRADOR driver who was positive for alcohol had a BAC in excess of the legal limit. The final column expresses the number of drivers with illegal BACs as a percent of all drivers with BACs over the limit. Thus, drivers aged accounted for 16.7% of all the drivers with BACs over the legal limit. The main findings are shown by the totals at the bottom of the table. Newfoundland and Labrador had a very high testing rate in 2010, with 100.0% of fatally injured drivers being tested for alcohol use. In Newfoundland and Labrador, 33.3% had been drinking and all six (100.0%) fatally injured drinking drivers had BACs >80 mg%. Although not shown in the table, more refined analyses by different BAC categories show that among tested drivers: > 66.7% had BACs of zero mg%; > 0.0% had BACs from 1-49 mg%; > 0.0% had BACs from mg% > 11.1% had BACs from 81 to 160 mg%; and, > 22.2% had BACs over 160 mg%. The BAC distribution for fatally injured drivers is shown in Figure In this figure six of 18 (33.3%) fatally injured drivers have a positive BAC. And among fatally injured drinking drivers, six (100.0%) have BACs over 80 mg% Age differences. Of all the fatally injured drinking drivers (i.e., those with a positive BAC), 33.3% were aged and and 16.7% are aged and Also, of all the fatally injured legally impaired drivers (i.e., those with BACs over 80 mg%), 33.3% were aged and and 16.7% are aged and
202 NEWFOUNDLAND AND LABRADOR Within each of the age groups, fatally injured drivers aged were the most likely to have been drinking 50.0% of drivers in these age groups had been drinking; and 33.3% of the tested drivers aged and who had been drinking Gender differences. Males dominate the picture they account for 83.3% of the fatally injured drivers who had been drinking and 83.3% of those who were legally impaired. Males dominate the picture largely because they account for most of the drivers who are killed (14 of the 18 fatalities or 77.8% are males). Fatally injured male drivers were more likely to have been drinking than female drivers (35.7% and 25.0%, respectively). And, 100.0% of both male and female drivers who were drinking had BACs over the legal limit Vehicle differences. Of all the fatally injured drinking drivers (i.e., those with a positive BAC) and fatally injured legally impaired drivers (i.e., those with BACs over 80 mg%), 100.0% were automobile drivers. Within each of the vehicle types, 54.5% of fatally injured automobile drivers were found to have been drinking. None of the fatally injured truck/van drivers, motorcyclists or tractor-trailer drivers had been drinking Collision differences. Almost all of the drivers killed (16 of the 18) were involved in single-vehicle collisions and these crashes accounted for 83.3% of drivers who had been drinking and who were legally impaired. The reason for this apparent disparity is because alcohol is usually overrepresented in singlevehicle crashes. However, half of the drivers involved in multiple-vehicle crashes (50.0%) were positive for alcohol, compared to 31.3% of those involved in single-vehicle collisions DRIVERS INVOLVED IN ALCOHOL-RELATED SERIOUS INJURY CRASHES 192 This section presents information on drivers involved in alcohol-related crashes in which someone was seriously injured in 2008 in Newfoundland and Labrador. At the time this report was being prepared, 2009 and 2010 collision data from Newfoundland and Labrador were not available. For this reason, 2008 data will be reported in this section. A surrogate or indirect measure is used to estimate alcohol involvement because drivers in serious injury crashes are seldom tested for alcohol. A driver is identified as having been involved in an alcohol-related serious injury crash if the crash in which someone was seriously injured involved a single vehicle at night (SVN), or if, in the case of a non-svn serious injury crash, the police reported
203 NEWFOUNDLAND AND LABRADOR alcohol involvement i.e., at least one drinking driver in the crash (see Section 2.2.4). The results are shown in Table 13-3 for drivers grouped in terms of age, gender, type of vehicle driven, and type of collision. The first data column shows the number of drivers involved in serious injury crashes. The number and percent of drivers in such crashes that involved alcohol is shown in the next two columns. The final column expresses the number of drivers involved in alcohol-related serious injury crashes in any row as a percent of all drivers involved in alcohol- related serious injury crashes. As shown, by the totals at the bottom of the table, 201 drivers were involved in crashes in which someone was seriously injured, and among these 21.4% were alcohol-related crashes Driver age. Of all the drivers involved in alcohol-related serious injury crashes, 18.6% were aged 20-25, and 16.3% were aged and Drivers aged under 16 accounted for only 2.3% of those involved in alcohol-related serious injury crashes. 193
204 NEWFOUNDLAND AND LABRADOR Within each of the age groups, almost two-fifths of the drivers aged were involved in alcohol-related serious injury crashes (38.9%). The lowest incidence of involvement in alcoholrelated crashes was found for those aged (8.0%) Driver gender. Of all the drivers involved in alcohol-related serious injury crashes, 76.7% were males. The incidence of involvement in alcohol-related serious injury crashes was also greater for males than for females (24.6% and 9.3%, respectively) Type of vehicle driven. Of all the drivers involved in alcohol-related serious injury crashes, 37.2% were automobile drivers; 32.6% were off-road vehicle drivers; 23.3% were
205 NEWFOUNDLAND AND LABRADOR truck/van drivers; and 4.7% were motorcyclists. The highest incidence of involvement in alcohol-related serious injury crashes was found for offroad vehicle drivers 33.3% of these drivers were in crashes that involved alcohol, compared to 29.4% for truck/van drivers, 20.0% for automobile drivers; and 18.2% for motorcyclists Type of collision. Of all the drivers involved in alcohol-related serious injury crashes, 62.8% of them were in single-vehicle crashes. The highest incidence of involvement in alcohol-related serious injury crashes was also found among drivers in single-vehicle crashes 37.0% of these drivers, compared to only 12.5% for drivers involved in multiple-vehicle crashes TRENDS IN THE ALCOHOL-CRASH PROBLEM The previous sections examined three indicators of the alcohol-crash problem: the number and percent of people who died in crashes that involved alcohol; the number and percent of fatally injured drivers who had been drinking; and the number and percent of drivers in serious injury crashes that involved alcohol. This section examines changes in these three indicators of the problem. A review of Newfoundland and Labrador s progress in meeting STRID 2010 goals is also reported as comparisons are made between 2010 alcohol-crash problem findings and those from the baseline period Deaths in alcohol-related crashes: Table 13-4 and Figure 13-2 show the number and percent of people who died in crashes involving a drinking driver from 1995 to These results differ slightly from those in Section 13.1 for two reasons. First, deaths that occur in crashes that involve a drinking pedestrian are not necessarily classified as alcoholrelated deaths. The focus here is more restrictive, on deaths that occur in crashes involving at least one drinking driver. Second, the trend analyses focus on fatal crashes on public roadways involving principal vehicle types (where at least one of the vehicles involved is an automobile, truck/van, motorcycle or other highway vehicle). The previous analyses included all types of motorized vehicles (e.g., snowmobiles) on both public roadways and in off-road locations. It can be seen that during the baseline period that there was an average of 12 fatalities involving a drinking driver and they accounted for 31.6% of all fatalities. 195
206 196 NEWFOUNDLAND AND LABRADOR
207 NEWFOUNDLAND AND LABRADOR As shown in the figure, the number of deaths in crashes that involved a drinking driver increased from 10 to 18 between 1995 and There was a general decrease to a low of four alcoholrelated fatalities in 2000, a general increase to a high of 21 in 2008, a decrease to six in 2009, and an increase to nine in The percentage of alcohol-related fatalities increased from 35.7% in 1995 to 42.4% in 1997, generally decreased to a low of 8.9% in 2000, increased to 40.0% in 2004, peaked at 58.3% in 2008, decreased to 16.7% in 2009, and rose to 28.1% in Thus, it can be seen that the percent of fatalities involving a drinking driver decreased by 11.1% from 31.6% in the baseline period ( ) to 28.1% in And, in terms of the number of persons killed in crashes involving a drinking driver, there has been a 25.0% decrease from an average of 12 in the baseline period ( ) to nine in Fatally injured drivers: Data on alcohol use among fatally injured drivers over the 24-year period from are shown in Table Trends are illustrated in Figure 13-3 which shows changes in the percent of fatally injured drivers who: (1) showed no evidence of alcohol (represented by the white area); (2) had BACs below the legal limit (shown by the light grey area); and (3) had BACs over the legal limit (the dark grey area). The data reported here are restricted to drivers who died in less than six hours after the crash. As can be seen, the percent of fatally injured drivers with BACs over the legal limit generally decreased from a peak in 1993 (56.3%), to a low in 2000 (10.5%), generally rose to 35.7% in 2004, decreased to 31.3% in 2005, increased in 2008 (47.6%), decreased to 15.0% in 2009, and rose again to 33.3% in The percent of fatally injured drivers with zero BACs reached 70.0% in 1995, generally declined until 1999 (43.8%), rose in 2000 (84.2%), fluctuated until 2006 (68.4%), fell to a low of 13.3% in 2007, peaked in 2009 (85.0%), and decreased in 2010 (66.7%). The percent of fatally injured drivers with BACs between 1 and 80 mg% reached 25.0% in 1990, dropped to 0.0% in 1994 and 1995, generally increased until 2001 (21.4%), fluctuated until 2005 (25.0%), fell to 0.0% in 2006, peaked in 2007 (40.0%), decreased in 2009 (0.0%), and remained at this level in
 1-80 (% Tested) >80 (% Tested) 1987 15 15 100.0 9 60.0 0 0.0 6 40.0 1988 20 13 65.0 4 30.8 2 15.4 7 53.8 1989 31 26 83.9 13 50.0 2 7.7 11 42.3 1990 24 20 83.3 9 45.0 5 25.0 6 30.")
208 NEWFOUNDLAND AND LABRADOR Table 13-5 Alcohol Use Among Fatally Injured Drivers: Newfoundland & Labrador, Number of Drivers Drivers Grouped by BAC (mg%) YEAR Drivers* Tested (% Total) Zero (% Tested) 1-80 (% Tested) >80 (% Tested) (88.9) 9 (56.3) 2 (12.5) 5 (31.3) baseline * dying in less than six hours. 198
209 NEWFOUNDLAND AND LABRADOR When compared to the baseline period, the percentage of fatally injured drivers with zero BACS in 2010 increased by 18.5% (from 56.3% to 66.7%). Among drivers with BACs from 1-80 mg%, there was a decrease (from 12.5% to 0.0%). And among drivers with BACs over 80 mg%, there was a 6.4% increase (from 31.3% to 33.3%). Table 13-6 and Figure 13-4 show data on alcohol use among fatally injured drivers over a shorter period from These results also differ from those reported above for several reasons. First, the number of drivers is extrapolated to reflect the BAC distribution of drivers tested for alcohol (see Figure 13-1). Second, estimates are based on all fatally injured drivers, not just those who died in less than six hours from the crash. Third, drivers are grouped in only two BAC categories: zero and positive. As can be seen in Table 13-6, the baseline percentage of fatally injured drivers testing positive for alcohol from is 45.0%. In 2010, 33.3% of fatally injured drivers tested positive for alcohol, a 26.0% decrease from the baseline period Drivers in serious injury crashes: As mentioned earlier in Section 13.3, 2009 and 2010 collision data from Newfoundland and Labrador were not available at the time this report was being prepared. For this reason, the serious-injury trend tables and figures in this subsection will only report data as recent as Table 13-7 shows information on drivers involved in alcohol-related serious injury crashes. During the baseline period ( ), an average of 19.2% of drivers in serious injury crashes were in an alcohol-involved crash. Figure 13-5 rounds the annual percentages into whole numbers. There is an 11.5% increase in the percentage of drivers involved in alcohol-involved serious-injury crashes from 19.2% in the baseline period to 21.4% in Table 13-8 and Figure 13-6 also show information on drivers involved in alcohol-related serious injury crashes. These results differ slightly from those in Section 13.3 and in Table 13-7 and Figure 13-5 because they exclude certain vehicle types e.g., bicycles, snowmobiles, farm tractors and other non-highway vehicles. As can be seen, the incidence of alcohol-involvement in serious injury crashes has been relatively stable. The percentage of drivers in serious-injury crashes that involved alcohol decreased from 21.6% to 17.6% between 1995 and 1997, peaked at 25.2% in 1999, dropped to a low of 15.7% in 2000, rose to 17.9% in 2001, declined to 17.3% in 2003, rose to 23.3% in 2004, decreased to 18.4% in 2005, rose to 22.5% in 2007, and decreased again to 21.7% in
210 200 NEWFOUNDLAND AND LABRADOR

211 NEWFOUNDLAND AND LABRADOR As shown in Table 13-8, in the baseline period ( ), an average of 19.5% of drivers in serious injury crashes were in an alcohol-involved crash. In 2008, the incidence of drivers in 201

212 NEWFOUNDLAND AND LABRADOR alcohol-involved crashes rose to 21.7%, an 11.3% increase. 202
213 YUKON 14.0 YUKON This section of the report reviews the major findings on alcohol involvement in fatal and serious injury motor vehicle collisions in the Yukon during It describes data on: > people who were killed in alcohol-related crashes (Section 14.1); > alcohol use among fatally injured drivers (Section 14.2); > drivers involved in alcohol-related serious injury crashes (Section 14.3); and > trends in the alcohol-crash problem (Section 14.4). Detailed results are not provided in Sections 14.1 and 14.2 because the small number of deaths in alcohol-related crashes only three and drivers fatally injured only two makes the results unreliable DEATHS IN ALCOHOL-RELATED CRASHES A motor vehicle fatality was considered to be alcohol involved if there was at least one drinking driver or drinking pedestrian in the fatal crash. During 2010, four persons died in motor vehicle crashes in the Yukon. And, in all (100.0%) of these cases, it was possible to determine if alcohol was a factor in the crash. Of these cases, three (75.0%) involved alcohol ALCOHOL IN FATALLY INJURED DRIVERS The Yukon had only two fatally injured drivers in Both of these drivers (100.0%) were tested for alcohol and one (50.0%) had been drinking DRIVERS INVOLVED IN ALCOHOL-RELATED SERIOUS INJURY CRASHES This section presents information on drivers involved in alcohol-related crashes in which someone was seriously injured in 2010 in the Yukon. A surrogate or indirect measure is used to estimate alcohol involvement because drivers in serious injury crashes are seldom tested for alcohol. A driver is identified as having been involved in an alcohol-related serious injury crash if the crash in which someone was seriously injured involved a single vehicle at night (SVN), or if, in the case of a non-svn serious injury crash, the police reported alcohol involvement i.e., at least one drinking driver in the crash (see Section 2.2.4). The results are shown in Table 14-1 for drivers grouped in terms of age, gender, type of vehicle driven, and type of collision. The first data column shows the number of drivers 203
214 YUKON involved in serious injury crashes. The number and percent of drivers in such crashes that involved alcohol are shown in the next two columns. The final column expresses the number of drivers involved in alcohol-related serious injury crashes in any row as a percent of all drivers involved in alcohol- related serious injury crashes. As shown, by the totals at the bottom of the table, 29 drivers were involved in crashes in which someone was seriously injured, and among these 44.8% were alcohol-related crashes Driver age. Of all the drivers involved in alcohol-related serious injury crashes, 30.8% were aged 26-35; 23.1% were aged 36-45; 15.4% were aged and over age 55; and 7.7% were aged Within each of the age groups, three out of five (60.0%) of the drivers aged were involved in alcohol-related serious injury crashes. The lowest incidence of involvement in alcohol-related crashes was found for those aged (0.0%) Driver gender. Of all the drivers involved in alcohol-related serious injury crashes, 69.2% were males. The incidence of involvement in alcohol-related serious injury crashes was greater for males than for females (47.4% and 33.3%, respectively) Type of vehicle driven. Of all the drivers involved in alcohol-related serious injury crashes, 53.8% were automobile drivers; 23.1% were drivers of other highway vehicles (a regrouping of truck/van drivers and tractor-trailer drivers so that an individual driver cannot be identified); 15.4% were off-road vehicle drivers and 7.7% were motorcyclists. The highest incidence of involvement in alcohol-related serious injury crashes was found for automobile drivers 58.3% of these drivers were in crashes that involved alcohol, compared to 50.0% for motorcyclists and off-road vehicle drivers and 27.3% for drivers of other highway vehicles. 204
215 YUKON Type of collision. Of all the drivers involved in alcohol-related serious injury crashes, 69.2% of them were in single-vehicle crashes. The highest incidence of involvement in alcohol-related serious injury crashes was also found among drivers in single-vehicle crashes 60.0% of these drivers, compared to only 28.6% for drivers involved in multiple-vehicle crashes TRENDS IN THE ALCOHOL-CRASH PROBLEM The previous sections examined three indicators of the alcohol-crash problem: the number and percent of people who died in crashes that involved alcohol; the number and percent of fatally injured drivers who had been drinking; and the number and percent of drivers in serious injury crashes that involved alcohol. This section examines changes in these three indicators of the 205
216 YUKON problem. The Yukon s progress in meeting the STRID 2010 objective of a 40% reduction in the alcohol-crash problem by 2010 is also reported by comparing findings in 2010 with those from the baseline period Deaths in alcohol-related crashes: Table 14-2 and Figure 14-1 show the number and percent of people who died in crashes involving a drinking driver from 1995 to These results differ slightly from those in Section 14.1 for two reasons. First, deaths that occur in crashes that involve a drinking pedestrian are not necessarily classified as alcoholrelated deaths. The focus here is more restrictive, on deaths that occur in crashes involving at least one drinking driver. Second, the trend analyses focus on fatal crashes on public roadways involving principal vehicle types (where at least one of the vehicles involved is an automobile, truck/van, motorcycle or other highway vehicle). The previous analyses included all types of motorized vehicles (e.g., snowmobiles) on both public roadways and in off-road locations. As shown in the figure, the number of deaths in crashes that involved a drinking driver increased from one to seven between 1995 and 1998, fell to zero in 2001, rose to six in 2002, decreased to one in 2004, rose to five in 2006, fell to two in 2007, rose to three in 2008, decreased to two in 2009, and rose again to three in The percentage of alcohol-related fatalities rose from 7.7% in 1995 to 66.7% in 1996 and Since then, the percentage of alcohol-related fatalities in the Yukon fluctuated until 2000, dropped to 0.0% in 2001, generally rose until 2005 (66.7%), decreased to 40.0% in 2007, rose in 2008 (50.0%), decreased in 2009 (28.6%), and peaked in 2010 (75.0%). It can be seen that during the baseline period that there was an average of four fatalities involving a drinking driver and they accounted for 50.0% of all fatalities This means that the percent of fatalities involving a drinking driver increased by 50.0% from 50.0% in the baseline period ( ) to 75.0% in However, in terms of the number of persons killed in crashes involving a drinking driver, there has been a 25.0% decrease from an average of four in the baseline period ( ) to three in
217 YUKON 207
218 YUKON Fatally injured drivers: Due to the small number of cases e.g., two fatally injured drivers in 2010 any trends would be unreliable, and therefore, are not presented in tables and figures Drivers in injury crashes: Since information on serious injury crashes for the Yukon has only been available since 1998, trends for drivers involved in crashes of all injury severity are shown in Table 14-3 and Figure During the baseline period ( ), an average of 19.6% of drivers in injury crashes were in an alcohol-involved crash. This compares to 18.9% in 2010, a 3.6% decrease in the problem. Table 14-4 and Figure 14-3 also show information on drivers involved in alcohol-related injury crashes. These results differ slightly from those in Section 14.3 and in Table 14-3 and Figure 14-2 because they exclude certain vehicle types e.g., bicycles, snowmobiles, farm tractors and other non-highway vehicles. As can be seen the incidence of alcohol-involvement in injury crashes has fluctuated over this 16-year period. Between 1995 and 1997 the percentage of all drivers in injury crashes that involved alcohol decreased from 20.1% to 18.1%. Since then, the incidence rose to 22.7% in 1998, fluctuated bewen 1999 and 2004, dropped to a low of 13.7% in 2006, rose to 21.1% in 2007, decreased to 14.7% in 2008, rose to 24.6% in 2009, and decreased again to 18.3% in As shown in Table 14-4, in the baseline period ( ), an average of 19.1% of drivers in injury crashes were in an alcohol-involved crash. In 2010, the incidence of drivers in alcoholinvolved crashes declined to 18.3%, a 4.2% decrease. 208
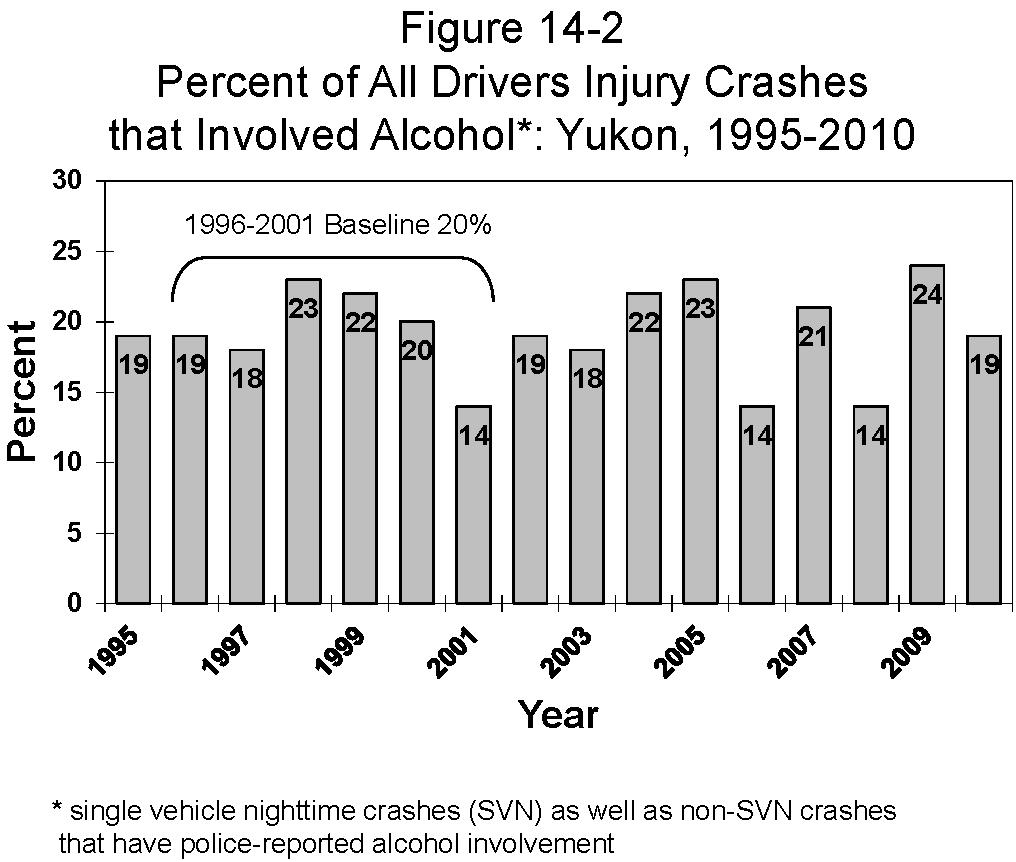
219 YUKON 209
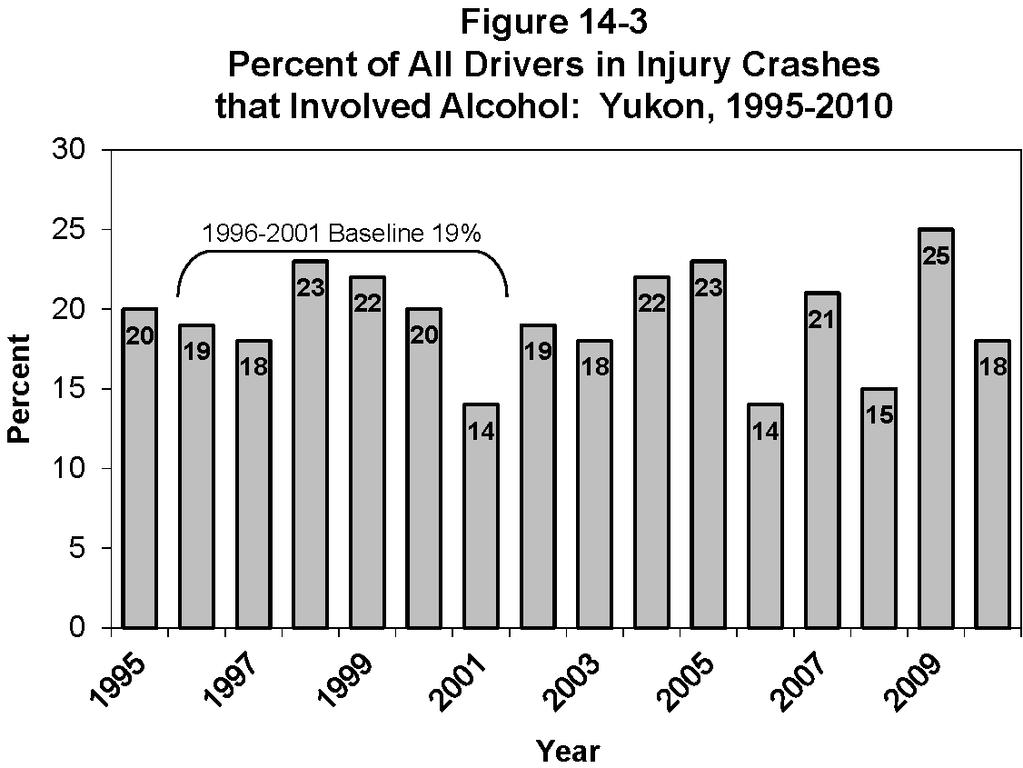
220 210 YUKON
221 NORTHWEST TERRITORIES 15.0 NORTHWEST TERRITORIES This section of the report reviews the major findings on alcohol involvement in fatal and serious injury motor vehicle collisions in the Northwest Territories during It describes data on: > people who were killed in alcohol-related crashes (Section 15.1); > alcohol use among fatally injured drivers (Section 15.2); > drivers involved in alcohol-related serious injury crashes (Section 15.3); and > trends in the alcohol-crash problem (Section 15.4). Detailed results are not provided in Sections 15.1 and 15.2 because the small number of deaths in alcohol-related crashes only three and drivers fatally injured only one makes the results unreliable DEATHS IN ALCOHOL-RELATED CRASHES A motor vehicle fatality was considered to be alcohol involved if there was at least one drinking driver or drinking pedestrian in the fatal crash. During 2010, four persons died in motor vehicle crashes in the Northwest Territories. And, in all (100.0%) of these cases, it was possible to determine if alcohol was a factor in the crash. Of these cases, three (75.0%) involved alcohol ALCOHOL IN FATALLY INJURED DRIVERS The Northwest Territories had only one driver fatally injured in DRIVERS INVOLVED IN ALCOHOL-RELATED SERIOUS INJURY CRASHES This section presents information on drivers involved in alcohol-related crashes in which someone was seriously injured in 2010 in the Northwest Territories. A surrogate or indirect measure is used to estimate alcohol involvement because drivers in serious injury crashes are seldom tested for alcohol. A driver is identified as having been involved in an alcohol-related serious injury crash if the crash in which someone was seriously injured involved a single vehicle at night (SVN), or if, in the case of a non-svn serious injury crash, the police reported alcohol involvement i.e., at least one drinking driver in the crash (see Section 2.2.4). The results are shown in Table 15-1 for drivers grouped in terms of age, gender, type of vehicle driven, and type of collision. The first data column shows the number of drivers involved in serious injury crashes. The number and percent of drivers in such crashes that 211
222 NORTHWEST TERRITORIES involved alcohol is shown in the next two columns. The final column expresses the number of drivers involved in alcohol-related serious injury crashes in any row as a percent of all drivers involved in alcohol-related serious injury crashes. As shown, by the totals at the bottom of the table, 16 drivers were involved in crashes in which someone was seriously injured, and among these 37.5% were alcohol-related crashes Driver age. Of all the drivers involved in alcohol-related serious injury crashes, 50.0% were aged 26-35; 33.3% were aged 46-55; and 16.7% were aged Within each of the age groups, three-fifths (60.0%) of the drivers aged were involved in alcohol-related serious injury crashes. The lowest incidence of involvement in alcohol-related crashes was found for those over age 55 (0.0%) Driver gender. Of all the drivers involved in alcohol-related serious injury crashes, 83.3% were males. As a result, the incidence of involvement in alcohol-related serious injury crashes was greater for males than for females (45.5% and 20.0%, respectively) Type of vehicle driven. Of all the drivers involved in alcohol-related serious injury crashes, 50.0% were truck/van drivers and off-road vehicle drivers. The highest incidence of involvement in alcohol-related serious injury crashes was found for offroad vehicle drivers 75.0% of these drivers were in crashes that involved alcohol, compared to 37.5% for truck/van drivers and 0.0% for automobile drivers and motorcyclists. 212
223 NORTHWEST TERRITORIES Table 15-1 Drivers* in Alcohol-Related Serious Injury Crashes: Northwest Territories, 2010 Category Number Alcohol-Related of of % of % of all drivers in Drivers Drivers Number total alcohol-related crashes Age > Gender Male Female Vehicle Type Auto Truck/Van Motorcycle Off-Road Collision Type Single-Vehicle Multiple-Vehicle TOTAL * These numbers are slightly underestimated since 7.1% of all injuries are recorded as unspecified Type of collision. Of all the drivers involved in alcohol-related serious injury crashes, 100.0% of them were in single-vehicle crashes. The highest incidence of involvement in alcohol-related serious injury crashes was also found among drivers in single-vehicle crashes 66.7% of these drivers, compared to 0.0% for drivers involved in multiple-vehicle crashes TRENDS IN THE ALCOHOL-CRASH PROBLEM The previous sections examined three indicators of the alcohol-crash problem: the number and percent of people who died in crashes that involved alcohol; the number and percent of fatally injured drivers who had been drinking; and the number and percent of drivers in serious injury crashes that involved alcohol. This section examines changes in these three indicators of the problem. The Northwest Territories progress in meeting the STRID 2010 objective of a 40% 213
224 NORTHWEST TERRITORIES reduction in the alcohol-crash problem by 2010 is also reported by comparing findings in 2010 with those from the baseline period Deaths in alcohol-related crashes: Due to the small number of crashes on public roadways involving principal vehicle types (e.g., only two deaths in 2010) any trends would be unreliable, and therefore are not reported Fatally injured drivers: Due to the small number of cases e.g., only one fatally injured driver in 2010 any trends would be unreliable, and therefore are not reported Drivers in serious injury crashes: Table 15-2 and Figure 15-1 show information on drivers involved in alcohol-related serious injury crashes. During the baseline period ( ), an average of 35.0% of drivers in serious injury crashes were in an alcohol-involved crash. This compares to 37.5% in 2010, a 7.1% increase in the problem. Table 15-3 and Figure 15-2 also show information on drivers involved in alcohol-related serious injury crashes. These results differ slightly from those in Section 15.3 and in Table 15-2 and Figure 15-1 because they exclude certain vehicle types e.g., bicycles, snowmobiles, farm tractors and other non-highway vehicles. As can be seen, the incidence of alcohol-involvement in serious injury crashes has fluctuated over this 16-year period. Between 1995 and 1997 the percentage of all drivers in serious injury crashes that involved alcohol decreased from 65.0% to 25.0%. Since then, the incidence peaked at 66.7% in 2000, generally decreased to 21.4% in 2004, rose to 41.2% in 2006, decreased slightly to 40.0% in 2007, rose slightly to 41.7% in 2008, decreased to a low of 20.0% in 2009, and rose again in 2010 (25.0%). As shown in Table 15-3, in the baseline period ( ), an average of 42.9% of drivers in serious injury crashes were in an alcohol-involved crash. In 2010 the incidence of drivers in alcohol-involved crashes declined to 25.0%, a 41.7% decrease. 214

225 NORTHWEST TERRITORIES 215

226 216 NORTHWEST TERRITORIES
CCMTA Road Safety Report Series
 CCMTA Road Safety Report Series ALCOHOL-CRASH PROBLEM IN CANADA: 2009 Prepared For Canadian Council of Motor Transport Administrators Standing Committee on Road Safety Research and Policies and Transport
CCMTA Road Safety Report Series
 CCMTA Road Safety Report Series ALCOHOL-CRASH PROBLEM IN CANADA: 2008 Prepared For Canadian Council of Motor Transport Administrators Standing Committee on Road Safety Research and Policies and Transport
Alcohol and Drug-Crash Problem in Canada 2011 Report
 CCMTA Road Safety Research Report Series Alcohol and Drug-Crash Problem in Canada 2011 Report Prepared for the Canadian Council of Motor Transport Administrators by the Traffic Injury Research Foundation
Alcohol and Drug-Crash Problem in Canada 2012 Report
 CCMTA Road Safety Research Report Series Alcohol and Drug-Crash Problem in Canada 2012 Report Prepared for the Canadian Council of Motor Transport Administrators by the Traffic Injury Research Foundation
ALCOHOL AND/OR DRUGS AMONG CRASH VICTIMS DYING WITHIN 12 MONTHS OF A CRASH ON A PUBLIC ROAD, BY JURISDICTION: CANADA, 2014
 ALCOHOL AND/OR DRUGS AMONG CRASH VICTIMS DYING WITHIN 12 MONTHS OF A CRASH ON A PUBLIC ROAD, BY JURISDICTION: CANADA, 2014 April 15, 2018 R. Solomon, Distinguished University Professor, C. Ellis, J.D.
THE PRESENCE OF ALCOHOL AND/OR DRUGS IN MOTOR VEHICLE FATALITIES, BY JURISDICTION: CANADA, 2013 November 15, 2017
 THE PRESENCE OF ALCOHOL AND/OR DRUGS IN MOTOR VEHICLE FATALITIES, BY JURISDICTION: CANADA, 2013 November 15, 2017 R. Solomon, Distinguished University Professor, C. Ellis, J.D. 2018 & C. Zheng, J.D. 2019
COLLISIONS AMONG FATALLY INJURED DRIVERS OF DIFFERENT AGE GROUPS,
 T R A F F I C I N J U R Y R E S E A R C H F O U N D A T I O N COLLISIONS AMONG FATALLY INJURED DRIVERS OF DIFFERENT AGE GROUPS, 2000-2014 Traffic Injury Research Foundation, August 2018 Introduction Research
Physiotherapists in Canada, 2011 National and Jurisdictional Highlights
 pic pic pic Physiotherapists in Canada, 2011 National and Jurisdictional Highlights Spending and Health Workforce Our Vision Better data. Better decisions. Healthier Canadians. Our Mandate To lead the
Estimated Number and Percentage of Alcohol and Impairment- Related Crash Fatalities and Injuries, by Jurisdiction, Age and Population: Canada, 2009
 Estimated Number and Percentage of Alcohol and Impairment- Related Crash and Injuries, by Jurisdiction, Age and Population: Canada, 2009 R. Solomon, Professor M. Cassidy, J.D. 2014 The Faculty of Law Western
Impaired driving statistics
 driving statistics Telling Canada s story in numbers Yvan Clermont Canadian Centre for Justice Statistics Standing Senate Committee on Legal and Constitutional Affairs February 8 th, 2018 Key points While
INTRODUCTION. The drugs-and-driving problem
 INTRODUCTION The drugs-and-driving problem Following nearly three decades of progress on the alcohol-crash problem, safety advocates, policy-makers, legislators and enforcement agencies have begun to express
Subject: The Case for a Provincial 0.00% BAC Limit for All Drivers Under the Age of 21
 Authors: E. Chamberlain & R. Solomon Subject: The Case for a Provincial 0.00% BAC Limit for All Drivers Under the Age of 21 Date: January 9, 2001 Over the last two decades, a significant amount of research
IMPAIRED DRIVING CAUSING DEATH: CHARGES, CASES AND CONVICTIONS: CANADA, /16 November 15, 2017
 IMPAIRED DRIVING CAUSING DEATH: CHARGES, CASES AND CONVICTIONS: CANADA, 1994-2015/16 November 15, 2017 R. Solomon, Distinguished University Professor, C. Ellis, J.D. 2018 & C. Zheng, J.D. 2019 Faculty
ROAD SAFETY MONITOR 2018 DRINKING AND DRIVING IN CANADA Traffic Injury Research Foundation, December 2018
 T R A F F I C I N J U R Y R E S E A R C H F O U N D A T I O N ROAD SAFETY MONITOR 2018 DRINKING AND DRIVING IN CANADA Traffic Injury Research Foundation, December 2018 By: Steve W. Brown, Marisela Mainegra
Impaired Driving in Canada
 www.ccsa.ca www.ccdus.ca May 2018 Topic Summary Impaired Driving in Canada Background Driving while impaired by alcohol or drugs remains the most prominent factor contributing to serious road crashes in
Reactions of teenagers and parents to a zero alcohol tolerance law
 Reactions of teenagers and parents to a zero alcohol tolerance law Dan R. M a y h ew ', H erb. M. S im p s o n 1, Susan A. F ergu so n 2 and Allan F. W illiam s2 1TIRF, 171 Nepean St., Ste. 200, Ottawa,
MARIJUANA USE AMONG DRIVERS IN CANADA,
 T R A F F I C I N J U R Y R E S E A R C H F O U N D A T I O N MARIJUANA USE AMONG DRIVERS IN CANADA, 2000-2014 Traffic Injury Research Foundation, December 2017 Introduction Public concern about drug-impaired
West Nile virus and Other Mosquito borne Diseases National Surveillance Report English Edition
 and Other Mosquito borne Diseases National Surveillance Report English Edition July to July 8, 17 (Week 7) West Nile Virus Canada Humans As of surveillance week 7, ending on July 8, 17, the Public Health
How Safe Are Our Roads? 2016 Checkpoint Strikeforce campaign poster celebrating real area cab drivers as being Beautiful designated sober drivers.
 How Safe Are Our Roads? 2016 Checkpoint Strikeforce campaign poster celebrating real area cab drivers as being Beautiful designated sober drivers. Annual Data Report on the Impact of Drunk Driving on Road
ROAD SAFETY MONITOR 2017 DRINKING AND DRIVING IN CANADA
 T R A F F I C I N J U R Y R E S E A R C H F O U N D A T I O N ROAD SAFETY MONITOR 2017 DRINKING AND DRIVING IN CANADA Traffic Injury Research Foundation, December 2017 By: Steve W. Brown, Marisela Mainegra
Report from the National Diabetes Surveillance System:
 Report from the National Diabetes Surveillance System: Diabetes in Canada, 28 To promote and protect the health of Canadians through leadership, partnership, innovation and action in public health. Public
Estimating the volume of Contraband Sales of Tobacco in Canada
 The Canadian Tobacco Market Place Estimating the volume of Contraband Sales of Tobacco in Canada Updated April 2010 Physicians for a Smoke-Free Canada 1226 A Wellington Street Ottawa, Ontario, K1Y 3A1
The Road Safety Monitor Drugs and Driving A DRIVING FORCE FOR SAFETY
 The Road Safety Monitor 2002 Drugs and Driving T R I N R E F O A F F I C J U R Y S E A R C H U N D A T I O N A DRIVING FORCE FOR SAFETY The Traffic Injury The mission of the Traffic Injury (TIRF) is to
5 ROADSIDE MEMORIAL SIGNAGE PROGRAM MADD CANADA
 5 ROADSIDE MEMORIAL SIGNAGE PROGRAM MADD CANADA The Transportation and Works Committee recommends the following: 1. The recommendations contained in the following report, February 25, 2008, from the Commissioner
HOW SAFE ARE OUR ROADS?
 HOW SAFE ARE OUR ROADS? 2017 annual data report on the impact of drunk driving on road safety in the Washington D.C. metropolitan region December 2018 HOW SAFE ARE OUR ROADS? ANNUAL DATA REPORT ON THE
ATLANTIC CANADA. CHILD & YOUTH UNINTENTIONAL INJURY HOSPITALIZATIONS: 10 Years in Review [ ] Here for you.
![ATLANTIC CANADA. CHILD & YOUTH UNINTENTIONAL INJURY HOSPITALIZATIONS: 10 Years in Review [ ] Here for you.](/thumbs/89/97512367.jpg "ATLANTIC CANADA. CHILD & YOUTH UNINTENTIONAL INJURY HOSPITALIZATIONS: 10 Years in Review [ ] Here for you.") ATLANTIC CANADA CHILD & YOUTH UNINTENTIONAL INJURY HOSPITALIZATIONS: 1 s in Review [24-213] CHILDSAFETYLINK Here for you. Special thanks to for their nancial contribution to support this project. Published
ATLANTIC CANADA CHILD & YOUTH UNINTENTIONAL INJURY HOSPITALIZATIONS: 1 s in Review [24-213] CHILDSAFETYLINK Here for you. Special thanks to for their nancial contribution to support this project. Published
TRANSFUSION TRANSMITTED INJURIES SURVEILLANCE SYSTEM (TTISS): SUMMARY RESULTS. 1 P age
: SUMMARY RESULTS. 1 P age") TRANSFUSION TRANSMITTED INJURIES SURVEILLANCE SYSTEM (TTISS): 2009-2013 SUMMARY RESULTS 1 P age Acknowledgments: The development of the Transfusion Transmitted Surveillance System (TTISS) would not have
TRANSFUSION TRANSMITTED INJURIES SURVEILLANCE SYSTEM (TTISS): 2009-2013 SUMMARY RESULTS 1 P age Acknowledgments: The development of the Transfusion Transmitted Surveillance System (TTISS) would not have
AN OVERVIEW OF FEDERAL DRUG-IMPAIRED DRIVING ENFORCEMENT AND PROVINCIAL LICENCE SUSPENSIONS IN CANADA
 0 AN OVERVIEW OF FEDERAL DRUG-IMPAIRED DRIVING ENFORCEMENT AND PROVINCIAL LICENCE SUSPENSIONS IN CANADA R. Solomon & E. Chamberlain Professors, Faculty of Law Western University September 12 1 INTRODUCTION
An Overview of Administrative Driver License Suspensions and Criminal Code Charges for Alcohol and Drug Impaired Driving in Canada:
 An Overview of Administrative Driver License Suspensions and Criminal Code Charges for Alcohol and Drug Impaired Driving in Canada: 2008-2014 September 2016 1 Introduction Alcohol and drug impaired driving
Mental Health Statistics, to
 , 1982-83 to 1993-94 Jean Randhawa and Rod Riley* Since the early 1980s, in relation to the size of the population, general and psychiatric hospitals have seen a drop in separations for mental disorders.
II: ALCOHOL - RELATED CRASHES
 II: ALCOHOL - RELATED CRASHES BACKGROUND AND DEFINITIONS 1. Impaired driving incidents. As used here, an impaired driving incident is one where there was an arrest for driving while under the influence
The Severity of Pedestrian Injuries in Alcohol-Related Collisions
 The Severity of Pedestrian Injuries in -Related Collisions AUTHORS: Stanley Sciortino, PhD Elyse Chiapello San Francisco Department of Public Health Community Health Education Section The California Statewide
Prince Edward Island: Preparation for Cannabis Legalization
 Prince Edward Island: Preparation for Cannabis Legalization Prince Edward Island: Preparation for Cannabis Legalization The Government of Prince Edward Island has an obligation and an opportunity to actively
November 5 to 11, 2017 (Week 45)
") Hanks you Overall Summary November 5 to 11, 2017 (Week 45) Influenza activity crossed the seasonal threshold in week 45, indicating the beginning of the influenza season at the national level. The number
Hanks you Overall Summary November 5 to 11, 2017 (Week 45) Influenza activity crossed the seasonal threshold in week 45, indicating the beginning of the influenza season at the national level. The number
Health Interventions in Ambulatory Cancer Care Centres DRAFT. Objectives. Methods
 ENVIRONMENTAL SCAN Health Interventions in Ambulatory Cancer Care Centres Context Cancer, a complex, chronic condition, will affect an estimated two in five Canadians in their lifetime. 1 Cancer requires
ALCOHOL, CANNABIS AND IMPAIRED DRIVING
 ALCOHOL, CANNABIS AND IMPAIRED DRIVING July 11, 2018 R. Solomon, Distinguished University Professor, Faculty of Law, Western University; K. Mahdi, J.D. 2020, Faculty of Law, Western University; & A. Sohrevardi,
Cannabis and Other Drugs Among Fatally- Injured Drivers In Canada, 2012
 Cannabis and Other Drugs Among Fatally- Injured Drivers In Canada, 2012 R. Solomon, Professor M. Clarizio, J.D. 2017 The Faculty of Law Western University April 18, 2016 1 The 2012 Data This document provides
PROFILE AND PROJECTION OF DRUG OFFENCES IN CANADA. By Kwing Hung, Ph.D. Nathalie L. Quann, M.A.
 PROFILE AND PROJECTION OF DRUG OFFENCES IN CANADA By Kwing Hung, Ph.D. Nathalie L. Quann, M.A. Research and Statistics Division Department of Justice Canada February 2000 Highlights From 1977 to 1998,
West Nile Virus and Other Mosquito-borne Diseases National Surveillance Report English Edition September 11 to September 17, 2016 (Week 37)
") West Nile Virus and Other Mosquito-borne Diseases National Surveillance Report English Edition September 11 to September 17, 16 (Week 37) Canada Humans During surveillance week 37, ending on September
West Nile Virus and Other Mosquito-borne Diseases National Surveillance Report English Edition September 11 to September 17, 16 (Week 37) Canada Humans During surveillance week 37, ending on September
Alcohol Indicators Report Executive Summary
 Alcohol Indicators Report Executive Summary A framework of alcohol indicators describing the consumption of use, patterns of use, and alcohol-related harms in Nova Scotia NOVEMBER 2005 Foreword Alcohol
Aussi disponible en français sous le titre : Le Diabète au Canada : Rapport du Système national de surveillance du diabète, 2009
 Report from the National Diabetes Surveillance System: Diabetes in Canada, 29 To promote and protect the health of Canadians through leadership, partnership, innovation and action in public health. Public
ROAD SAFETY MONITOR. ALCOHOL-IMPAIRED DRIVING IN THE UNITED STATES Results from the 2018 TIRF USA Road Safety Monitor
 This fact sheet summarizes the national results of the 2018 USA Road Safety Monitor (USA RSM) on alcohol-impaired driving. This USA RSM is the fourth annual public opinion survey conducted by the Traffic
December 3 to 9, 2017 (Week 49)
") Hanks you December 3 to 9, 2017 (Week 49) Overall Summary Overall, Influenza activity continues to increase across Canada; however many indicators such as hospitalizations, outbreaks and geographic spread
Hanks you December 3 to 9, 2017 (Week 49) Overall Summary Overall, Influenza activity continues to increase across Canada; however many indicators such as hospitalizations, outbreaks and geographic spread
West Nile Virus and Other Mosquito-borne Diseases National Surveillance Report English Edition September 18 to September 24, 2016 (Week 38)
") West Nile Virus and Other Mosquito-borne Diseases National Surveillance Report English Edition September 18 to September 4, 16 (Week 38) Canada Humans During surveillance week 38, ending on September 4,
West Nile Virus and Other Mosquito-borne Diseases National Surveillance Report English Edition September 18 to September 4, 16 (Week 38) Canada Humans During surveillance week 38, ending on September 4,
Injuries in Canada: Insights from the Canadian Community Health Survey
 Component of Statistics Canada Catalogue no. 82-624-X Injuries in Canada: Insights from the Canadian Community Health Survey by Jean-Michel Billette and Teresa Janz June 2011 How to obtain more information
ICD-10 Reciprocal Billing File Technical Specifications Reference Guide for Ontario Hospitals
 ICD-10 Reciprocal Billing File Technical Specifications Reference Guide for Ontario Hospitals Ministry of Health and Long-Term Care Version 3 January 2014 ICD Reciprocal Billing File Technical Specifications
SUPPLY, DISTRIBUTION AND MIGRATION OF CANADIAN
 SOUTHAM M E D I C A L D A T A B A S E SUPPLY, DISTRIBUTION AND MIGRATION OF CANADIAN PHYSICIANS, 2002 Supply, Distribution and Migration of Canadian Physicians, 2002 All rights reserved. No part of this
CHAPTER 4: Population-level interventions
 CHAPTER 4: Population-level interventions Population-level interventions refer to policies and programs that are applied to entire populations to promote better health outcomes. In this chapter, we describe
CANNABIS AND OTHER DRUGS AMONG DRIVERS OF HIGHWAY VEHICLES DYING WITHIN 30 DAYS OF A CRASH ON A PUBLIC ROAD: CANADA, 2014
 CANNABIS AND OTHER DRUGS AMONG DRIVERS OF HIGHWAY VEHICLES DYING WITHIN 30 DAYS OF A CRASH ON A PUBLIC ROAD: CANADA, 2014 April 15, 2018 R. Solomon, Distinguished University Professor C. Ellis, J.D. 2018
Health Canada. Santé Canada. Tuberculosis in Canada pre-release
 Health Canada Santé Canada Tuberculosis in Canada 2002 pre-release Our mission is to help the people of Canada maintain and improve their health. Health Canada HOW TO REACH US For more information, copies
Review of Pre-crash Behaviour in Fatal Road Collisions Report 1: Alcohol
 Review of Pre-crash Behaviour in Fatal Road Collisions Research Department Road Safety Authority September 2011 Contents Executive Summary... 3 Introduction... 4 Road Traffic Fatality Collision Data in
Will the Canadian Government s Commitment to Use a Gender-based Analysis Result in Public Policies Reflecting the Diversity of Women s Lives?
 Promoting social change through policy-based research in women s health Will the Canadian Government s Commitment to Use a Gender-based Analysis Result in Public Policies Reflecting the Diversity of Women
WEST NILE VIRUS AND OTHER MOSQUITO-BORNE DISEASE NATIONAL SURVEILLANCE REPORT
 WEST NILE VIRUS AND OTHER MOSQUITO-BORNE DISEASE NATIONAL SURVEILLANCE REPORT NOV 1 TO NOV 7, 215 REPORT WEEK 44 CANADA HUMANS During surveillance week 44, ending on Nov 7, 215, one (1) human clinical
WEST NILE VIRUS AND OTHER MOSQUITO-BORNE DISEASE NATIONAL SURVEILLANCE REPORT
 WEST NILE VIRUS AND OTHER MOSQUITO-BORNE DISEASE NATIONAL SURVEILLANCE REPORT AUG 3 TO SEPT 5, 215 REPORT WEEK 35 CANADA HUMANS During surveillance week 35, ending on Sept 5, 215, three (3 ) human clinical
FATIGUE MANAGEMENT Shell Canada Road Transport Forum September 26, 2013
 FATIGUE MANAGEMENT Shell Canada Road Transport Forum September 26, 2013 Bruce Adams, Regional Traffic Safety Consultant Alberta Office of Traffic Safety Copyright 2013 Definition The state of feeling very
Provincial Projections of Arthritis or Rheumatism, Special Report to the Canadian Rheumatology Association
 ARTHRITIS COMMUNITY RESEARCH & EVALUATION UNIT (ACREU) The Arthritis and Immune Disorder Research Centre Health Care Research Division University Health Network February, 2000 Provincial Projections of
Appendix B Fracture incidence and costs by province
 1 Appendix B Fracture incidence and costs by province Comprehensive, accurate fracture numbers and costs are very important data that could help with prioritization and allocation of health care resources.
Medical Aid in Dying A Year of Change
 Medical Aid in Dying A Year of Change Howard Lim, MD, PhD, FRCPC Chair, Gastrointestinal Tumour Group Program Director, Medical Oncology Residency Training Program Clinical Associate Professor, University
RECREATIONAL VEHICLES (WORKING GROUP SESSION)
") RECREATIONAL VEHICLES (WORKING GROUP SESSION) - 825 - - 826 - Fatal Recreational Vehicle Crashes and Alcohol in New Zealand: What does the data tell us? D.J.Begg Injury Prevention Research Unit, Dunedin
RECREATIONAL VEHICLES (WORKING GROUP SESSION) - 825 - - 826 - Fatal Recreational Vehicle Crashes and Alcohol in New Zealand: What does the data tell us? D.J.Begg Injury Prevention Research Unit, Dunedin
Mississippi. Data Sources:
 Data Sources: Multiple Cause of Death (MCOD) Files, 2009-2013, National Center for Health Statistics. The MCOD file is a census of all deaths in the U.S. and some territories. Five years data were combined
Canada s Inter agency Wild Bird Influenza Survey. Draft Proposal for the Survey Version 1 25 January 2010
 Canada s Inter agency Wild Bird Influenza Survey Draft Proposal for the 2010 11 Survey Version 1 25 January 2010 Introduction Canada s wild bird influenza survey has been carried out each year since 2005.
ABOUT FMC MEMBERSHIP:
 ABOUT FMC MEMBERSHIP: FMC and your provincial/territorial association are a part of a network of interdisciplinary professionals made up of private and court connected mediators, lawyers, social workers,
Organ Donation and Transplantation in Canada
 Organ Donation and Transplantation in Canada 216 System Progress Report Update Canadian Blood Services, 217. All rights reserved. Extracts from this report may be reviewed, reproduced or translated for
VACCINE COVERAGE IN CANADIAN CHILDREN
 VACCINE COVERAGE IN CANADIAN CHILDREN RESULTS FROM THE 2013 CHILDHOOD NATIONAL IMMUNIZATION COVERAGE SURVEY (CNICS) REVISED EDITION FEBRUARY 2017 PROTECTING AND EMPOWERING CANADIANS TO IMPROVE THEIR HEALTH
THE ROAD SAFETY MONITOR 2011 FATIGUED DRIVING TRENDS
 T R A F F I C I N J U R Y R E S E A R C H F O U N D A T I O N THE ROAD SAFETY MONITOR 2011 FATIGUED DRIVING TRENDS The knowledge source for safe driving The Traffic Injury Research Foundation The mission
Alcohol-Related Crashes Alcohol Overview
 Alcohol-Related Crashes Alcohol Overview In Pennsylvania, drinking and driving remains a top safety issue. In 2012, alcohol-related crashes increased to 11,956 from 11,805 alcohol-related crashes in 2011.
WEST NILE VIRUS AND OTHER MOSQUITO-BORNE DISEASE NATIONAL SURVEILLANCE REPORT
 WEST NILE VIRUS AND OTHER MOSQUITO-BORNE DISEASE NATIONAL SURVEILLANCE REPORT OCT 4 TO OCT 1, 215 REPORT WEEK 4 CANADA HUMANS During surveillance week 4, ending on Oct.1, 215, six (6) human clinical cases
EXAMINING THE USE OF WEB-BASED APPLICATIONS & TOOLS VIOLENCE AGAINST WOMEN TO RESPOND TO PREPARED BY: TRACY GIERMAN, ELYSE CRAGG AND JOYCE GOODHAND
 EXAMINING THE USE OF WEB-BASED APPLICATIONS & TOOLS TO RESPOND TO VIOLENCE AGAINST WOMEN PREPARED BY: TRACY GIERMAN, ELYSE CRAGG AND JOYCE GOODHAND FOR THE CANADIAN NETWORK OF WOMEN S SHELTERS & TRANSITION
CADTH Optimal Use Report
 Canadian Agency for Drugs and Technologies in Health Agence canadienne des médicaments et des technologies de la santé CADTH Optimal Use Report Pilot Project Guidance on 1.5 Tesla Magnetic Resonance Imaging
DRINKING AND DRIVING. Alcohol consumption, even in relatively small quantities, increases the risk of road crashes.
 DRINKING AND DRIVING Alcohol consumption, even in relatively small quantities, increases the risk of road crashes. Drinking diminishes some essential elements of safe driving, such as vision and reflexes,
West Nile virus and Other Mosquito-borne Diseases National Surveillance Report July 30 to August 5, 2017 (Week 31)
") West Nile Virus West Nile virus and Other Mosquito-borne Diseases National Surveillance Report July 3 to August 5, 217 (Week 31) Canada Humans During week 31, July 3 to August 5, 217, the Public Health
West Nile Virus West Nile virus and Other Mosquito-borne Diseases National Surveillance Report July 3 to August 5, 217 (Week 31) Canada Humans During week 31, July 3 to August 5, 217, the Public Health
Poison Control Centres
 Poison Control Centres Monica Durigon Field Epidemiologist Public Health Agency of Canada Joanne Stares Public Health Officer Public Health Agency of Canada Placement site: BC Centre for Disease Control
Recently, the Institute of Musculoskeletal Health and
 S P E C I A L F E A T U R E Are the Results of Dental Research Accessible to Canadian Dentists? Christophe Bedos, DCD, PhD Paul Allison, BDS, FDSRCS, PhD A b s t r a c t The aim of this joint CDA IMHA
Health Canada Endorsed Important Safety Information on Infanrix Hexa
 Health Canada Endorsed Important Safety Information on Infanrix Hexa October 30, 2012 Dear Health Care Professional: Subject: Voluntary recall of GlaxoSmithKline (GSK) Infanrix Hexa Vaccine Lot A21CB242A
Health Interventions in Ambulatory Cancer Care Centres
 ENVIRONMENTAL SCAN Health Interventions in Ambulatory Cancer Care Centres Context Cancer a complex, chronic condition will affect an estimated two in five Canadians in their lifetime. 1 Cancer requires
COLLABORATIVE STAGE TRAINING IN CANADA
 COLLABORATIVE STAGE TRAINING IN CANADA CANADIAN COUNCIL OF CANCER REGISTRIES DATA AND QUALITY MANAGEMENT COMMITTEE PRESENTATION NAACCR CONFERENCE JUNE 14, 2006 Regina, Saskatchewan Canada Ingrid Friesen
Review: Ontario Strategy to Prevent Opioid Addiction and Overdose
 Review: Ontario Strategy to Prevent Opioid Addiction and Overdose April 2017 73 Queen Street North, Kitchener, Ontario N2H 2H1 www.preventingcrime.ca The Waterloo Region Crime Prevention Council (WRCPC)
Canadian Organ Replacement Register Annual Report. Treatment of End-Stage Organ Failure in Canada, 2000 to 2009
 Canadian Organ Replacement Register Annual Report Treatment of End-Stage Organ Failure in Canada, 2000 to 2009 January 2011 Who We Are Established in 1994, CIHI is an independent, not-for-profit corporation
INVOLVEMENT OF DRUGS IN ACCIDENT CAUSATION
 INVOLVEMENT OF DRUGS IN ACCIDENT CAUSATION Jim GEROSTAMOULOS, Helen BATZIRIS, Olaf H. DRUMMER Victorian Institute of Forensic Medicine and Department of Forensic Medicine, Monash University, Southbank,
TUBERCULOSIS IN CANADA 2010 PRE-RELEASE
 TUBERCULOSIS IN CANADA 2010 PRE-RELEASE Our mission is to promote and protect the health of Canadians through leadership, partnership, innovation and action in public health. - Public Health Agency of
Antimicrobial Resistant Organisms (ARO) Surveillance SURVEILLANCE REPORT FOR DATA FROM JANUARY TO DECEMBER
 Surveillance SURVEILLANCE REPORT FOR DATA FROM JANUARY TO DECEMBER") Antimicrobial Resistant Organisms (ARO) Surveillance SURVEILLANCE REPORT FOR DATA FROM JANUARY 1 2007 TO DECEMBER 31 2011 TO PROMOTE AND PROTECT THE HEALTH OF CANADIANS THROUGH LEADERSHIP, PARTNERSHIP,
Antimicrobial Resistant Organisms (ARO) Surveillance SURVEILLANCE REPORT FOR DATA FROM JANUARY 1 2007 TO DECEMBER 31 2011 TO PROMOTE AND PROTECT THE HEALTH OF CANADIANS THROUGH LEADERSHIP, PARTNERSHIP,
Supply, Distribution and Migration of Canadian Physicians, 2010
 Supply, Distribution and Migration of Canadian Physicians, 2010 Spending and Health Workforce Who We Are Established in 1994, CIHI is an independent, not-for-profit corporation that provides essential
The Worldwide Decline in Drinking and Driving
 The Worldwide Decline in Drinking and Driving Barry M. Sweedler National Transportation Safety Board, 490 L Enfant Plaza, S.W., Washington, DC 20594 USA ABSTRACT At a session conducted at the Traffic Safety
The British Columbia Coroners Service is committed to conducting a thorough, independent examination of the factors contributing to death in order to
 The British Columbia Coroners Service is committed to conducting a thorough, independent examination of the factors contributing to death in order to improve community safety and quality of life in the
Trends in adult obesity
 53 by Margot Shields and Michael Tjepkema Keywords: body mass index, body weight, income, smoking In recent years, the percentage of Canadian adults with excess weight has increased considerably, part
4/27/2016. About CCSA. Impaired Driving Research at CCSA. Background. Presentation Overview. Lessons Learned
 About CCSA Drug-Impaired Driving i in Canada: Lessons Learned International Conference on Urban Traffic Safety Amy Porath-Waller, Ph.D. April 26, 2016 CCSA is Canada s only agency with a legislated national
COMPUS OPTIMAL THERAPY REPORT. Supporting Informed Decisions. À l appui des décisions éclairées
 OPTIMAL THERAPY REPORT COMPUS Volume 1, Issue 6 March 2007 Gap Analysis Report for the Prescribing and Use of Proton Pump Inhibitors (PPIs) Supporting Informed Decisions À l appui des décisions éclairées
Drug-Impaired Driving in the United States
 Drug-Impaired Driving in the United States What is the Drug-Impaired Driving Learning Centre (DIDLC)? The Drug Impaired Driving Learning Centre (DIDLC) is a fully bilingual, web-based educational resource
LIST OF FIGURES INTRODUCTION
 SUPPLEMENT: 2017 INTRODUCTION This document is a supplement to the PMPRB publication Market Intelligence Report: Biologic Response Modifier Agents, 2015 1 produced under the NPDUIS initiative. The supplement
Delaware. Data Sources:
 Data Sources: Multiple Cause of Death (MCOD) Files, 2009-2013, National Center for Health Statistics. The MCOD file is a census of all deaths in the U.S. and some territories. Five years data were combined
Alcohol and Drug Use among Fatally Injured Pedestrians Involved in Motor Vehicle Accidents
 Alcohol and Drug Use among Fatally Injured Pedestrians Involved in Motor Vehicle Accidents Norlen Mohamed, Wahida Ameer Batcha, Mohamad Suffian Ahmad, Aimi Mohd Fahmi, Ilhamah Othman Vehicle Safety and
Initial Report of Oregon s State Epidemiological Outcomes Workgroup. Prepared by:
 Alcohol Consumption and Consequences in Oregon Prepared by: Addictions & Mental Health Division 5 Summer Street NE Salem, OR 9731-1118 To the reader, This report is one of three epidemiological profiles
A jurisdictional review of the legislation governing informed consent by chiropractors across Canada
 ISSN 0008-3194 (p)/issn 1715-6181 (e)/2015/73 80/$2.00/ JCCA 2016 A jurisdictional review of the legislation governing informed consent by chiropractors across Canada Pierre B. Boucher, DC, PhD 1 Danica
Traffic-Related Air Pollution
 Traffic-Related Air Pollution Michael Brauer School of Population and Public Health The University of British Columbia OEMAC 30 th Annual Scientific Conference, October 1-2, 2012 Sheraton Vancouver Wall
Worldwide Trends in Drinking and Driving: Has the Progress Continued?
 Worldwide Trends in Drinking and Driving: Has the Progress Continued? B. M. Sweedler Safety and Policy Analysis International, Lafayette, California, USA. Keywords Drinking and Driving, worldwide trends
Alcohol involvement in pedestrian accidents in France
 Alcohol involvement in pedestrian accidents in France Helene FONTAINE and Yves GOURLET INRETS, 94114 Arcueil, Cedex, FRANCE For 25 years the number o f pedestrians killed on the roads has decreased in
Getting to Zero Alcohol- Impaired Driving Fatalities: A Comprehensive Approach to a Persistent Problem
 Getting to Zero Alcohol- Impaired Driving Fatalities: A Comprehensive Approach to a Persistent Problem Lifesavers Conference Impaired Driving: Come Hear the Results Making Progress in Eliminating Impaired
Developments in Canadian community-based driving initiatives: MADD Canada s Campaign 911
 Developments in Canadian community-based driving initiatives: MADD Canada s Campaign 911 Robert Solomon and Erika Chamberlain, Faculty of Law, Western University Abstract Context Despite numerous federal,
Tobacco Use in Canada: Patterns and Trends
 Tobacco Use in Canada: Patterns and Trends 21 EDITION University of Waterloo Waterloo, Ontario www.tobaccoreport.ca Tobacco Use in Canada: Patterns and Trends 21 Edition This report was prepared by Jessica