Childhood Injury Deaths in Baltimore City
|
|
|
- Magdalene Simon
- 6 years ago
- Views:
Transcription
1 Childhood Injury Deaths in Baltimore City A Report from the Office of Epidemiology and Planning Baltimore City Health Department Prepared for the Baltimore City Child Fatality Review Team February 7, 2008
2 Table of Contents ACKNOWLEDGEMENTS... 2 EXECUTIVE SUMMARY... 3 INTRODUCTION... 4 METHODS... 4 RESULTS... 4 TRENDS IN CHILDHOOD INJURIES OVER TIME... 4 MANNER OF CHILD INJURY DEATHS... 5 COMPARISONS TO MARYLAND AND THE US... 5 TRENDS BY MANNER OF DEATH... 7 AGE... 7 TRENDS BY GENDER... 9 TRENDS BY RACE/ETHNICITY HOMICIDE ACCIDENT DEATHS LOCATION OF INJURY DEATHS SUMMARY DATA APPENDIX TECHNICAL APPENDIX
3 Acknowledgements Many people contributed to this report. Noah Schwartz, a 2007 Mayoral Fellow at the Baltimore City Health Department, and Alisa Ames analyzed the data and wrote the report in collaboration with Caroline Fichtenberg PhD, Chief Epidemiologist at the Baltimore City Health Department. Dana Kaplin, Assistant Commissioner of Maternal and Child Health and Shaconna Gorham maintain the Child Fatality Review database at the Health Department and provided much support and feedback. Cheryl Tracy and Antoinette Johnson maintain the death records at the Baltimore City Health Department. The Health Department thanks the entire Child Fatality Review Team and Cindy Feldstein of the Office of the Chief Medical Examiner for their help in compiling the data for this report. Special thanks go to Donna Becker (a member of the Child Fatality Review and the Director of The Center for Infant and Child Loss) for her helpful feedback. Child Fatality Review Team Since 2001, the Baltimore City Health Department has chaired a coalition of city and state agencies called the Child Fatality Review (CFR). This multi-disciplinary team meets once a month to discuss preventable deaths of Baltimore City children younger than 18 years old. Through these case-by-case reviews, the CFR identifies factors that contributed to these deaths and develops recommendations for preventing similar deaths in the future. The Maryland Child Fatality Review Team oversees the CFR teams in local jurisdictions, including Baltimore City. Baltimore City s CFR team members represent many city agencies including: Baltimore City Health Department, Office of the Chief Medical Examiner, Baltimore City Police Department, Baltimore City Fire Department, Baltimore City Department of Social Services, Department of Juvenile Services; State s Attorney Office, and Baltimore City Public School System. The team also includes experts in child health advocacy. About the Office of Epidemiology and Planning This is a new office at the Baltimore City Health Department responsible for overseeing collection and analysis of data to assist with program planning and evaluation and policy development. It is led by Caroline Fichtenberg, a Ph.D. epidemiologist with a joint appointment at the Johns Hopkins Bloomberg School of Public Health. The office reports to the Commissioner of Health. Recommended Citation Office of Epidemiology and Planning, Baltimore City Health Department. Childhood Injury Deaths in Baltimore City, Baltimore City, Maryland: Baltimore City Health Department. February Electronic Access This publication can be accessed electronically at 2
4 Executive Summary Injuries are the leading cause of death among children nationwide. Many, if not all of those deaths are preventable. Using data from the Office of the Chief Medical Examiner (OCME) and the Maryland Department of Health and Mental Hygiene s Vital Statistics Administration, this report takes a retrospective look at injury deaths among Baltimore City children aged 1 to 17 from 2002 through On average, 46 children aged 1 to 17 died from injuries in Baltimore City each year from 2002 to The number of deaths ranged from 24 to 64 per year. Children were twice as likely to die in Baltimore as in Maryland or the nation as a whole. The rate of injuries among children aged 1 to 17 in Baltimore from was 30.7 per 100,000 children as compared to 14.4 per 100,000 children in Maryland and 14.7 per 100,000 children in the nation as a whole. The majority of injury deaths in children were due to homicides. From , 59% of deaths among children aged 1 to 17 in Baltimore were due to homicides; while 35% were due to accidents, 4% to suicides, and 2% were of undetermined intent. Motor vehicle-related accidents accounted for almost 40% of accidental child injury deaths. The next most common cause of accidental child injury death in Baltimore City was thermal injuries sustained in residential fires (27% of accidental child injury deaths). Baltimore children were more than eight times as likely to die from homicide and more than four times as likely to die from residential fires as children nationwide, but a third less likely to die from motor-vehicle related accidents. Comparing Baltimore to the US as whole, the child homicide rate was 18.1 per 100,000 children as compared to 2.2 per 100,000; the rate of child residential fire deaths was 2.9 per 100,000 as compared to 0.7 per 100,000; and the rate of motor vehicle-related deaths was 4.3 per 100,000 as compared to 6.4 per 100,000. The child injury death rate in Baltimore City declined 29% from 2002 to Accidental injury deaths dropped by 52% from 2002 to Child homicide rates declined by 25% from 2002 to 2006, with a particularly pronounced decline in 2005 followed by an increase in Older, African American, and male children were more likely to die of injuries in Baltimore in Children in the year age group had a death rate of per 100,000 children; a rate 3 times higher than the age group with the next highest rate of injury deaths (13-15 year olds). African American children were more than twice as likely to die of injuries compared to other children, largely because they were more likely to be victims of homicide. Male children were more than three times more likely to die of injuries than female children. Male injury fatality rates exceeded female rates for all manners of injury. 3
5 Introduction Injuries are the leading cause of death among children in the United States. Many, if not all, of these deaths are preventable. This report from the CFR team takes a retrospective look at injury deaths among Baltimore City children aged 1 to 17 from 2002 through It examines the causes of these deaths and the demographic characteristics of the victims, presents trends over the past five years, and compares Baltimore City rates to state and national rates. Methods Data for this analysis comes from reports on child injury deaths completed by the Office of the Chief Medical Examiner (OCME) and from death certificates maintained by the Baltimore City Health Department. These data were reconciled with information from the Maryland Department of Health and Mental Hygiene s Vital Statistics Administration. Only injury deaths among children aged 1 to 17 living in Baltimore City were included in this analysis. Deaths were considered to be injury deaths if they included an International Classification of Disease Code consistent with intentional or unintentional injury (see Technical Appendix for details). Injury deaths were further subdivided by manner of death: accidents, homicide, suicide, or undetermined. Injury death rates were calculated for Baltimore City as a whole, and for the gender, race/ethnicity, and age subgroups using population estimates from the National Center for Health Statistics. These rates were aggregated to the census tract level and mapped using ArcGIS software. Rates for Maryland and the US were obtained from the Web-based Injury Statistics Query and Reporting System (WISQARS), which is maintained by the National Center for Injury Prevention and Control (NCIPC) at the Centers for Disease Control and Prevention (CDC). (See Technical Appendix for details). Results Trends in childhood injuries over time Between 2002 and 2006 a total of 229 children aged 1-17 died in Baltimore of intentional or unintentional injuries, for an average of 46 deaths per year. This corresponds to an injury death rate of 30.7 per 100,000 children. The injury death rate declined 29% from : from 43.0 deaths per 100,000 children in 2002 to 30.5 deaths in 2006 (Figure 1). 4
6 Figure 1. Injury Death Rates among Children (1-17 years), Baltimore City, Number of Child Injury Deaths per Year Year Deaths per 100,000 Children per Year Manner of child injury deaths Homicides were by far the most common type of fatal injury among Baltimore City children during the study period, accounting for 59% of the injury deaths. Accidents (including but not limited to motor vehicle accidents) accounted for 35% of the injury deaths, 4 % were suicides, and 2% were deaths of undetermined manner (Figure 2). Homicide 59% Suicide 4% Accident 35% Undetermined 2% Figure 2. Percent of Injury Deaths due to Homicide, Accident, Suicide, or Injury of an Undetermined Manner among Baltimore City Children (1-17 years), Comparisons to Maryland and the US In this time period, Baltimore City children aged 1 to 17 years suffered fatal injuries about twice as frequently as in Maryland or the United States as a whole (Figure 3). 5
7 Figure 3. Child Injury Death Rates in Baltimore City, Maryland and the United States 1 Deaths per 100,000 Children per Year Baltimore ( ) Maryland ( ) US ( ) This disparity was largely due to the higher rate of child homicides in Baltimore City the child homicide rate in Baltimore City was almost five times higher than the Maryland rate and over eight times higher than the national rate for comparable periods of time (Figure 4). The rate of fatal accidents, suicides and deaths of undetermined manner were comparable to state and national rates. Figure 4. Comparison of Injury Deaths among Children (1-17 years) by Manner of Death, Baltimore City vs. Maryland and the United States Deaths per 100,000 Children per Year Baltimore Maryland US Accident Homicide Suicide Undetermined Manner of Death 1 Centers for Disease Control and Prevention, National Center for Injury Prevention and Control. Web-based Injury Statistics Query and Reporting System (WISQARS) [online]. (2005) [accessed January 28, 2008]. Available from URL: 6
8 Trends by manner of death In Baltimore City, both homicide and accidental injury death rates decreased between 2002 and 2006 (Figure 5). The child homicide rate dropped sharply in 2005, followed by an increase in Overall, from 2002 to 2006, rates of child homicide in Baltimore City decreased from 26.2 per 100,000 to 19.7 per 100,000 children, a decline of 25%. The accidental injury death rate decreased 52% from 14.1 per 100,000 in 2002 to 6.8 per 100,000 children in Rates of child suicide and injury deaths of an undetermined manner were low and remained relatively constant over the study period. Figure 5. Trends in Injury Death Rates among Children (1-17 years) by Manner of Death and Year, Baltimore City 30 Deaths per 100,000 Children Accident Homicide Suicide Undetermined Age Suicide and homicide deaths occurred most frequently among older children the median ages of death were 14 and 16 years, respectively (Table 1). The majority of child homicide deaths (82%) were among children 14 years and older. Undetermined deaths occurred among younger children (median age of 4.5 years) and accident deaths occurred more often among adolescents (median age of 11 years). Manner of Injury Death Median Age (years) Homicide 16 Accident 11 Suicide 14 Undetermined 4.5 All Injury Deaths 15 Table 1. Median Age of Occurrence by Manner of Child Injury Deaths, Baltimore City,
9 From 2002 to 2006, Baltimore City children in the oldest age group (16-17 years) had a death rate of per 100,000 children (Figure 6). This rate is 3 times higher than the group with the next highest rate (children years, who had a rate of 34.2 per 100,000 children). The lowest rate of injury deaths was among children ages 4-5 years (11.8 per 100,000 children). Figure 6. Injury Death Rates of Children (1-17 years) by Age Group, Baltimore City, age Age Group age 4-5 age 6-9 age age age Death Rate per 100,000 Children per Year The high rate of injury deaths among children ages 16 to 17 was driven by homicides (figure 7). Figure 7. Injury Death Rates of Children (1-17 years) by Manner of Death and Age Group, Baltimore City, Deaths per 100,000 Children per Year age 1-3 age 4-5 age 6-9 age age age Accidents Undetermined Homicide Suicide Trends by gender Between 2002 and 2006, a total of 178 male children and 51 female children died from injuries. Male children were more than three times as likely to die from injuries than female children; 8
10 male deaths occurred at a rate of 47.0 per 100,000 male children, compared to 13.9 deaths per 100,000 female children (Figure 7). Figure 7. Injury Death Rates of Children (1-17 years) by Gender, Baltimore City, Gender Female Male Deaths per 100,000 Children per Year For every manner of injury, males had a higher rate of death than females (Figure 8). Males were 5 times more likely than females to be a victim of homicide, and were 2 times more likely to suffer fatal accidents. Figure 8. Injury Death Rates of Children (1-17 years) by Manner of Death and Gender, Baltimore City, Deaths per 100,000 Children per Year Male 14.5 Female Accident Homicide Suicide Undetermined Manner of Death Trends by race/ethnicity Between 2002 and 2006, the injury death rate of non-hispanic black children was more than twice that of other children (Figure 9). In this period, there were few injury deaths among Hispanic children and children of other races. All of the deaths among these children were due to homicide. 9
11 Figure 9. Injury Death Rates of Children (1-17 years) by Race/Ethnicity, Baltimore City, Race/Ethnicity Black Non-Hispanic White Non-Hispanic All Others Deaths per 100,000 Children per Year Black non-hispanic children had higher death rates than white non-hispanic for every manner of fatal injury except suicide (Figure 10). Black non-hispanic children were almost 6 times more likely than white non-hispanic children to be the victim of a homicide, and were slightly (1.2 times) more likely to suffer a fatal accident. Figure 10. Injury Death Rates of Children (1-17 years) by Manner of Death and Race/Ethnicity, Baltimore City, Deaths per 100,000 Children per Year Black Non-Hispanic White Non-Hispanic 11.6 All Others Accident Homicide Suicide Undetermined Manner of Death In 2005, the year that the overall child homicide rate dropped sharply, the disparity between the black and white injury death rates disappeared (Figure 11). This finding suggests that homicides account for much of the disparity between the injury death rates of black and white children. 10
12 Figure 11. Trends in Injury Death Rates of Children (1-17 years) by Race/Ethnicity and Year, Baltimore City, Deaths per 100,000 Children Black Non-Hispanic White Non-Hispanic Homicide Homicide accounted for almost 60% of injury deaths among Baltimore City children from Of the 135 child homicides that occurred during this period, 93 (66%) occurred by gunshot (Figure 12). Figure 12. Homicides Deaths among Children (1-17 years) by Manner, Baltimore City, Gunshot 65.5 Manner of Homicide Stabbing Blunt force injury Arson Asphyxiation Other Missing Percent of Homicides Cause of Accident Deaths Accidents were the most common type of injury deaths among children in Maryland and the United States during Motor vehicle-related deaths accounted for nearly half of all 11
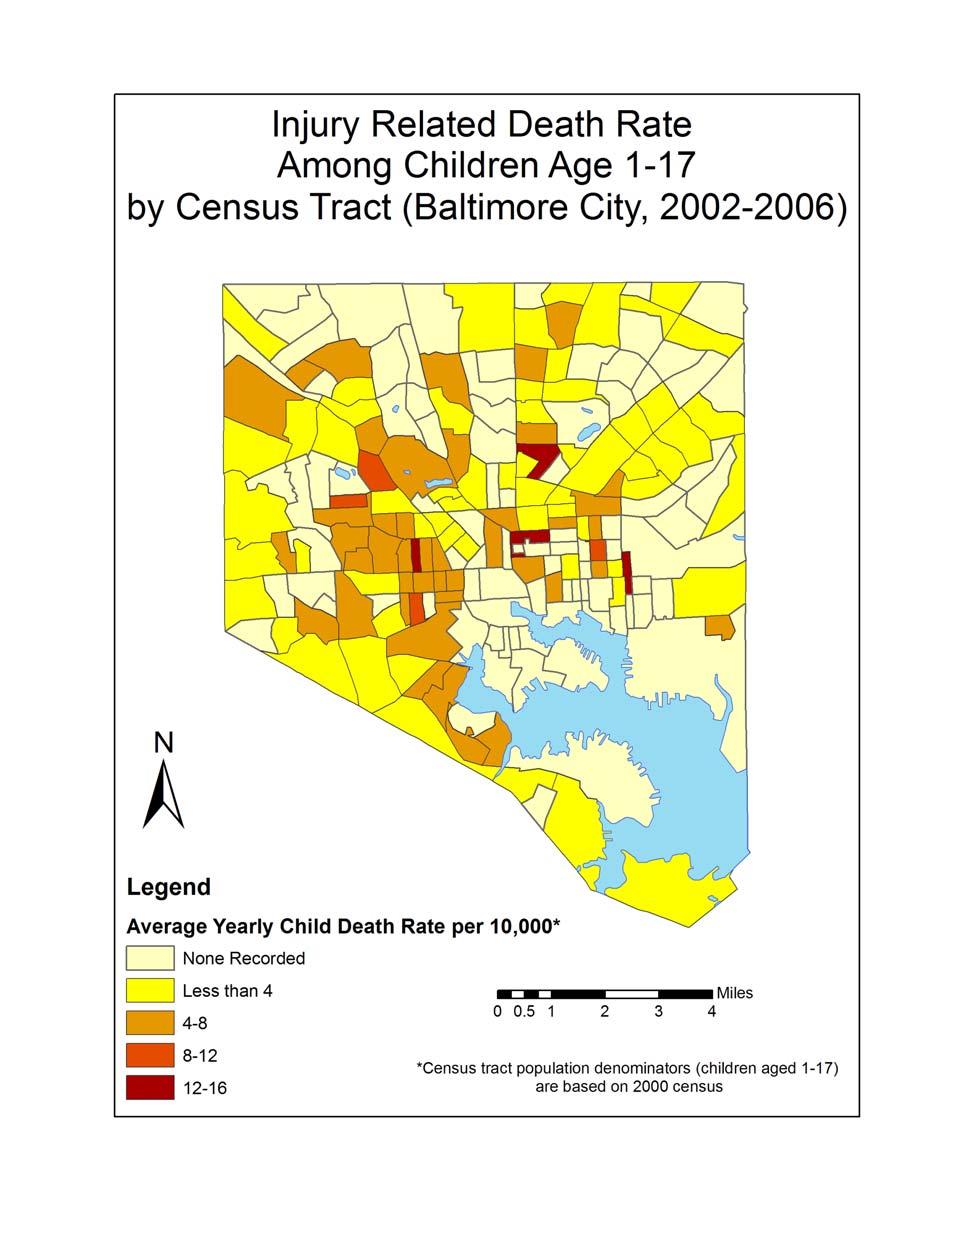
13 child injury deaths nationwide during this period. 1,2 In Baltimore City during , 35% of child injury deaths were the result of accidents. Among these accidental child injury deaths, almost 40% were motor vehicle-related (Table 2). The rate of motor vehicle-related child deaths in Baltimore City from was below the national rate during the time period from (4.3 per 100,000 vs. 6.4 per 100,000). Over a quarter of the accidental child injury deaths during this period were the result of thermal injuries sustained in residential fires. The rate of child residential fire deaths for the years 2002 to 2006 in Baltimore City was over 4 times the national rate during the time period from 2002 to 2005 (2.9 per 100,000 vs. 0.7 per 100,000 children). Young children were at greatest risk all thermal injury deaths occurred among children between the ages of 1-13 and 73% occurred among children between the ages of 1-7. The majority (72%) of these deaths occurred among boys and 82% of thermal injury deaths occurred in black non-hispanic children. Cause of Accident Deaths Count Percent Rate* Motor Vehicle-Related Deaths 32 39% Pedestrian/Pedal Cyclist Struck 19 23% Motor Vehicle and Other Transportation 13 16% 1.7 Residential Fires 22 27% 2.9 Drowning 11 14% 1.5 Asphyxia 5 6% 0.7 Other 11 14% 1.5 Total * per 100,000 Children per year Table 2. Accidental Deaths among Children age 1-17 years, Baltimore City, Location of Injury Deaths The following maps display rates of child injury deaths from aggregated by census tract in Baltimore City. 2 Miniño AM, Anderson RN, Fingerhut LA, Boudreault MA, Warner M. Deaths: Injuries, National vital statistics reports; vol 54 no 10. Hyattsville, Maryland: National Center for Health Statistics
14 13
15 14
16 15
17 Summary Despite declining by 30% from 2002 to 2006, injury death rates among Baltimore City children aged 1 to 17 years were twice as high over that period as those in Maryland and the United States. Most of this disparity was due to the high rate of child homicide in Baltimore. Deaths due to homicide accounted for 60% of injury deaths among Baltimore children, and the rate of death in Baltimore was more than eight times higher than in the U.S. as a whole. Although deaths due to fires accounted for only 10% of all injury deaths among children in the city, proportionally to the population size these deaths occurred more than four times more frequently in Baltimore than in the nation as a whole. In contrast, Baltimore children were less likely than children nationwide to die from motor vehicle-related accidents. Older male African American children were the most likely to die from injuries, largely because they were the most likely to be victims of homicide. As evidenced by what happened in 2005, decreasing the homicide rate would likely reduce or eliminate racial/ethnic disparities in childhood injury deaths. Identifying the causes of the reduction in child homicides in 2005 requires further investigation. The Baltimore City Child Fatality Review team supports further data analysis to characterize the causes of preventable child fatalities and to develop interventions to prevent these deaths. 16
18 Data Appendix Appendix Table 1: Child injury deaths and death rates per 100,000 children by manner and year, Baltimore City Year of Death Manner of Death Accident Deaths Rate Homicide Deaths Rate Suicide Deaths Rate Undetermined Deaths Rate All Manners Deaths Rate Appendix Table 2: Child injury deaths and death rates per 100,000 children by gender and year, Baltimore City Year of Death Gender Male Deaths Rate Female Deaths Rate Appendix Table 3: Child injury deaths and death rates per 100,000 children by race/ethnicity and year, Baltimore City Year of Death Race/Ethnicity Black Non-Hispanic Deaths Rate White Non-Hispanic Deaths Rate All Others Deaths Rate Technical Appendix Data sources Child Injury Deaths The Baltimore City Child Fatality Review Team reviews all preventable deaths among Baltimore City children under the age of 18. Data for this analysis come from reports on child injury deaths completed by the Office of the Chief Medical Examiner (OCME) and from death certificates maintained by the Baltimore City Health Department. Death certificates for resident children 17
19 who die in the city are collected and maintained by the Baltimore City Health Department. A staff nosologist assigns a code for the underlying cause of death recorded on each death certificate, using the International Classification of Diseases, Tenth Revision (ICD-10). If the child died outside of Baltimore City, the underlying cause of death is recorded by the Maryland Department of Health and Mental Hygiene s Vital Statistics Administration. In order to identify any child injury deaths that may have been excluded from review by the CFR, the data were compared with the death database maintained by the Vital Statistics Administration. Only 8 children were added (most of these deaths occurred in 2002) and 6 deaths were excluded because they were determined not to be residents of Baltimore City. Both the cause and the manner of a child are important in classifying injury deaths. For the years , injury deaths of children 1-17 years of age were identified by ICD-10 codes corresponding to deaths from injuries and other external causes (this includes codes V01-V99, W00-W99, X00-99, and Y00-Y89). In general, the manner of injury death is categorized as either intentional (homicides or suicides), unintentional (i.e. motor vehicle accidents), or of undetermined intent. Demographic and injury information for this analysis were abstracted from OCME reports and death certificates. Data on race and ethnicity were analyzed in three categories: Black non- Hispanic, white non-hispanic, and other. The latter category includes children of other races (including Asian, American Indian or Alaska Native, and Native Hawaiian and Other Pacific Islander) as well as children of Hispanic ethnicity. Population Denominators Injury death rates were calculated using postcensal bridged-race population estimates produced by the CDC s National Center for Health Statistics (NCHS) in collaboration with the U.S. Census Bureau. These population estimates were obtained through the CDC s Wide-Ranging Online Data for Epidemiologic Research (WONDER) system, Bridged-Race Population Estimates (Vintage 2006) database ( Data accessed January, Maryland and United States Comparison Data State and national data on child injury deaths for the years were obtained from the Web-based Injury Statistics Query and Reporting System (WISQARS, National Center for Injury Prevention and Control (NCIPC), Centers for Disease Control and Prevention (CDC). Data accessed January, Data analysis CFR data collected by the Baltimore City Health Department are stored in a Microsoft Excel spreadsheet. Analyses were performed using Microsoft Excel 2003 and STATA 10. Maps were produced using ESRI s (Environmental Systems Research Institute) ArcMap v
STUDENT KATHERINE OSTBYE MPH 2009 PRECEPTOR CAROLINE FICHTENBERG, PHD
 Baltimore City Health Department Unintentional Injury Mortality Needs Assessment STUDENT KATHERINE OSTBYE MPH 2009 PRECEPTOR CAROLINE FICHTENBERG, PHD Unintentional Injury Mortality Review Maryland Vital
2015 United States Fact Sheet
 Fact Sheet Unintentional injuries and violence are the leading causes of death, hospitalization, and disability for children ages -. This fact sheet provides a state snapshot of data on the injury-related
Injury Surveillance Program, Massachusetts Department of Public Health Fall 2017
 Number of Deaths Injury Surveillance Program, Massachusetts Department of Public Health Fall 217 Suicide and self-inflicted injuries are a significant yet largely preventable public health problem. The
7. Injury & Violence. pg : Unintentional injury hospitalizations. pg : Mortality from unintentional injuries
 7. pg 124-125: Unintentional injury hospitalizations pg 126-131: Mortality from unintentional injuries pg 132-133: Unintentional injury mortality trends pg 134-135: Hospitalizations for homicide pg 136-137:
Alaska Native Injury Atlas of Mortality and Morbidity. Prepared by: The Injury Prevention Program and the Alaska Native Epidemiology Center
 Alaska Native Injury Atlas of Mortality and Morbidity Prepared by: The Injury Prevention Program and the Alaska Native Epidemiology Center Alaska Native Tribal Health Consortium January 2008 Acknowledgements
Demographics and Health Data
 Demographics and Health Data Information for Local Planners City of Lakewood, WA Demographic Characteristics Environmental Health Division 3629 South D Street, Tacoma, WA 98418 (253) 798-6470 Table 1 presents
National Vital Statistics Reports
 National Vital Statistics Reports Volume 65, Number 4 June 30, 2016 Deaths: Final Data for 2014 by Kenneth D. Kochanek, M.A., Sherry L. Murphy, B.S., Jiaquan Xu, M.D., and Betzaida Tejada-Vera, M.S., Division
Demographics and Health Data
 Demographics and Health Data Information for Local Planners City of Puyallup, WA Demographic Characteristics Environmental Health Division 3629 South D Street, Tacoma, WA 98418 (253) 798-6470 Table 1 presents
THE HEALTH OF LINN COUNTY, IOWA A COUNTYWIDE ASSESSMENT OF HEALTH STATUS AND HEALTH RISKS
 THE HEALTH OF LINN COUNTY, IOWA A COUNTYWIDE ASSESSMENT OF HEALTH STATUS AND HEALTH RISKS Project Team Pramod Dwivedi, Health Director Amy Hockett, Epidemiologist Kaitlin Emrich, Assessment Health Promotion
Multnomah County: Leading Causes of Death
 Leading causes of death are presented in this report by gender and race/ethnicity. Mortality data is based on the Death Certificate statistical file provided by the Center for Health Statistics, Oregon
Winnebago County Homicide and Suicide Trends and Disparities Winnebago County Health Department
 2013 1968-2010 Winnebago County Homicide and Suicide Trends and Disparities Winnebago County Health Department Prepared by Jeffrey B. Wang, J. Maichle Bacon January 2013 Table of Contents Abstract... 2
Deaths in Hawaii Due to Major Cardiovascular Disease
 in Hawaii Due to Major Cardiovascular Disease Death Counts, Age-Adjusted Mortality Rates, and Years of Potential Life Lost for Coronary Heart Disease for the State of Hawaii (Residents Only), by State,
SUICIDE IN SAN DIEGO COUNTY:
 SUICIDE IN SAN DIEGO COUNTY: 1998-2007 www.sdchip.org Contents www.sdchip.org SUICIDE IN SAN DIEGO COUNTY: 1998-2007 CHIP's Message Dear Reader, Community Health Improvement Partners (CHIP) is pleased
7. Injury and Violence
 7. Injury and Violence 100: Domestic and Intimate Partner Violence Screening 102: Causes of Unintentional Injury Deaths 104: Mortality from Unintentional Injuries 106: Unintentional Injury Mortality Across
Chapter 14. Injuries with a Focus on Unintentional Injuries & Deaths
 Chapter 14 Injuries with a Focus on Unintentional Injuries & Deaths Learning Objectives By the end of this chapter the reader will be able to: Define the term intentionality of injury Describe environmental
Leading causes of death among Minneapolis residents,
 Leading causes of death among Minneapolis residents, 2005-2014 Leading causes of death in Minneapolis and the U.S. March 2016 Final Report (Revised May 2016) T he five leading causes of death among Minneapolis
2013 Youth Suicide Report
 New Jersey Department of Children and Families 2013 Youth Suicide Report Data Overview and Recommendations on Youth Suicide in New Jersey Allison Blake, Ph.D., L.S.W. Commissioner Table of Content Executive
WASHINGTON STATE COMPARISONS TO: KITSAP COUNTY CORE PUBLIC HEALTH INDICATORS May 2015
 WASHINGTON STATE COMPARISONS TO: KITSAP COUNTY CORE PUBLIC HEALTH INDICATORS This is a companion document to the Core Public Health Indicators that provides a comparison of to Washington State for the
Injury & Violence in Bernalillo County. Theresa Cruz, PhD February 26, 2013
 Injury & Violence in Bernalillo County Theresa Cruz, PhD February 26, 2013 If today should turn out to be an average day in the U.S. 493 people will die of injuries 7,700 people will be discharged from
Summit County Public Health
 Page 1 Death and Life Expectancy Summit County Public Health Population Health Vital Statistics Brief: VOLUME 1: DEATH AND LIFE EXPECTANCY Summit County Public Health Population Health Division 1867 W.
LEADING CAUSES OF DEATH, EL DORADO,
 LEADING CAUSES OF DEATH, EL DORADO, 2006-2010 EL DORADO COUNTY HEALTH SERVICES DEPARTMENT DIVISON OF PUBLIC HEALTH Date: 05/12/2011 CREATED BY OLIVIA BYRON-COOPER, MPH EPIDEMIOLOGIST LEADING CAUSES OF
TRAUMATIC BRAIN INJURIES ARIZONA RESIDENTS 2013
 TRAUMATIC BRAIN INJURIES ARIZONA RESIDENTS 2013 Resources for the development of this report were provided through funding to the Arizona Department of Health Services from the Centers for Disease Control
INTOXICATION DEATHS ASSOCIATED WITH DRUGS OF ABUSE OR ALCOHOL BALTIMORE, MARYLAND QUARTERLY REPORT: SECOND QUARTER, 2008
 INTOXICATION DEATHS ASSOCIATED WITH DRUGS OF ABUSE OR ALCOHOL BALTIMORE, MARYLAND QUARTERLY REPORT: SECOND QUARTER, 28 A report from the Office of Epidemiology and Planning Baltimore City Health Department
Magnitude and Trends in Cocaine, Other Psychostimulant, and Benzodiazepine-related Poisoning Deaths Massachusetts Residents,
 Magnitude and Trends in Cocaine, Other Psychostimulant, and Benzodiazepine-related Poisoning Deaths Massachusetts Residents, 2000-2009 Holly Hackman, MD, MPH Jeanne Hathaway, MD, MPH Massachusetts Department
Suicide In Indiana. Overview HIGHLIGHTS: Charlene Graves, M.D. Medical Director ISDH Injury Prevention Program
 Suicide In Indiana Charlene Graves, M.D. Medical Director ISDH Injury Prevention Program Sandra Beck ISDH Injury Prevention Program Epidemiologist The newly established Injury Prevention Program at the
NORTH CAROLINA 2016 CHILD DEATH DATA
 NORTH CAROLINA 2016 CHILD DEATH DATA October 25, 2017 Kella Hatcher, Executive Director, NC Child Fatality Task Force Dr. Stephanie Watkins, MCH Epidemiologist, NC Division of Public Health CFTF AND CHILD
Preventable Child Mortality in Massachusetts. State Child Fatality Review Team Legislative Briefing March 2012
 Preventable Child Mortality in Massachusetts State Child Fatality Review Team Legislative Briefing March 202 State Child Fatality Review Team Co-chaired by Chief Medical Examiner and Department of Public
Drug Overdose Summary- Mendocino County, CA. Mendocino County Health & Human Services Agency Healthy People, Healthy Communities
 Drug Overdose Summary- Mendocino County, CA Mendocino County Health & Human Services Agency Healthy People, Healthy Communities Injury Fact Sheet: Mendocino County Drug Overdose Summary Tables Deaths 2002
Mississippi. Data Sources:
 Data Sources: Multiple Cause of Death (MCOD) Files, 2009-2013, National Center for Health Statistics. The MCOD file is a census of all deaths in the U.S. and some territories. Five years data were combined
Racial and Ethnic Health Disparities in Multnomah County:
 Racial and Ethnic Health Disparities in Multnomah County: 199-24 Lillian Shirley, Director, Multnomah County Health Department. Bonnie Kostelecky, Director, Planning and Evaluation Sandy Johnson, Health
Unintentional Fall-Related Injuries among Older Adults in New Mexico
 Unintentional Fall-Related Injuries among Older Adults in New Mexico 214 Office of Injury Prevention Injury and Behavioral Epidemiology Bureau Epidemiology and Response Division Unintentional fall-related
Cancer Deaths California,
 Center for Health Statistics November 2005 DATA SUMMARY No. DS05-11000 This Data Summary is one of a series of leading cause of death reports. H i g h l i g h t s In 2003 cancer was the second leading
Health is excellent, very good, or good
 Health is excellent, very good, or good Source Description Item National Health Interview Survey Health is excellent, very good, or good Would you say [fill: your/alias s] health in general is excellent,
Projected Percent Increase in San Diego County Population Levels by 2050
 Non-natural deaths in San Diego County: A comparison of older adults to the general population Joshua Smith, PhD, MPH Epidemiologist County of San Diego, Health and Human Services Agency Emergency Medical
Major Causes of Injury Death
 Unintentional injuries and violence are the leading causes of death, hospitalization, and disability for children ages 1-18. This fact sheet provides a snapshot of data on the injury-related Maternal and
Graph 20. Causes of Natural Death Examined by the Medical Examiner in Graph 21: Race of Decedents Who Died of Natural Disease...
 Table of Contents Introduction... 4 County Demographics... 5 Workload... 5 Graph 1: Total ME cases vs. PBC population... 5 Manner of Death... 5 Figure 1: Florida death certificate with manner and cause
Changing Patient Base. A Knowledge to Practice Program
 Changing Patient Base A Knowledge to Practice Program Learning Objectives By the end of this tutorial, you will: Understand how demographics are changing among patient populations Be aware of the resulting
Chronic Liver Disease and Cirrhosis Deaths in California,
 Center for Health Statistics H i g h l i g h t s May 2005 DATA SUMMARY No. DS05-05000 This Data Summary is one of a series of leading cause of death reports. In 2003, the number of chronic liver disease
Drug Overdose Deaths St. Louis County, Missouri
 Drug Overdose Deaths St. Louis County, Missouri An overdose occurs when an excess and dangerous amount of a substance, such as alcohol, over thecounter medicine, prescription drugs, or illicit drug is
Delaware. Data Sources:
 Data Sources: Multiple Cause of Death (MCOD) Files, 2009-2013, National Center for Health Statistics. The MCOD file is a census of all deaths in the U.S. and some territories. Five years data were combined
MACOMB COUNTY MEDICAL EXAMINER
 MACOMB COUNTY MEDICAL EXAMINER Annual Report Daniel J. Spitz, M.D. Chief Medical Examiner Table of Contents LETTER FROM THE MANNER OF DEATH - NATURAL. MEDICAL EXAMINER Natural Cases by Age/Gender... Natural
Measuring Equitable Care to Support Quality Improvement
 Measuring Equitable Care to Support Quality Improvement Berny Gould RN, MNA Sr. Director, Quality, Hospital Oversight, and Equitable Care Prepared by: Sharon Takeda Platt, PhD Center for Healthcare Analytics
Major Causes of Injury Death
 Unintentional injuries and violence are the leading causes of death, hospitalization, and disability for children ages 1-18. This fact sheet provides a snapshot of data on the injury-related Maternal and
Colorado Trends in Suicide: Annual Report from the Office of Suicide Prevention Suicide Prevention Coalition of Colorado August 12, 2015
 Colorado Trends in Suicide: Annual Report from the Office of Suicide Prevention Suicide Prevention Coalition of Colorado August 12, 2015 Sources of information/data National National Violent Death Reporting
ASTHMA BY RACE AND ETHNICITY
 ASTHMA BY RACE AND ETHNICITY The following report depicts asthma rates for various races using data collected from the Michigan Behavioral Risk Factor Survey (MiBRFS), Minority Health Surveys, Michigan
SAN FRANCISCO WHOLE PERSON CARE Homeless Mortality in San Francisco Opportunities for Prevention
 SAN FRANCISCO WHOLE PERSON CARE Homeless Mortality in San Francisco Opportunities for Prevention Barry Zevin MD and Caroline Cawley MPH Health Commission Feb 19 2019 Background materials What this work
Decline in Mortality Due to Varicella after Implementation of Varicella Vaccination in the United States
 The new england journal of medicine original article Decline in Mortality Due to Varicella after Implementation of Varicella Vaccination in the United States Huong Q. Nguyen, M.P.H., Aisha O. Jumaan, Ph.D.,
Intoxication Deaths Associated with Drugs of Abuse Or Alcohol. Baltimore, Maryland. January 1995 through September 2007
 Intoxication Deaths Associated with Drugs of Abuse Or Alcohol Baltimore, Maryland January 1995 through tember 2007 A Report from the Office of Epidemiology and Planning Baltimore City Health Department
Initial Report of Oregon s State Epidemiological Outcomes Workgroup. Prepared by:
 Alcohol Consumption and Consequences in Oregon Prepared by: Addictions & Mental Health Division 5 Summer Street NE Salem, OR 9731-1118 To the reader, This report is one of three epidemiological profiles
Health Status Disparities in New Mexico Identifying and Prioritizing Disparities
 Health Status Disparities in New Mexico Identifying and Prioritizing Disparities Public Health Division March 23 Health Status Disparities in New Mexico Identifying and Prioritizing Disparities New Mexico
QUICK FACTS. Ohio Special Emphasis Report: Fall Injuries among Older Adults A GROWING CONCERN. 1,160 Deaths* 19,461 Hospitalizations**
 A GROWING CONCERN Unintentional falls among older adults are a leading cause of fatal and nonfatal injury in the U.S. and Ohio. Hospital costs associated with injuries sustained by falls account for a
Community Health Profile: Minnesota, Wisconsin, & Michigan Tribal Communities 2006
 Community Health Profile: Minnesota, Wisconsin, & Michigan Tribal Communities 26 This report is produced by: The Great Lakes EpiCenter If you would like to reproduce any of the information contained in
The Role of Race/Ethnicity in Alcohol-attributable Injury in the United States
 Epidemiologic Reviews ª The Author 2011. Published by Oxford University Press on behalf of the Johns Hopkins Bloomberg School of Public Health. All rights reserved. For permissions, please e-mail: journals.permissions@oup.com.
RACE-ETHNICITY DIFFERENCES IN ADOLESCENT SUICIDE IN THE 2009 DANE COUNTY YOUTH ASSESSMENT
 1 P age RACE-ETHNICITY DIFFERENCES IN ADOLESCENT SUICIDE IN THE 2009 DANE COUNTY YOUTH ASSESSMENT Andrew J. Supple, PhD Associate Professor Human Development & Family Studies The University of North Carolina
Racial and Ethnic Health Disparities Report Card
 Racial and Ethnic Health Disparities Report Card August 2010 Acknowledgements Many individuals contributed to the production of this report card. The Division of Policy and Performance wishes to particularly
Violent Deaths in Oregon: Oregon Department of Human Services Office of Disease Prevention and Epidemiology
 Violent Deaths in Oregon: 2003 Oregon Department of Human Services Office of Disease Prevention and Epidemiology For more information or to receive this report in an alternate format, please contact: Oregon
Community Health Profile: Minnesota, Wisconsin & Michigan Tribal Communities 2005
 Community Health Profile: Minnesota, Wisconsin & Michigan Tribal Communities 25 This report is produced by: The Great Lakes EpiCenter If you would like to reproduce any of the information contained in
BERRIEN COUNTY MEDICAL EXAMINER 2015 ANNUAL REPORT. Office of the Medical Examiner 2149 E. Napier Avenue Benton Harbor, MI
 BERRIEN COUNTY MEDICAL EXAMINER 2015 ANNUAL REPORT Office of the Medical Examiner 2149 E. Napier Avenue Benton Harbor, MI. 49022 Number Two! Our second Annual Medical Examiner Report. Too soon for trend
Kent County Medical Examiner
 Kent County Medical Examiner 26 Annual Report Office of the Medical Examiner 7 Fuller N.E. Grand Rapids, Michigan 4953 26 Kent County Medical Examiner Annual Report To the Kent County Board of Commissioners,
Populations of Color in Minnesota
 Populations of Color in Minnesota Health Status Report Update Summary Fall 2002 Center for Health Statistics Minnesota Department of Health Table of Contents Part I: Birth Related Indicators...1 Low Birthweight...1
Alcohol and Violent Death: The Role of Alcohol in Homicides and Suicides in North Carolina
 Alcohol and Violent Death: The Role of Alcohol in Homicides and Suicides in North Carolina Presented by Kathleen Creppage, MPH CSTE Annual Conference June 11, 2013 Kathleen Creppage, CDC/CSTE Applied Epidemiology
Drug Overdose Morbidity and Mortality in Kentucky,
 Drug Overdose Morbidity and Mortality in Kentucky, 2000-2010 An examination of statewide data, including the rising impact of prescription drug overdose on fatality rates, and the parallel rise in associated
4. Chlamydia. Treatment: Treating infected patients prevents further transmission to sex partners. In addition, treatment of chlamydia in pregnant
 Photomicrograph of Chlamydia trachomatis, taken from a urethral scrape. 4. Chlamydia Chlamydia trachomatis infection is the most commonly reported sexually transmitted disease (STD) in the United States,
Walworth County Health Data Report. A summary of secondary data sources
 Walworth County Health Data Report A summary of secondary data sources 2016 This report was prepared by the Design, Analysis, and Evaluation team at the Center for Urban Population Health. Carrie Stehman,
Rhode Island. Data Sources:
 Data Sources: Multiple Cause of Death (MCOD) Files, 2009-2013, National Center for Health Statistics. The MCOD file is a census of all deaths in the U.S. and some territories. Five years data were combined
New Mexico Department of Health. Racial and Ethnic Health Disparities Report Card
 New Mexico Department of Health Racial and Ethnic Health Disparities Report Card August 30, 2006 Acknowledgments Many individuals contributed to the production of this report card and the Office of Policy
The Burden of Asthma in Mississippi:
 The Burden of Asthma in Mississippi: 2009 Asthma Surveillance Summary Report April 2009 The Burden of Asthma in Mississippi: 2009 Asthma Surveillance Summary Report Haley Barbour Governor F.E. Thompson,
DRUG AND ALCOHOL USE
 DRUG AND ALCOHOL USE Alcohol and drug use by adolescents can have immediate as well as long-term health and social consequences. Alcohol and illicit drug use by adolescents are risk-taking behaviors which
Kent County Medical Examiner
 Kent County Medical Examiner 22 Annual Report Office of the Medical Examiner 7 Fuller N.E. Grand Rapids, Michigan 4953 22 Kent County Medical Examiner Annual Report To the Kent County Board of Commissioners,
Drug-Related Deaths in Yolo County,
 Drug-Related Deaths in Yolo County, 2007-2015 May 2017 Authors: Ron Chapman, MD, MPH Haydee Dabritz, PhD Emma Middlemiss, MPH intern Yolo County Health & Human Services Agency (HHSA), Community Health
List of Detailed Tables
 This announcement signals the release of the 2011 Mortality Multiple Cause Micro-data Files. The file can be accessed at: http://www.cdc.gov/nchs/data_access/vitalstatsonline.htm This document contains
The Opioid Epidemic: Overdose Data in NYC
 The Opioid Epidemic: Overdose Data in NYC Sindhu Shamasunder, MPH Bureau of Alcohol and Drug Use Prevention, Care and Treatment NYC Department of Health and Mental Hygiene The burden of drug overdose Nationally,
The accident injuries situation
 Appendix 2. The accident injuries situation Almost 90 % of injury deaths take place in home and leisure Almost 80 % of accidents leading to injury take place in home and leisure Unintentional injuries
Racial and Ethnic Health Disparities Report Card, 7th Edition
 Racial and Ethnic Health Disparities Report Card, 7th Edition September 2012 Department of Health 1190 South St. Francis Drive Santa Fe, NM 87502 www.nmhealth.org/opa/ Produced by the Office of Health
Kent County Medical Examiner
 Kent County Medical Examiner 217 Annual Report Office of the Medical Examiner 7 Fuller N.E. Grand Rapids, Michigan 4953 217 Kent County Medical Examiner Annual Report To the Kent County Board of Commissioners
Macomb County Medical Examiner s Office
 Macomb County Medical Examiner s Office www.macombcountymi.gov/publichealth/medical-examiner/medicalexaminer.htm Table of Contents LETTER FROM THE MEDICAL EXAMINER....... LAWS GOVERNING THE MEDICAL EXAMINER
Population Health Vital Statistics Brief:
 Page 1 Death and Life Expectancy Summit County Public Health Population Health Vital Statistics Brief: VOLUME 1: DEATH AND LIFE EXPECTANCY Summit County Public Health Populaon Health Division 1867 W. Market
FLHealthCHARTS.com Update List
 Released = New data, statistical brief, or analytic report not previously posted on FLHealthCHARTS. Added = New features or indicators not previously posted on FLHealthCHARTS. Updated = Change to data
Annual Report to the Nation on the Status of Cancer, , Featuring Survival Questions and Answers
 EMBARGOED FOR RELEASE CONTACT: Friday, March 31, 2017 NCI Media Relations Branch: (301) 496-6641 or 10:00 am EDT ncipressofficers@mail.nih.gov NAACCR: (217) 698-0800 or bkohler@naaccr.org ACS Press Office:
TENNESSEE BUREAU OF INVESTIGATION 901 R.S. Gass Boulevard Nashville, Tennessee (615) Facsimile (615) TDD (615)
 Facsimile (615) TDD (615)") Bill Lee Governor TENNESSEE BUREAU OF INVESTIGATION 901 R.S. Gass Boulevard Nashville, Tennessee 37216-2639 (615) 744-4000 Facsimile (615) 744-4500 TDD (615) 744-4001 David B. Rausch Director March 29,
Bill Lee Governor TENNESSEE BUREAU OF INVESTIGATION 901 R.S. Gass Boulevard Nashville, Tennessee 37216-2639 (615) 744-4000 Facsimile (615) 744-4500 TDD (615) 744-4001 David B. Rausch Director March 29,
SUICIDE IN NEW JERSEY NATIONAL SUICIDE PREVENTION WEEK EVENT DMHAS, New Jersey Department of Health
 SUICIDE IN NEW JERSEY NATIONAL SUICIDE PREVENTION WEEK EVENT DMHAS, New Jersey Department of Health Trenton War Memorial, Trenton, NJ September 13, 2018 New Jersey Violent Death Reporting System (NJVDRS)
HEALTH PROMOTION AND CHRONIC DISEASE PREVENTION PROGRAM OREGON STATE OF THE HEART AND STROKE REPORT 2001 PREPARED BY.
 OREGON STATE OF THE HEART AND STROKE REPORT 2001 PREPARED BY THE OREGON DEPARTMENT OF HUMAN SERVICES HEALTH SERVICES HEALTH PROMOTION AND CHRONIC DISEASE PREVENTION PROGRAM www.healthoregon.org/hpcdp Contents
National Diabetes Fact Sheet, 2011
 National Diabetes Fact Sheet, 2011 FAST FACTS ON DIABETES Diabetes affects 25.8 million people 8.3% of the U.S. population DIAGNOSED 18.8 million people UNDIAGNOSED 7.0 million people All ages, 2010 Citation
TRAUMATIC AND ACQUIRED BRAIN INJURY IN NEW MEXICO INCIDENCE, CAUSES, DIAGNOSIS, AND IMPACT FATALITIES HOSPITALIZATIONS
 TRAUMATIC AND ACQUIRED BRAIN INJURY IN NEW MEXICO INCIDENCE, CAUSES, DIAGNOSIS, AND IMPACT 2004-2006 FATALITIES 2004-2007 HOSPITALIZATIONS March, 2010 Prepared by the New Mexico Epidemiology and Response
Healthy Montgomery Obesity Work Group Montgomery County Obesity Profile July 19, 2012
 Healthy Montgomery Obesity Work Group Montgomery County Obesity Profile July 19, 2012 Prepared by: Rachel Simpson, BS Colleen Ryan Smith, MPH Ruth Martin, MPH, MBA Hawa Barry, BS Executive Summary Over
Racial and Ethnic Health Disparities Report Card, 6th Edition
 Racial and Ethnic Health Disparities Report Card, 6th Edition September 2011 Acknowledgements Many individuals contributed to the production of this report card. The Office of Policy and Performance wishes
Deaths: Final Data for 2002
 Volume 53, Number 5 October 12, 2004 Deaths: Final Data for 2002 by Kenneth D. Kochanek, M.A., Sherry L. Murphy, B.S., Robert N. Anderson, Ph.D., and Chester Scott, Division of Vital Statistics Abstract
Since President John F. Kennedy established. Fatalities in the Peace Corps: A Retrospective Study, 1984 to 2003
 95 Fatalities in the Peace Corps: A Retrospective Study, 1984 to 2003 Nancy M. Nurthen, MPH * and Paul Jung, MD, MPH * Department of Epidemiology, George Washington University, Washington, DC, USA ; Office
Mortality Slide Series. National Center for HIV/AIDS, Viral Hepatitis, STD, and TB Prevention Division of HIV/AIDS Prevention
 Mortality Slide Series National Center for HIV/AIDS, Viral Hepatitis, STD, and TB Prevention Division of HIV/AIDS Prevention HIV Mortality Slides An analysis of trends in rates and distributions of deaths
Racial/Ethnic Composition South Hayward, 2010
 South Hayward Data Alameda County Public Health Department Community Assessment, Planning, Education, and Evaluation (CAPE) Epidemiology Team May 7, 2014 Racial/Ethnic Composition South Hayward, 2010
Wisconsin Cancer Health Disparities Surveillance Reports: Trends in Cancer Disparities Among African Americans and Whites in Wisconsin
 Wisconsin Cancer Health Disparities Surveillance Reports: s in Cancer Disparities Among s and s in Wisconsin 29 1 Authors: Nathan R. Jones, PhD 1,2 Amy A. Williamson, MPP 1,2 Paul D. Creswell, BA 1,2 Rick
Prince George s County Health Department Health Report Findings
 Prince George s County Health Department 2018 Health Report Findings Our Residents Socioeconomic Factors Compared to Maryland, Prince George s residents: have a higher median household income, are employed
Resident Death By Suicide Statistics
 Resident Death By Suicide Statistics Just the Facts: Resident death by suicide is less frequent than the general population. Overall suicide is the #2 cause of resident death. It is the #1 cause of death
Daniel J. Spitz, M.D. Chief Medical Examiner
 01 Annual Report Daniel J. Spitz, M.D. Chief Medical Examiner Table of Contents LETTER FROM THE MANNER OF DEATH NATURAL. 14 MEDICAL EXAMINER Natural Cases by Age/Gender... 14 Natural Cases by Case Reports.
Epidemiology of HIV Among Women in Florida, Reported through 2014
 To protect, promote and improve the health of all people in Florida through integrated state, county, and community efforts. Created: 12/4/14 Revision: 1/27/15 Epidemiology of HIV Among Women in Florida,
2018 Community Health Assessment
 2018 Community Health Assessment Community Health Status Assessment Linn County, IA Prepared by Amy Hockett, PhD, MPH, CHES Epidemiologist Linn County Public Health August 9, 2018 Community Health Status
MARYLAND EPIDEMIOLOGICAL PROFILE: CONSEQUENCES OF ILLICIT DRUG USE, ALCOHOL ABUSE, AND SMOKING
 MARYLAND EPIDEMIOLOGICAL PROFILE: CONSEQUENCES OF ILLICIT DRUG USE, ALCOHOL ABUSE, AND SMOKING UPDATED MARCH 14, 2008 Prepared for The Alcohol and Drug Abuse Administration By The Center for Substance
Kansas City Data Collective Technical Report, June 2015
 Kansas City Data Collective Technical Report, June 2015 Top 10 leading causes of death, Kansas City Metro Area, 2007-2011 Background Kansas City Data Collective (KCDC) is a group of epidemiologists and
Overview of Health Care Disparities in Maryland
 Maryland Health Benefit Exchange Plan Management Advisory Committee Overview of Health Care Disparities in Maryland June 18, 2012 Carlessia A. Hussein, RN, DrPH David A. Mann, MD, PhD Office of Minority