TULSA HEALTH. Department
|
|
|
- Osborn Johnston
- 6 years ago
- Views:
Transcription


1
2
3 TULSA HEALTH Department
4 Table of Contents Executive Summary... 7 Mobilizing for Action through Planning and Partnerships (MAPP). 8 MAPP Assessments 9 Community Health Needs Assessment.. 9 Community Themes and Strengths Assessment 10 Local Public Health Systems Assessment Forces of Change Assessment 10 Tulsa County Demographics & Socioeconomic Characteristics Social Determinants of Health.. 16 State Priorities 21 Healthy People Priority Matrix Example 23 Community Health Improvement Plan Priority 1: Poor Diet & Inactivity Priority 2: Obesity.. 34 Priority 3: Drug & Alcohol Abuse.. 42 Priority 4: Chronic Disease 50 Priority 5: Access to Health Care. 58 Priority 6: Tobacco Use 70 Community Partner Participation.. 83
5 Acknowledgments.. 83 Alliance Groups.. 84 Evaluation Plan. 85 Next Steps Appendices Appendix A: Community Health Needs Assessment (CHNA)* Appendix B: Executive Summary of Focus Group Findings* Appendix C: Local Public Health System Assessment (NPHPSP)* Appendix D: Forces of Change Assessment Summary 86 Appendix E: Priority Champions.. 92 *This document is available online at
6
7 Executive Summary In January 2012, the Tulsa Health Department s Pathways to Health (P2H) partnership, in conjunction with local nonprofit hospitals, initiated an 18-month strategic evaluation of the health needs of Tulsa County. The evaluation, which consisted of four individual assessments, culminated in the development of this Community Health Improvement Plan (CHIP). P2H was formed in 2008 to unite community partners working to improve the health of Tulsa County. P2H brings together local agencies, organizations, coalitions, corporations and health systems working toward health improvement. The first CHIP was released in the fall of P2H has since completed a more comprehensive and significant assessment of Tulsa residents and community partners. The partnership has aligned the community s priorities with state and national priorities. Due to the input and support of dedicated community partners, the Tulsa County CHIP will provide a more systematic roadmap to a healthier community. The assessment process is unique because P2H first made the commitment to seek input from community residents through phone surveys and focus groups to identify the top six health concerns of Tulsa County poor diet and inactivity, obesity, alcohol and drug abuse, chronic disease, access to healthcare, and tobacco use. Then, P2H obtained information from community partners about how their programs and initiatives are meeting the health needs of the community. P2H partners current efforts and future plans for programming were used in conjunction with Healthy People 2020 goals to establish the Tulsa County CHIP goals and strategies. Goals and objectives relating to the top six health priorities as well as challenges, current strategies, indicators, and baseline data comprise the Tulsa County CHIP. Subsequent community-wide assessments will measure progress made by community partners and will demonstrate change and progress made in identified indicators. No single organization has the necessary depth of resources to improve community health. The Tulsa County CHIP demonstrates the collective impact possible when community partners efforts align with the health needs of the community. 7

8 Mobilizing for Action through Planning and Partnerships (MAPP) MAPP is a tool that local health departments across the country utilize to help direct their strategic planning. This tool helps communities improve health outcomes by developing non-traditional partnerships through community-wide collaboration. The Tulsa Health Department s first CHIP was based on MAPP assessments. The process has been embraced by Tulsa County as a national best practice model, and is easily facilitated in the community to provide accurate and comprehensive data. In order to remain consistent and to provide the highest quality service to the community, this framework was utilized once again. Tulsa County s CHIP used the MAPP model shown below. This model was developed by the National Association of County and City Health Officials (NACCHO) in cooperation with the Public Health Practice Program Office, Centers for Disease Control and Prevention (CDC). As illustrated, MAPP is broken up into four distinct assessments that are the foundation of the planning process. In addition, MAPP includes identifying strategic issues and formulating goals and strategies prior to taking action. 1 The four distinct assessments, when aggregated, helped formulate the Community Health Improvement Plan. The plan can then be implemented, evaluated and revised thus creating a cycle of continuous improvement. 1.) National Association of City County Health Officials May ) 2012 Tulsa County Community Health Needs Assessment, UNMC Survey Research Center [Item 60] Asked of all respondents 8
9 MAPP Assessments Community Health Needs Assessment (CHNA) The CHNA served as the community health status assessment component of the MAPP tool. Completed in April 2012, the CHNA utilized phone surveys to provide insight to the health of community residents and the health status of the community as a whole. The results of the CHNA provided the P2H partnership with a better understanding of the community s health status and a more focused direction for the CHIP. The phone survey was completed by more than 2,500 Tulsa County residents who each answered over seventy-five questions related to the community s health status, concerns, and needs. Multiple, cross-sector partners were instrumental in developing the survey tool. Representation from the area health systems, universities, government agencies, non-profits, and community resource agencies worked to ensure the survey would capture data relevant to those working towards health improvement; as well as, provide insight into what community residents believe are the primary health issues they are facing. This assessment yielded, among other health needs information, the community s top six health priorities: 2 Responses from the CHNA show Tulsa County s current status and perception of these health issues. These priorities set the framework for the CHIP. The CHIP utilized the CHNA assessment results as a basis for expanding on existing concerns in our community. Results of the CHNA can be found in appendix A. 9
10 Community Themes and Strengths Assessment The Community Themes and Strengths Assessment utilized focus groups to expound upon CHNA findings. Ninety-one participants representative of the demographics of Tulsa County were recruited to participate. During the focus groups, participants candidly discussed the health priorities identified in the CHNA and what community resources were available to meet the needs of the community. Participants were asked open-ended questions such as What is important to our community? and How is quality of life perceived in our community? and What assets do we have that can be used to improve community health? Their responses provided insight into community issues, concerns, perceptions of quality of life, and a map of community assets. The information gathered from these conversations serves as inspiration and validation for the work that is being done in the community. Focus group participants explained reasons they believe Tulsa County residents feel the six priority areas need to be addressed. Ideas for interventions for improvement in the six priority areas were also suggested. Reasoning and implications relevant to each priority area are included in the respective section narratives. An executive summary of the focus group results can be found in appendix B. Local Public Health Systems Assessment The Local Public Health System Assessment (LPHSA) served to answer the questions, What are the components, activities, competencies, and capacities of our local public health system? and How are the Essential Services being provided to our community? To facilitate this assessment, the National Public Health Performance Standards Program (NPHPSP) was selected as the framework for our LPHSA. The goals of NPHPSP are to: Provide performance standards for public health systems and encouraging their widespread use Encourage and leverage national, state, and local partnerships to build a stronger foundation for public health preparedness Promote continuous quality improvement of public health systems Strengthen the science base for public health practice improvement When NPHPSP was facilitated in November of 2012, thirty agencies from all sectors of the Tulsa community participated to discuss the opportunities and areas of excellence of all public health partners in Tulsa County. Participants identified how the local public health system performs the ten essential services of public health. Results of the NPHPSP can be found in appendix C. Forces of Change Assessment The Forces of Change Assessment is designed to help P2H leadership answer the following questions: What is occurring or might occur that affects the health of our community or the local public health system? and What specific threats or opportunities are generated by these occurrences? 10
11 This assessment was conducted in the spring of During this assessment, participants from P2H s Executive Advisory Council as well as senior leaders at the Tulsa Health Department engaged in brainstorming sessions to identify forces such as trends, factors, or events that are presently or potentially influencing the health and quality of life of the community and the local public health system. Following the brainstorming session the P2H Executive Advisory Committee and THD s Division Chiefs collaborated to identify what emerging trends could impact public health over the next three years. Forces of change are represented in the CHIP as potential challenges and key opportunities that relate to each priority area. A summary of the forces of change assessment can be found in appendix D. Tulsa County Demographics & Socioeconomic Characteristics Of the CHNA participant population, 47.9% of respondents are male and 52.1% are female. The age profile is shown below. 3 Age Profile (Tulsa County, 2012) 30.0% 20.0% 13.1% 19.4% 17.4% 18.6% 15.1% 16.3% 10.0% 0.0% ) 2012 Tulsa County Community Health Needs Assessment, UNMC Survey Research Center [Item D1] Asked of all respondents 11
12 The majority (69.5%) of respondents were white, with black/african American as the next most common race (10.5%). A total of 9.7% of the population surveyed is Hispanic and 90.3% are non-hispanic. 4 Race (Tulsa County, 2012) 80.0% 69.5% 60.0% 40.0% 20.0% 0.0% White 10.5% Black or African American 2.5% Asian 7.6% 10.0% American Indian Other / Multiple or Alaska Native Race The geographic distribution (by region) is shown on the following map. This map shows the proportion of CHNA respondents living in each region of Tulsa County. Tulsa County is divided into 6 geographical regions based on school district zoning and zip codes (North Tulsa County, Central West Tulsa County, Central East Tulsa County, West Tulsa County, East Tulsa County, and South Tulsa County). Cities identified in each region include but are not limited to: North Tulsa County Region: City of Collinsville, City of Owasso, City of Skiatook, City of Tulsa Central West Tulsa County Region: City of Tulsa Central East Tulsa County Region: City of Tulsa West Tulsa County Region: City of Sand Springs, City of Tulsa East Tulsa County Region: City of Broken Arrow, City of Tulsa South Tulsa County Region: City of Bixby, City of Glenpool, City of Jenks, City of Tulsa It is important to keep in mind that these geographic breakdowns of the county do not always reflect the way the community refers to parts of the city. For example, the North Tulsa County region includes cities such as Collinsville, Owasso, Skiatook, and parts of the City of Tulsa. However, this region does not include the north part of the City of Tulsa that is usually referred to as North Tulsa. North Tulsa is part of the Central West Tulsa County Region. Additionally, South Tulsa County includes not only the area typically called South Tulsa, but also the cities of Jenks, Bixby and Glenpool. 4.) 2012 Tulsa County Community Health Needs Assessment, UNMC Survey Research Center [Item D2 D3] Asked of all respondents 5.) 2012 Tulsa County Community Health Needs Assessment, UNMC Survey Research Center [Item D13] Asked of all respondents 12
13 S El w o o d A v e S Peo r i a A v e S Yale Av e S 273rd West Ave S t h W e s t Av e S 24 1 s t West Av e S S h eridan Rd S Memor ial D r S 3 3 r d W Av e N O s a g e S t N Yale Ave S S Harvard Ave S Mingo R d 1 29th East Av e N 161st E Ave S r d Ea s t Av e N M emoria l D r S Ga r nett R d S S 1 9 3rd W A v e S 17 7 t h W Av e 161st S 113rd W A v e S 14 5th W Av e S t h W Av e W Ave S 9 7th W Av e S 81sh W A v e S 1 9 3rd W A ve S 17 7 t h W Av e S 161st W A ve S 14 5th W Av e S t h W A v e S 113rd W Ave S 9 7th W Av e S 81sh W A v e S 65 th W Av e S 4 9th W Av e N Cincinna ti Av e S LEWIS Ave N L e wi s A v e N H a rvard Av e N Sheridan R d N M ingo R d N Ga r ne t t R d t S 14 5th East Av e N 1 45t h E as t Av e S 161th East Av e S t h East Av e E 186th St N Peoria Ave N 129th E a s Av e E 186th St N E 176th St N E 176th St N E 166th St N E 166th St N E 156th St N E 156th St N E 146th St N E 146th St N E 136th St N E 136th St N E 126th St N E 116th St N E 106th St N E 96th St N E 86th St N E 76th St N NORTH 6.8% E 126th St N E 116th St N E 106th St N E 96th St N E 86th St N E 76th St N E 66th St N E 66th St N E 56th St N E 56th St N W Archer St W 11th St S W 21st St S W 31st St S W 41st St S S 225th West Ave S 209th West Ave 9.7% WEST E 46th St N E 36th St N 22.5% CENTRAL WEST CENTRAL EAST 20.7% E 46th St N E 36th St N E Apache St E Pine St E Admiral Pl E 11th St S E 21st St S E 31st St S E 41st St S W 51st St S W 61st St S S 225th West Ave S 209th West Ave W 71st St S W 81st St S W 91st St S W 101st St S 21.1% EAST E 51st St S E 61st St S E 71st St S E 81st St S E 91st St S E 101st St S W 111th St S W 121th St S W 131st St S W 141st St S W 151st St S 12.9% E 111th St S E 121st St S E 131th St S E 141th St S E 151st St S E 161st St S E 171st St S 33rd West Ave S Union Ave SOUTH W 161st St S W 171st St S W 181st St S E 181st St S W 191st St S W 201st St S W 211st St S 4 Community Health Needs Assessment Regions Tulsa County, OK Health Data & Evaluation Date: 12/5/
14 When looking at marital status, the most common response (49.0%) is married. Also, there is an average of 0.85 children per household, although the majority of respondents (57.7%) did not currently have a child living in the household. Additionally, 5.9% of respondents were pregnant when the survey was completed. 6, 7 Marital Status (Tulsa County, 2012) 50.0% 40.0% 30.0% 20.0% 10.0% 0.0% 49.0% 13.3% 7.2% 2.8% 21.6% Married Divorced Widowed Separated Never married 6.1% A member of an unmarried couple With regard to socioeconomic factors, education, income and employment status were documented. Results from the sample population are shown below. 8, 9, 10 Education Level (Tulsa County, 2012) 40.0% 30.0% 31.1% 26.8% 29.5% 20.0% 12.7% 10.0% 0.0% Less than 12th grade Grade 12 or GED Some college or technical school College graduate 14
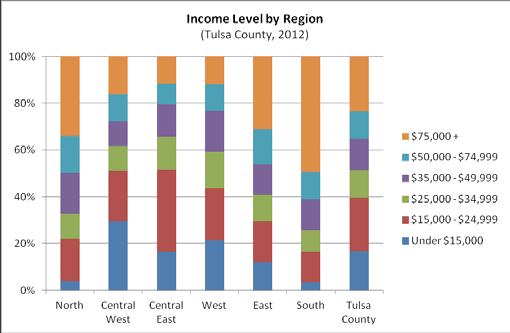
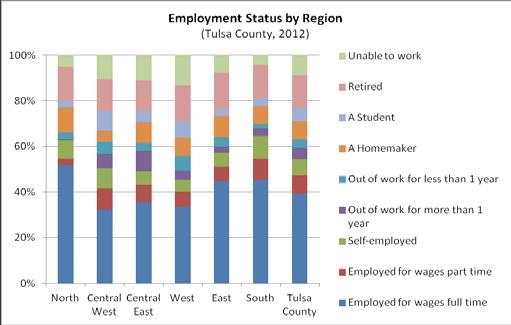
15 Income Level (Tulsa County, 2012) 30.0% 23.0% 23.3% 20.0% 16.7% 11.7% 13.4% 11.9% 10.0% 0.0% Under $15,000 $15,000 - $24,999 $25,000 - $34,999 $35,000 - $49,999 $50,000 - $74,999 $75,000 + Employment Status (Tulsa County, 2012) 40.0% 39.3% 30.0% 20.0% 10.0% 0.0% Employed for wages full time Employed for wages part time 8.0% 7.2% Self-employed 4.9% 3.9% 7.7% Out of work for less than 1 year Out of work for more than 1 year 15 A Homemaker 5.7% A Student 14.4% Retired 9.0% Unable to work 6.) 2012 Tulsa County Community Health Needs Assessment, UNMC Survey Research Center [Item D5] Asked of all respondents 7.) 2012 Tulsa County Community Health Needs Assessment, UNMC Survey Research Center [Item D6] Asked of all respondents 8.) 2012 Tulsa County Community Health Needs Assessment, UNMC Survey Research Center [Item D7] Asked of all respondents 9.) 2012 Tulsa County Community Health Needs Assessment, UNMC Survey Research Center [Item D9] Asked of all respondents 10.) 2012 Tulsa County Community Health Needs Assessment, UNMC Survey Research Center [Item D8] Asked of all respondents

16 Social Determinants of Health Where a person lives should not decide how healthy they will be, but in many cases it does. The social determinants of health are the circumstances in which people are born, grow up, live, work and age, and the systems put in place to deal with illness. These circumstances are in turn shaped by a wider set of forces: economics, social policies, and politics. 11 World Health Organization The social determinants of health are evident in many areas of Tulsa County. Often times food deserts, lack of social services, decreased public transportation, and high crime are considered social determinants. Education level, income, and employment status by region, as reported by CHNA respondents, are shown. Education attainment as well as employment status are closely related to income and can be a factor in poorer health status. 12, 13, ) World Health Organization. May ) 2012 Tulsa County Community Health Needs Assessment, UNMC Survey Research Center. [Item D7] Asked of all respondents 13.) 2012 Tulsa County Community Health Needs Assessment, UNMC Survey Research Center. [Item D9] Asked of all respondents 14.) 2012 Tulsa County Community Health Needs Assessment, UNMC Survey Research Center. [Item D8] Asked of all respondents 16
17 17
18 Social determinants of health also influence how healthy a person perceives themselves and their community to be. A total of 47.7% of Tulsa County adults rate their overall health as excellent or very good. An additional 31.0% rate their overall health as good. However, 21.2% of Tulsa County adults believe that their overall health is fair or poor. This is similar to findings to Oklahoma data, but worse than the national percentage. The region with the highest percentage of adults who believe their health is fair or poor is the Central East region, while the region with the lowest percentage of adults who believe their health is fair or poor is the South region. 15, 16 Experience "Fair" or "Poor" Overall Health (Tulsa County, 2012) 40.0% 34.9% 30.0% 28.7% 20.0% 15.0% 20.1% 23.8% 15.9% 14.4% 21.2% 20.2% 17.0% 10.0% 0.0% North Central West Central East West East South DK / RF / Out of Range Tulsa County OK US 15.) 2012 Tulsa County Community Health Needs Assessment, UNMC Survey Research Center. [Item 1] Asked of all respondents Graph shows prevalence within each individual category (in this case, within each region); percentages will not add up to 100%. For example, within the total population that lives in North Tulsa County, 15.0% of these individuals have fair or poor overall health 16.) Centers for Disease Control and Prevention (CDC). Behavioral Risk Factor Surveillance System Survey Data. Atlanta, Georgia: U.S. Department of Health and Human Services, CDC, ) 2012 Tulsa County Community Health Needs Assessment, UNMC Survey Research Center. [Item 8] Asked of all respondents 18
19 Adults belonging to the following groups are more likely to report fair or poor overall health: Have less than a 12th grade education Have an annual income of less than $15, Experience"Fair" or "Poor" Overall Health (Tulsa County, 2012) 50.0% 40.0% 44.3% 40.7% 32.9% 30.0% 20.0% 22.6% 20.6% 20.8% 21.2% 10.0% 10.0% 12.3% 8.3% 5.6% 0.0% Less than 12th grade Grade 12 or GED Some college or technical school College graduate Under $15,000 $15,000 - $24,999 $25,000 - $34,999 $35,000 - $49,999 $50,000 - $75,000 + Tulsa $74,999 County Social determinants of health can have implications for Tulsa County s workforce as well. Overall, Tulsa County adults missed an average of 1.8 days of work or activities in the previous month due to illness. The largest average number of days missed was 2.5 days in West Tulsa (which was the second highest region where individuals reported fair or poor health) and the smallest average number of days missed was 1.0 days in South Tulsa. 17 Average Number of Days Missed in the Past Month due to Illness (Tulsa County, 2012) North Central West Central East West East South DK / RF / Out of Range Tulsa County 19
20 Adults who missed a greater number of days on average during the previous month include the same groups who rate their health as fair or poor most often: Females Adults age Adults of other or multiple races Hispanics Additionally, downward trends show that as education and income levels increase, average number of days missed in the past month decreases. This trend is similar to individuals who rate their health as fair or poor. 15, 17 Average Number of Days Missed in the Past Month due to Illness (Tulsa County, 2012) Less than Grade 12 12th grade or GED Some college or technical school College graduate Under $15,000 $15,000 - $24,999 $25,000 - $34,999 $35,000 - $49,999 $50,000 - $74,999 $75,000 + Tulsa County Systems level changes are needed to ensure health equity across all areas of the county, regardless of demographics, all people should have the same access and opportunities to make healthy choices and have a healthier quality of life. 18.) Oklahoma State Department of Health. Oklahoma State Health Improvement Plan. May
21 State Priorities Oklahoma Health Improvement Plan (OHIP) In 2008, the Oklahoma legislature passed a resolution (SJR-41) which required the State Board of Health to develop a state health improvement plan for the improvement of the physical, social and mental well-being of everyone in Oklahoma through a high functioning public health system. The OHIP was developed by a team of health leaders, businesses, tribes, non-profits, private citizens, legislators, academia, state and local governments, and professional organizations. Flagship areas (tobacco prevention, obesity reduction, and children s health) were identified based on assessments and key health indicators. The OHIP was released in Tulsa County s CHIP shares similar goals and objectives with the OHIP. Tobacco Prevention: goals are to prevent initiation of tobacco use and young adults; increase the percentage of Oklahoman s who successfully quit smoking; protect all Oklahoman s from second-hand smoke; and fully implement recommendations from the state plan. OHIP These goals are supported by the goals and objectives outlined in Tulsa County s CHIP. Priority 6: Tobacco has goals and objectives for our county related to reducing tobacco use. Obesity Reduction: goals are to implement strategies and public policies in the Get Fit Eat Smart OK Physical Activity and Nutrition Plan; implement evidence based programs that address obesity issues; integrate and coordinate nutrition and obesity programs across the state; propose public policy changes needed to improve OK s health and fitness. OHIP Tulsa County s CHIP aligns with these goals and the strategic priorities identified help to further the state s mission, while also serving Tulsa County residents. Priority 2: Obesity denotes the goals and objectives community partners are working towards achieving to reduce obesity. Children s Health: goals are broad, and represent multiple stages of development. Our CHIP best aligns with the overarching goal of improving the following areas of concern: access to care, primary health care, dental health, mental health, self-esteem improvement, and developing the infrastructure and policies to support such improvements. OHIP 18 Addressing health inequities and providing education and services for youth and their families are also high priorities for both the state and Tulsa County. The Tulsa County CHIP goals and objectives to improve health for the youth of Tulsa County can be found in Priority 1: Poor Diet & Inactivity; Priority 2: Obesity; Priority 3: Alcohol & Drug Abuse; Priority 5: Access to Health Care; and Priority 6: Tobacco. Tulsa County community partners can contribute to state wide health improvement by aligning local goals with state goals to make progress toward improving the health of all Oklahomans. 21
22 Healthy People 2020 On a national level, Healthy People 2020 (HP2020) sets a standard for all communities. It is a ruler against which health standards and indicators are often measured. National recognition of the consistent standard measures allow progress on health improvement efforts to be shown on a grander, more comparable scale. HP2020 served as a guide for developing the objectives and indicators that this CHIP used to unite all community partners. Indicators selected reflect the majority of work being done by community partners. P2H partners are working toward the same goals, but each program may have a different way of evaluating program activities. HP2020 provides broad indicators that will have the greatest impact on health outcomes. 19 Tulsa County s CHIP utilized the Healthy People 2020 strategy of setting a goal to achieve a 10% improvement rate in each indicator by the year The next CHIP will be released in A short term goal of a 5% improvement rate has been established. Wherever possible, CHNA data was used to provide the most relevant baseline data for the objectives selected. If CHNA data was not available for a selected indicator, health data specialists were consulted to find the most relevant data available to utilize as a baseline. 19.) U.S. Department of Health and Human Services. Healthy People May 13 22
23 Priority Matrix Example The Tulsa County CHIP is a long-term, systematic effort to address public health concern with the input of community partners to set priorities and coordinate resources. A CHIP is critical for developing policies and defining actions to target efforts that promote health. As the plan is implemented, performance indicators will be used to evaluate the effectiveness of the strategies and tactics related to each priority area. The next CHIP will be released in This a short term goal. Adapted from Healthy People 2020 national goals Adapted from Healthy People 2020 national objectives Performance indicator used to evaluate the effectiveness of strategies and tactics in each priority area Data obtained through studies such as the Community Health Needs Assessment as a basis for comparison The Healthy People 2020 strategy advocates for 10% improvement by 2020 Goals Objectives Indicators Baseline % decrease % decrease Reduce tobacco use Reduce the proportion of adults who report using some kind of tobacco everyday or some days Percentage of adults who report having smoked a cigarette or using tobacco products everyday or some days 25.6% (2012 CHNA) 24.32% 23.04% 23
24


25


26 Priority 1 Poor Diet & Inactivity
27 Why is poor diet and inactivity a concern for Tulsa County? Poor diet and inactivity are two risk factors that contribute significantly to poor health. In order to maintain a healthy diet, an individual needs to have access to healthy foods such as fresh produce, as well as the resources for cooking nutritious meals. Inactivity and a sedentary lifestyle may lead to being overweight and other health complications. Being active can prove difficult if individuals live or work in an area that is not conducive to physical activity. An area without sidewalks or an unsafe environment can limit activity. According to the USDA, Consumer choices about food spending and diet are likely to be influenced by the accessibility and affordability of food retailers travel time to shopping, availability of healthy foods, and food prices. Some people and places, especially those with low`income, may face greater barriers in accessing healthy and affordable food retailers, which may negatively affect diet and food security. 1 The majority (84.3%) of Tulsa County adults state that they always or frequently have access to fresh fruit and produce. An additional 11.6% state that they sometimes have access to fresh fruit and produce. However, 4.1% of Tulsa County adults report that they rarely or never have access to fresh fruit and produce. This is highest in Central West Tulsa County and lowest in North Tulsa County. 2 Accessibility of Fresh Fruit and Produce (Tulsa County, 2012) Rarely 2.5% Sometimes 11.6% Never 1.6% Frequently 13.0% Always 71.3% 1.) United States Department of Agriculture. 2.) 2012 Tulsa County Community Health Needs Assessment, UNMC Survey Research Center. [Item 5] Asked of all respondents 27
28 It is more common for adults in the following groups to rarely or never have access to fresh fruit and produce: Males Adults age Adults of other or multiple races Hispanics Have less than a 12th grade education Adults who have an income of less than $15,000 2 "Rarely" or "Never" Have Access to Fresh Fruit and Produce (Tulsa County, 2012) 15.0% 13.4% 14.6% 10.0% 8.0% 5.0% 5.5% 2.8% 2.4% 2.7% 4.6% 3.3% 2.4% 2.6% 5.6% 4.8% 3.6% 3.0% 4.1% 0.0% Male Female White Black or African American Asian American Indian or Alaska Native Other / Multiple Race Hispanic Non-Hispanic Tulsa County A negative correlation exists between education and income levels, and perceived affordability of fresh fruit and produce. As education and income levels increase, fewer adults believe that fresh fruit and produce are rarely or never affordable. 2 3.) 2012 Tulsa County Community Health Needs Assessment, UNMC Survey Research Center. [Item 49-54] Asked of all respondents 28
29 In referance to physical activity, a total of 51.0% of Tulsa County adults participate in regular, sustained moderate or vigorous physical activity (meeting aerobic physical activity recommendations). This is more favorable than Oklahoma findings and similar to national findings. The percentage of Tulsa County adults who meet the recommended amounts of aerobic physical activity is highest in North Tulsa County and lowest in Central West Tulsa County. 3 Meets Aerobic Physical Activity Recommendations (Tulsa County, 2012) 80.0% 60.0% 56.1% 45.8% 48.1% 47.3% 53.5% 55.4% 61.8% 51.0% 44.8% 51.7% 40.0% 20.0% 0.0% North Central West Central East West East South DK / RF / Out of Range Tulsa County OK US Adults in the following groups are more likely to meet recommended aerobic physical activity recommendations: Males Adults age American Indian or Alaskan Natives Non-Hispanics 29
30 Additionally, the proportion of adults that meet recommended aerobic physical activity levels increases as education and income levels increase. 3 Meets Aerobic Physical Activity Recommendations (Tulsa County, 2012) 60.0% 49.5% 54.0% 55.4% 48.6% 55.3% 55.5% 56.4% 59.5% 51.0% 40.0% 39.3% 39.8% 20.0% 0.0% Less than 12th grade Grade 12 or GED Some college or technical school College graduate Under $15,000 $15,000 - $24,999 $25,000 - $34,999 $35,000 - $49,999 $50,000 - $75,000 + Tulsa $74,999 County Children have an advantage in terms of access to recreational facilities, as 93.0% of parents/guardians report that their child has access to indoor or outdoor recreational facilities. This is most common in South Tulsa County and least common in North Tulsa County. 4 4.) 2012 Tulsa County Community Health Needs Assessment, UNMC Survey Outreach Center. [Item C7] Asked of all respondents 30

31 Southwood Farm & Market, a new development of Southwood Landscape & Garden Center, has a vision to change the way customers and food producers interact. More education and awareness about the connection between where food comes from and how it gets to someone s plate will help to enhance the way the food system operates. Bringing programs like Farm 2 School into the community helps students learn from an early age how important food is to maintaining a healthy lifestyle. Southwood is a proud supporter of Oklahoma s Farm 2 School program, an initiative that continues to grow. Making food personal inspires individuals to be more aware of what they are consuming; more awareness leads to better choices. For a full list of community partners working towards these goals, please see appendix E.

32 What are the challenges Tulsa County may face? Focus group participants stated that the biggest obstacles to eating healthy and being active are time and know-how. It can be a challenge to find the time to buy healthy food and then take time to prepare it. Participants also reported that it is equally challenging to make time for physical activity. Recommendations for daily physical activity continue to change and managing all the information can be overwhelming. Even if an individual has enough time, cooking a healthy meal can be intimidating and activity vigorous enough to make an impact can be daunting. Access to healthy options emerged as a concern for the residents of Tulsa County during the focus groups. In the Forces of Change (FOC) and NPHPSP assessments, community partners also recognized that food deserts exist in areas where healthy food choices are needed the most. In order for other interventions to be successful, improving access to healthy foods is important. The food desert map shows areas of Tulsa County that are low income and low access. 5 It is often difficult to fund interventions designed to make healthier choices the easy choice. FOC participants said that efforts to fund and implement interventions can be complicated by existing or proposed policies. Outdated policies may need to be revised or enhanced to support the new proposed policies. New resolutions can be adopted, such as Complete Streets Resolutions or Healthy Eating, Active Living (HEAL) Resolutions, but implementing these resolutions requires adjustments to city budgets and a lengthy approval processes. What opportunities does Tulsa County have? FOC participants cite the importance of policy implementation to make streets easier for biking and walking. Also important are policies designed to make workplaces healthier, sidewalks easier to navigate, and playgrounds safe and accessible. Resolutions and policy changes can improve the food system and decrease the number of residents without access to healthy food. 5.) United States Department of Agriculture. Food deserts are defined as low-income areas where a significant number or share of residents is far from a supermarket, where far is more than 1 mile in urban areas and more than 10 miles in rural areas 32


 16.1% 16.")

 Collinsville (Spring 2012) Total of 5 communities Total of 7")
 Increase the number of residents who report getting moderate to")
 who report getting moderate physical activity each week.")
33 Priority 1: Poor Diet and Inactivity Goals Objectives Indicators Baseline % increase % increase Increase healthy eating Increase the number of residents with access to healthy food Percentage of residents who report having access to fresh fruits and vegetables always or frequently 84.3% (2012 CHNA) 88.5% 92.7% Increase the number of fruits and vegetables consumed by residents Percentage of adults (18 and over) who report consuming five or more servings of fruits and vegetables daily 15.3% (CDC, 2009 BRFSS) 16.1% 16.83% Increase physical activity Increase the number of residents who have access to physical activity opportunities The number of communities who have adopted Complete Streets Resolutions City of Tulsa (Feb. 2012) Collinsville (Spring 2012) Total of 5 communities Total of 7 communities Springs (Feb. 2013) Increase the number of residents who report getting moderate to vigorous physical activity each week The percentage of residents (18 and over) who report getting moderate physical activity each week. 51% (2012 CHNA) 53.55% 56.1% Goals, objectives and indicators were set by Healthy People 2020 and selected for the Tulsa Community by the Pathways to Health partnership. 33


34 Priority 2 Obesity
35 Why is obesity a concern for Tulsa County? Obesity is a serious health problem. Individuals who are overweight or obese are at a greater risk for having additional health complications such as high blood pressure, heart disease and diabetes. 1 Many of the challenges and opportunities identified in Priority 1: Poor Diet & Inactivity are relevant to the issues surrounding obesity and the root causes of this disease. Organizations throughout Tulsa County are working to implement interventions for families and children to reduce obesity. Additionally, there are programs working with adults to establish habits to improve their weight status as they move into older age. Due to the co-morbidities that are present when an individual is overweight or obese, setting goals and objectives to make a positive impact in this priority area can also help to improve other priorities areas such as the indicators for Priority 4: Chronic Disease. Nearly two-thirds (60.8%) of Tulsa County adults report being overweight or obese, and the total overweight prevalence is highest in North Tulsa County and lowest in Central East County according to the 2012 Tulsa County Health Needs Assessment % Prevalence of Total Overweight (Tulsa County, 2012) 60.0% 65.9% 61.6% 57.8% 58.8% 66.2% 58.1% 52.8% 60.8% 65.5% 63.5% 40.0% 20.0% 0.0% North Central West Central East West East South DK / RF / Out of Range Tulsa County 1.) U.S. Department of Health and Human Services. Healthy People May ) 2012 Tulsa County Community Health Needs Assessment, UNMC Survey Research Center. [Item D10-D11] Based on reported heights and weights, asked of all respondents. OK US 35
36 Furthermore, 27.8% of Tulsa County adults are obese. This is significantly lower than the prevalence of obesity in Oklahoma and exactly the same as the United States. Prevalence of obesity is highest in East Tulsa County and lowest in South Tulsa County. 2, 3 Prevelance of Obesity (Tulsa County, 2012) 35.0% 30.0% 25.0% 26.5% 29.7% 26.9% 27.7% 30.8% 24.3% 22.9% 27.8% 31.1% 27.8% 20.0% 15.0% 10.0% 5.0% 0.0% North Central West Central East West East South DK / RF / Out of Range Tulsa County Oklahoma US 3.) Centers for Disease Control and Prevention (CDC). Behavioral Risk Factor Surveillance System Survey Data. Atlanta, Georgia: U.S. Department of Health and Human Services, Centers for Disease Control and Prevention, The definition of overweight is having a Body Mass Index (BMI), a ratio of weight to height (kilograms divided by meters squared), between 25.0 and The definition of obese is having a BMI greater than or equal to
37 Adults in the following groups have a higher prevalence of obesity: Females Adults age African Americans Hispanics Adults with less than a 12th grade education Adults who have an income of less than $15,000 2 Prevalence of Obesity (Tulsa County, 2012) 40.0% 35.6% 30.0% 30.1% 28.0% 26.2% 27.8% 27.3% 30.3% 31.2% 28.1% 22.9% 27.8% 20.0% 10.0% 0.0% Less than 12th grade Grade 12 or GED Some college or technical school College graduate Under $15,000 $15,000 - $24,999 $25,000 - $34,999 $35,000 - $49,999 $50,000 - $75,000 + Tulsa $74,999 County 37

38 Saint Francis ShapeDown Program works with families to teach healthy lifestyle habits and reduce obesity in children. Since ShapeDown began in 2005, 615 families have completed the program. In the 6 week program, registered dietitians teach kids and their parents how to eat better as a family and exercise specialists show kids fun ways to be more physically active. TRACS! is the maintenance component of the program with a focus on providing health behavior change support and monthly monitoring of weight and BMI for graduates of the six week program. By working with the entire family ShapeDown is able to address the growing concern of childhood obesity and improve the health and well-being of the whole family. For a list of community partners working towards these goals, please see appendix E.

39
40 What are the challenges Tulsa County may face? Residents who participated in focus groups indicated that they do not have time for healthy options such as cooking at home and even if they did have time, they often do not have the knowledge necessary to prepare a healthy meal. Based on the response of focus group participants, the challenge for community partners is how to reach residents to provide the information they need to succeed. What opportunities does Tulsa County have? Programs and interventions designed to reduce the prevalence of obesity in Tulsa County and to prevent children from becoming obese are common among community partners. Interventions range from medical programs designed to facilitate dramatic lifestyle changes, to built environment policy changes allowing for more active transportation, to the ability to access healthy options in vending machines in work places (see Appendix E). The opportunity now is to unite efforts. Partners can learn from one another and build collaborations to take efforts further. The obesity epidemic did not happen overnight, nor did it happen because of one unhealthy choice. Obesity has plagued our community for years, and there are many unhealthy behaviors that need to be changed in order to reverse this problem. 3 Focus group participants suggested interventions such as providing healthy cooking demonstrations and taste-testings. Other suggestions included making exercise videos accessible at home or on mobile devices. However, participants stressed the importance of localized communication methods that are relevant to them as Tulsa County residents. 40

 16.")

 27.8% (2012 CHNA) 26.14% 25.")
41 Priority 2: Obesity Goals Objectives Indicators Baseline % decrease % decrease Reduce Obesity Reduce the proportion of children and adolescents aged 2 19 who are considered obese Percentage of children and adolescents with a BMI >30 (calculated from given height and weight) 16.5% OK State Youth (OK2SHARE, 2011 YRBSS) 15.68% 14.85% Reduce the proportion of adults who are obese. Percentage of adults who have a self-reported BMI >30 (calculated from given height and weight) 27.8% (2012 CHNA) 26.14% 25.02% Goals, objectives and indicators were set by Healthy People 2020 and selected for the Tulsa Community by the Pathways to Health partnership. 41


42 Priority 3 Alcohol / Drug Abuse
43 Why is alcohol and drug abuse a concern in Tulsa County? According to Healthy People 2020, Substance abuse has a major impact on individuals, families, and communities. The effects of substance abuse are cumulative, significantly contributing to costly social, physical, mental, and public health problems. 1 Some of these problems include: Teenage pregnancy Sexually transmitted diseases (STDs) Domestic violence& Child abuse Motor vehicle crashes Physical fights Crime Homicide Suicide Adolescent abuse of prescription drugs has continued to rise over the past five years. Prescription drugs are more readily available from many sources, including the family medicine cabinet, the Internet, and doctors. Many adolescents also believe that prescription drugs are safer to take than street drugs. 2 According to the CDC, alcohol abuse is a pattern of drinking that results in harm to one s health, interpersonal relationships, or ability to work. The long term effects of alcohol abuse include health problems such as chronic disease, harm to a developing fetus, unintentional injury, motor vehicle injuries, and violence. The CDC also states that youth who use alcohol before age 15 are five times more likely to become alcohol dependent than adults who begin drinking at age 21. Other consequences of youth alcohol use include increased risky sexual behaviors, poor school performance, and increased risk of suicide and homicide. 3 1.) U.S. Department of Health and Human Services. Healthy People May ) National Institutes of Health, National Institute on Drug Abuse (NIDA). Drug of abuse information [Internet]. Bethesda, MD: NIDA; 2008 Mar [cited 2010 Apr 22]. Available from: 3.) Centers for Disease Control and Prevention. May
44 The overall prevalence of alcohol and/or drug dependency among Tulsa County adults is 4.4%. This is highest in Central West Tulsa County and lowest in North Tulsa County. 4 Alcohol/ Drug Dependence Prevalence (Tulsa County, 2012) 8.0% 7.5% 6.0% 6.1% 4.0% 4.1% 3.3% 3.4% 4.4% 2.0% 1.7% 2.4% 0.0% North Central West Central East West East South DK / RF / Out Tulsa County of Range Adults belonging to the following groups have a higher prevalence of alcohol/ drug dependency: Males Adults age Adults of other or multiple races Non-Hispanics Adults with less than a 12th grade education or some college or technical school Adults who have an income of less than $15,000 4 Alcohol/ Drug Dependence Prevalence (Tulsa County, 2012) 10.0% 8.0% 6.0% 4.0% 2.0% 0.0% 8.1% 6.8% 6.7% 5.6% 4.7% 5.0% 4.7% 4.6% 4.4% 2.2% 2.9% 1.8% 1.8% 1.9% 0.4% 0.0% Male Female White Black or African American Asian American Indian or Alaska Native Other / Multiple Race Hispanic Non-Hispanic Tulsa County 44
45 A total of 19.4% of Tulsa County residents are heavy drinkers. This is significantly higher than both Oklahoma and U.S. findings. Heavy drinking is most common in Central West Tulsa County and least common in North Tulsa County. 5, % Heavy Drinkers (Tulsa County, 2012) 20.0% 16.6% 20.8% 18.3% 19.8% 20.0% 19.6% 17.4% 19.4% 15.0% 10.0% 5.0% 5.5% 6.6% 0.0% North Central West Central East West East South DK / RF / Out of Range Tulsa County OK US 4.) 2012 Tulsa County Community Health Needs Assessment, UNMC Survey Research Center. [Item 62i] Asked of all respondents 5.) 2012 Tulsa County Community Health Needs Assessment, UNMC Survey Research Center. [Item 56] Asked of all respondents Heavy drinkers are defined as men having 3+ drinks on average, per occasion, in the past 30 days or women having 2+ drinks on average, per occasion, in the past 30 days 6.) Centers for Disease Control and Prevention (CDC). Behavioral Risk Factor Surveillance System Survey Data. Atlanta, Georgia: U.S. Department of Health and Human Services, Centers for Disease Control and Prevention,

46 Operation Aware (OA) is a prevention education program for pre-k through high school students. OA shares a strong, clear message with young people that their choices today about drugs, alcohol, tobacco, and relationships can have lifelong consequences for their health, safety and wellbeing. Students learn techniques that help them resist negative peer pressure and make positive decisions that move them toward their goals and dreams and away from high-risk behaviors. OA has been in Tulsa County schools since 1979 and currently work with over 10,000 students within an 80 mile radius of Tulsa. OA believes that empowering young people to make better choices is an important step in improving their future and the future of our community. For a list of community partners working towards these goals, please see appendix E.

47
48 What are the challenges we may face? Forces of Change (FOC) Assessment participants agreed that intervention programs aimed at assisting those who have an addiction are often able to impact the overall health of an individual. The participants also recognized that this is a difficult task, which is why the prevention efforts of community partners are important. What are the opportunities we have? Forces of Change participants recognized that creative solutions to this problem involve many cross-sector collaborations. Interventions aimed at changing the built environment in a community can lower the prevalence of drug use by making it more difficult for drugs to be bought, sold, and/or used in high-risk areas. Efforts to impact the accessibility of alcohol sold to minors may reduce the consumption of alcohol by adolescents. Community partners work together on events such as the Prescription Take Back Day where prescription drugs were collected and properly disposed to eliminate the risk that they would be misused. Events or activities such as this are a way for community partners to promote education and awareness of these alcohol- and drug-related issues. FOC participants also recognized the positive impact that would result from passing ordinances and legislation. Programming efforts to prevent and treat alcohol and drug addiction would benefit from increased funding. 48


 18.62% 17.")
49 Priority 3: Alcohol/Drug Abuse Goals Objectives Indicators Baseline % decrease % decrease Reduce alcohol consumption by adolescents Reduce the proportion of adolescents reporting use of alcohol during the past 30 days Adolescents who report having more than one alcoholic beverage in the past 30 days 36.4% OK state youth had 1+ drinks in past 30 days (OK2SHARE, 2011 YRBSS) 34.58% 32.76% Reduce prescription drug abuse by adolescents Reduce the proportion of adolescents reporting use of prescription drugs without a doctor s prescription Adolescents who report use of prescription drugs without a doctor s prescription 19.6% OK state youth used prescription drugs without a doctor s prescription (OK2SHARE, 2011 YRBSS) 18.62% 17.64% Goals, objectives and indicators were set by Healthy People 2020 and selected for the Tulsa Community by the Pathways to Health partnership. 49


50 Priority 4 Chronic Disease
51 Why is chronic disease a concern for Tulsa County? While there are many chronic diseases prevalent in Tulsa County, diabetes and heart disease greatly impact the health of a community and can be influenced by other CHIP goals and objectives such as Priority 1: Poor Diet & Inactivity and Priority2: Obesity. Diabetes affects an estimated 25.8 million people in the United States and is the 7th leading cause of death. Diabetes: Lowers life expectancy by up to 15 years. Increases the risk of heart disease by 2 to 4 times. Is the leading cause of kidney failure, lower limb amputations, and adult-onset blindness. 1, 2 In addition to these human costs, the estimated total financial cost of diabetes in the United States in 2007 was $174 billion, which includes the costs of medical care, disability, and premature death. 1 A total of 13.6% of Tulsa County adults report that they have been diagnosed with diabetes. This is significantly higher than both Oklahoma and United States findings. Diabetes prevalence in Tulsa County is highest in West Tulsa County and lowest in North Tulsa County. 3, 4 Diabetes Prevalence (Tulsa County, 2012) 20.0% 16.1% 17.3% 16.0% 15.0% 10.0% 10.9% 12.1% 11.8% 12.0% 13.6% 11.1% 9.5% 5.0% 0.0% North Central West Central East West East South DK / RF / Out of Range 1.) Centers for Disease Control and Prevention (CDC). National diabetes fact sheet: General information and national estimates on diabetes in the United States, Atlanta: CDC; ) Portuese E, Orchard T. Mortality in insulin-dependent diabetes. In Diabetes in America, pp Bethesda, MD: National Institutes of Health, National Diabetes Data Group; ) 2012 Tulsa County Community Health Needs Assessment, UNMC Survey Research Center. [Item 62a] Asked of all respondents 4.) Centers for Disease Control and Prevention (CDC). Behavioral Risk Factor Surveillance System Survey Data. Atlanta, Georgia: U.S. Department of Health and Human Services, Centers for Disease Control and Prevention, 2011 Tulsa County OK US 51
52 Adults belonging to the following groups are more likely to have been diagnosed with diabetes: Females Adults age 65+ Asians Non-Hispanics Adults with less than a 12th grade education Adults who have an income of less than $15,000 3 Diabetes Prevalence (Tulsa County, 2012) 40.0% 30.0% 20.0% 10.0% 31.7% 24.5% 17.6% 20.9% 17.7% 13.1% 14.0% 14.0% 13.4% 14.3% 13.6% 9.8% 12.5% 7.7% 6.0% 3.4% 0.0% Male Female White Black or African American Asian American Indian or Alaska Native Other / Multiple Race Hispanic Non-Hispanic Tulsa County According to Healthy People 2020, Heart disease is the leading cause of death in the United States. Together, heart disease and stroke are among the most widespread and costly health problems facing the Nation today, accounting for more than $500 billion in health care expenditures and related expenses in 2010 alone. 5 The leading modifiable risk factors for heart disease and stroke are: High blood pressure High cholesterol Cigarette smoking Diabetes Poor diet and physical inactivity Overweight and obesity 6 52
53 Heart disease can be reduced when improvements are made in Priority 1: Poor Diet & Inactivity; Priority 2: Obesity; and Priority 6: Tobacco. Chronic diseases like diabetes and heart disease can be complicated to manage. There are numerous specialty physicians, different care plans, and multiple strategies to improve an individual s quality of life once they are diagnosed with heart disease. Community partners who have programming efforts to reduce the prevalence of heart disease (see Appendix E) often incorporate educational components and efforts to raise awareness to improve health. Focus group participants expressed the need for education and awareness of risk factors so patients can be more informed and empowered to reduce their risk of disease. The overall prevalence of heart disease among Tulsa County adults is 8.8%. This is significantly lower than the United States prevalence. Within Tulsa County, prevalence is highest in West Tulsa County and lowest in South Tulsa County % Heart Disease Prevalence (Tulsa County, 2012) 12.6% 10.0% 8.0% 8.5% 8.5% 8.5% 7.6% 9.9% 8.8% 11.0% 5.0% 0.0% North Central West Central East West East South DK / RF / Out of Range Tulsa County US 5.) U.S. Department of Health and Human Services. Healthy People May ) Lloyd-Jones D, Adams RJ, Brown TM, et al. Heart disease and stroke statistics 2010 update: A report from the American Heart Association statistics committee and stroke statistics subcommittee. Circulation. 2010;121:e1-e170 7.) Sources: 2012 Tulsa County Community Health Needs Assessment, UNMC Survey Research Center. [Item 62c] Asked of all respondents. 53
54 Heart disease prevalence is highest among adults who belong to the following groups: Males Adults age 65+ Whites Non-Hispanics Have less than a 12th grade education Have an income of less than $15, % 20.0% Heart Disease Prevalence (Tulsa County, 2012) 16.7% 23.8% 15.0% 10.0% 5.0% 0.0% 9.4% 9.5% 8.3% 3.4% 0.0% 0.6% Male Female % 8.2% 9.3% 8.8% 6.4% 3.2% 5.8% 4.5% 65+ White Black or African American Asian American Indian or Alaska Native Other / Multiple Race Hispanic Non-Hispanic Tulsa County 54

55 Tulsa s Area Agency on Aging (AAA) hosts Living Longer Living Stronger. This workshop teaches individuals practical skills on managing a chronic health problem such as diabetes, arthritis, high blood pressure, heart disease, chronic pain, or lung disease. The program is designed to give participants the support they need, practical ways to deal with pain and fatigue, better nutrition and exercise choices, new treatment options, and better ways to talk with doctors and family members about health issues. This workshop is also for family members and caregivers of those with chronic health conditions. Since the Living Longer Living Stronger program was initiated in 2012, it has reached 320 individuals. By providing workshops to provide education, awareness and support opportunities, AAA is able to assist those with chronic disease in leading a healthier life. For a list of community partners working towards these goals, please see appendix E.
56 What challenges will Tulsa County face? Diabetes and heart disease present themselves in a multitude of ways. The reason for their onset can be multifaceted and intervention options vary greatly. In the Forces of Change (FOC) Assessment, community partners shared their concerns over diagnosing and managing these diseases. CDC studies indicate that many people are unaware of their risk for diabetes or heart disease. 1, 8 A concern that FOC participants recognized as being a particularly significant challenge to the future of chronic disease prevention and management is that interventions aimed at screening individuals for these diseases are losing funding. Without screening programs it becomes more challenging to identify individuals at risk for developing these diseases. Additionally, in the Forces of Change Assessment, community partners recognized that education is a key component of a successful diabetes management regimen. Patients must understand the disease, complications, medications, and lifestyle changes that will impact symptoms, as well as doctor visits necessary to manage this disease. Given the abundance of information as well as the severity of complications from having diabetes, the diagnosis and treatment of diabetes is a high priority in the community. Focus group participants acknowledged that diabetes can be a difficult condition to manage. Participants shared concerns about their access to health care (priority 5). They also reported the challenges faced when individuals with diabetes and their care givers try to navigate the health care system. What opportunities does Tulsa County have? There is tremendous opportunity for professional partnerships directed at screening for diabetes and identifying individuals at high risk for heart disease. Community partners have an opportunity to work together to raise awareness of risk factors for disease, as well as provide comprehensive education and support after diagnosis. 8.) High Blood Pressure Fact Sheet (n.d.). In Centers for Disease Control and Prevention. Retrieved June, 2013, from DHDSP/data_statistics/fact_sheets/docs/fs_bloodpressure.pdf 56

 12.92% 12.")


57 Priority 4: Chronic Disease Goals Objectives Indicators Baseline % change % change Reduce diabetes Reduce the number of newly diagnosed cases of diabetes in the population Percentage of adults who report that they have ever been told by a doctor they have diabetes 13.6% (2012 CHNA) 12.92% 12.24% Reduce heart disease Increase the proportion of adults who have had their blood cholesterol checked within the preceding 5 years Percentage of adults in Oklahoma who report having their blood cholesterol checked within the last 5 years 77.6% (CDC, 2009 BRFSS) 81.48% 85.36% Reduce the number of adults who report having been told they have high blood pressure Percentage of adults who report that they have ever been told by a doctor they have high blood pressure 33.7% (2012 CHNA) 32.01% 30.32% Goals, objectives and indicators were set by Healthy People 2020 and selected for the Tulsa Community by the Pathways to Health partnership. 57

58 Priority 5 Access to Care
59 Why is access to health care a concern for Tulsa County? Access to comprehensive, quality health care services is important for the achievement of health equity and for increasing the quality of life for everyone. Access impacts overall physical, social and mental health status, prevention of disease and disability, detection of treatment of health conditions, quality of life, preventable death, and life expectancy, according to Healthy People Access to health services requires three distinct steps: gaining entry into the healthcare system, accessing a health care location where needed services are provided, and finding a health care provider with whom the patient can communicate and trust. Disparities in access to these health services limit people s ability to reach their full potential and negatively affect their quality of life. Barriers to services include lack of availability, high cost, and lack of insurance coverage. 1 A total of 51.6% of Tulsa County adults aged report having health insurance through private insurance (e.g., employer provided or self-purchased). Additionally, 18.0% report coverage through a government sponsored program (e.g., Medicaid, Medicare, military benefits, Indian/ tribal health benefits). 2 Type of Health Insurance Coverage (Among adults 18 64; Tulsa County 2012) Unknown 3.3% No insurance 27.0% Employer Provided or Private 46.9% Retired Military 1.0% Active Military 0.8% Tribal/Indian Health 2.6% Medicare Supplemental 0.5% Medicare 7.0% Medicaid 6.2% Self-purchased 4.7% 1.) U.S. Department of Health and Human Services. Healthy People May ) 2012 Tulsa County Community Health Needs Assessment, UNMC Survey Research Center. [Items 10 11] Asked of all respondents age 18 64, thus excluding the Medicare population 59
60 A total of 27.0% of Tulsa County adults report having no health insurance coverage for healthcare expenses. This is similar to the uninsured rate in Oklahoma and higher than the U.S. rate. Lack of health insurance coverage is highest in Central East Tulsa County and lowest in North Tulsa County. 3,4 Lack of Health Insurance Coverage (Among adults 18 64; Tulsa County, 2012) 60.0% 55.9% 40.0% 20.0% 14.7% 31.0% 37.6% 25.6% 15.9% 15.1% 27.0% 26.6% 21.3% 0.0% North Central West Central East West East South DK / RF / Tulsa Out of County Range OK US With regard to education levels and insurance coverage, a downward trend shows that as education level increases, lack of health insurance coverage also decreases. Additionally, adults with an income of $15,000 $24,999 were the most likely to report no insurance coverage. At higher income levels, this likelihood decreased. 3 Lack of Health Insurance Coverage (Among adults 18 64; Tulsa County, 2012) 60.0% 56.0% 54.7% 46.0% 40.0% 30.2% 26.1% 24.6% 27.0% 20.0% 0.0% Less than 12th grade Grade 12 or GED Some college or technical school 11.0% College graduate Under $15,000 $15,000 - $24,999 $25,000 - $34, % $35,000 - $49, % 2.6% $50,000 - $75,000 + Tulsa $74,999 County 60
61 Tulsa County adults who report having no insurance coverage were asked what challenges they face in obtaining health insurance. The most common reason for lack of coverage is cannot afford to purchase. 5 A total of 50.0% of Tulsa County parents/guardians with children under age 18 at home report having health insurance for their child through private insurance (e.g., employer provided or self-purchased). An additional 45.3% report coverage through a government sponsored program (e.g., Medicaid, Medicare, military benefits, Indian/ tribal health benefits). However, a total of 4.8% of parents/guardians report having no insurance coverage for their child s healthcare expenses. The rates of uninsured children in Tulsa County are much lower than Oklahoma and the United States. This is highest in Central West Tulsa County and lowest in North Tulsa County. 6 Type of Insurance Coverage for Child (Among parents/guardians of children 0 17; Tulsa County, 2012) Active Military 0.6% Retired Military 0.2% No coverage 4.8% Tribal/Indian Health 3.4% Employer Provided or Private 46.4% Medicaid 41.0% 61 Self-purchased 3.6% 3.) 2012 Tulsa County Community Health Needs Assessment, UNMC Survey Research Center. [Item 10] Asked of all respondents age ) Centers for Disease Control and Prevention (CDC). Behavioral Risk Factor Surveillance System Survey Data. Atlanta, Georgia: U.S. Department of Health and Human Services, Centers for Disease Control and Prevention, ) 2012 Tulsa County Community Health Needs Assessment, UNMC Survey Research Center. [Item 12] Asked of all respondents age who answered no to Do you have any kind of healthcare coverage? 6.) 2012 Tulsa County Community Health Needs Assessment, UNMC Survey Research Center. [Items C8 C9] Asked of parents/guardians with children age 0 17 in the household
62 Parents/guardians belonging to the following groups were more likely to have uninsured children: Females Adults aged 65+ Adults of other or multiple races Hispanics Parents/guardians who have less than a 12th grade education Parents/guardians with an income of $25,000 $34,999 6 Similarly to adult reporting, when asked why the child does not have healthcare insurance, the top reason is cannot afford to purchase. 7 When asked if respondents see a health care provider, one-fifth (19.9%) of Tulsa County adults report difficulty in seeing a healthcare provider in the past year because of cost. This is higher than Oklahoma and United States findings. The percentage is highest in Central East Tulsa County and lowest in South Tulsa County. Individuals who belong to the following groups were more likely to have experienced difficulty in receiving healthcare in the previous year: Females Adults ages Adults of other or multiple races Hispanics Similar to the correlation between low education and income levels and lack of insurance coverage, there is also a correlation between low education and income levels and increased likelihood of experiencing difficulty in receiving healthcare. 8 Experienced Difficulty in Receiving Healthcare in the Past Year (Tulsa County, 2012) 40.0% 30.0% 32.0% 25.8% 20.2% 38.1% 35.2% 25.8% 20.0% 10.0% 8.5% 14.0% 7.9% 4.0% 19.9% 0.0% Less than 12th grade Grade 12 or GED Some college or technical school College graduate Under $15,000 $15,000 - $24,999 $25,000 - $34,999 $35,000 - $49,999 $50,000 - $75,000 + Tulsa $74,999 County A total of 78.2% of Tulsa County adults state that they have at least one person who they consider to be their personal doctor or healthcare provider. This is most common in North Tulsa and least common in Central West and West Tulsa. 9 62
63 Parents/guardians who have a child 0 17 years of age living in the household were asked if the child has at least one person that they consider to be their personal doctor or healthcare provider. The majority of parents/guardians (93.8%) report that their child does have a primary care physician. This is highest in North and Central East Tulsa County and lowest in South Tulsa County. 10 A total of 61.0% of Tulsa County adults have had a routine check-up in the previous year. This percentage is highest in South Tulsa County and lowest in North Tulsa County. Adults in the following groups are more likely to have received a routine check-up in the previous year: Females Adults age 65+ (Note that as age increases, likelihood of having a routine check-up also increases) African Americans Non-Hispanics College graduates (likelihood of having a routine check-up in the past year increases as education level increases) Adults with an income of $75, Overall, 90.3% of parents/guardians state that their child has had a routine check-up in the past year. This is highest in East Tulsa County and lowest in Central East Tulsa County. Parents/guardians belonging to the following groups are more likely to have taken their child to a physician for a routine checkup in the past year: Males Adults aged American Indians or Alaska Natives Adults with a 12th grade education or GED Adults who have an income of $15,000 $24, When parents/guardians were asked why their child had not received a routine check-up in the past year, the majority (82.4%) state that it was not needed because the child is healthy ) 2012 Tulsa County Community Health Needs Assessment, UNMC Survey Research Center. [Item C10] Asked of parents/guardians with children age 0 17 in the household who answered no to Does he/she have any type of healthcare coverage? 8.) 2012 Tulsa County Community Health Needs Assessment, UNMC Survey Research Center. [Item 15] Asked of all respondents 9.) 2012 Tulsa County Community Health Needs Assessment, UNMC Survey Research Center. [Items 13 14] Asked of all respondents 10.) 2012 Tulsa County Community Health Needs Assessment, UNMC Survey Research Center. [Item C11 C12] Asked of parents/guardians with children age 0 17 in the household 11.) 2012 Tulsa County Community Health Needs Assessment, UNMC Survey Research Center. [Item 17] Asked of all respondents 12.) 2012 Tulsa County Community Health Needs Assessment, UNMC Survey Research Center. [Item C15] Asked of parents/guardians with children age 0 17 in the household 13.) 2012 Tulsa County Community Health Needs Assessment, UNMC Survey Research Center. [Item C16] Asked of parents/guardians with children age 0 17 in the household who answered more than 1 year to About how long has it been since he/she visited a physician for a routine check-up? 63
64 Dental Health Regular visits to the dentist are an important component of maintaining health. According to Healthy People 2020, Oral health is essential to overall health. Good oral health improves a person s ability to speak, smile, smell, taste, touch, chew, swallow, and make facial expressions to show feelings and emotions. However, oral diseases, from cavities to oral cancer, cause pain and disability for many Americans. 14 Tulsa County adults were asked how long it has been since they have visited the dentist for a routine teeth cleaning. A total of 50.6% of adults have had a routine teeth cleaning in the previous year. This is significantly lower than both Oklahoma and the United States. Adults are most likely to have received a routine teeth cleaning in the past year if they live in South Tulsa County and least likely if they live in West Tulsa County. 15, 16 Received a Routine Teeth Cleaning in the Past Year (Tulsa County, 2012) 80.0% 71.9% 68.5% 60.0% 40.0% 55.2% 45.5% 41.7% 39.8% 55.7% 50.3% 50.6% 55.7% 20.0% 0.0% North Central West Central East West East South DK / RF / Out of Range Tulsa County OK US Adults belonging to the following groups are more likely to have received a teeth cleaning in the past year: Women Adults age 65+ Whites Non-Hispanics 14.) U.S. Department of Health and Human Services. Healthy People May ) 2012 Tulsa County Community Health Needs Assessment, UNMC Survey Research Center. [Item 25] Asked of all respondents 16.) The Kaiser Family Foundation, statehealthfacts.org. Data Source: Centers for Disease Control and Prevention, Behavioral Risk Factor Surveillance System Survey Data (BRFSS), 2010, unpublished data, accessed March 6,
65 When examining education and income levels, there is a positive correlation between increased likelihood of receiving a routine teeth cleaning in the previous year and higher education and income levels % Received a Routine Teeth Cleaning in the Past Year (Tulsa County, 2012) 80.0% 60.0% 40.0% 20.0% 27.0% 39.5% 51.2% 71.8% 19.5% 30.4% 41.2% 57.0% 61.3% 81.0% 50.6% 0.0% Less than 12th grade Grade 12 or GED Some college or technical school College graduate Under $15,000 $15,000 - $24,999 $25,000 - $34,999 $35,000 - $49,999 $50,000 - $75,000 + Tulsa $74,999 County Tulsa County adults who had not received a routine teeth cleaning in the past year were asked what barriers they face to receiving dental care. The most common reason was no insurance. 17 Main Reason Why Individuals Have Not Received a Routine Teeth Cleaning in the Past Year (Tulsa County, 2012) No insurance 25.0% Not needed/healthy 14.0% No teeth 12.5% No time 11.3% Cost / can't afford (non-specific) 9.8% Other 9.4% Fear / don't like dentist 5.9% Insurance does not cover 5.4% Unable to afford co-pay 4.2% No doctor 2.5% 0.0% 10.0% 20.0% 30.0% 17.) 2012 Tulsa County Community Health Needs Assessment, UNMC Survey Research Center. [Item 26] Asked of all respondents who answered Greater than 1 year to the question About how long has it been since you last visited a dentist for a routine teeth cleaning? 65

66

67 MyHealth Access Network is a non-profit coalition of organizations in Oklahoma, with a goal to improve health care quality and the health of area residents while controlling costs. The organization was chartered to facilitate communications and connections among participants in the healthcare system. As such, MyHealth does not directly provide care, but provides those who do with technology, information, communications, and analytics to support improved care quality and reduced costs. MyHealth is interested in building and strengthening local health IT infrastructure and testing innovative approaches to make measurable improvements in health, care and cost. The organization focuses on health information exchange, community-wide care coordination, community-wide clinical decision support, patient engagement and shared decision making and quality improvement through interventions such as health information exchange (HIE), patient portal, electronic referrals and online consultation, community health analytics, care gap analysis and individualized risk assessment and guidelines. MyHealth provides the platform upon which Oklahoma leaders affect change through the use of innovative healthcare technology and dissemination of impactful information. For a list of community partners working towards these goals, please see appendix E.
68 What are the challenges Tulsa County may face? Focus group participants cited uncertainty and lack of awareness about health insurance in the community as a challenge to accessing health care. Participants explained that they are not sure where to turn for answers to complicated questions, and living in a state where health insurance issues are a heavily debated political topic often leads to polarizing views and confusing information. As the CHNA data shows, inability to afford insurance for health and dental care is another challenge that needs to be considered moving forward. Overcoming the barriers to educating people on issues related to insurance and access to health care, as well as providing residents with trusted sources of relevant information, are challenges to address. Participants in the Forces of Change (FOC) Assessment agreed that finding ways to educate and guide people through the health care system is a challenge to overcome. Community partners who provided input to the FOC as well as the residents who participated in the focus groups cited another challenge are the barriers faced by many individuals who care for children and/or their own aging parents. The scope of services to navigate and the medical information provided is broad and can be difficult for caregivers. One suggested solution made by focus group participants was to provide additional outreach and patient navigators to ensure that all Tulsa County residents receive the best and most appropriate care possible. What opportunities does Tulsa County have? Community partners who attended the NPHPSP assessment recognized that initiatives that aim to make information easier to exchange and data more accessible benefits providers as well as patients. Providers have an opportunity to empower their patients and help them connect to beneficial resources within their community. These resources can assist with accessing additional health care services as well as improving lifestyle choices such as eating healthier and being more active. FOC participants also recognized that one strength in our community is the ability of safety net providers to provide care that many people would otherwise not be able to access because of cost. Also, health systems are working to further the reach of their services in order to meet the needs of individuals who experience the most significant barriers when seeking care. 68
) 81.06% 84.")

69 Priority 5: Access To Health Care Goals Objectives Indicators Baseline % increase % increase Increase the number of people with health insurance Increase the proportion of adults with health care coverage Percentage of adults who report having health care coverage 77.2% (2012 CHNA)) 81.06% 84.92% Increase the proportion of children and adolescents aged 0 18 years who have health care coverage Percentage of children 0 18 years who have healthcare coverage 89.6% (2011 ACS) 94.08% 98.56% Increase the number of people who see a dentist regularly Increase the proportion of persons who report having been to the dentist in the last 12 months Percentage of adults who report having been to the dentist in the past 12 months 50.6% (2012 CHNA) 53.13% 55.66% Goals, objectives and indicators were set by Healthy People 2020 and selected for the Tulsa Community by the Pathways to Health partnership. 69


70 Priority 6 Tobacco Use
71 Why is tobacco use a concern for Tulsa County? According to Healthy People 2020, Tobacco use causes cancer, heart disease, lung diseases (including emphysema, bronchitis, and chronic airway obstruction), and premature birth, low birth weight, stillbirth and infant death. Secondhand smoke causes heart disease and lung cancer in adults and a number of health problems in infants and children, including severe asthma attacks, respiratory infections, ear infections, and Sudden Infant Death Syndrome (SIDS). There is no risk-free level of exposure to secondhand smoke. 1 Due to the addictive properties of tobacco products, prevention efforts are very important to ensure the health of the whole community. Overall, 26.9% of Tulsa County adults use some type of tobacco product. This is most prevalent in West Tulsa County and least prevalent in South Tulsa County. 2 Prevalence of Tobacco Use (Tulsa County, 2012) 40.0% 39.8% 30.0% 23.0% 30.7% 26.3% 25.5% 25.0% 26.8% 20.0% 16.6% 10.0% 0.0% North Central West Central East West East South DK / RF / Out Tulsa County of Range Tobacco use is most prevalent among the following groups: Males Adults age American Indians or Alaska Natives Non-Hispanics 1.) U.S. Department of Health and Human Services. Healthy People May ) 2012 Tulsa County Community Health Needs Assessment, UNMC Survey Research Center. [Item 46a] Asked of all respondents 71
72 Additionally, tobacco prevalence is highest among: Adults with less than a 12th grade education Adults who have an income of less than $15, % Prevalence of Tobacco Use (Tulsa County, 2012) 40.0% 30.0% 35.2% 30.2% 32.6% 40.9% 27.9% 34.0% 27.3% 23.4% 26.9% 20.0% 10.0% 14.5% 16.2% 0.0% Less than 12th grade Grade 12 or GED Some college or technical school College graduate Under $15,000 $15,000 - $24,999 $25,000 - $34,999 $35,000 - $49,999 $50,000 - $75,000 + Tulsa $74,999 County Tulsa County adults who use some type of tobacco product were asked what product(s) they use. The most common response is cigarettes. 3 Type of Tobacco Product Used (Among tobacco users; Tulsa County, 2012) Cigarettes 588 Smokeless Tobacco 96 Cigars 70 Other
73 Approximately one in four Tulsa County adults (25.6%) currently smokes cigarettes, either regularly or occasionally. Within Tulsa County, the prevalence of cigarette smoking is highest in West Tulsa County and lowest in South Tulsa County. 4, 5 Current Smokers (Tulsa County, 2012) 40.0% 35.9% 30.0% 20.0% 20.7% 30.4% 26.6% 22.6% 30.1% 25.7% 26.1% 21.1% 13.9% 10.0% 0.0% North Central West Central East West East South DK / RF / Out of Range Tulsa County OK US 3.) 2012 Tulsa County Community Health Needs Assessment, UNMC Survey Research Center. [Item 46b] Asked of all respondents who responded yes to Do you use any type of tobacco product? Respondents were able to select multiple responses 4.) 2012 Tulsa County Community Health Needs Assessment, UNMC Survey Research Center. [Item 40-41] Asked of all respondents 5.) Centers for Disease Control and Prevention (CDC). Behavioral Risk Factor Surveillance System Survey Data. Atlanta, Georgia: U.S. Department of Health and Human Services, Centers for Disease Control and Prevention,
74 Cigarette smoking prevalence is higher among the following groups: Males Adults age American Indians or Alaska Natives Non-Hispanics Have less than a 12th grade education Have an income of less than $15, % Current Smokers (Tulsa County, 2012) 40.0% 32.2% 31.0% 31.4% 41.0% 34.1% 30.0% 27.1% 27.1% 22.1% 25.7% 20.0% 12.4% 11.9% 10.0% 0.0% Less than 12th grade Grade 12 or GED Some college or technical school College graduate Under $15,000 $15,000 - $24,999 $25,000 - $34,999 $35,000 - $49,999 $50,000 - $75,000 + Tulsa $74,999 County 74
75 Secondhand smoke affects the community as a whole, and can cause lasting damage and disease in individuals who are repeatedly exposed. A total of 35.1% of Tulsa County adults are regularly or sometimes exposed to secondhand smoke. This exposure is most common in West Tulsa County and least common in South Tulsa County. 6 Frequency of Secondhand Smoke Exposure (Tulsa County, 2012) Regularly 15.0% Never 39.5% Sometimes 20.1% Rarely 25.4% "Regularly" or "Sometimes" Exposed to Secondhand Smoke (Tulsa County, 2012) 50.0% 40.0% 30.0% 30.8% 35.5% 39.7% 45.2% 31.9% 24.0% 42.1% 35.1% 20.0% 10.0% 0.0% North Central West Central East West East South DK / RF / Out of Range Tulsa County 6.) 2012 Tulsa County Community Health Needs Assessment, UNMC Survey Research Center. [Item 44] Asked of all respondents 75
76 Regularly or sometimes being exposed to secondhand smoke is most common within the following groups: Males Adults age American Indians or Alaska Natives Additionally, secondhand smoke exposure in Tulsa County adults decreases as education and income levels rise. 6 "Regularly" or "Sometimes" Exposed to Secondhand Smoke (Tulsa County, 2012) 60.0% 40.0% 52.5% 40.3% 38.1% 49.7% 45.5% 41.3% 33.7% 27.9% 35.1% 20.0% 19.9% 16.8% 0.0% Less than 12th grade Grade 12 or GED Some college or technical school College graduate Under $15,000 $15,000 - $24,999 $25,000 - $34,999 $35,000 - $49,999 $50,000 - $75,000 + Tulsa $74,999 County 76
77 When asked about where secondhand smoke exposure occurs most frequently, the most common response was other public areas followed by my home. 7 Location of Secondhand Smoke Exposure (Among adults who are exposed to secondhand smoke; Tulsa County, 2012) Other public areas 29.4% My home Family/Friends Home 18.6% 17.1% Work 14.7% Other Bars / casinos Restaurants 7.1% 6.6% 6.1% Parks.3% 0.0% 10.0% 20.0% 30.0% 40.0% 7.) 2012 Tulsa County Community Health Needs Assessment, UNMC Survey Research Center. [Item 45] Asked of all respondents who answered regularly, sometimes, or rarely to Are you exposed to secondhand smoke? 77

78
79 The Tulsa Health Department s Community of Excellence tobacco control program (CX Tobacco), works to achieve a community in which social norms consistently point to no tobacco use. The program works with local schools, businesses and communities to implement tobacco-free policies. CX Tobacco also encourages community organizations and events to reject tobacco industry sponsorship and works to prevent youth access to tobacco. They have helped more than 14 local school districts adopt a 24/7 tobacco-free campus policy; and more than 40 local companies have adopted tobacco-free campus policies through the Make It Your Business program. CX Tobacco facilitates the Tobacco Free Coalition for Tulsa County which was formed to bring together organizations and individuals working to one day live in a tobacco-free community free from the health and economic consequences of tobacco use. For a list of community partners working towards these goals, please see appendix E
80 What are the challenges Tulsa County may face? Despite existing evidence that tobacco is a definitive detriment to health, the fight to end tobacco use continues. Participants in the Forces of Change (FOC) Assessment recognized that interventions to increase tobacco cessation require strong advocacy and dedication of community partners. In 1987 and 1994, tobacco industry lobbyists at the Oklahoma State Capitol were successful in advocating for special preemption clauses to be placed in state tobacco laws, which took away the rights of Oklahoma communities to adopt or enforce any tobacco-related ordinances more stringent than state law. Advocates for tobacco cessation agree that progress cannot be achieved until policies and regulations are passed or laws are instated, which necessitates both time and substantial funding. What are the opportunities we have? Participants in the FOC assessment were in agreement that through a unified approach, community partners have the opportunity to voice support of pivotal programming efforts and legislation. There are many opportunities for community partners to make a difference, such as local schools and businesses passing 24/7 Tobacco Free School & Workplace Policies and promoting the Oklahoma Tobacco Quit Line as a resource for their staff to utilize in their efforts to quit using tobacco products. Participants in the local public health systems assessment, NPHSP, and the FOC assessment acknowledged the role community organizations play in encouraging individuals to not use tobacco through education about the dangers of tobacco. Tulsa County has dedicated agencies (see Appendix E) that are committed to helping those who are addicted to tobacco to quit and start on the path to a healthier life. 80

 24.32% 23.")
 who report having smoked")

81 Priority 6: Tobacco Use Goals Objectives Indicators Baseline % decrease % decrease Reduce tobacco use Reduce the proportion of adults who report using some kind of tobacco everyday or some days Percentage of adults who report having smoked a cigarette or using tobacco products everyday or some days 25.6% (2012 CHNA) 24.32% 23.04% Reduce the initiation of the use of tobacco products among children and adolescents aged years Percentage of Oklahoma students (9th grade to 11th grade) who report having smoked cigarettes, at least one, in the past 30 days. 22.7% (2011 CDC YRBSS) 21.56% 20.42% Goals, objectives and indicators were set by Healthy People 2020 and selected for the Tulsa Community by the Pathways to Health partnership. 81

82
HEALTH FACTORS Health Behaviors. Adult Tobacco Use Adolescent Alcohol Use Healthy Eating School Food Environment Physical Activity
 HEALTH FACTORS Health Behaviors Adult Tobacco Use Adolescent Alcohol Use Healthy Eating School Food Environment Physical Activity 1 Adult Tobacco Use Definition: For this assessment, adult tobacco use
Health System Members of the Milwaukee Health Care Partnership
 Health System Members of the Milwaukee Health Care Partnership Aurora Health Care Children s Hospital of Wisconsin Columbia St. Mary s Health System Froedtert Health Wheaton Franciscan Healthcare In Collaboration
PINELLAS HIGHLIGHTS DIET & EXERCISE
 PINELLAS HIGHLIGHTS DIET & EXERCISE DIET & EXERCISE Diet is not simply a matter of discipline. Access and the ability to afford healthy food play a role in food selection. Without enough income or proper
Baptist Health Nassau Community Health Needs Assessment Priorities Implementation Plans
 Baptist Health Nassau Community Health Needs Assessment Priorities Implementation Plans Health Disparities Heart Disease Stroke Hypertension Diabetes Adult Type II Preventive Health Care Smoking and Smokeless
Position Profile Chief Executive Officer Feeding America San Diego San Diego, CA
 Position Profile Chief Executive Officer Feeding America San Diego San Diego, CA Feeding America San Diego is seeking an experienced and inspirational Chief Executive Officer to lead this impactful and
Baptist Health Jacksonville Community Health Needs Assessment Implementation Plans. Health Disparities. Preventive Health Care.
 Baptist Health Jacksonville Community Health Needs Assessment Implementation Plans Health Disparities Infant Mortality Prostate Cancer Heart Disease and Stroke Hypertension Diabetes Behavioral Health Preventive
Santa Clara County Highlights
 Santa Clara County Highlights Data and Partnerships: Pivotal Elements to Create Healthy Communities November 6th, 2009 David Hill, PhD, MPH Cities of Santa Clara County 2 The pivotal elements Data evidence-based
SPARTANBURG COUNTY BODY MASS INDEX (BMI) REPORT
 REPORT") SPARTANBURG COUNTY BODY MASS INDEX (BMI) REPORT 1 st, 3 rd, and 5 th GRADE STUDENTS SCHOOL YEAR 2013-2014 2 CHILDHOOD OBESITY TASK FORCE ADVISORY COMMITTEE PARTNERS 3 4 TABLE OF CONTENTS Preface.. 4 Project
SPARTANBURG COUNTY BODY MASS INDEX (BMI) REPORT 1 st, 3 rd, and 5 th GRADE STUDENTS SCHOOL YEAR 2013-2014 2 CHILDHOOD OBESITY TASK FORCE ADVISORY COMMITTEE PARTNERS 3 4 TABLE OF CONTENTS Preface.. 4 Project
Baptist Health Beaches Community Health Needs Assessment Priorities Implementation Plans
 Baptist Health Beaches Community Health Needs Assessment Priorities Implementation Plans Health Disparities Heart Disease Stroke Hypertension Diabetes Adult Type II Preventive Health Care Smoking and Smokeless
Community Health Improvement Plan
 Community Health Improvement Plan 2014-2017 IOWA COUNTY WISCONSIN Prepared for Iowa County Health Department by: Jenny Pritchett, Director/Health Officer 1 P a g e Contents Letter from the Health Officer..
Table of Contents INTRODUCTION... 2 METHODOLOGY Appendix 1 Comparison of Peer Counties... 6
 Table of Contents INTRODUCTION... 2 METHODOLOGY... 4 Appendix 1 Comparison of... 6 Appendix 2 Key Findings from the MAPP Assessments... 7 BARRIERS TO HEALTHCARE ACCESS... 7 HEALTH STATUS... 9 DEATH INDICATORS...
Nutrition and Physical Activity Situational Analysis
 Nutrition and Physical Activity Situational Analysis A Resource to Guide Chronic Disease Prevention in Alberta Executive Summary December 2010 Prepared by: Alberta Health Services, AHS Overview Intrinsic
Centers for Disease Control and Prevention (CDC) Coalition C/o American Public Health Association 800 I Street NW Washington, DC,
 Coalition C/o American Public Health Association 800 I Street NW Washington, DC,") Centers for Disease Control and Prevention (CDC) Coalition C/o American Public Health Association 800 I Street NW Washington, DC, 20001 202-777-2514 Donald Hoppert, Director of Government Relations, American
Centers for Disease Control and Prevention (CDC) Coalition C/o American Public Health Association 800 I Street NW Washington, DC, 20001 202-777-2514 Donald Hoppert, Director of Government Relations, American
5 Public Health Challenges
 5 Public Health Challenges The most recent Mecklenburg County Community Health Assessment (CHA) prioritized the prevention of premature death and disability from chronic disease as the number one public
State of the County Health Report
 Robeson County Department of Public Health Working Together To Create Healthier & Safer Communities Table of Contents Morbidity & Mortality..1 Leading Causes of Death Leading Mortality Trends Top Causes
Healthy People, Healthy Communities
 Healthy People, Healthy Communities Public Health Policy Statements on Public Health Issues The provincial government plays an important role in shaping policies that impact both individual and community
Enhancing the Health of Our Communities Alisahah Cole, MD & Chief Community Impact Officer. December 2018
 Enhancing the Health of Our Communities Alisahah Cole, MD & Chief Community Impact Officer December 2018 Goals GET INFORMED GET INSPIRED GET UNCOMFORTABLE GET ACTIVATED Carolinas HealthCare System Is Our
C O M M U N I T Y. Community Health Improvement Plan. A Healthier Clark County
 C O M M U N I T Y Community Health Improvement Plan A Healthier Clark County 2016-2020 Healthy Clark County Coalition (HCCC): The Healthy Clark County Coalition (HCCC) is represented by a variety of Clark
Regional Executive Summary Project Overview
 Carlisle Regional Medical Center Hamilton Health Center Holy Spirit A Geisinger Affiliate Penn State Milton S. Hershey Medical Center Pennsylvania Psychiatric Institute PinnacleHealth System Executive
Health Disparities Matter!
 /KirwanInstitute www.kirwaninstitute.osu.edu Health Disparities Matter! Kierra Barnett, Research Assistant Alex Mainor, Research Assistant Jason Reece, Director of Research Health disparities are defined
North Carolina Prevention Report Card 2005
 NC Prevention Partners www.ncpreventionpartners.org Report Card North Carolina Prevention Report Card 2005 Does North Carolina make the grade for prevention? Why Focus on Tobacco, Nutrition, and Physical
Arizona Health Improvement Plan
 Arizona Health Improvement Plan Arizona Alliance for Community Health Centers February 4, 2015 Will Humble, MPH ADHS Director Leading Health Issues State Health Assessment Obesity Behavioral Health Services
COMMUNITY HEALTH NEEDS ASSESSMENT AND IMPLEMENATION PLAN JUNE 2016
 COMMUNITY HEALTH NEEDS ASSESSMENT AND IMPLEMENATION PLAN JUNE 2016 is, and has been an active member of the Healthy Blair County Coalition. Representatives of have been members of the Steering Committee,
Reducing the Impact of Cancer. Listening to American Indians in Minnesota
 Reducing the Impact of Cancer Listening to American Indians in Minnesota Table of Contents Background... 2 Summary of Results... 3 Part 1: Summary of responses from American Indian listening sessions...
2018 Community Health Improvement Plan
 Table 2018 Community Health Improvement Plan This is the annual review report for the first year of implementation of the Community Health Improvement Plan. The 2016-2018 Washoe County Community Health
Community Health Needs Assessment. Implementation Strategy.. SAMPLE TEMPLATE
 Community Health Needs Assessment & Implementation Strategy SAMPLE TABLE OF CONTENTS Executive Summary I. Service Area and Population II. Community Health Needs Assessment Partners.. III. IV. Community
Community Health Needs Assessment
 Community Health Needs Assessment Scott County, Missouri This assessment will identify the health needs of the residents of Scott County, Missouri, and those needs will be prioritized and recommendations
Be Healthy. Nutrition and Food Security
 Be Healthy Nutrition and Food Security Texas Health and Human Services HHS oversees the operation of the health and human services system. HHS has responsibility for strategic leadership, administrative
BACKGROUND. benefit focus, we seek to improve health status, especially for the most vulnerable and underserved individuals in our community.
 BACKGROUND As the third-largest medical center in the St. Louis metropolitan area, St. Anthony s is dedicated to our patients and the community that exists outside of our hospital walls. Every day, our
2016 Community Service Plan & Community Health Improvement Plan
 2016 Community Service Plan & Community Health Improvement Plan A.O. Fox Memorial Hospital The Mary Imogene Bassett Hospital (dba: Bassett Medical Center) & Otsego County Health Department Service Area:
PROMEDICA MONROE REGIONAL HOSPITAL 2016 COMMUNITY HEALTH NEEDS ASSESSMENT IMPLEMENTATION PLAN
 PROMEDICA MONROE REGIONAL HOSPITAL 2016 COMMUNITY HEALTH NEEDS ASSESSMENT IMPLEMENTATION PLAN 2017-2019 Approved and Adopted on December 19, 2016 PROMEDICA MONROE REGIONAL HOSPITAL 2016 COMMUNITY HEALTH
SENTARA MARTHA JEFFERSON HOSPITAL 2016 Community Health Needs Assessment Supplemental Report
 SENTARA MARTHA JEFFERSON HOSPITAL 2016 Community Health Needs Assessment Supplemental Report Sentara Martha Jefferson Hospital participated in a collaborative effort to conduct a community health needs
Wisconsin Office of Rural Health Rural Communities Grant Program APPLICATION COVER SHEET -- Attachment A
 Wisconsin Office of Rural Health Rural Communities Grant Program 2014-15 Project Title: Planning for Healthier Lifestyles in Polk County Planning Proposal: X APPLICATION COVER SHEET -- Attachment A Implementation
Service Area: Herkimer, Fulton & Montgomery Counties. 140 Burwell St. 301 N. Washington St. Little Falls, NY Herkimer, NY 13350
 2016 Community Service Plan & Community Health Improvement Plan & Herkimer County Public Health Service Area: Herkimer, Fulton & Montgomery Counties Bassett Healthcare Network s Little Falls Hospital Herkimer
COMMUNITY HEALTH NEEDS ASSESSMENT IMPLEMENTATION STRATEGY
 2016 COMMUNITY HEALTH NEEDS ASSESSMENT IMPLEMENTATION STRATEGY Table of Contents Introduction... 2 Executive summary... 2 University Care System s mission, vision, and values... 2 Description of the health
Almost 1 in 10 adults have been diagnosed with diabetes. Alabama is ranked fifth in prevalence of diabetes in the United States and its territories.
 2008 FACT SHEET The Diabetes Branch addresses the impact of diabetes in Alabama by developing policies, recommendations, and programs about the disease and related issues. The program is funded through
Tennessee Taming the Diabetes Crisis: The Tennessee Journey to Better Health
 Tennessee Taming the Diabetes Crisis: The Tennessee Journey to Better Health Susan R. Cooper MSN, RN Commissioner Tennessee Department of Health NCSL July 23,2009 Adult Diabetes Diabetes Prevalence, Tennessee
Community Health Priority: Alcohol & Other Drug Misuse and Abuse
 Alcohol & Other Drug Misuse and Abuse Melissa Dotter, MS Drug Free Communities Coordinator 715.261.1962 melissa.dotter@co.marathon.wi.us Creating a culture in communities where alcohol is used responsibly
PREVENTION. Category: Initiation of Tobacco Use. Strategies to Reduce tobacco use initiation. used smokeless tobacco on one or more of the
 Goal 1: Reduce incidence and mortality from tobaccorelated cancers (lung, throat, mouth, pancreas, kidney, bladder and cervix) in all populations. Category: Initiation of Tobacco Use OBJECTIVE 1.1: By
Women and Substance Abuse in Nevada. A Special Report
 Women and Substance Abuse in Nevada A Special Report Women and Substance Abuse in Nevada A Special Report Table of Contents Introduction 1 Statewide Demographics & Archival Data 2 Nevada Statewide Telephone
New Delhi Declaration
 New Delhi Declaration on High Blood Pressure Thirty-first Meeting of Ministers of Health of Countries of the WHO South-East Asia Region 10 September 2013, New Delhi, India We, the Health Ministers of
Sarpy/Cass Department of Health and Wellness
 This 2012 Community Health Report Card is the product of many community surveys and agency recordkeeping. The staff at the Sarpy/ Department of Health and Wellness finds value in all of this community
COMMUNITY PARTNERS MEETING
 PUBLIC HEALTH & SYSTEMS IN ACTION COMMUNITY PARTNERS MEETING Presenter: Amy Fagan, Assistant Director of Health Date: February 23, 2017 HEALTH DISTRICT VISION HEALTHY PEOPLE, HEALTHY COMMUNITY HEALTH COALITION
Introduction Communities That Care and the Summit County Mental Wellness Alliance
 Community Assessment Report February 1, 2018 Introduction Communities That Care and the Summit County Mental Wellness Alliance By the beginning of 2017, the Summit County community was clearly ready for
Steps to a Healthier Cleveland Youth Risk Behavior Survey
 2007 Steps to a Healthier Cleveland Youth Risk Behavior Survey Center for Adolescent Health Case Western Reserve University Department of Family Medicine TABLE OF CONTENTS Acknowledgements... 3 Overview...
Some college. Native American/ Other. 4-year degree 13% Grad work
 Access to Affordable Health Care Access to affordable care improves quality of life and health outcomes. Without affordable access to a doctor, residents are more likely to end up in expensive emergency
2016 PRC Community Health Needs Assessment
 2016 PRC Community Health Needs Assessment Staunton City, Waynesboro City, and Augusta County, Virginia Prepared for: Augusta Health By Professional Research Consultants, Inc. The PRC Community Health
Ideas + Action for a Better City learn more at SPUR.org. tweet about this #FoodisMedicine
 Ideas + Action for a Better City learn more at SPUR.org tweet about this event: @SPUR_Urbanist #FoodisMedicine Food is Medicine SPUR February 12, 2019 Rita Nguyen, MD Assistant Health Officer Chronic Disease
An APA Report: Executive Summary of The Behavioral Health Care Needs of Rural Women
 1 Executive Summary Of The Behavioral Health Care Needs of Rural Women The Report Of The Rural Women s Work Group and the Committee on Rural Health Of the American Psychological Association Full Report
The State of Obesity 2017 Better Policies for a Healthier America
 The State of Obesity 2017 Better Policies for a Healthier America Southern Obesity Summit Atlanta, GA October 2, 2017 Richard Hamburg Executive Vice President and COO Trust for America s Health Overview
Randolph County. State of the County Health Report 2014
 Randolph County State of the County Health Report 2014 Inside this issue: Priority Areas 2-4 Overweight and Obesity Data 5 Physical Activity 6 Substance Abuse 7 Access to Care 8 Morbidity and Mortality
ALACHUA COUNTY COMMUNITY HEALTH ASSESSMENT
 ALACHUA COUNTY COMMUNITY HEALTH ASSESSMENT JUNE 2016 This page intentionally left blank. ALACHUA COUNTY COMMUNITY HEALTH ASSESSMENT (CHA) Contents Executive Summary 4 The Alachua Community Health Assessment
THE HEALTH OF LINN COUNTY, IOWA A COUNTYWIDE ASSESSMENT OF HEALTH STATUS AND HEALTH RISKS
 THE HEALTH OF LINN COUNTY, IOWA A COUNTYWIDE ASSESSMENT OF HEALTH STATUS AND HEALTH RISKS Project Team Pramod Dwivedi, Health Director Amy Hockett, Epidemiologist Kaitlin Emrich, Assessment Health Promotion
Nutrition and Physical Activity
 Nutrition and Physical Activity Lifestyle choices made early in life have a significant impact on the patterns of chronic disease developed in adulthood. In the U.S., poor diet and physical inactivity
2017 Community Health Needs Assessment Report
 2017 Community Health Needs Assessment Report, Florida Prepared for: By: Professional Research Consultants, Inc. 11326 P Street Omaha, NE 68137-2316 www.prccustomresearch.com 2017-0313-02 June 2017 Table
CSR Greater Fargo-Moorhead Community Health Needs Assessment of Residents. August 2015
 2015 Greater Fargo-Moorhead Community Health Needs Assessment of Residents August 2015 Results from a March 2015 generalizable survey of community residents in the Greater Fargo-Moorhead Metropolitan Area
ADVOCACY IN ACTION TO ACHIEVE GENDER EQUALITY AND THE SUSTAINABLE DEVELOPMENT GOALS IN KENYA
 ADVOCACY IN ACTION TO ACHIEVE GENDER EQUALITY AND THE SUSTAINABLE DEVELOPMENT GOALS IN KENYA Wherever inequality lives, there stands a girl or woman able to turn the tide of adversity into a tidal wave
National Strategy. for Control and Prevention of Non - communicable Diseases in Kingdom of Bahrain
 Kingdom of Bahrain Ministry of Health National Strategy for Control and Prevention of Non - communicable Diseases in Kingdom of Bahrain 2014 2025 Behavioural Risk Factors Tobacco Use Unhealthy Diets Physical
Funding Opportunity. Developing an Effective Response to Health Inequalities in South East Edinburgh
 Funding Opportunity Developing an Effective Response to Health Inequalities in South East Edinburgh Developing a Community Health Response in South East Edinburgh This funding opportunity is for the development
The new PH landscape Opportunities for collaboration
 The new PH landscape Opportunities for collaboration Dr Ann Hoskins Director Children, Young People & Families Health and Wellbeing Content Overview of new PH system PHE function and structure Challenges
Campus Health Report and Strategic Plan University of Central Oklahoma Healthy Campus Initiative
 Campus Health Report and Strategic Plan 2014 2016 University of Central Oklahoma Healthy Campus Initiative UCO Campus Health Report & Strategic Plan 2014 2016 Health & Wellness Tenant of Transformative
Snapshot 2016 COMMUNITY HEALTH ASSESSMENT
 Snapshot 2016 COMMUNITY HEALTH ASSESSMENT Background Hospitals that are 501 (c) (3) and public health agencies in Ohio are required to complete a community health assessment (CHA) every three years. A
DEPRESSION AND ANXIETY STATUS IN KANSAS
 DEPRESSION AND ANXIETY STATUS IN KANSAS 2011 Behavioral Risk Factor Surveillance System This report was prepared by the Bureau of Health Promotion, Kansas Department of Health and Environment February
2014 Healthy Community Study Executive Summary
 2014 Healthy Community Study Executive Summary BACKGROUND The Rockford Health Council (RHC) exists to build and improve community health in the region. To address this mission, RHC conducts a Healthy Community
Canadian Mental Health Association
 Canadian Mental Health Association Manitoba and Winnipeg Supports & Services Founded in 1918, CMHA National is a Canada-wide charitable organization with 87 branches in over 330 communities across the
Implementing the 2017 President s Challenge: Primary, Secondary & Tertiary Prevention of Addiction & Substance Misuse
 Implementing the 2017 President s Challenge: Primary, Secondary & Tertiary Prevention of Addiction & Substance Misuse Jay Butler, MD, President of ASTHO, Chief Medical Officer, Alaska Department of Health
WASHINGTON STATE COMPARISONS TO: KITSAP COUNTY CORE PUBLIC HEALTH INDICATORS May 2015
 WASHINGTON STATE COMPARISONS TO: KITSAP COUNTY CORE PUBLIC HEALTH INDICATORS This is a companion document to the Core Public Health Indicators that provides a comparison of to Washington State for the
Resolution in Support of Improved Food Access and Education in Jefferson County
 Resolution in Support of Improved Food Access and Education in Jefferson County WHEREAS healthy food defined as the product of a system where food is grown, processed, transported and marketed in a healthy
Program Focus Team Action Plan:
 Page 1 of 5 Program Focus Team Action Plan: 4-H/YD Promote Healthy Eating and Physical Activity in Kansans 2014-2015 Situation: Note* This Action Plan is an adaptation of the plan developed by the Nutrition,
Community Health Needs Assessmen. Implementation Strategy
 Community Health Needs Assessmen Implementation Strategy HOSPITAL BACKGROUND Baptist Memorial Restorative Care Hospital was established in 1994 as a long term acute care hospital and is located within
Prince George s County Health Department Health Report Findings
 Prince George s County Health Department 2018 Health Report Findings Our Residents Socioeconomic Factors Compared to Maryland, Prince George s residents: have a higher median household income, are employed
Vision To foster an inclusive community that is informed, caring and driven to ensure youth wellbeing.
 New Member Packet I chose to be on this council because it seemed interesting and I have never been a part of something like this. This council is different because you get to express yourself. James M.
How Wheaton Franciscan is meeting the NEEDS of our community. NSWERING HE CALL
 ANSWERING THE CALL MEETING OUR COMMUNITY NEEDS S July 1, 2013 June 30, 2016 How Wheaton Franciscan is meeting the NEEDS of our community. NSWERING HE CALL COMMUNITY HEALTH NEEDS IMPLEMENTATION PLAN: ST.
David V. McQueen. BRFSS Surveillance General Atlanta - Rome 2006
 David V. McQueen Associate Director for Global Health Promotion, National Center for Chronic Disease Prevention and Health Promotion, Atlanta BRFSS Surveillance General Atlanta - Rome 2006 Behavioral Risk
FACT SHEET % 15.0% Percent 10.0%
 FACT SHEET The Branch addresses the impact of diabetes in Alabama by developing, policies, recommendations, and programs about the disease and related issues. The program is funded through a five-year
2017 PRC Community Health Needs Assessment
 2017 PRC Community Needs Assessment Obici care Foundation Service Area Western Tidewater, Virginia Prepared for: OBICI HEALTHCARE FOUNDATION By Professional Research Consultants, Inc. The PRC Community
Community Health Status Assessment
 Community Health Status Assessment EXECUTIVE SUMMARY The Community Health Status Assessment (CHSA) is one of four assessments completed as part of the 2015-2016 Lane County Community Health Needs Assessment
County Health Rankings Monroe County 2016
 Health Rankings Monroe 2016 Graphics of Health Rankings Include All Counties In the North Central Health District Public Health for Middle Georgia Serving Baldwin, Bibb, Crawford, Hancock, Houston, Jasper,
2016 Collier County Florida Health Assessment Executive Summary
 2016 Florida Health Assessment Executive Summary Prepared by: The Health Planning Council of Southwest Florida, Inc. www.hpcswf.com Executive Summary To access the report in its entirety, visit http://www.hpcswf.com/health-planning/health-planningprojects/.
Progress Tracker. Photo - https://www.healthypeople.gov/
 Progress Tracker Healthy People provides a framework for prevention for communities in the U.S. Healthy People 2020 is a comprehensive set of key disease prevention and health promotion objectives. The
Introduction. Behavior Surveillance System (YRBSS),
,") 2015 Prepared for the Colorado Department of Education, Colorado Department of Human Services, and Colorado Department of Public Health & Environment by the University of Colorado Anschutz Community Epidemiology
2015 Prepared for the Colorado Department of Education, Colorado Department of Human Services, and Colorado Department of Public Health & Environment by the University of Colorado Anschutz Community Epidemiology
Adventist HealthCare Washington Adventist Hospital Community Health Needs Assessment Implementation Strategy. Adopted May 15, 2017
 Adventist HealthCare Washington Adventist Hospital 2017-2019 Community Health Needs Assessment Implementation Strategy Adopted May 15, 2017 Implementation Strategy Development & Adoption Adventist HealthCare
KAISER PERMANENTE OF GEORGIA COMMUNITY BENEFIT REPORT
 2016 KAISER PERMANENTE OF GEORGIA COMMUNITY BENEFIT REPORT Partnering to Build Healthy Communities At Kaiser Permanente Georgia, our commitment to improving health has been going strong for more than 30
Washoe County Community Health Needs Assessment EXECUTIVE SUMMARY
 2018 2020 Washoe County Community Health Needs Assessment EXECUTIVE SUMMARY The 2018-2020 Washoe County Community Health Needs Assessment was sponsored in full by the Washoe County Health District and
Community Health Assessment. May 21, 2014
 Community Health Assessment May 21, 2014 1 Presenters Stacey Adams, MS Co-Leader Domain 1 Carol Heier, LCSW Accreditation Coordinator Dale Quinney, MPH Co-Leader Domain 1 2 Recording available There is
STOKES COUNTY. State of the County Health Report 2011
 STOKES COUNTY State of the County Health Report 2011 Demographics Overview of Stokes County Leading Causes of Death Identified Health Priorities Community Action Plan Current Activities 2011 Demographics
Adventist HealthCare Behavioral Health & Wellness Services Community Health Needs Assessment Implementation Strategy. Adopted May 15, 2017
 Adventist HealthCare Behavioral Health & Wellness Services 2017-2019 Community Health Needs Assessment Implementation Strategy Adopted May 15, 2017 Implementation Strategy Development & Adoption Adventist
Savannah :: Chatham. August rd Edition COMMUNITY INDICATORS DATABASE COUNTY CHATHAM. produced by the Armstrong Public Service Center
 photo: GA Dept. of Economic Development Savannah :: Chatham COMMUNITY INDICATORS DATABASE August 2013 3rd Edition produced by the Armstrong Public Service Center CHATHAM COUNTY www.savannah-chatham-indicators.org
County Health Rankings Baldwin County 2016 Graphics of County Health Rankings Include All Counties In the North Central Health District
 Health Rankings Baldwin 2016 Graphics of Health Rankings Include All Counties In the North Central Health District Public Health for Middle Georgia Serving Baldwin, Bibb, Crawford, Hancock, Houston, Jasper,
Manatee County Community Health Assessment 2015
 Manatee County Community Health Assessment 2015 W E L L N E S S C O M M I T T E E M A N A T E E H E A L T H C A R E A L L I A N C E 7 / 3 0 / 1 5 Overview Background 4 Subcommittee Findings Community Health
AVONDALE THE HEALTH OF OUR COMMUNITY. Results from the 2013 Greater Cincinnati Community Health Status Survey
 AVONDALE THE HEALTH OF OUR COMMUNITY Results from the 2013 Community Health Status Survey Copyright 2015 by Interact for Health. All rights reserved. To cite this work, please use this format: Interact
Behavioral Risk Factor Surveillance System (BRFSS)
") Behavioral Risk Factor Surveillance System (BRFSS) LINA BALLUZ, MPH, Sc.D. Chief Proposed Office of Surveillance, Epidemiology and Laboratory Services Behavior Surveillance Division Overview Background
Behavioral Risk Factor Surveillance System (BRFSS) LINA BALLUZ, MPH, Sc.D. Chief Proposed Office of Surveillance, Epidemiology and Laboratory Services Behavior Surveillance Division Overview Background
7/29/2010. Medical Access 10% Genetics 30% Behavior 40% Social 15% Environment 5%
 Worksite Wellness Survey Results Spring 2007 Presented by UW-RF Health and Wellness Coalition Wellness and Productivity How much more productive are you when you are at your physical and emotional peak?
INTEGRATED HEALTH PROMOTION STRATEGIC PLAN
 INTEGRATED HEALTH PROMOTION STRATEGIC PLAN 2017-2021 INTRODUCTION Central Bayside Community Health Services (CBCHS) has a long history of health promotion and prevention work. By taking a population health
No one should be at risk of poor health because of their social and economic situations.
 HEALTH MATTERS No one should be at risk of poor health because of their social and economic situations. Members of municipal government play an important role in shaping policies that impact all aspects
RUSH OAK PARK HOSPITAL. FY14 FY16 Implementation Strategy
 RUSH OAK PARK HOSPITAL FY14 FY16 Implementation Strategy Introduction For more than 100 years, Rush Oak Park Hospital has been dedicated to providing exceptional and compassionate health care to its surrounding
And thank you so much for the invitation to speak with you this afternoon.
 Check Against Delivery Calgary Chamber of Volunteer Organizations AGM June 25, 2012, Calgary, Alberta Honourable Dave Hancock Thank you for the introduction And thank you so much for the invitation to
Mercy Defiance Hospital Community Health Needs Assessment Implementation Plan. Introduction
 Mercy Defiance Hospital 2014-2016 Community Health Needs Assessment Implementation Plan IDENTIFYING INFORMATION Hospital Name: Mercy Defiance Hospital (MDH) Primary Address: 1404 E. Second Street, Defiance,
Project LIM Lifestyle Interventions Matter
 Executive Summary Project LIM Lifestyle Interventions Matter Project LIM (Lifestyles Interventions Matter) will focus on lifestyle modification to reduce the risk factors for prediabetes and ultimately
14. HEALTHY EATING INTRODUCTION
 14. HEALTHY EATING INTRODUCTION A well-balanced diet is important for good health and involves consuming a wide range of foods, including fruit and vegetables, starchy whole grains, dairy products and