Epidemiological and economic impact of potential increased hepatitis C treatment uptake in Australia
|
|
|
- George Hopkins
- 5 years ago
- Views:
Transcription

1 Epidemiological and economic impact of potential increased hepatitis C treatment uptake in Australia 2010
2 2010 ISBN This publication is available at Internet address Suggested citation:. Epidemiological and economic impact of potential increased hepatitis C treatment uptake in Australia 2010., The University of New South Wales, Sydney, NSW CFI Building, Corner Boundary & West Streets, Darlinghurst NSW 2010 AUSTRALIA Telephone: Facsimile: International prefix: recept@nchecr.unsw.edu.au
 is a blood-borne virus; HCV infection is one of the most commonly notified diseases in Australia and is a major health problem.")
 sharing injecting equipment.")
3 National Centre in HIV Epidemiology and Clinical Research Epidemiological and economic impact of potential increased hepatitis C treatment uptake in Australia 2010 Executive summary Hepatitis C virus (HCV) is a blood-borne virus; HCV infection is one of the most commonly notified diseases in Australia and is a major health problem. About 284,000 people were infected with HCV in Australia in 2008, with nearly 10,000 new infections occurring each year. Most new HCV infections are a result of injecting drug users (IDUs) sharing injecting equipment. Despite advances in HCV therapy and most of the treatment costs covered by the government, the number of HCV-infected people receiving treatment has remained low, at around 3,500 (1-2% of chronic HCV cases) in At current HCV treatment levels, the burden of advanced liver disease is projected to continue to rise over the next two decades. This project investigated the possible effects of increased rates of treatment, compared with current treatment rates, on the future health and economic burden of hepatitis C around Australia. Methods A dynamic mathematical model was used to reflect the current burden and project the future burden of chronic HCV infection around Australia for each of the following treatment s: Current treatment : no change from current practice; Reduction : treatments decline to 2,000 per year from 2010 onwards; 1: treatments increase steadily to 6,000 per year from 2011 onwards; 2: treatments increase steadily to 8,000 per year from 2012 onwards; 3: treatments increase steadily to 12,000 per year from 2014 onwards. 1
4 Key findings Under the current treatment, where about 3,500 cases are treated each year, it was estimated that there would be about 11,700 new cases of hepatitis C in Australia in 2010, which would remain relatively stable over the next 30 years (Figure 1). The model estimated 228 new cases of liver failure, 121 new cases of hepatocellular carcinoma (HCC), 44 liver transplant cases, and 241 liver-related deaths in These cases would increase by 11-13% in the next 30 years under current conditions. Under the reduced treatment, where treatments decreased to 2,000 cases per year, the number of new cases of liver failure, HCC, liver transplants and liver-related deaths over the next 30 years could all be expected to increase, by 41-43%. If treatment rates are increased over the next five years to 6,000, 8,000, or 12,000 cases per year (increased treatment s 1, 2, and 3), the number of new cases of liver failure and HCC over 30 years would be expected to decrease by 6-7%, 12-14%, and 20-22%, respectively. Similarly, the number of liver-related deaths and liver transplants would decline by 3-4%, 9-10%, and 17-18% respectively over the period. Under the increased treatment s 1, 2, and 3, the incremental quality-adjusted life years (QALYs) gained would be 1,174, 1,778 and 2,687 per year, respectively. Under the increased treatment s 1, 2, and 3, there would be total cost savings on average of about $3.5m, $5.5m, and $9m each year respectively over the next 30 years (5% discount). There would no longer be cost savings if the health sector cost is increased by 50%. From a health sector perspective, the incremental cost-effectiveness ratios (ICERs) for increased treatment s 1, 2, and 3 relative to the current treatment were $17,028, $16,891, and $16,577 per QALY respectively for the period (5% discount). Conclusions hepatitis C treatment up to about three times the current levels will increase life years (LYs) and QALYs in the long-term, and is associated with total cost savings. It is cost-effective and comparable to other well-accepted public health interventions. Strategies to improve treatment uptake remains a critical priority. 2
5 Acknowledgements This report was conducted by a team of investigators at the National Centre in HIV Epidemiology and Clinical Research, The University of New South Wales, Sydney, Australia and the Toronto Health Economics and Technology Assessment Collaborative, University of Toronto, Toronto, Canada. The technical analysis was carried out by Rosie Thein, Alexander Hoare, David Wilson, and Murray Krahn. Greg Dore acted in an advisory manner. Amy Kwon, Jenny Iversen, and Lisa Maher provided and interpreted data for use in the analysis. The authors would also like to thank Ann Magnus, Deakin University, Melbourne and Jonathan Anderson, NCHECR, Sydney, and Louisa Wright and James Jansson for their technical assistance. The work presented in this report was funded by Roche Products (Australia) Pty Ltd. Dr. Krahn is the F. Norman Hughes Chair in Pharmacoeconomics, Faculty of Pharmacy, University of Toronto. The is funded by the Australian Government Department of Health and Ageing and is affiliated with the Faculty of Medicine, The University of New South Wales. For further information contact Dr. Rosie Thein or A/Prof David Wilson, The University of New South Wales CFI Building, Corner Boundary & West Streets, Darlinghurst NSW 2010 AUSTRALIA Telephone: Facsimile: rthein@nchecr.unsw.edu.au / dp.wilson@unsw.edu.au 3
6 Contents Executive summary... 1 Acknowledgements... 3 Glossary... 5 Introduction... 8 Overview of methods... 9 Key outcomes Epidemiological and economic evaluation of hepatitis C treatment s in Australia Epidemiological and economic evaluation of hepatitis C treatment s in the Australian Capital Territory Epidemiological and economic evaluation of hepatitis C treatment s in New South Wales Epidemiological and economic evaluation of hepatitis C treatment s in the Northern Territory 29 Epidemiological and economic evaluation of hepatitis C treatment s in Queensland Epidemiological and economic evaluation of hepatitis C treatment s in South Australia Epidemiological and economic evaluation of hepatitis C treatment s in Tasmania Epidemiological and economic evaluation of hepatitis C treatment s in Victoria Epidemiological and economic evaluation of hepatitis C treatment s in Western Australia Discussion Limitations References Appendix A: Additional results and tables for Australia Appendix B: Additional results and tables for ACT Appendix C: Additional results and tables for NSW Appendix D: Additional results and tables for NT Appendix E: Additional results and tables for QLD Appendix F: Additional results and tables for SA Appendix G: Additional results and tables for TAS Appendix H: Additional results and tables for VIC Appendix I: Additional results and tables for WA Appendix J: Methods and data sources
7 Glossary Abbreviations CEA CUA HCC HCV ICER IDU(s) LY(s) MBS NCHECR PBS PEG-IFN QALY(s) SVR Cost-effectiveness analysis Cost-utility analysis Hepatocellular carcinoma Hepatitis C virus Incremental cost-effectiveness ratio Injecting drug user(s) Life year(s) Medical Benefits Schedule Pharmaceutical Benefits Scheme Pegylated interferon Quality-Adjusted-Life-Year(s) Sustained virological response 5
8 Definition of terms Cost-effectiveness analysis Cost-effectiveness ratio Cost-utility analysis Cost-utility ratio Direct medical costs/health sector costs Discounting Effectiveness Health state Incremental cost Incremental effect Incremental cost-effectiveness ratio A technique in which the cost and effects of an intervention and an alternative are presented in a ratio of incremental cost to incremental effect. The incremental cost of using an intervention to obtain a unit of effectiveness (such as dollars per life-year gained) compared with an alternative, such as another treatment or no treatment. A type of cost-effectiveness analysis that uses quality-adjusted life-years as the effectiveness end point. By convention, cost-utility analyses are often referred to as cost-effectiveness analyses; however, not all cost-effectiveness studies use cost-utility methods. The incremental cost of an intervention to achieve one quality-adjusted life-year, compared with an alternate intervention. The cost of medical resources consumed, such as physician visits, surgery, medical supplies, and hospitalisation. These costs are included in the numerator of the cost-effectiveness ratio. The conversion of future dollars spent and future health outcomes (such as life-years saved in 20 years from an intervention provided today) to their present value. The extent to which an intervention achieves health improvements, which can be measured in terms of such outcomes as cases of disease prevented, years of life saved, or quality-adjusted life-years saved The condition of a person s health, including any disease, disability, and functional status The difference between the cost of an intervention and the cost of the comparator. The difference between the effect of an intervention and the effect of the comparator. The incremental cost of an intervention divided by the incremental effectiveness. 6
9 Quality-adjusted life years Sensitivity analysis Sustained virological response Time cost Utility A method that assigns a preference weight to each health state, determines the time spent in each state, and estimates life expectancy as the sum of the products of each preference weight and time spent in each state. Analysis that determines the impact of changing one or several variables in a model or analysis on the outcome of the analysis. A sensitivity analysis allows a range of plausible inputs to be considered when there is uncertainty about the true value of an input. An example is comparing results using a discount rate of 5% with result using rates of 0% and 3%. Undetectable HCV RNA by a sensitive assay at the end of a 24-week follow-up period after completion of treatment. It is considered a cure for the infection. The cost of the time a patient incurs while seeking or receiving care. A person s preference for a particular health state or treatment outcome, measured by using the standard gamble technique, the time-tradeoff, or rating scale. The time-tradeoff and rating scale methods do not incorporate uncertainty into their questions and technically do not produce utilities. Higher levels of utility indicate a greater preference. 7
10 Introduction Hepatitis C virus infection The public health burden of hepatitis C virus (HCV) infection is substantial, costing the Australian health care system approximately $156 million in 2004/05 [1]. An estimated 284,000 people are currently infected with HCV in Australia [2], and liver disease caused by HCV infection is now the leading indication for liver transplantation [3]. Existing preventive and therapeutic efforts are inadequate. Approximately 10,000 new infections occur each year in Australia, primarily through sharing of injecting equipment by injecting drug users (IDUs) [4, 5]. Although some people are able to clear the hepatitis C virus from their bodies without treatment, most HCV infections become chronic or longlasting [6, 7]. This can result in progressive liver disease, cirrhosis (advanced scarring of the liver), liver failure, and liver cancer (hepatocellular carcinoma (HCC)) [8]. There are various HCV strains (genotypes), each having different chances of achieving a sustained virological response (SVR) [9, 10]. Treatment for hepatitis C Treatment for hepatitis C has improved in recent years with the shift from standard interferon and ribavirin therapy, prior to 2004, to pegylated interferon (PEG-IFN) and ribavirin combination therapy, which consists of weekly injections combined with daily oral medication. The treatment is administered over a period of either 24 or 48 weeks (depending on the strain of HCV), involves significant side effects and requires complex medical support. Depending on the strain of the virus, effective antiviral treatment has a cure rate of 40-50% of people with genotype 1 (the most common genotype in Australia) and 70-80% for non-1 genotypes [9, 11, 12]. Antiviral therapy is provided largely through the Highly Specialised Drugs Program (the S100 scheme) [3]. The number of prescriptions for hepatitis C treatment through the S100 scheme has tripled from around 1,150 in 2003 to around 3,500 in 2007 [3]. The number of prescriptions for treatment of chronic hepatitis C initially increased considerably following the removal in April 2006 of the requirement for biopsy-proven liver damage prior to treatment, and the increase continued in 2008 [2, 13]. The clinical benefits of successful treatment are considerable, including a low probability of HCV re-infection [14-16], reduced injury to the liver [17], halting the progression (and even regression) of severe liver disease [18], long-term improvement in health-related quality of life [19-21] and productivity [19, 21], reduced rates of HCC [22], and improved survival [8]. Modelling and economic evaluation can provide guidance to policymakers who want to ensure that scarce health care resources are used in the most effective and cost-effective manner possible. This project aimed to examine the possible effects of increased rates of treatment, compared with current treatment rates, on the future health and economic burden of hepatitis C around Australia. 8
11 Overview of methods A population-based dynamic mathematical model of HCV transmission was developed to describe the present HCV epidemic in Australia and to forecast the expected epidemic trends in the future due to changes in treatment rates for hepatitis C. The model describes IDUs and non-idus aged in Australia. Non-IDUs considered were those who acquired HCV through routes other than injecting drug use. See Appendix J for a schematic diagram of the model structure and model input parameters. The model tracked the shifts in the number of IDUs in the population, including the entry of new injectors, transitions between injecting status (for example, transition from occasional to regular), and the rate of cessation of injecting. The infection of IDUs with HCV was simulated based on injecting behaviour and mixing in the population. The model also tracked the natural history of disease progression for people infected with HCV. The model was used to estimate the number of people in each HCV health state, including important clinical endpoints such as liver failure, HCC, and liver transplant, as well as drug-related, disease-related, and background death rates. The mathematical model was calibrated to be consistent with available epidemiologic data in Australia in terms of incidence and prevalence of HCV and to reflect clinical data on progression of HCV infection, that is, incidence of liver failure and HCC, the number of liver transplants and liver-related deaths, and the number of people treated in the year 2008 [2]. Separate analyses were carried out for Australia at a national level and for each State and Territory. State and Territory-specific demographic data and Australian populationspecific epidemiologic and behavioural data were used to inform inputs for the State and Territory model simulations. Economic analysis A cost-effectiveness and cost-utility analysis was performed to compare the costs and benefits associated with current levels of treatment for hepatitis C with four alternative hepatitis C treatment s in Australia and in each State and Territory. The economic analysis was that of a health sector perspective as well as the recommended societal perspective. Under the health sector costs, drug costs accrue to the federal government and the remaining costs accrue to the State government. The societal perspective considers all costs, regardless of who incurs them, including such components as patients/family time and out-of-pocket costs, and productivity losses and gains related to their illness or its treatment. The economic impact was modelled for three time horizons: from the year 2010 until 2013 (four-year time horizon); from the year 2010 until 2039 (30-year time horizon), and from the year 2010 until 2079 (lifetime time horizon). Costs were discounted at 3% and 5% annually. Separate economic analyses were carried out for Australia at a national level and for each State and Territory using population-based cost and utility data. 9
12 Hepatitis C treatment s Currently, approximately 3,500 people infected with hepatitis C (~1-2% of people infected with chronic hepatitis C) receive combination PEG-IFN and ribavirin therapy each year in Australia [3]. Treatment s simulated in this study include: Current treatment : no change from current practice; Reduction : treatments decline to 2,000 from 2010 onwards; 1: treatments increase steadily to 6,000 per year from 2011 onwards; 2: treatments increase steadily to 8,000 per year from 2012 onwards; 3: treatments increase steadily to 12,000 per year from 2014 onwards. Further details of methods are provided in Appendix J. Key outcomes The key health outcomes of the analysis include the number of new HCV cases averted, new liver failure cases averted, new HCC cases averted, liver transplant cases averted, the number of hepatitis C related deaths averted, and LYs gained. The years of potential life lost due to HCV was estimated using the life expectancy of the average Australian, adjusted for premature mortality associated with hepatitis C. Based on an Australian linkage study [23] and published literature [23], it was assumed that the average age at liver-related death was 65 (range, 61-70) years. The key economic outcomes include total costs associated with hepatitis C care, QALYs, and incremental cost-effectiveness ratio (ICER), defined as the additional cost of a specific treatment strategy divided by its additional health benefit, expressed here as cost per SVR, LY gained or QALY gained. The ICER for an alternative treatment was compared in reference to the next most effective option as well as to the current treatment. 10

13 Epidemiological and economic evaluation of hepatitis C treatment s in Australia Key findings Effect on new HCV cases in Australia over the period Under levels of current treatment, where about 3,500 cases are treated each year, it was estimated that there would be approximately 11,700 new cases of hepatitis C in Australia in 2010, which would remain relatively stable over the next 30 years (Figure 1). The model estimated 228 new cases of liver failure, 121 new cases of HCC, 44 liver transplant cases, and 241 liver-related deaths in The annual number of these cases would increase each year under current conditions to an 11-13% increase by Under the reduced treatment, where treatment decreased from approximately 3,500 to 2,000 cases per year, the number of new cases of liver failure, HCC, liver transplants and liver-related deaths over the next 30 years could all be expected to increase, by 41-43%. It was estimated that there would be 1,288 additional cases of HCV (43 per year), 1,114 new cases of liver failure (37 per year), 535 new cases of HCC (18 per year), 174 cases receiving liver transplants (six per year), and 894 liver-related deaths (30 per year) relative to the current treatment (Table 1). If treatment rates are increased over the next five years from approximately 3,500 cases to 6,000, 8,000, or 12,000 cases per year (increased treatment s 1, 2, and 3), the number of new cases of liver failure over 30 years would be expected to decrease by 7%, 14%, and 22%, respectively. Similarly, the number of new cases of HCC would decline relatively by 6%, 12%, and 20% and liver-related death by 3%, 9%, and 17%, respectively. Numbers of liver transplants would decline by 4%, 10%, and 18%, respectively over the period (Figure 1). Compared with the current treatment, it was estimated that there would be 2,621 to 8,360 fewer new cases of HCV ( per year), 696 to 1,257 fewer new cases of liver failure (23-42 per year), 338 to 609 fewer new cases of HCC (11-20 per year), 111 to 200 fewer cases receiving liver transplants (4-7 per year), and 572 to 1,031 fewer liver-related deaths (19-34 per year) over the period, with increased treatment rates from 6,000 to 12,

14 Figure 1: Expected epidemiological outcomes associated with changes in HCV treatment rates in Australia HCV incidence HCC incidence Incidence of liver failure Number of annual liver transplants Number of annual liver-related deaths Prevalence of HCV in IDUs 12
15 Table 1. Health impact of hepatitis C treatment strategies in Australia, Description Life years lost / gained HCV treatment s incremental, relative to the current * Current Reduction ,414-17,641 11,288 15,373 20,353 Number of treatment gains -26,280 24,840 36,886 53,776 (sustained virological response) HCV cases / cases averted 350,465-1,288 2,621 4,582 8,360 Liver failure cases / cases 7,330-1, ,257 averted HCC cases / cases averted 3, HCV-related liver transplant 1, cases / cases averted Liver-related deaths / deaths 7, ,031 averted Undiscounted health outcomes. *Incremental refers to the difference in effect, between current and alternative. Positive indicates increased benefit relative to current treatment. HCV, hepatitis C virus; SVR, sustained virological response; HCC, hepatocellular carcinoma. Effect on life years in Australia over the period Under the current treatment, it was estimated that about 5,114 LYs per year (153,414 / 30) would be lost over the 30-year period due to liver-related death (Table 1). Under the reduced, 588 additional LYs would be lost each year (Table 1) and 1,122 fewer QALYs gained each year relative to the current treatment. According to increased treatment s 1, 2, and 3, the incremental LYs gained relative to the current treatment would be 376, 512 and 678 per year, respectively over the next 30 years (Table 1). Compared with the current treatment, the respective incremental QALYs gained would be 1,174, 1,778 and 2,687 per year, respectively. 13
16 Cost of hepatitis C Annual hepatitis C related health care costs (in 2008 Australian dollars) ranged from $858 for diagnosed early stage of disease to $120,017 for patients requiring a liver transplant (see Table 2). Patient and family costs associated with hepatitis C ranged from $2,800 for early stage disease to $13,700 for a liver transplant. Lifetime productivity costs per person with incident HCV were: $35,143 (undiscounted); $23,222 (3% discount); and $19,624 (5% discount). Table 2. Annual health care costs of hepatitis C (2008 Australian dollars) Description Value ($) 95% CI * ($) Ref Annual costs of care Acute hepatitis C Pre-cirrhosis stage of chronic hepatitis C (fibrosis stage to 3) - 1st year Pre-cirrhosis stage of chronic hepatitis C (fibrosis stage to 3) - successive years Compensated cirrhosis (fibrosis stage 4) Decompensated cirrhosis (liver failure) - includes ascites, 13,363 12,762-13,964 variceal haemorrhage and hepatic encephalopathy Hepatocellular carcinoma 17,872 14,655-21,089 Liver transplant - 1st year 120,017 98, ,620 Liver transplant - successive years 13,363 10,958-15,768 Costs of HCV treatment Treatment of acute HCV patients with pegylated 10,782 10,458-11,105 interferon only or pegylated interferon and ribavirin - 24 weeks Treatment of chronic HCV patients with pegylated 10,829 10,458-11,105 interferon and ribavirin - 24 weeks Treatment of chronic HCV patients with pegylated interferon and ribavirin - 48 weeks 18,835 18,270-19,400 * Uncertainty in cost estimates was based on a Canadian population-based analysis of health care costs associated with hepatitis C: a population-based analysis (Paterson, Krahn et al). Assumes annual health care costs of acute hepatitis C equivalent to costs of pre-cirrhosis stage of hepatitis C. However, it has been reported that the majority of acute hepatitis C cases are asymptomatic and about 25-30% of patients develop symptoms. Costs of care for successive years of liver transplant assume the same as costs of care for liver failure. Costs of HCV treatment include drugs and monitoring (including follow-up). Costs are inflated to 2008 dollars, using the health component of consumer price index. CI, confidence intervals; LB, lower bound; UB, upper bound; HCV, hepatitis C virus. 14
17 Effect on costs incurred through HCV infection in Australia over the period Under the current, an estimated $476.6m in total costs would be incurred on average due to hepatitis C each year over the next 30 years (Table 3). Of these costs, $102.4m (21%), $250.8m (53%), and $123.4m (26%) were attributed to health sector costs, patient and family costs, and productivity costs, respectively. Drug costs accounted for about $46.1m (45%) of the total health sector costs on average each year. Compared with the current treatment, about $2.6m additional total costs would accrue on average each year under the reduced treatment over the next 30 years. According to increased treatment s 1, 2, and 3, there would be total cost savings on average of about $3.5m, $5.5m, and $9.1m each year, respectively. If the health sector cost is increased by 50%, there would no longer be cost savings. Table 4 shows the disaggregated 30-year projected costs by HCV disease state. The proportion of total costs attributable to people with cirrhosis and its sequelae and liver transplantation decreased from 20% to 16%, reflecting the slowing of disease progression in people on treatment and the reduction in the burden of disease. Cost-effectiveness and cost-utility analysis Table 5 summarises cost-effectiveness and cost-utility results. ICERs of each strategy are reported relative to the next best strategy. From a health sector perspective, the ICERs for increased treatment s 1, 2, and 3 relative to the next best strategy was $17,028, $16,627, and $15,974 per QALY, respectively. Alternatively, the ICERs for increased treatment s 1, 2, and 3 relative to the current were $17,028, $16,891 and $16,577 per QALY, respectively. See Appendix A for summaries of health and economic outcomes associated with hepatitis C treatment s in Australia over the period 2010 to 2013 and 2010 to
18 Table 3. Costs associated with hepatitis C treatment strategies in Australia, HCV treatment s Description Incremental $, relative to the current Costs: (undiscounted) Current Reduction Health sector costs Drug costs* 2,579,598, ,221, ,079, ,635, ,085,478 Other costs 3,162,972,486 52,970,450-39,196,255-55,523,050-80,616,803 Total 5,742,570, ,250, ,883, ,112, ,468,674 Treated (% 58% 51% 63% 66% 69% Total) Patient/family 14,016,213, ,877, ,867,402-1,206,126,989-1,822,030,663 costs Treated 8% 6% 10% 11% 13% Productivity costs 12,316,512,629 45,261,697-92,096, ,027, ,812,112 Total costs 32,075,296, ,888, ,080, ,042,239-1,220,374,101 Costs: (3% discount) Health sector costs Drug costs* 1,731,206, ,240, ,181, ,323, ,173,778 Other costs 2,120,637,444 18,151,944-9,893,223-12,734,668-17,069,770 Total 3,851,843, ,088, ,287, ,589, ,104,008 Patient/family 9,418,436, ,266, ,634, ,685,406-1,058,883,441 costs Productivity costs 5,478,586,116 22,153,521-40,521,318-69,532, ,286,053 Total costs 18,748,866, ,331, ,867, ,628, ,065,486 Costs: (5% discount) Health sector costs Drug costs* 1,381,616, ,333, ,777, ,053, ,219,723 Other costs 1,691,381,588 6,187, ,892 1,904,980 4,677,705 Total 3,072,998, ,146, ,928, ,958, ,897,428 Patient/family 7,522,955, ,625, ,286, ,202, ,806,941 costs Productivity costs 3,702,290,839 15,638,426-27,029,022-45,859,703-80,923,267 Total costs 14,298,244,303 78,118, ,387, ,103, ,832,780 Incremental costs for each alternative treatment relative to current treatment. Positive value indicates increase in cost. *Pegylated interferon and ribavirin costs. Costs are expressed in 2008 Australian dollars. 16
19 Table 4. Projected 30-year health care costs of hepatitis C by disease stage under alternative treatment s in Australia, (5% discount, 2008 Australian dollars) Hepatitis C treatment s Description Current Reduction (% of total) (% of total) (% of total) (% of total) (% of total) Acute hepatitis C 31,964,848 (2.3%) 32,083,040 (2.5%) 31,734,160 (2.1%) 31,562,590 (2.0%) 31,232,931 (1.9%) Fibrosis stage 0 327,282,593 (23.5%) 267,999,082 (20.8%) 403,439,297 (27.0%) 445,840,537 (28.9%) 510,634,868 (31.7%) Fibrosis stage 1 273,026,378 (19.6%) 229,177,369 (17.8%) 325,661,546 (21.8%) 352,960,981 (22.9%) 391,124,833 (24.7%) Fibrosis stage 2 360,111,804 (25.8%) 338,731,253 (26.2%) 350,902,403 (23.5%) 338,649,850 (21.9%) 315,093,893 (19.5%) Fibrosis stage 3 125,811,124 (9.0%) 128,520,231 (10.0%) 118,964,912 (8.0%) 115,641,105 (7.5%) 111,302,944 (6.9%) Compensated cirrhosis 109,267,485 (7.8%) 111,415,896 (8.6%) 106,629,712 (7.1%) 105,443,451 (6.8%) 103,727,656 (6.4%) Decompensated cirrhosis 87,758,051 (6.3%) 97,918,718 (7.6%) 81,236,202 (5.4%) 78,876,750 (5.1%) 76,002,114 (4.7%) Hepatocellular 22,989,765 (1.6%) 25,763,110 (2.0%) 21,216,742 (1.4%) 20,575,187 (1.3%) 19,792,931 (1.2%) carcinoma Liver transplant 56,924,343 (4.1%) 59,485,726 (4.6%) 55,173,999 (3.7%) 54,539,359 (3.5%) 53,775,041 (3.3%) Total costs 1,395,136,390 1,291,094,426 1,494,958,974 1,544,089,810 1,612,687,210 17
20 Table 5. Cost-effectiveness and cost-utility analysis, Australia ( ; 5% discount) from a health sector perspective: incremental cost per life year gained; incremental cost per sustained virological response achieved; and incremental cost per QALY gained Treatment Cost ($) cost Effect (LY lost) Reduction 2,828,852,138 87,995 effect ICER* ($/LY) Current 3,072,998, ,146,196 81,290 6,705 $36, ,324,926, ,928,128 76,843 4,448 $56, ,452,956, ,958,626 75,227 6,063 $62, ,639,895, ,897,428 73,269 8,021 $70,676 Treatment Cost ($) cost Effect (SVR) Reduction 2,828,852,138 56,786 effect ICER* ($/SVR) Current 3,072,998, ,146,196 70,539 13,753 17, ,324,926, ,928,128 84,500 13,961 18, ,452,956, ,958,626 91,499 20,961 18, ,639,895, ,897, ,696 31,157 18,195 Treatment Cost ($) cost Effect (QALY) Reduction 2,828,852,138 6,228,117 effect ICER* ($/QALY) Current 3,072,998, ,146,196 6,241,830 13,713 17, ,324,926, ,928,128 6,256,625 14,795 17, ,452,956, ,030,498 6,264,325 7,700 16, ,639,895, ,938,803 6,276,028 11,703 15,974 Years of potential life lost due to HCV was estimated using the life expectancy of the average Australian, adjusted for premature mortality associated with hepatitis C. Incremental Quality-Adjusted Life Years (QALYs) gained. Incremental life years (LYs) gained. * ICER, incremental cost-effectiveness ratio of each strategy relative to the next best strategy; SVR, sustained virological response. Both costs and effects are discounted at 5%. 18
21 Epidemiological and economic evaluation of hepatitis C treatment s in the Australian Capital Territory The epidemiologic and economic trends under various HCV treatment s for ACT would be similar to the national trends since Australian population-specific epidemiologic and behavioural data were used to inform inputs for the ACT model simulations. Key findings Effect on new HCV cases in ACT over the period Under the current treatment, where about 47 cases on average are treated each year, it was estimated that there would be approximately 160 new cases of hepatitis C in ACT in 2010, which would remain relatively stable over the next 30 years (Figure 2). The model estimated about three new cases of liver failure, one to two new cases of HCC, nil to one liver transplant cases, and three liver-related deaths in The annual number of these cases would increase each year under current conditions to an increase of between 11-13% by Under the reduced treatment, whereby treatment decreased from approximately 47 to 26 cases per year, the number of new cases of liver failure, HCC, liver transplants and liver-related deaths over the next 30 years could all be expected to increase, by 41-43%. It was estimated that there would be 17 additional HCV cases, 15 new cases of liver failure, seven new cases of HCC, two cases receiving liver transplants, and 105 liver-related deaths relative to current treatment (Table 6). If treatment rates are increased over the next five years from approximately 47 cases to 78, 103, or 157 cases per year (increased treatment s 1, 2, and 3), it was estimated that there would be 35 to 113 fewer new HCV cases, nine to 17 fewer new cases of liver failure, five to eight fewer new cases of HCC, one to three fewer cases receiving liver transplants, and eight to 14 fewer liver-related deaths over the 30-year period relative to the current treatment (Table 6). 19
22 Figure 2: Expected epidemiological outcomes associated with changes in HCV treatment rates in Australian Capital Territory HCV incidence HCC incidence Incidence of liver failure Number of annual liver transplants Number of annual liver-related deaths Prevalence of HCV in IDUs 20
23 Table 6. Health impact of hepatitis C treatment strategies in ACT, Description Life years lost / gained HCV treatment s incremental, relative to the current * Current Reduction , Number of treatment gains (Sustained virological response) HCV cases / cases averted 4, Liver failure cases / cases averted HCC cases / cases averted HCV-related liver transplant cases / cases averted Liver-related deaths / deaths averted Undiscounted health outcomes. *Incremental refers to the difference in effect, between current and alternative. Positive indicates increased benefit relative to current treatment. HCV, hepatitis C virus; SVR, sustained virological response; HCC, hepatocellular carcinoma. Effect on life years in ACT over the period (undiscounted) Under the current treatment, it was estimated that 2,080 LYs (69 per year) would be lost over the 30-year period due to liver-related death (Table 7). About 239 additional LYs (eight per year) would be lost and 456 fewer QALYs (15 per year) would be gained under the reduced treatment relative to the current treatment. Under the increased treatment s 1, 2, and 3, the incremental LYs gained relative to the current treatment would be 152, 208, and 276, respectively (range, five to nine per year) over the next 30 years (Table 6). Compared with the current treatment, the respective incremental QALYs gained would be 475, 723, and 1,093 (range, per year). Effect on costs incurred through HCV infection in ACT over the period (5% discount) Under the current, an estimated $6.5m in total costs would be incurred on average due to hepatitis C each year over the next 30 years (Table 7). Of these costs, $1.4m, $3.4m, and $1.7m, were attributed to health sector costs, patient and family costs, and productivity costs, respectively. Drug costs accounted for about $624,500 of the total health sector costs on average each year. Compared with the current treatment, about $35,300 additional total costs would accrue on average each year under the reduced treatment over the next 30 years. 21
24 Under the increased treatment s 1, 2, and 3, there would be total cost savings on average of about $46,300, $75,000, and $124,000 each year, respectively. Table 7. Costs associated with hepatitis C treatment strategies in ACT, HCV treatment s Description Incremental $, relative to the current Costs: (undiscounted) Current Reduction Drug costs* 34,978,705-6,525,088 6,099,673 9,066,631 13,235,135 Other costs 42,889, , , ,114-1,094,024 Total 77,867,885-5,807,137 5,577,092 8,314,517 12,141,111 Treated (% Total) 58% 51% 63% 66% 69% Patient/family costs 190,056,227 10,370,721-10,755,484-16,350,372-24,710,112 Treated 8% 6% 10% 11% 13% Productivity costs 167,008, ,739-1,245,369-2,183,079-3,984,433 Total costs 434,932,990 5,177,323-6,423,761-10,218,933-16,553,434 Costs: (3% discount) Drug costs* 23,474,726-4,315,035 4,212,416 6,309,402 9,317,954 Other costs 28,755, , , , ,033 Total 52,230,082-4,069,086 4,083,526 6,137,196 9,085,921 Patient/family costs 127,711,557 5,887,920-6,208,836-9,470,681-14,361,130 Productivity costs 74,288, , , ,608-1,685,567 Total costs 254,229,957 2,119,192-2,672,451-4,276,093-6,960,776 Costs: (5% discount) Drug costs* 18,734,378-3,394,206 3,405,280 5,125,876 7,623,785 Other costs 22,934,745 83,774 5,692 26,174 62,998 Total 41,669,122-3,310,432 3,410,972 5,152,050 7,686,783 Patient/family costs 102,009,327 4,157,241-4,433,718-6,779,819-10,305,300 Productivity costs 50,202, , , ,662-1,097,534 Total costs 193,880,646 1,058,818-1,387,283-2,249,431-3,716,050 Incremental costs for each alternative treatment relative to current treatment. Positive value indicates increase in cost. *Pegylated interferon and ribavirin costs. Costs are expressed in 2008 Australian dollars. 22
25 Cost-effectiveness and cost-utility analysis Table 8 summarises cost-effectiveness and cost-utility results. ICERs of each strategy are reported relative to the next best strategy. Alternatively, the ICERs for increased treatment s 1, 2, and 3 relative to the current were $17,119, $16,897 and $16,572 per QALY, respectively. Table 8. Cost-effectiveness and cost-utility analysis, ACT ( ; 5% discount) from a health sector perspective: incremental cost per life year gained; incremental cost per sustained virological response achieved; and incremental cost per QALY gained Treatment Cost ($) cost Effect (LY lost) Reduction 38,358,691 1,193 effect ICER* ($/LY) Current 41,669,122 3,310,432 1, $36, ,080,095 3,410,972 1, $56, ,821,172 5,152,050 1, $62, ,355,905 7,686, $70,655 Treatment Cost ($) cost Effect (SVR) Reduction 38,358, effect ICER* ($/SVR) Current 41,669,122 3,310, , ,080,095 3,410,972 1, , ,821,172 5,152,050 1, , ,355,905 7,686,783 1, ,191 Treatment Cost ($) cost Effect (QALY) Reduction 38,358,691 84,452 effect ICER* ($/QALY) Current 41,669,122 3,310,432 84, , ,080,095 3,410,972 84, , ,821,172 1,741,078 84, , ,355,905 2,534,733 85, ,950 Years of potential life lost due to HCV was estimated using the life expectancy of the average Australian, adjusted for premature mortality associated with hepatitis C. Incremental Quality-Adjusted Life Years (QALYs) gained. Incremental life years (LYs) gained. * ICER, incremental cost-effectiveness ratio of each strategy relative to the next best strategy; SVR, sustained virological response. Both costs and effects are discounted at 5%. See Appendix B for summaries of health and economic outcomes associated with hepatitis C treatment s in ACT over the period 2010 to 2013 and 2010 to
26 Epidemiological and economic evaluation of hepatitis C treatment s in New South Wales The epidemiologic and economic trends under various HCV treatment s for NSW would be similar to the national trends since Australian population-specific epidemiologic and behavioural data were used to inform inputs for the NSW model simulations. Key findings Effect on new HCV cases in NSW over the period Under the current treatment, where about 1,044 cases on average are treated each year, it was estimated that there would be approximately 3,557 new cases of hepatitis C in NSW in 2010, which would remain relatively stable over the next 30 years (Figure 3). The model estimated about 69 new cases of liver failure, 37 new cases of HCC, 13 cases receiving liver transplants, and 73 liver-related deaths in The annual number of these cases would increase each year under current conditions to an 11-13% increase by Under the reduced treatment, where treatment decreased from approximately 1,044 to 618 cases per year, the number of new cases of liver failure, HCC, liver transplants and liver-related deaths over the next 30 years could all be expected to increase, by 41-43%. It was estimated that there would be 391 additional HCV cases, 337 new cases of liver failure, 162 new cases of HCC, 53 cases receiving liver transplants, and 271 liver-related deaths relative to current treatment (Table 9). If treatment rates are increased over the next five years from approximately 1,100 cases to 1,800, 2,300, or 3,500 cases per year (increased treatment s 1, 2, and 3), it was estimated that there would be 795 to 2,535 fewer new HCV cases, 211 to 381 fewer new cases of liver failure, 102 to 185 fewer new cases of HCC, 34 to 61 fewer cases receiving liver transplants, and 173 to 313 fewer liver-related deaths over the 30-year period relative to the current treatment (Table 9). 24

27 Figure 3: Expected epidemiological outcomes associated with changes in HCV treatment rates in New South Wales HCV incidence HCC incidence Incidence of liver failure Number of annual liver transplants Number of annual liver-related deaths Prevalence of HCV in IDUs 25
28 Table 9. Health impact of hepatitis C treatment strategies in NSW, Description Current HCV treatment s incremental, relative to the current * Reduction Life years lost / gained 46,510-5,344 3,423 4,659 6,171 Number of treatment gains (Sustained virological response) -7,965 7,531 11,181 16,304 HCV cases / cases averted 106, ,389 2,535 Liver failure cases / cases averted 2, HCC cases / cases averted 1, HCV-related liver transplant cases / cases averted Liver-related deaths / deaths averted 2, Undiscounted health outcomes. *Incremental refers to the difference in effect, between current and alternative. Positive indicates increased benefit relative to current treatment. HCV, hepatitis C virus; SVR, sustained virological response; HCC, hepatocellular carcinoma. Effect on life years in NSW over the period (undiscounted) Under the current treatment, it was estimated that 46,510 LYs (1,550 per year) would be lost over the 30-year period due to liver-related death (Table 9). Under the reduced treatment, about 5,344 additional LYs (178 per year) would be lost and 10,199 fewer QALYs (340 per year) would be gained under the reduced treatment relative to the current treatment. According to the increased treatment s 1, 2, and 3, the incremental LYs gained relative to the current treatment would be 3,423, 4,659, and 6,171, respectively ( per year) over the next 30 years (Table 9). Compared with the current treatment, the respective incremental QALYs gained would be 10,676, 16,164, and 24,442, respectively ( per year). Effect on costs incurred through HCV infection in NSW over the period (5% discount) Under the current, an estimated $144.5m in total costs would be incurred on average due to hepatitis C each year over the next 30 years (Table 10). Of these costs, $31m, $76m, and $37m, were attributed to health sector costs, patient and family costs, and productivity costs, respectively. Drug costs accounted for about $14m (45%) of the total health sector costs on average each year. Compared with the current treatment, about $787,100 additional total costs would accrue on average each year under the reduced treatment over the next 30 years. 26
29 Under increased treatment s 1, 2, and 3, there would be total cost savings on average of about $1m, $2m, and $3m each year, respectively. Table 10. Costs associated with hepatitis C treatment strategies in NSW, HCV treatment s Description Incremental $, relative to the current Costs: (undiscounted) Current Reduction Drug costs* 782,051, ,858, ,473, ,708, ,909,906 Other costs 958,912,804 16,024,453-11,889,896-16,810,711-24,453,760 Total 1,740,964, ,833, ,583, ,898, ,456,146 Treated (% Total) 58% 51% 63% 66% 69% Patient/family costs 4,249,264, ,723, ,638, ,533, ,434,439 Treated 8% 6% 10% 11% 13% Productivity costs 3,733,973,985 13,724,125-27,923,726-48,806,872-89,079,910 Total costs 9,724,202, ,613, ,978, ,442, ,058,202 Costs: (3% discount) Drug costs* 524,846,271-96,438,909 94,366, ,060, ,326,880 Other costs 642,909,777 5,483,847-3,001,716-3,847,112-5,183,772 Total 1,167,756,048-90,955,062 91,364, ,213, ,143,107 Patient/family costs 2,855,366, ,535, ,689, ,724, ,060,612 Productivity costs 1,660,933,661 6,713,731-12,287,498-21,073,158-37,683,391 Total costs 5,684,056,684 47,294,406-60,612,051-95,584, ,600,896 Costs: (5% discount) Drug costs* 418,861,915-75,848,357 76,358, ,598, ,447,499 Other costs 512,772,963 1,863,218 45, ,371 1,411,443 Total 931,634,879-73,985,139 76,403, ,186, ,858,942 Patient/family costs 2,280,718,329 92,859,261-99,862, ,566, ,384,390 Productivity costs 1,122,417,676 4,737,745-8,196,796-13,897,671-24,536,574 Total costs 4,334,770,883 23,611,867-31,655,791-50,277,610-83,062,021 Incremental costs for each alternative treatment relative to current treatment. Positive value indicates increase in cost. *Pegylated interferon and ribavirin costs. Costs are expressed in 2008 Australian dollars. 27
30 Cost-effectiveness and cost-utility analysis Table 11 summarises cost-effectiveness and cost-utility results. ICERs of each strategy are reported relative to the next best strategy. Alternatively, the ICERs for increased treatment s 1, 2, and 3 relative to the current were $17,028, $16,898 and $16,574 per QALY, respectively. Table 11. Cost-effectiveness and cost-utility analysis, NSW ( ; 5% discount) from a health sector perspective: incremental cost per life year gained; incremental cost per sustained virological response achieved; and incremental cost per QALY gained Treatment Cost ($) cost Effect (LY lost) Reduction 857,649,740 26,675 effect ICER* ($/LY) Current 931,634,879 73,985,139 24,645 2,030 $36, ,008,038,327 76,403,449 23,296 1,349 $56, ,046,820, ,186,061 22,807 1,837 $62, ,103,493, ,858,942 22,212 2,432 $70,661 Treatment Cost ($) cost Effect (SVR) Reduction 857,649,740 17,219 effect ICER* ($/SVR) Current 931,634,879 73,985,139 21,385 4,166 17, ,008,038,327 76,403,449 25,619 4,234 18, ,046,820, ,186,061 27,737 6,352 18, ,103,493, ,858,942 30,832 9,447 18,192 Treatment Cost ($) cost Effect (QALY) Reduction 857,649,740 1,888,170 effect ICER* ($/QALY) Current 931,634,879 73,985,139 1,892,323 4,153 17, ,008,038,327 76,403,449 1,896,810 4,487 17, ,046,820,939 38,782,612 1,899,139 2,329 16, ,103,493,821 56,672,881 1,902,692 3,553 15,951 Years of potential life lost due to HCV was estimated using the life expectancy of the average Australian, adjusted for premature mortality associated with hepatitis C. Incremental Quality-Adjusted Life Years (QALYs) gained. Incremental life years (LYs) gained. * ICER, incremental cost-effectiveness ratio of each strategy relative to the next best strategy; SVR, sustained virological response. Both costs and effects are discounted at 5%. See Appendix C for summaries of health and economic outcomes associated with hepatitis C treatment s in NSW over the period 2010 to 2013 and 2010 to
31 Epidemiological and economic evaluation of hepatitis C treatment s in the Northern Territory The epidemiologic and economic trends under various HCV treatment s for NT would be similar to the national trends since Australian population-specific epidemiologic and behavioural data were used to inform inputs for the NT model simulations. Key findings Effect on new HCV cases in NT over the period Under the current treatment, where about 36 cases on average are treated each year, it was estimated that there would be approximately 121 new cases of hepatitis C in NT in 2010, which would remain relatively stable over the next 30 years (Figure 4). The model estimated about two new cases of liver failure, one to two new cases of HCC, nil to one case receiving liver transplant, and two to three liver-related deaths in The annual number of these cases would increase each year under current conditions to an increase of 11-13% by Under the reduced treatment, where treatment decreased from approximately 36 to 21 cases per year, the number of new cases of liver failure, HCC, liver transplants and liverrelated deaths over the next 30 years could all be expected to increase, by 41-43%. It was estimated that there would be 13 additional HCV cases, 11 new cases of liver failure, six new cases of HCC, two cases receiving liver transplants, and nine liver-related deaths relative to current treatment (Table 12). If treatment rates are increased over the next five years from approximately 36 cases to 60, 78, and 120 cases per year (increased treatment s 1, 2, and 3), it was estimated that there would be 27 to 86 fewer new HCV cases, seven to 13 fewer new cases of liver failure, three to six fewer new cases of HCC, one to two fewer cases receiving liver transplants, and six to 11 fewer liver-related deaths over the 30-year period relative to the current treatment (Table 12). 29

32 Figure 4: Expected epidemiological outcomes associated with changes in HCV treatment rates in the Northern Territory HCV incidence HCC incidence Incidence of liver failure Number of annual liver transplants Number of annual liver-related deaths Prevalence of HCV in IDUs 30
33 Table 12. Health impact of hepatitis C treatment strategies in NT, Description Current HCV treatment s incremental, relative to the current * Reduction Life years lost / gained 1, Number of treatment gains (Sustained virological response) HCV cases / cases averted 3, Liver failure cases / cases averted HCC cases / cases averted HCV-related liver transplant cases / cases averted Liver-related deaths / deaths averted Undiscounted health outcomes. *Incremental refers to the difference in effect, between current and alternative. Positive indicates increased benefit relative to current treatment. HCV, hepatitis C virus; SVR, sustained virological response; HCC, hepatocellular carcinoma. Effect on life years in NT over the period (undiscounted) Under the current treatment, it was estimated that 1,583 LYs (53 per year) would be lost over the 30-year period due to liver-related death in NT (Table 12). Under the reduced treatment, about 182 additional LYs (6 per year) would be lost and 347 fewer QALYs (12 per year) would be gained under the reduced treatment relative to the current treatment. According to the increased treatment s 1, 2, and 3, the incremental LYs gained relative to the current treatment would be 116,159, and 210, respectively (four to seven per year) over the next 30 years (Table 12). Compared with the current treatment, the respective incremental QALYs gained would be 363, 551, and 832, respectively (12-28 per year). Effect on costs incurred through HCV infection in NT over the period (5% discount) Under the current, an estimated $5m in total costs would be incurred on average due to hepatitis C each year over the next 30 years (Table 13). Of these costs, $1m, $3m, and $1m, were attributed to health sector costs, patient and family costs, and productivity costs, respectively. Drug costs accounted for about $475,300 (45%) of the total health sector costs on average each year. Compared with the current treatment, about $26,700 additional total costs would accrue on average each year under the reduced treatment over the next 30 years. 31
34 Under increased treatment s 1, 2, and 3, there would be total cost savings on average of about $36,000, $57,000, and $94,000 each year, respectively. Table 13. Costs associated with hepatitis C treatment strategies in NT, HCV treatment s Description Incremental $, relative to the current Costs: (undiscounted) Current Reduction Drug costs* 26,622,411-4,963,764 4,645,196 6,900,914 10,074,148 Other costs 32,643, , , , ,492 Total 59,265,481-4,419,717 4,240,975 6,327,234 9,243,657 Treated (% Total) 58% 51% 63% 66% 69% Patient/family costs 144,652,498 7,880,487-8,222,500-12,451,386-18,796,416 Treated 8% 6% 10% 11% 13% Productivity costs 127,111, , ,358-1,662,180-3,031,358 Total costs 331,029,014 3,927,811-4,931,883-7,786,332-12,584,118 Costs: (3% discount) Drug costs* 17,866,694-3,281,073 3,211,567 4,802,957 7,091,751 Other costs 21,885, , , , ,195 Total 39,752,467-3,095,194 3,109,665 4,671,152 6,916,556 Patient/family costs 97,201,754 4,472,071-4,752,826-7,213,492-10,922,266 Productivity costs 56,541, , , ,811-1,282,153 Total costs 193,495,305 1,605,266-2,061,292-3,260,151-5,287,863 Costs: (5% discount) Drug costs* 14,258,799-2,579,995 2,598,432 3,902,424 5,801,849 Other costs 17,455,689 62,905 1,712 19,407 49,005 Total 31,714,488-2,517,090 2,600,144 3,921,831 5,850,853 Patient/family costs 77,639,695 3,156,437-3,397,445-5,164,643-7,836,550 Productivity costs 38,209, , , , ,737 Total costs 147,563, ,472-1,076,198-1,716,278-2,820,434 Incremental costs for each alternative treatment relative to current treatment. Positive value indicates increase in cost. *Pegylated interferon and ribavirin costs. Costs are expressed in 2008 Australian dollars. 32
35 Cost-effectiveness and cost-utility analysis Table 14 summarises cost-effectiveness and cost-utility results. ICERs of each strategy are reported relative to the next best strategy. Alternatively, the ICERs for increased treatment s 1, 2, and 3 relative to the current were $17,033, $16,885 and $16,588 per QALY, respectively. Table 14. Cost-effectiveness and cost-utility analysis, NT ( ; 5% discount) from a health sector perspective: incremental cost per life year gained; incremental cost per sustained virological response achieved; and incremental cost per QALY gained Treatment Cost ($) cost Effect (LY lost) Reduction 29,197, effect ICER* ($/LY) Current 31,714,488 2,517, $36, ,314,632 2,600, $56, ,636,319 3,921, $62, ,565,341 5,850, $70,727 Treatment Cost ($) cost Effect (SVR) Reduction 29,197, effect ICER* ($/SVR) Current 31,714,488 2,517, , ,314,632 2,600, , ,636,319 3,921, , ,565,341 5,850,853 1, ,203 Treatment Cost ($) cost Effect (QALY) Reduction 29,197,398 64,277 effect ICER* ($/QALY) Current 31,714,488 2,517,090 64, , ,314,632 2,600,144 64, , ,636,319 1,321,687 64, , ,565,341 1,929,022 64, ,015 Years of potential life lost due to HCV was estimated using the life expectancy of the average Australian, adjusted for premature mortality associated with hepatitis C. Incremental Quality-Adjusted Life Years (QALYs) gained. Incremental life years (LYs) gained. * ICER, incremental cost-effectiveness ratio of each strategy relative to the next best strategy; SVR, sustained virological response. Both costs and effects are discounted at 5%. See Appendix D for summaries of health and economic outcomes associated with hepatitis C treatment s in the Northern Territory over the period 2010 to 2013 and 2010 to

36 Epidemiological and economic evaluation of hepatitis C treatment s in Queensland The epidemiologic and economic trends under various HCV treatment s for QLD would be similar to the national trends since Australian population-specific epidemiologic and behavioural data were used to inform inputs for the QLD model simulations. Key findings Effect on new HCV cases in QLD over the period Under the current treatment, where about 778 cases on average are treated each year, it was estimated that there would be approximately 2,652 new cases of hepatitis C in QLD in 2010, which would remain relatively stable over the next 30 years (Figure 5). The model estimated about 52 new cases of liver failure, 27 new cases of HCC, ten cases receiving liver transplants, and 54 liver-related deaths in The annual number of these cases would increase each year under current conditions to an 11-13% increase by Under the reduced treatment, where treatment decreased from approximately 778 to 461 cases per year, the number of new cases of liver failure, HCC, liver transplants and liver-related deaths over the next 30 years could all be expected to increase, by 41-43%. It was estimated that there would be 291 additional HCV cases, 252 new cases of liver failure, 121 new cases of HCC, 39 cases receiving liver transplants, and 202 liver-related deaths relative to current treatment (Table 15). If treatment rates are increased over the next five years from approximately 778 cases to 1,300, 1,700, and 2,600 cases per year (increased treatment s 1, 2, and 3), it was estimated that there would be 593 to 1,890 fewer new HCV cases, 157 to 284 fewer new cases of liver failure, 76 to 138 fewer new cases of HCC, 25 to 45 fewer cases receiving liver transplants, and 129 to 233 fewer liver-related deaths over the 30-year period relative to the current treatment (Table 15). 34
37 Figure 5: Expected epidemiological outcomes associated with changes in HCV treatment rates in Queensland HCV incidence HCC incidence Incidence of liver failure Number of annual liver transplants Number of annual liver-related deaths Prevalence of HCV in IDUs 35
38 Table 15. Health impact of hepatitis C treatment strategies in QLD, Description Current HCV treatment s incremental, relative to the current * Reduction Life years lost / gained 34,678-3,991 2,553 3,474 4,602 Number of treatment gains (Sustained virological response) -5,943 5,616 8,337 12,157 HCV cases / cases averted 79, ,036 1,890 Liver failure cases / cases averted 1, HCC cases / cases averted HCV-related liver transplant cases / cases averted Liver-related deaths / deaths averted 1, Undiscounted health outcomes. *Incremental refers to the difference in effect, between current and alternative. Positive indicates increased benefit relative to current treatment. HCV, hepatitis C virus; SVR, sustained virological response; HCC, hepatocellular carcinoma. Effect on life years in QLD over the period (undiscounted) Under the current treatment, it was estimated that 34,678 LYs (1,156 per year) would be lost over the 30-year period due to liver-related death in QLD (Table 15). Under the reduced treatment, about 3,991 additional LYs (133 per year) would be lost and 7,615 fewer QALYs (254 per year) would be gained under the reduced treatment relative to the current treatment. According to the increased treatment s 1, 2, and 3, the incremental LYs gained relative to the current treatment would be 2,553, 3,474, and 4,602, respectively ( per year) over the next 30 years (Table 15). Compared to current treatment, the respective incremental QALYs gained would be 7,963, 12,052, and 18,228, respectively ( per year). Effect on costs incurred through HCV infection in QLD over the period (5% discount) Under the current, an estimated $108m in total costs would be incurred on average due to hepatitis C each year over the next 30 years (Table 16). Of these costs, $23m, $57m, and $28m, were attributed to health sector costs, patient and family costs, and productivity costs, respectively. Drug costs accounted for about $10m (45%) of the total health sector costs on average each year. Compared with the current treatment, about $590,400 additional total costs would accrue on average each year under the reduced treatment over the next 30 years. 36
39 Under increased treatment s 1, 2, and 3, there would be total cost savings on average of about $788,400, $1m, and $2m each year, respectively. Table 16. Costs associated with hepatitis C treatment strategies in QLD, HCV treatment s Description Incremental $, relative to the current Costs: (undiscounted) Current Reduction Drug costs* 583,099, ,805, ,747, ,141, ,622,973 Other costs 714,966,998 11,997,496-8,877,740-12,535,893-18,249,519 Total 1,298,066,279-96,807,632 92,869, ,605, ,373,454 Treated (% Total) 58% 51% 63% 66% 69% Patient/family costs 3,168,262, ,029, ,226, ,558, ,981,802 Treated 8% 6% 10% 11% 13% Productivity costs 2,784,058,111 10,230,770-20,824,450-36,392,324-66,428,436 Total costs 7,250,386,635 86,453, ,181, ,345, ,036,785 Costs: (3% discount) Drug costs* 391,326,550-71,970,833 70,357, ,177, ,329,046 Other costs 479,354,621 4,116,117-2,246,574-2,869,385-3,875,879 Total 870,681,170-67,854,716 68,110, ,308, ,453,168 Patient/family costs 2,128,968,666 98,260, ,197, ,874, ,448,744 Productivity costs 1,238,394,714 5,009,468-9,164,281-15,713,005-28,102,646 Total costs 4,238,044,550 35,414,760-45,251,746-71,279, ,098,222 Costs: (5% discount) Drug costs* 312,304,375-56,623,305 56,932,202 85,447, ,089,843 Other costs 382,324,410 1,407,028 27, ,330 1,044,202 Total 694,628,785-55,216,277 56,959,287 85,885, ,134,045 Patient/family costs 1,700,509,162 69,390,583-74,495, ,017, ,830,683 Productivity costs 836,876,084 3,537,212-6,113,759-10,362,709-18,299,117 Total costs 3,232,014,031 17,711,518-23,650,455-37,495,444-61,995,755 Incremental costs for each alternative treatment relative to current treatment. Positive value indicates increase in cost. *Pegylated interferon and ribavirin costs. Costs are expressed in 2008 Australian dollars. 37
40 Cost-effectiveness and cost-utility analysis Table 17 summarises cost-effectiveness and cost-utility results. ICERs of each strategy are reported relative to the next best strategy. Alternatively, the ICERs for increased treatment s 1, 2, and 3 relative to the current were $17,017, $16,897 and $16,568 per QALY, respectively. Table 17. Cost-effectiveness and cost-utility analysis, QLD ( ; 5% discount) from a health sector perspective: incremental cost per life year gained; incremental cost per sustained virological response achieved; and incremental cost per QALY gained Treatment Cost ($) cost Effect (LY lost) Reduction 639,412,508 19,892 effect ICER* ($/LY) Current 694,628,785 55,216,277 18,375 1,517 $36, ,588,072 56,959,287 17,369 1,006 $56, ,513,947 85,885,162 17,005 1,370 $62, ,762, ,134,045 16,561 1,814 $70,635 Treatment Cost ($) cost Effect (SVR) Reduction 639,412,508 12,834 effect ICER* ($/SVR) Current 694,628,785 55,216,277 15,945 3,111 17, ,588,072 56,959,287 19,102 3,158 18, ,513,947 85,885,162 20,681 4,737 18, ,762, ,134,045 22,990 7,045 18,187 Treatment Cost ($) cost Effect (QALY) Reduction 639,412,508 1,407,817 effect ICER* ($/QALY) Current 694,628,785 55,216,277 1,410,920 3,103 17, ,588,072 56,959,287 1,414,267 3,347 17, ,513,947 28,925,875 1,416,003 1,736 16, ,762,830 42,248,883 1,418,654 2,651 15,937 Years of potential life lost due to HCV was estimated using the life expectancy of the average Australian, adjusted for premature mortality associated with hepatitis C. Incremental Quality-Adjusted Life Years (QALYs) gained. Incremental life years (LYs) gained. * ICER, incremental cost-effectiveness ratio of each strategy relative to the next best strategy; SVR, sustained virological response. Both costs and effects are discounted at 5%. See Appendix E for summaries of health and economic outcomes associated with hepatitis C treatment s in QLD over the period 2010 to 2013 and 2010 to
41 Epidemiological and economic evaluation of hepatitis C treatment s in South Australia The epidemiologic and economic trends under various HCV treatment s for South Australia would be similar to the national trends since Australian population-specific epidemiologic and behavioural data were used to inform inputs for the South Australia model simulations. Key findings Effect on new HCV cases in South Australia over the period Under the current treatment, where about 263 cases on average are treated each year, it was estimated that there would be approximately 897 new cases of hepatitis C in South Australia in 2010, which would remain relatively stable over the next 30 years (Figure 6). The model estimated about 17 new cases of liver failure, nine new cases of HCC, three cases receiving liver transplants, and 18 liver-related deaths in The annual number of these cases would increase each year under current conditions to an 11-13% increase by Under the reduced treatment, where treatment decreased from approximately 263 to 156 cases per year, the number of new cases of liver failure, HCC, liver transplants and liver-related deaths over the next 30 years could all be expected to increase, by 41-43%. It was estimated that there would be 98 additional HCV cases, 85 new cases of liver failure, 41 new cases of HCC, 13 cases receiving liver transplants, and 68 liver-related deaths relative to current treatment (Table 18). If treatment rates are increased over the next five years from approximately 263 cases to 443, 579, and 887 cases per year (increased treatment s 1, 2, and 3), it was estimated that there would be 200 to 639 fewer new HCV cases, 53 to 96 fewer new cases of liver failure, 26 to 47 fewer new cases of HCC, eight to 15 fewer cases receiving liver transplants, and 44 to 79 fewer liver-related deaths over the 30-year period relative to the current treatment (Table 18). 39
42 Figure 7: Expected epidemiological outcomes associated with changes in HCV treatment rates in South Australia HCV incidence HCC incidence Incidence of liver failure Number of annual liver transplants Number of annual liver-related deaths Prevalence of HCV in IDUs 40
43 Table 18. Health impact of hepatitis C treatment strategies in South Australia, Description HCV treatment s incremental, relative to the current * Current Reduction Life years lost / gained 11,731-1, ,177 1,557 Number of treatment gains (Sustained virological response) -2,008 1,898 2,822 4,113 HCV cases / cases averted 26, Liver failure cases / cases averted HCC cases / cases averted HCV-related liver transplant cases / cases averted Liver-related deaths / deaths averted Undiscounted health outcomes. *Incremental refers to the difference in effect, between current and alternative. Positive indicates increased benefit relative to current treatment. HCV, hepatitis C virus; SVR, sustained virological response; HCC, hepatocellular carcinoma. Effect on life years in South Australia over the period (undiscounted) Under the current treatment, it was estimated that 11,731 LYs (391 per year) would be lost over the 30-year period due to liver-related death in South Australia (Table 18). Under the reduced treatment, about 1,346 additional LYs (45 per year) would be lost and 2,570 fewer QALYs (86 per year) would be gained under the reduced treatment relative to the current treatment. According to the increased treatment s 1, 2, and 3, the incremental LYs gained relative to the current treatment would be 861, 1,177, and 1,557, respectively (29-52 per year) over the next 30 years (Table 18). Compared with the current treatment, the respective incremental QALYs gained would be 2,688, 4,082, and 6,167, respectively ( per year). Effect on costs incurred through HCV infection in South Australia over the period (5% discount) Under the current, an estimated $36m in total costs would be incurred on average due to hepatitis C each year over the next 30 years (Table 19). Of these costs, $8m, $19m, and $9m, were attributed to health sector costs, patient and family costs, and productivity costs, respectively. Drug costs accounted for about $3.5m (45%) of the total health sector costs on average each year. Compared with the current treatment, about $198,000 additional total costs would accrue on average each year under the reduced treatment over the next 30 years. Under increased treatment s 1, 2, and 3, there would be total cost savings on average of about $264,000, $425,500, and $700,000 each year, respectively. 41
44 Table 19. Costs associated with hepatitis C treatment strategies in South Australia, HCV treatment s Description Incremental $, relative to the current Costs: (undiscounted) Current Reduction Drug costs* 197,260,316-36,777,272 34,417,728 51,129,271 74,634,792 Other costs 241,870,990 4,029,923-2,977,976-4,264,254-6,176,566 Total 439,131,306-32,747,348 31,439,752 46,865,016 68,458,225 Treated (% Total) 58% 51% 63% 66% 69% Patient/family costs 1,071,810,710 58,383,912-60,834,885-92,324, ,383,483 Treated 8% 6% 10% 11% 13% Productivity costs 941,836,494 3,460,467-7,035,494-12,321,549-22,473,684 Total costs 2,452,778,511 29,097,030-36,430,627-57,781,269-93,398,941 Costs: (3% discount) Drug costs* 132,384,310-24,309,029 23,788,173 35,590,054 52,547,278 Other costs 162,164,156 1,376, , ,350-1,313,096 Total 294,548,465-22,932,442 23,043,640 34,604,703 51,234,182 Patient/family costs 720,221,605 33,131,275-35,148,588-53,498,173-81,013,372 Productivity costs 418,944,476 1,692,099-3,094,017-5,322,335-9,507,898 Total costs 1,433,714,546 11,890,931-15,198,965-24,215,805-39,287,087 Costs: (5% discount) Drug costs* 105,651,401-19,114,268 19,242,070 28,920,061 42,994,601 Other costs 129,339, ,640 20, , ,779 Total 234,990,567-18,648,628 19,262,348 29,057,291 43,346,380 Patient/family costs 575,275,402 23,383,970-25,116,416-38,309,518-58,137,115 Productivity costs 283,112,247 1,193,670-2,063,003-3,511,274-6,191,291 Total costs 1,093,378,216 5,929,012-7,917,071-12,763,501-20,982,025 Incremental costs for each alternative treatment relative to current treatment. Positive value indicates increase in cost. *Pegylated interferon and ribavirin costs. Costs are expressed in 2008 Australian dollars. 42
45 Cost-effectiveness and cost-utility analysis Table 20 summarises cost-effectiveness and cost-utility results. ICERs of each strategy are reported relative to the next best strategy. Alternatively, the ICERs for increased treatment s 1, 2, and 3 relative to the current were $17,067, $16,866 and $16,565 per QALY, respectively. Table 20. Cost-effectiveness and cost-utility analysis, South Australia ( ; 5% discount) from a health sector perspective: incremental cost per life year gained; incremental cost per sustained virological response achieved; and incremental cost per QALY gained Treatment Cost ($) cost Effect (LY lost) Reduction 216,341,938 6,727 effect ICER* ($/LY) Current 234,990,567 18,648,628 6, $36, ,252,915 19,262,348 5, $56, ,047,857 29,057,291 5, $62, ,336,947 43,346,380 5, $70,623 Treatment Cost ($) cost Effect (SVR) Reduction 216,341,938 4,344 effect ICER* ($/SVR) Current 234,990,567 18,648,628 5,394 1,050 17, ,252,915 19,262,348 6,460 1,066 18, ,047,857 29,057,291 6,999 1,605 18, ,336,947 43,346,380 7,778 2,384 18,185 Treatment Cost ($) cost Effect (QALY) Reduction 216,341, ,263 effect ICER* ($/QALY) Current 234,990,567 18,648, ,309 1,046 17, ,252,915 19,262, ,438 1,129 17, ,047,857 9,794, , , ,336,947 14,289, , ,986 Years of potential life lost due to HCV was estimated using the life expectancy of the average Australian, adjusted for premature mortality associated with hepatitis C. Incremental Quality-Adjusted Life Years (QALYs) gained. Incremental life years (LYs) gained. * ICER, incremental cost-effectiveness ratio of each strategy relative to the next best strategy; SVR, sustained virological response. Both costs and effects are discounted at 5%. See Appendix F for summaries of health and economic outcomes associated with hepatitis C treatment s in South Australia over the period 2010 to 2013 and 2010 to
46 Epidemiological and economic evaluation of hepatitis C treatment s in Tasmania The epidemiologic and economic trends under various HCV treatment s for Tasmania would be similar to the national trends since Australian population-specific epidemiologic and behavioural data were used to inform inputs for the Tasmanian model simulations. Key findings Effect on new HCV cases in Tasmania over the period Under the current treatment, where about 73 cases on average are treated each year, it was estimated that there would be approximately 250 new cases of hepatitis C in Tasmania in 2010, which would remain relatively stable over the next 30 years (Figure 7). The model estimated about five new cases of liver failure, two to three new cases of HCC, one case receiving liver transplant, and five liver-related deaths in The annual number of these cases would increase each year under current conditions to an increase of between 11-13% by Under the reduced treatment, where treatment decreased from approximately 73 to 44 cases per year, the number of new cases of liver failure, HCC, liver transplants and liverrelated deaths over the next 30 years could all be expected to increase, by 41-43%. It was estimated that there would be 27 additional HCV cases, 24 new cases of liver failure, 11 new cases of HCC, four cases receiving liver transplants, and 19 liver-related deaths relative to current treatment (Table 21). If treatment rates are increased over the next five years from approximately 73 cases to 124, 162, and 247 cases per year (increased treatment s 1, 2, and 3), it was estimated that there would be fewer new HCV cases, fewer new cases of liver failure, seven to 13 fewer new cases of HCC, 2-4 fewer cases receiving liver transplants, and fewer liver-related deaths over the 30-year period relative to the current treatment (Table 21). 44

47 Figure 7: Expected epidemiological outcomes associated with changes in HCV treatment rates in Tasmania HCV incidence HCC incidence Incidence of liver failure Number of annual liver transplants Number of annual liver-related deaths Prevalence of HCV in IDUs 45
48 Table 21. Health impact of hepatitis C treatment strategies in Tasmania, Description Life years lost / gained HCV treatment s incremental, relative to the current * Current Reduction , Number of treatment gains ,147 (Sustained virological response) HCV cases / cases averted 7, Liver failure cases / cases averted HCC cases / cases averted HCV-related liver transplant cases / cases averted Liver-related deaths / deaths averted Undiscounted health outcomes. *Incremental refers to the difference in effect, between current and alternative. Positive indicates increased benefit relative to current treatment. HCV, hepatitis C virus; SVR, sustained virological response; HCC, hepatocellular carcinoma. Effect on life years in Tasmania over the period (undiscounted) Under the current treatment, it was estimated that 3,273 LYs (109 per year) would be lost over the 30-year period due to liver-related death in Tasmania (Table 21). Under the reduced treatment, about 376 additional LYs (13 per year) would be lost and 717 fewer QALYs (24 per year) would be gained under the reduced treatment relative to the current treatment. According to the increased treatment s 1, 2, and 3, the incremental LYs gained relative to the current treatment would be 242, 327, and 434, respectively (8-14 per year) over the next 30 years (Table 21). Compared with the current treatment, the respective incremental QALYs gained would be 753, 1,136, and 1,720, respectively (25-57 per year). Effect on costs incurred through HCV infection in Tasmania over the period (5% discount) Under the current, about $10m total costs on average would incur through hepatitis C each year over the next 30 years in Tasmania (Table 22). Of these costs, $2m, $5m, and $3m, were attributed to health sector costs, patient and family costs, and productivity costs, respectively. Drug costs accounted for about $982,600 (45%) of the total health sector costs on average each year. Compared with the current treatment, about $55,300 additional total costs would accrue on average each year under the reduced treatment over the next 30 years. 46
49 Under increased treatment s 1, 2, and 3, there would be total cost savings on average of about $75,100, $117,200, and $195,000 each year, respectively. Table 22. Costs associated with hepatitis C treatment strategies in Tasmania, HCV treatment s Description Incremental $, relative to the current Costs: (undiscounted) Current Reduction Drug costs* 55,037,118-10,263,066 9,603,635 14,266,202 20,825,521 Other costs 67,483,825 1,126, ,167-1,176,353-1,719,429 Total 122,520,943-9,137,050 8,759,467 13,089,849 19,106,092 Treated (% Total) 58% 51% 63% 66% 69% Patient/family costs 299,043,300 16,298,515-17,042,295-25,689,829-38,870,439 Treated 8% 6% 10% 11% 13% Productivity costs 262,779, ,568-1,967,655-3,431,814-6,268,203 Total costs 684,343,645 8,127,032-10,250,483-16,031,794-26,032,550 Costs: (3% discount) Drug costs* 36,936,221-6,784,715 6,643,361 9,924,748 14,661,137 Other costs 45,245, , , , ,844 Total 82,181,252-6,399,750 6,427,421 9,658,167 14,297,293 Patient/family costs 200,947,245 9,250,382-9,858,336-14,873,937-22,589,087 Productivity costs 116,888, , ,466-1,481,122-2,651,492 Total costs 400,017,099 3,322,891-4,297,381-6,696,892-10,943,286 Costs: (5% discount) Drug costs* 29,477,537-5,335,479 5,377,335 8,061,163 11,995,037 Other costs 36,086, , , ,051 Total 65,564,154-5,204,996 5,377,041 8,105,525 12,095,088 Patient/family costs 160,506,147 6,529,684-7,051,149-10,644,250-16,208,525 Productivity costs 78,990, , , ,476-1,726,383 Total costs 305,060,695 1,657,894-2,252,446-3,515,200-5,839,820 Incremental costs for each alternative treatment relative to current treatment. Positive value indicates increase in cost. *Pegylated interferon and ribavirin costs. Costs are expressed in 2008 Australian dollars. 47
50 Cost-effectiveness and cost-utility analysis Table 23 summarises cost-effectiveness and cost-utility results. ICERs of each strategy are reported relative to the next best strategy. Alternatively, the ICERs for increased treatment s 1, 2, and 3 relative to the current were $16,973, $16,931 and $16,579 per QALY respectively. Table 23. Cost-effectiveness and cost-utility analysis, Tasmania ( ; 5% discount) from a health sector perspective: incremental cost per life year gained; incremental cost per sustained virological response achieved; and incremental cost per QALY gained Treatment Cost ($) cost Effect (LY lost) Reduction 60,359,157 1,877 effect ICER* ($/LY) Current 65,564,154 5,204,996 1, $36, ,941,195 5,377,041 1, $56, ,669,679 8,105,525 1, $62, ,659,242 12,095,088 1, $70,686 Treatment Cost ($) cost Effect (SVR) Reduction 60,359,157 1,212 effect ICER* ($/SVR) Current 65,564,154 5,204,996 1, , ,941,195 5,377,041 1, , ,669,679 8,105,525 1, , ,659,242 12,095,088 2, ,196 Treatment Cost ($) cost Effect (QALY) Reduction 60,359, ,881 effect ICER* ($/QALY) Current 65,564,154 5,204, , , ,941,195 5,377, , , ,669,679 2,728, , , ,659,242 3,989, , ,908 Years of potential life lost due to HCV was estimated using the life expectancy of the average Australian, adjusted for premature mortality associated with hepatitis C. Incremental Quality-Adjusted Life Years (QALYs) gained. Incremental life years (LYs) gained. * ICER, incremental cost-effectiveness ratio of each strategy relative to the next best strategy; SVR, sustained virological response. Both costs and effects are discounted at 5%. See Appendix G for summaries of health and economic outcomes associated with hepatitis C treatment s in Tasmania over the period 2010 to 2013 and 2010 to
51 Epidemiological and economic evaluation of hepatitis C treatment s in Victoria The epidemiologic and economic trends under various HCV treatment s for Victoria would be similar to the national trends since Australian population-specific epidemiologic and behavioural data were used to inform inputs for the Victoria model simulations. Key findings Effect on new HCV cases in Victoria over the period Under the current treatment, where about 785 cases on average are treated each year, it was estimated that there would be approximately 2,673 new cases of hepatitis C in Victoria in 2010, which would remain relatively stable over the next 30 years (Figure 8). The model estimated about 52 new cases of liver failure, 28 new cases of HCC, ten cases receiving liver transplants, and 55 liver-related deaths in The annual number of these cases would increase each year under current conditions to an 11-13% increase by Under the reduced treatment, where treatment decreased from approximately 785 to 464 cases per year, the number of new cases of liver failure, HCC, liver transplants and liver-related deaths over the next 30 years could all be expected to increase, by 41-43%. It was estimated that there would be 294 additional HCV cases, 254 new cases of liver failure, 122 new cases of HCC, 40 cases receiving liver transplants, and 204 additional liver-related deaths relative to current treatment (Table 24). If treatment rates are increased over the next five years from approximately 785 cases to 1,320, 1,726, and 2,642 cases per year (increased treatment s 1, 2, and 3), it was estimated that there would be 597-1,905 fewer new HCV cases, fewer new cases of liver failure, fewer new cases of HCC, fewer cases receiving liver transplants, and fewer liver-related deaths over the 30-year period relative to the current treatment (Table 24). 49

52 Figure 8: Expected epidemiological outcomes associated with changes in HCV treatment rates in Victoria HCV incidence HCC incidence Incidence of liver failure Number of annual liver transplants Number of annual liver-related deaths Prevalence of HCV in IDUs 50
53 Table 24. Health impact of hepatitis C treatment strategies in Victoria, Description Life years lost / gained HCV treatment s incremental, relative to the current * Current Reduction ,955-4,025 2,575 3,503 4,637 Number of treatment gains -5,991 5,662 8,405 12,253 (Sustained virological response) HCV cases / cases averted 79, ,044 1,905 Liver failure cases / cases averted 1, HCC cases / cases averted HCV-related liver transplant cases / cases averted Liver-related deaths / deaths 1, averted Undiscounted health outcomes. *Incremental refers to the difference in effect, between current and alternative. Positive indicates increased benefit relative to current treatment. HCV, hepatitis C virus; SVR, sustained virological response; HCC, hepatocellular carcinoma. Effect on life years in Victoria over the period (undiscounted) Under the current treatment, it was estimated that 34,955 LYs (1,165 per year) would be lost over the 30-year period due to liver-related death in Victoria (Table 24). Under the reduced treatment, about 4,025 additional LYs (134 per year) would be lost and 7,679 fewer QALYs (256 per year) would be gained under the reduced treatment relative to the current treatment. According to the increased treatment s 1, 2, and 3, the incremental LYs gained relative to the current treatment would be 2,575, 3,503, and 4,637, respectively ( per year) over the next 30 years (Table 24). Compared with the current treatment, the respective incremental QALYs gained would be 8,030, 12,154, and 18,368, respectively ( per year). Effect on costs incurred through HCV infection in Victoria over the period (5% discount) Under the current, about $109m in total costs would be incurred on average due to hepatitis C each year over the next 30 years in Victoria (Table 25). Of these costs, $23.5m, $57m, and $28m, were attributed to health sector costs, patient and family costs, and productivity costs, respectively. Drug costs accounted for about $10.5m (45%) of the total health sector costs on average each year. Compared with the current treatment, about $596,100 additional total costs would accrue on average each year under the reduced treatment over the next 30 years. 51
54 Under increased treatment s 1, 2, and 3, there would be total cost savings on average of about $796,300, $1m, and $2m each year, respectively. Table 25. Costs associated with hepatitis C treatment strategies in Victoria, HCV treatment s Description Incremental $, relative to the current Costs: (undiscounted) Current Reduction Drug costs* 587,761, ,684, ,561, ,349, ,399,046 Other costs 720,683,383 12,106,343-8,963,754-12,658,156-18,368,470 Total 1,308,444,716-97,578,026 93,597, ,691, ,030,577 Treated (% Total) 58% 51% 63% 66% 69% Patient/family costs 3,193,593, ,475, ,744, ,852, ,144,598 Treated 8% 6% 10% 11% 13% Productivity costs 2,806,317,517 10,315,533-20,996,190-36,693,245-66,944,394 Total costs 7,308,355,655 87,212, ,143, ,854, ,058,415 Costs: (3% discount) Drug costs* 394,455,322-72,558,470 70,926, ,027, ,570,580 Other costs 483,187,208 4,156,457-2,273,839-2,906,004-3,889,315 Total 877,642,530-68,402,013 68,652, ,121, ,681,265 Patient/family costs 2,145,990,397 99,090, ,089, ,223, ,262,940 Productivity costs 1,248,296,075 5,051,380-9,241,157-15,845,020-28,318,245 Total costs 4,271,929,002 35,739,903-45,677,686-71,946, ,899,920 Costs: (5% discount) Drug costs* 314,801,341-57,089,367 57,396,864 86,144, ,099,848 Other costs 385,381,209 1,423,376 20, ,885 1,065,825 Total 700,182,551-55,665,991 57,417,406 86,575, ,165,673 Patient/family costs 1,714,105,239 69,982,457-75,140, ,994, ,119,015 Productivity costs 843,567,181 3,567,094-6,165,723-10,450,863-18,438,101 Total costs 3,257,854,970 17,883,559-23,888,843-37,870,500-62,391,443 Incremental costs for each alternative treatment relative to current treatment. Positive value indicates increase in cost. *Pegylated interferon and ribavirin costs. Costs are expressed in 2008 Australian dollars. 52
55 Cost-effectiveness and cost-utility analysis Table 26 summarises cost-effectiveness and cost-utility results. ICERs of each strategy are reported relative to the next best strategy. Alternatively, the ICERs for increased treatment s 1, 2, and 3 relative to the current were $17,007, $16,887 and $16,577 per QALY, respectively. Table 26. Cost-effectiveness and cost-utility analysis, Victoria ( ; 5% discount) from a health sector perspective: incremental cost per life year gained; incremental cost per sustained virological response achieved; and incremental cost per QALY gained Treatment Cost ($) cost Effect (LY lost) Reduction 644,516,559 20,052 effect ICER* ($/LY) Current 700,182,551 55,665,991 18,522 1,530 $36, ,599,956 57,417,406 17,507 1,015 $56, ,757,753 86,575,202 17,140 1,382 $62, ,348, ,165,673 16,694 1,828 $70,676 Treatment Cost ($) cost Effect (SVR) Reduction 644,516,559 12,935 effect ICER* ($/SVR) Current 700,182,551 55,665,991 16,072 3,137 17, ,599,956 57,417,406 19,257 3,184 18, ,757,753 86,575,202 20,849 4,777 18, ,348, ,165,673 23,171 7,099 18,195 Treatment Cost ($) cost Effect (QALY) Reduction 644,516,559 1,419,071 effect ICER* ($/QALY) Current 700,182,551 55,665,991 1,422,201 3,130 17, ,599,956 57,417,406 1,425,577 3,376 17, ,757,753 29,157,796 1,427,327 1,751 16, ,348,224 42,590,471 1,429,993 2,665 15,980 Years of potential life lost due to HCV was estimated using the life expectancy of the average Australian, adjusted for premature mortality associated with hepatitis C. Incremental Quality-Adjusted Life Years (QALYs) gained. Incremental life years (LYs) gained. * ICER, incremental cost-effectiveness ratio of each strategy relative to the next best strategy; SVR, sustained virological response. Both costs and effects are discounted at 5%. See Appendix H for summaries of health and economic outcomes associated with hepatitis C treatment s in Victoria over the period 2010 to 2013 and 2010 to

56 Epidemiological and economic evaluation of hepatitis C treatment s in Western Australia The epidemiologic and economic trends under various HCV treatment s for Western Australia would be similar to the national trends since Australian population-specific epidemiologic and behavioural data were used to inform inputs for the WA model simulations. Key findings Effect on new HCV cases in Western Australia over the period Under the current treatment, where about 391 cases on average are treated each year, it was estimated that there would be approximately 1,334 new cases of hepatitis C in Western Australia in 2010, which would remain relatively stable over the next 30 years (Figure 9). The model estimated about 26 new cases of liver failure, 14 new cases of HCC, five cases receiving liver transplants, and 27 liver-related deaths in The annual number of these cases would increase each year under current conditions to an increase of between 11-13% by Under the reduced treatment, where treatment decreased from approximately 391 to 232 cases per year, the number of new cases of liver failure, HCC, liver transplants and liver-related deaths over the next 30 years could all be expected to increase, by 41-43%. It was estimated that there would be 146 additional HCV cases, 126 new cases of liver failure, 61 new cases of HCC, 20 cases receiving liver transplants, and 101 additional liver-related deaths relative to current treatment (Table 27). If treatment rates are increased over the next five years from approximately 232 cases to 658, 861, and 1,318 cases per year (increased treatment s 1, 2, and 3), it was estimated that there would be fewer new HCV cases, fewer new cases of liver failure, fewer new cases of HCC, fewer cases receiving liver transplants, and fewer liver-related deaths over the 30-year period relative to the current treatment (Table 27). 54

57 Figure 9: Expected epidemiological outcomes associated with changes in HCV treatment rates in Western Australia HCV incidence HCC incidence Incidence of liver failure Number of annual liver transplants Number of annual liver-related deaths Prevalence of HCV in IDUs 55
58 Table 27. Health impact of hepatitis C treatment strategies in Western Australia, Description Current HCV treatment s incremental, relative to the current * Reduction Life years lost / gained 17,439-2,001 1,283 1,746 2,313 Number of treatment gains (Sustained virological response) -2,985 2,823 4,191 6,112 HCV cases / cases averted 39, Liver failure cases / cases averted HCC cases / cases averted HCV-related liver transplant cases / cases averted Liver-related deaths / deaths averted Undiscounted health outcomes. *Incremental refers to the difference in effect, between current and alternative. Positive indicates increased benefit relative to current treatment. HCV, hepatitis C virus; SVR, sustained virological response; HCC, hepatocellular carcinoma. Effect on life years in Western Australia over the period (undiscounted) Under the current treatment, it was estimated that 17,439 LYs (581 per year) would be lost over the 30-year period due to liver-related death in Western Australia (Table 27). Under the reduced treatment, about 2,001 additional LYs (67 per year) would be lost and 3,820 fewer QALYs (127 per year) would be gained under the reduced treatment relative to the current treatment. According to the increased treatment s 1, 2, and 3, the incremental LYs gained relative to the current treatment would be 1,283, 1,746, and 2,313, respectively (43-77 per year) over the next 30 years (Table 27). Compared with the current treatment, the respective incremental QALYs gained would be 4,001, 6,058, and 9,162, respectively ( per year). Effect on costs incurred through HCV infection in Western Australia over the period (5% discount) Under the current, about $54m in total costs would be incurred on average due to hepatitis C each year over the next 30 years in Western Australia (Table 28). Of these costs, $12m, $28.5m, and $14m, were attributed to health sector costs, patient and family costs, and productivity costs, respectively. Drug costs accounted for about $5m (45%) of the total health sector costs on average each year. Compared with the current treatment, about $294,000 additional total costs would accrue on average each year under the reduced treatment over the next 30 years. 56
59 Under increased treatment s 1, 2, and 3, there would be total cost savings on average of about $395,000, $627,000, and $1m each year, respectively. Table 28. Costs associated with hepatitis C treatment strategies in Western Australia, HCV treatment s Description Incremental $, relative to the current Costs: (undiscounted) Current Reduction Drug costs* 293,224,936-54,671,143 51,163,739 76,009, ,954,383 Other costs 359,538,116 5,991,964-4,449,787-6,289,282-9,158,916 Total 652,763,052-48,679,179 46,713,952 69,720, ,795,467 Treated (% Total) 58% 51% 63% 66% 69% Patient/family costs 1,593,232,965 86,797,149-90,551, ,987, ,083,759 Treated 8% 6% 10% 11% 13% Productivity costs 1,400,027,472 5,145,014-10,466,557-18,294,255-33,394,567 Total costs 3,646,023,489 43,262,983-54,303,614-85,561, ,682,859 Costs: (3% discount) Drug costs* 196,787,573-36,137,666 35,372,394 52,889,240 78,111,029 Other costs 241,055,013 2,046,930-1,121,013-1,433,636-1,937,345 Total 437,842,587-34,090,736 34,251,382 51,455,604 76,173,684 Patient/family costs 1,070,600,018 49,256,590-52,338,225-79,334, ,342,585 Productivity costs 622,755,253 2,515,637-4,604,899-7,897,692-14,125,949 Total costs 2,131,197,858 17,681,491-22,691,742-35,776,136-58,294,850 Costs: (5% discount) Drug costs* 157,049,444-28,415,867 28,618,720 42,964,829 63,906,237 Other costs 192,261, ,466 19, , ,880 Total 349,310,557-27,723,401 28,638,498 43,191,664 64,440,117 Patient/family costs 855,139,265 34,766,058-37,411,238-56,785,435-86,349,433 Productivity costs 420,842,436 1,774,564-3,071,483-5,207,931-9,197,300 Total costs 1,625,292,258 8,817,220-11,844,223-18,801,701-31,106,617 Incremental costs for each alternative treatment relative to current treatment. Positive value indicates increase in cost. *Pegylated interferon and ribavirin costs. Costs are expressed in 2008 Australian dollars. 57
60 Cost-effectiveness and cost-utility analysis Table 29 summarises cost-effectiveness and cost-utility results. ICERs of each strategy are reported relative to the next best strategy. Alternatively, the ICERs for increased treatment s 1, 2, and 3 relative to the current were $17,036, $16,912 and $16,580 per QALY, respectively. Table 29. Cost-effectiveness and cost-utility analysis, Western Australia ( ; 5% discount) from a health sector perspective: incremental cost per life year gained; incremental cost per sustained virological response achieved; and incremental cost per QALY gained Treatment Cost ($) cost Effect (LY lost) Reduction 321,587,156 10,000 effect ICER* ($/LY) Current 349,310,557 27,723,401 9, $36, ,949,055 28,638,498 8, $56, ,502,221 43,191,664 8, $62, ,750,674 64,440,117 8, $70,692 Treatment Cost ($) cost Effect (SVR) Reduction 321,587,156 6,458 effect ICER* ($/SVR) Current 349,310,557 27,723,401 8,018 1,560 17, ,949,055 28,638,498 9,605 1,586 18, ,502,221 43,191,664 10,399 2,381 18, ,750,674 64,440,117 11,559 3,541 18,197 Treatment Cost ($) cost Effect (QALY) Reduction 321,587, ,959 effect ICER* ($/QALY) Current 349,310,557 27,723, ,514 1,555 17, ,949,055 28,638, ,195 1,681 17, ,502,221 14,553, , , ,750,674 21,248, ,401 1,333 15,945 Years of potential life lost due to HCV was estimated using the life expectancy of the average Australian, adjusted for premature mortality associated with hepatitis C. Incremental Quality-Adjusted Life Years (QALYs) gained. Incremental life years (LYs) gained. * ICER, incremental cost-effectiveness ratio of each strategy relative to the next best strategy; SVR, sustained virological response. Both costs and effects are discounted at 5%. See Appendix I for summaries of health and economic outcomes associated with hepatitis C treatment s in Western Australia over the period 2010 to 2013 and 2010 to
61 Discussion The projected HCV incidence of approximately 11,700 in 2010 is generally consistent with a previous study carried out in Australia by the HCV Projections Working Group [5]. Under levels of current treatment at around 3,500 chronic HCV cases per year, it was estimated that there would be an increase of between 11-13% in the number of new cases of liver failure and HCC, liver transplant cases, and liver-related deaths attributable to HCV in The model suggests that if annual treatment rates are increased twofold, compared with current levels, there would be a modest decline in the number of new cases of liver failure (7%) and HCC (6%), people receiving a liver transplant (4%), and the number of liverrelated deaths (3%) over the next 30 years. However, if treatment rates are increased by three- to fourfold, these numbers would be expected to decrease by about 20%. The economic analyses suggest that increased treatment uptake of up to three- to fourfold is associated with substantial long-term total cost savings and gains in LYs and QALYs; however, this will also be associated with increased health sector costs due to increased drug costs. Most cost savings were found to be in patient and family time costs associated with hepatitis C care. A decline in treatment uptake has been reported in Europe [24] and in the United States [25] due to lack of diagnosis or physician referral [25]. Although this is unlikely under current conditions in Australia, factors such as patients and/or clinicians delaying treatment in anticipation of new treatments, such as specifically targeted antiviral therapy for HCV (STAT-C) becoming available, or government inaction on disease awareness or clinic funding, are potential threats to treatment uptake rates. This analysis showed that a decline in the treatment uptake from 3,500 to 2,000 chronic HCV cases per year is associated with a substantial increase in the long-term liver-related consequences (41-43%; see Figure 1) and total costs (55% relative to current levels of treatment; see Table 3). Previous HCV Projections Working Group s estimates in 2005, suggest that the number of cirrhosis cases, new cases of liver failure and HCC would double by 2025 if the number of people with chronic HCV receiving treatment for hepatitis C continues at about 2,000 per year [4]. Direct comparison of the current model with previous models is hampered by variation in the methodologies, natural history data, and treatment efficacy. Compared with the current treatment, increased treatment s are costeffective, with an ICER in the range of $16,500 to $17,000 per QALY. Although direct comparison is hampered by the variation in the comparator group, these estimates are within the range reported by other studies: $4,000 to $35,000 per QALY for interferon-based therapies for chronic HCV infection, which is regarded as good value for money when compared with other well accepted medical interventions [26-28]. A previous Australian study estimated the ICER at $5,625 per QALY for six months treatment with interferon or $8,250 per QALY gained for 12 months treatment [28]. In this analysis, QALY gains exceed life expectancy gains, suggesting that a substantial proportion of the clinical benefit associated with treating chronic hepatitis C results from averting progression to advanced liver disease stages, associated with a poorer quality of life 59
62 [29]. These findings are consistent with previous studies [27, 28], in which benefits of treatment were mainly due to improvements in health-related quality of life rather than survival. In the sensitivity analyses, treatment efficacy for HCV genotype 1 patients with no fibrosis to mild fibrosis stage (F0 to F2), costs of PEG-IFN and ribavirin, and utilities for F0 to F2 stage were the key drivers in the model. treatment s become more cost-effective as treatment efficacy for HCV genotype 1 patients with F0 to F2 stage increases, drug costs decrease, and utilities for F0 to F2 stage decrease. The model showed no cost savings if the health sector cost increases by 50% over the period. Sensitivity results revealed that the model was robust to all variables, including transition probabilities, treatment efficacy, health care costs and utilities. All simulations fall below a willingness-to-pay threshold of $50,000 per QALY. Treating hepatitis C is one strategy aiming to reduce the burden of disease. It is possible to cure hepatitis C in at least half of those treated; however, access to appropriate treatment services remains limited for many people with hepatitis C. There appears to be considerable scope for expanding the treatment of hepatitis C and delivering substantial health gains to individuals suffering from the effects of the virus in Australian settings. Despite the National Hepatitis C Strategy priority area for action to improve access to treatment and support and increase treatment uptake among people with hepatitis C, and NSW Hepatitis C Treatment and Care Strategy recommendations of broadening HCV treatment service delivery, there is currently limited capacity in most of Australia s hepatitis C treatment services to treat more people with hepatitis C. Pilot studies such as training of medical service providers in hepatitis C, GP initiation of treatment, integrating hepatitis C treatment services within opiate pharmacotherapy settings and prison settings, and assessment of costs and effectiveness of these programs are currently underway or under consideration to improve hepatitis C treatment uptake. This study provides evidence that increased treatment uptake by up to three- to fourfold is associated with substantial health benefits, long-term total cost savings, and gains in LYs and QALYs, and help guide implementation of programs to increase the capacity of treatment services. 60
63 Limitations There are several methodological issues that need to be considered in interpreting the results. First, in the epidemic transmission model, it was assumed that injecting behaviour such as frequency of injecting and sharing rates among the IDU population over time were constant. Treatment may have an impact on injecting behaviour. However, data are lacking to inform the model. treatment uptake may also increase awareness of hepatitis C and education among the population, which in turn may have an indirect effect on disease transmission. Second, only the current standard of care with combination PEG-IFN and ribavirin therapy and its direct impact on the burden of disease were considered in the analyses. New potential improved treatments, which should increase SVR rates among people receiving treatment and other preventive measures that could reduce new infections, were not considered in the analyses. Third, the analyses did not address opportunity costs, the value of the alternative use of resources, which is unknown. Fourth, a friction cost approach was used in the productivity analysis rather than the human capital approach because this approach is recommended by several reimbursement agencies and because it reduces the risk of increasing any uncertainty in the estimates of productivity gains excessively [30]. Taxation and welfare payments were not included in the estimation of productivity costs. Finally, in the economic analyses, health care resource use is considered proportional to increased treatment uptake. Strategies designed to increase treatment uptake, such as training and education of health care personnel was not considered, and thus, may lead to overestimation of total cost savings. 61
64 References 1. The Australian Government Department of Health and Ageing (2005) Economic Evaluation of Hepatitis C in Australia, Applied Economics, August 2005, Sydney. 2.. HIV/AIDS, viral hepatitis and sexually transmissible infections in Australia Annual Surveillance Report 2009., The University of New South Wales, Sydney, NSW. 3.. HIV/AIDS, viral hepatitis and sexually transmissible infections in Australia Annual Surveillance Report 2008., The University of New South Wales, Sydney, NSW. 4. Ministerial Advisory Committee on AIDS, Sexual Health and Hepatitis: Hepatitis C Sub-Committee (2006) Hepatitis C Virus Projections Working Group: Estimates and Projections of the Hepatitis C Virus Epidemic in Australia 2006, National Centre in HIV Epidemiology and Clinical Research (NCHECR), Sydney. 5. Razali K, Thein HH, Bell J, Cooper-Stanbury M, Dolan K, Dore G et al. Modelling the hepatitis C virus epidemic in Australia Drug Alcohol Depend 2007;91(2-3): Micallef JM, Kaldor JM, Dore GJ. Spontaneous viral clearance following acute hepatitis C infection: a systematic review of longitudinal studies J Viral Hepat 2006;13(1): Thomas DL, Astemborski J, Rai RM, Anania FA, Schaeffer M, Galai N, et al. The natural history of hepatitis C virus infection: host, viral, and environmental factors JAMA 2000;284(4): Seeff LB. Natural history of chronic hepatitis C Hepatology 2002;36(5 Suppl 1):S Hadziyannis SJ, Sette H, Jr., Morgan TR, Balan V, Diago M, Marcellin P, et al. Peginterferon-alpha2a and ribavirin combination therapy in chronic hepatitis C: a randomized study of treatment duration and ribavirin dose Ann Intern Med 2004;140(5): Sievert W. Management issues in chronic viral hepatitis: hepatitis C J Gastroenterol Hepatol 2002;17(4): Fried MW, Shiffman ML, Reddy KR, Smith C, Marinos G, Goncales FL, Jr., et al. Peginterferon alfa-2a plus ribavirin for chronic hepatitis C virus infection N Engl J Med 2002;347(13): Manns MP, McHutchison JG, Gordon SC, Rustgi VK, Shiffman M, Reindollar R, et al. Peginterferon alfa-2b plus ribavirin compared with interferon alfa-2b plus ribavirin for 62
65 initial treatment of chronic hepatitis C: a randomised trial. Lancet 2001;358(9286): Gidding HF, Topp L, Middleton M, Robinson K, Hellard M, McCaughan G, et al. The epidemiology of hepatitis C in Australia: notifications, treatment uptake and liver transplantations, J Gastroenterol Hepatol 2009;24(10): Backmund M, Meyer K, Edlin BR. Infrequent reinfection after successful treatment for hepatitis C virus infection in injection drug users. Clin Infect Dis 2004;39(10): Currie SL, Ryan JC, Tracy D, Wright TL, George S, McQuaid R, et al. A prospective study to examine persistent HCV reinfection in injection drug users who have previously cleared the virus Drug Alcohol Depend 2008;93(1-2): Dalgard O. Follow-up studies of treatment for hepatitis C virus infection among injection drug users. Clin Infect Dis 2005;40 Suppl 5:S Reichard O, Glaumann H, Fryden A, Norkrans G, Wejstal R, Weiland O. Long-term follow-up of chronic hepatitis C patients with sustained virological response to alphainterferon. J Hepatol 1999;30(5): Sobesky R, Mathurin P, Charlotte F, Moussalli J, Olivi M, Vidaud M, et al. Modeling the impact of interferon alfa treatment on liver fibrosis progression in chronic hepatitis C: a dynamic view. The Multivirc Group Gastroenterology 1999;116(2): McHutchison JG, Ware JE, Jr., Bayliss MS, Pianko S, Albrecht JK, Cort S, et al. The effects of interferon alpha-2b in combination with ribavirin on health related quality of life and work productivity. J Hepatol 2001;34(1): Ware JE, Jr., Bayliss MS, Mannocchia M, Davis GL. Health-related quality of life in chronic hepatitis C: impact of disease and treatment response. The Interventional Therapy Group. Hepatology 1999;30(2): John-Baptiste AA, Tomlinson G, Hsu PC, Krajden M, Heathcote EJ, Laporte A, et al. Sustained Responders Have Better Quality of Life and Productivity Compared With Treatment Failures Long After Antiviral Therapy for Hepatitis C. Am J Gastroenterol 2009;104(10): Heathcote EJ, Shiffman ML, Cooksley WG, Dusheiko GM, Lee SS, Balart L, et al. Peginterferon alfa-2a in patients with chronic hepatitis C and cirrhosis. N Engl J Med 2000;343(23): Marcellin P, Pequignot F, Delarocque-Astagneau E, Zarski JP, Ganne N, Hillon P, et al. Mortality related to chronic hepatitis B and chronic hepatitis C in France: evidence for the role of HIV coinfection and alcohol consumption. J Hepatol 2008;48(2): Lettmeier B, Muhlberger N, Schwarzer R, Sroczynski G, Wright D, Zeuzem S, et al. Market uptake of new antiviral drugs for the treatment of hepatitis C. J Hepatol 2008;49(4):
66 25. Volk ML, Tocco R, Saini S, Lok AS. Public health impact of antiviral therapy for hepatitis C in the United States. Hepatology 2009;50(6): Wong JB. Hepatitis C: cost of illness and considerations for the economic evaluation of antiviral therapies. Pharmacoeconomics 2006;24(7): Salomon JA, Weinstein MC, Hammitt JK, Goldie SJ. Cost-effectiveness of treatment for chronic hepatitis C infection in an evolving patient population. JAMA 2003;290(2): Shiell A, Brown S, Farrell GC. Hepatitis C: an economic evaluation of extended treatment with interferon. Med J Aust 1999;171(4): Tengs TO. Cost-effectiveness versus cost-utility analysis of interventions for cancer: does adjusting for health-related quality of life really matter? Value Health 2004;7(1): PBAC, Guidelines for preparing submissions to the Pharmaceutical Benefits Advisory Committee (Version 4.3). 2008, Australian Department of Health and Ageing: Canberra. 31. Gold MR, Siegel JE, Russell LB, Weinstein MC, eds. Cost-Effectiveness in Health and Medicine. New York: Oxford University Press; Life Tables, Australia, [11 May 2009]; Available from: nt. 33. Amin J, Law MG, Bartlett M, Kaldor JM, Dore GJ. Causes of death after diagnosis of hepatitis B or hepatitis C infection: a large community-based linkage study. Lancet 2006;368(9539): Iversen J TL, Maher L. Australian NSP Survey National Data Report :, University of New South Wales, Kwon JA, Iversen J, Maher L, Law MG, Wilson DP. The impact of needle and syringe programs on HIV and HCV transmissions in injecting drug users in Australia: a modelbased analysis. J Acquir Immune Defic Syndr 2009;51(4): Thein HH, Yi Q, Dore GJ, Krahn MD. Estimation of stage-specific fibrosis progression rates in chronic hepatitis C virus infection: A meta-analysis and meta-regression Hepatology 2008;48(2): Bruno R, Sacchi P, Puoti M, Maiocchi L, Patruno S, Carosi G, et al. Natural History of Compensated Viral Cirrhosis in a Cohort of Patients With Human Immunodeficiency Virus Infection. J Acquir Immune Defic Syndr 2007;46(3):
67 38. Bruno S, Silini E, Crosignani A, Borzio F, Leandro G, Bono F, et al. Hepatitis C virus genotypes and risk of hepatocellular carcinoma in cirrhosis: a prospective study. Hepatology 1997;25(3): Chiaramonte M, Stroffolini T, Vian A, Stazi MA, Floreani A, Lorenzoni U, et al. Rate of incidence of hepatocellular carcinoma in patients with compensated viral cirrhosis. Cancer 1999;85(10): Degos F, Christidis C, Ganne-Carrie N, Farmachidi JP, Degott C, Guettier C, et al. Hepatitis C virus related cirrhosis: time to occurrence of hepatocellular carcinoma and death. Gut 2000;47(1): del Olmo JA, Serra MA, Rodriguez F, Escudero A, Gilabert S, Rodrigo JM. Incidence and risk factors for hepatocellular carcinoma in 967 patients with cirrhosis. J Cancer Res Clin Oncol 1998;124(10): Fattovich G, Giustina G, Degos F, Tremolada F, Diodati G, Almasio P, et al. Morbidity and mortality in compensated cirrhosis type C: a retrospective follow-up study of 384 patients. Gastroenterology 1997;112(2): Fattovich G, Pantalena M, Zagni I, Realdi G, Schalm SW, Christensen E. Effect of hepatitis B and C virus infections on the natural history of compensated cirrhosis: a cohort study of 297 patients. Am J Gastroenterol 2002;97(11): Gentilini P, Laffi G, La Villa G, Romanelli RG, Buzzelli G, Casini-Raggi V, et al. Long course and prognostic factors of virus-induced cirrhosis of the liver. Am J Gastroenterol 1997;92(1): Hu KQ, Tong MJ. The long-term outcomes of patients with compensated hepatitis C virus-related cirrhosis and history of parenteral exposure in the United States. Hepatology 1999;29(4): Hutchinson SJ, Bird SM, Goldberg DJ. Modeling the current and future disease burden of hepatitis C among injection drug users in Scotland. Hepatology 2005;42(3): Ikeda K, Saitoh S, Koida I, Arase Y, Tsubota A, Chayama K, et al. A multivariate analysis of risk factors for hepatocellular carcinogenesis: a prospective observation of 795 patients with viral and alcoholic cirrhosis. Hepatology 1993;18(1): Imberti D, Fornari F, Sbolli G, Buscarini E, Squassante L, Buscarini L. Hepatocellular carcinoma in liver cirrhosis. A prospective study. Scand J Gastroenterol 1993;28(6): Niederau C, Lange S, Heintges T, Erhardt A, Buschkamp M, Hurter D, et al. Prognosis of chronic hepatitis C: results of a large, prospective cohort study. Hepatology 1998;28(6): Nishiguchi S, Kuroki T, Nakatani S, Morimoto H, Takeda T, Nakajima S, et al. Randomised trial of effects of interferon-alpha on incidence of hepatocellular carcinoma in chronic active hepatitis C with cirrhosis. Lancet 1995;346(8982):
68 51. Serfaty L, Aumaitre H, Chazouilleres O, Bonnand AM, Rosmorduc O, Poupon RE, et al. Determinants of outcome of compensated hepatitis C virus-related cirrhosis. Hepatology 1998;27(5): Tsai JF, Jeng JE, Ho MS, Chang WY, Hsieh MY, Lin ZY, et al. Effect of hepatitis C and B virus infection on risk of hepatocellular carcinoma: a prospective study. Br J Cancer 1997;76(7): Planas R, Balleste B, Alvarez MA, Rivera M, Montoliu S, Galeras JA, et al. Natural history of decompensated hepatitis C virus-related cirrhosis. A study of 200 patients. J Hepatol 2004;40(5): Thein HH, Yi Q, Heathcote EJ, Krahn MD. Prognosis of hepatitis C virus-infected Canadian post-transfusion compensation claimant cohort. J Viral Hepat 2009;16(11): Krahn M, Wong JB, Heathcote J, Scully L, Seeff L. Estimating the prognosis of hepatitis C patients infected by transfusion in Canada between 1986 and Med Decis Making 2004;24(1): Stoove MA, Dietze PM, Aitken CK, Jolley D. Mortality among injecting drug users in Melbourne: a 16-year follow-up of the Victorian Injecting Cohort Study (VICS). Drug Alcohol Depend 2008;96(3): Poynard T, McHutchison J, Manns M, Trepo C, Lindsay K, Goodman Z, et al. Impact of pegylated interferon alfa-2b and ribavirin on liver fibrosis in patients with chronic hepatitis C. Gastroenterology 2002;122(5): Lo Re V, 3rd, Amorosa VK, Localio AR, O'Flynn R, Teal V, Dorey-Stein Z, et al. Adherence to hepatitis C virus therapy and early virologic outcomes. Clin Infect Dis 2009;48(2): Weiss JJ, Brau N, Stivala A, Swan T, Fishbein D. Review article: adherence to medication for chronic hepatitis C - building on the model of human immunodeficiency virus antiretroviral adherence research. Aliment Pharmacol Ther 2009;30(1): Shiell A, Law MG. The cost of hepatitis C and the cost-effectiveness of its prevention. Health Policy 2001;58(2): Clinical profiles for public hospitals, AR-DRG v5.1, Australia, [cited May]; available from: A2571EA000B6C34/$File/Tbl8b_07.pdf. 62. Public Sector - Estimated Round 11 ( ) AR-DRG 5.1 Cost Report. [cited May]; available from: 66
69 63. Commonwealth Department of Health and Ageing. Medicare Benefits Schedule book. In: Ageing CDoHa, editor. Canberra, ACT: Commonwealth of Australia Commonwealth Department of Health and Ageing. Schedule of Pharmaceutical Benefits for approved pharmacists and medical practitioners. Editor Commonwealth of Australia; Canberra, ACT. 65. Commonwealth Department of Health and Ageing. National Hospital Cost Data Collection. Cost Report Round 11 (2006 7) AR-DRG v5.1. Editor Commonwealth Department of Health and Ageing; Canberra, ACT. 66. Koopmanschap MA, Rutten FF, van Ineveld BM, van Roijen L. The friction cost method for measuring indirect costs of disease. J Health Econ 1995;14(2): TreeAge Software I. Data Pro for Health Care User's Manual. Williamstown, MA: TreeAge Software, INC.; Lohse N, Hansen AB, Pedersen G, Kronborg G, Gerstoft J, Sorensen HT, et al. Survival of persons with and without HIV infection in Denmark, Ann Intern Med 2007;146(2): Day CA, White B, Thein HH, Doab A, Dore GJ, Bates A, et al. Experience of hepatitis C testing among injecting drug users in Sydney, Australia. AIDS Care 2008;20(1): White B, Day C, Thein HH, Doab A, Bates A, Holden J, et al. Acceptability of hepatitis C virus testing methods among injecting drug users. Drug Alcohol Rev 2008: Thein HH, Krahn M, Kaldor JM, Dore GJ. Estimation of utilities for chronic hepatitis C from SF-36 scores. Am J Gastroenterol 2005;100(3): Chong CA, Gulamhussein A, Heathcote EJ, Lilly L, Sherman M, Naglie G, et al. Health-state utilities and quality of life in hepatitis C patients. Am J Gastroenterol 2003;98(3): Hsu PC, Krajden M, Yoshida EM, Anderson FH, Tomlinson GA, Krahn MD. Does cirrhosis affect quality of life in hepatitis C virus-infected patients? Liver Int 2009;29(3): Drummond MF, Sculpher MJ, Torrance GW, O'Brien BJ, Stoddart GL. Methods for the Economic Evaluation of Health Care Programmes 3rd ed. New York: Oxford University Press; Torrance GW. Utility approach to measuring health-related quality of life. J Chronic Dis 1987;40(6): Torrance GW, Feeny D. Utilities and quality-adjusted life years. Int J Technol Assess Health Care 1989;5(4):
70 77. Iman RL, Helton JC, Campbell JE. An Approach To Sensitivity Analysis Of Computer- Models.1. Introduction, Input Variable Selection And Preliminary Variable Assessment. Journal Of Quality Technology 1981;13(3): Iman RL, Helton JC, Campbell JE. An approach to sensitivity analysis of computermodels.2. Ranking of input variables, response-surface validation, distribution effect and technique synopsis. Journal of Quality Technology 1981;13(4): Hoare A, Regan DG, Wilson DP. Sampling and sensitivity analyses tools (SaSAT) for computational modelling. Theor Biol Med Model 2008;5: Mathers BM, Degenhardt L, Phillips B, Wiessing L, Hickman M, Strathdee SA, et al. Global epidemiology of injecting drug use and HIV among people who inject drugs: a systematic review. Lancet 2008;372(9651): Return on investment 2: Evaluating the cost-effectiveness of needle and syringe programs among injecting drug users in Australia; Law MG, Lynskey M, Ross J, Hall W. Back-projection estimates of the number of dependent heroin users in Australia. Addiction 2001;96(3): Pollack HA. Cost-effectiveness of harm reduction in preventing hepatitis C among injection drug users. Med Decis Making 2001;21(5): Kaplan EH. Needles that kill: modeling human immunodeficiency virus transmission via shared drug injection equipment in shooting galleries. Rev Infect Dis 1989;11(2): Behrens DA, Caulkins JP, Tragler G, Haunschmied JL, Feichtinger G. A dynamic model of drug initiation: implications for treatment and drug control. Math Biosci 1999;159(1): Short LJ, Bell DM. Risk of occupational infection with blood-borne pathogens in operating and delivery room settings. Am J Infect Control 1993;21(6): Gerberding JL. Management of Occupational Exposures to Blood-Borne Viruses. New Eng J Med 1995;332(7): MacDonald M, Crofts N, Kaldor J. Transmission of hepatitis C virus: rates, routes, and cofactors. Epidemiol Rev 1996;18(2): Kiyosawa K, Sodeyama T, Tanaka E, Nakano Y, Furuta S, Nishioka K, et al. Hepatitis C in hospital employees with needlestick injuries Ann Intern Med 1991;115(5): Sodeyama T, Kiyosawa K, Urushihara A, Matsumoto A, Tanaka E, Furuta S, et al. Detection of hepatitis C virus markers and hepatitis C virus genomic-rna after needlestick accidents. Arch Intern Med 1993;153(13): Patz JA, Jodrey D. Occupational health in surgery: risks extend beyond the operating room. Aust N Z J Surg 1995;65(9):
71 92. Hamid SS, Farooqui B, Rizvi Q, Sultana T, Siddiqui AA. Risk of transmission and features of hepatitis C after needlestick injuries. Infect Control Hosp Epidemiol 1999;20(1): De Carli G, Puro V, Ippolito G. Risk of hepatitis C virus transmission following percutaneous exposure in healthcare workers. Infection 2003;31 Suppl 2: Law MG, Dore GJ, Bath N, Thompson S, Crofts N, Dolan K, et al. Modelling hepatitis C virus incidence, prevalence and long-term sequelae in Australia, Int J Epidemiol 2003;32(5): Sweeting MJ, De Angelis D, Brant LJ, Harris HE, Mann AG, Ramsay ME. The burden of hepatitis C in England. J Viral Hepat 2007;14(8): Annual Surveillance Report: HIV/AIDS, viral hepatitis and sexually transmissible infections in Australia Charlton M, Seaberg E, Wiesner R, Everhart J, Zetterman R, Lake J, et al. Predictors of patient and graft survival following liver transplantation for hepatitis C. Hepatology 1998;28(3): Gane EJ, Portmann BC, Naoumov NV, Smith HM, Underhill JA, Donaldson PT, et al. Long-term outcome of hepatitis C infection after liver transplantation. N Engl J Med 1996;334(13): Baker RI, Smith J, Eikelboom J, Leahy B, Kay I, Lavis N, et al. Hepatitis C genotypes in Australian haemophilia patients. Aust N Z J Med 1996;26(6): Chen J, McGuinness PH, Koorey DJ, Rickard K, Wylie B, McCaughan GW. Hepatitis C virus genotypes in a cohort of Australian blood donors and haemophiliac and liver transplant patients. J Gastroenterol Hepatol 1997;12(2): Kaba S, Dutta U, Byth K, Crewe EB, Khan MH, Coverdale SA, et al. Molecular epidemiology of hepatitis C in Australia. J Gastroenterol Hepatol 1998;13(9): McCaw R, Moaven L, Locarnini SA, Bowden DS. Hepatitis C virus genotypes in Australia, J Viral Hepat 1997;4(5): Mison LM, Young IF, O'Donoghue M, Cowley N, Thorlton N, Hyland CA. Prevalence of hepatitis C virus and genotype distribution in an Australian volunteer blood donor population. Transfusion 1997;37(1): Kamal SM. Acute hepatitis C: a systematic review. Am J Gastroenterol 2008;103(5): Kamal SM, Moustafa KN, Chen J, Fehr J, Abdel Moneim A, Khalifa KE, et al. Duration of peginterferon therapy in acute hepatitis C: a randomized trial. Hepatology 2006;43(5):
72 106. Kamal SM, Fouly AE, Kamel RR, Hockenjos B, Al Tawil A, Khalifa KE, et al. Peginterferon alfa-2b therapy in acute hepatitis C: impact of onset of therapy on sustained virologic response. Gastroenterology 2006;130(3): Broers B, Junet C, Bourquin M, Deglon JJ, Perrin L, Hirschel B. Prevalence and incidence rate of HIV, hepatitis B and C among drug users on methadone maintenance treatment in Geneva between 1988 and AIDS 1998;12(15): De Rosa FG, Bargiacchi O, Audagnotto S, Garazzino S, Cariti G, Calleri G, et al. Twelve-week treatment of acute hepatitis C virus with pegylated interferon- alpha -2b in injection drug users. Clin Infect Dis 2007;45(5): De Rosa FG, Bargiacchi O, Audagnotto S, Garazzino S, Cariti G, Raiteri R, et al. Dosedependent and genotype-independent sustained virological response of a 12 week pegylated interferon alpha-2b treatment for acute hepatitis C. J Antimicrob Chemother 2006;57(2): Freeman AJ, Zekry A, Whybin LR, Harvey CE, van Beek IA, de Kantzow SL, et al. Hepatitis C prevalence among Australian injecting drug users in the 1970s and profiles of virus genotypes in the 1970s and 1990s. Med J Aust 2000;172(12): Hawthorne G, Richardson J, Day NA. A comparison of the Assessment of Quality of Life (AQoL) with four other generic utility instruments. Ann Med 2001;33(5):
73 Appendix A: Additional results and tables for Australia Table A.1. Health impact of hepatitis C treatment strategies in Australia, HCV treatment s Description incremental, relative to the current * Current Reduction Average number of HCV cases 3,362 2,492 4,987 6,188 8,708 treated per year Health effects * Life years lost / gained 19, Number of treatment gains -2,287 3,145 4,961 8,014 (Sustained virological response) HCV cases / cases averted 46, Liver failure cases / cases averted HCC cases / cases averted HCV-related liver transplant cases / cases averted Liver-related deaths / deaths averted Undiscounted health outcomes. *Incremental refers to the difference in effect, between current and alternative. Positive indicates increased benefit relative to current treatment. HCV, hepatitis C virus; SVR, sustained virological response; HCC, hepatocellular carcinoma. 71
74 Table A.2. Costs associated with hepatitis C treatment strategies in Australia, HCV treatment s Description Incremental $, relative to the current Current Reduction Costs: (undiscounted) Drug costs* 336,076,246-34,585,530 48,798,192 77,047, ,538,732 Other costs 409,734,567-8,174,877 11,539,058 18,248,970 29,549,723 Total 745,810,813-42,760,406 60,337,250 95,296, ,088,455 Treated (% Total) 58% 55% 61% 63% 66% Patient/family costs 1,846,367,371-2,420,856 3,121,776 4,970,327 7,967,795 Treated 8% 7% 9% 10% 11% Productivity costs 1,647,407,100 3,478,903-4,994,327-7,916,016-12,942,022 Total costs 4,239,585,284-41,702,360 58,464,699 92,350, ,114,228 Costs: (3% discount) Drug costs* 321,629,746-32,018,668 45,239,007 71,434, ,484,686 Other costs 392,042,392-7,571,977 10,703,396 16,928,901 27,416,506 Total 713,672,139-39,590,645 55,942,403 88,363, ,901,192 Patient/family costs 1,767,118,927-2,278,620 2,952,901 4,701,663 7,542,662 Productivity costs 1,041,966,978 2,127,082-3,056,080-4,843,858-7,920,252 Total costs 3,522,758,044-39,742,183 55,839,224 88,221, ,523,602 Costs: (5% discount) Drug costs* 312,749,031-30,455,244 43,068,938 68,011, ,963,274 Other costs 381,166,334-7,204,626 10,193,667 16,123,643 26,115,059 Total 693,915,365-37,659,870 53,262,605 84,135, ,078,333 Patient/family costs 1,718,401,262-2,190,799 2,848,053 4,534,847 7,278,459 Productivity costs 856,285,434 1,709,154-2,456,916-3,894,169-6,367,908 Total costs 3,268,602,060-38,141,515 53,653,742 84,776, ,988,884 Incremental costs for each alternative treatment relative to current treatment. Positive value indicates increase in cost. *Pegylated interferon and ribavirin costs. Costs are expressed in 2008 Australian dollars. Table A.3. Health impact of hepatitis C treatment strategies in Australia, Description Average number of HCV cases treated per year Health effects * HCV treatment s incremental, relative to the current Current Reduction ,466 1,996 5,887 7,757 11,848 Life years lost / gained 370,430-92,124 52,034 71,064 94,115 Number of treatment gains -57,894 49,660 72, ,454 (Sustained virological response) HCV cases / cases averted 817,514-2,028 7,371 13,689 25,923 Liver failure cases / cases averted 17,524-4,808 2,702 3,691 4,885 HCC cases / cases averted 9,379-2,486 1,400 1,912 2,531 HCV-related liver transplant 3, cases / cases averted Liver-related deaths / deaths averted 18,765-4,667 2,636 3,600 4,768 72
75 Table A.4. Costs associated with hepatitis C treatment strategies in Australia, HCV treatment s Description Incremental $, relative to the current Current Reduction Total number of 242, , , , ,338 HCV cases treated Costs: (undiscounted) Drug costs* 6,056,130,457-1,039,209, ,049,341 1,281,249,916 1,781,754,566 Other costs 7,474,392, ,897, ,134, ,281, ,132,911 Total 13,530,522, ,311, ,915, ,968,161 1,017,621,655 Treated (% Total) 58% 50% 64% 66% 69% Patient/family costs 32,838,967,772 2,946,138,029-2,795,857,131-4,200,595,635-6,185,210,037 Treated 8% 6% 10% 11% 13% Productivity costs 28,730,196,033 71,269, ,056, ,093, ,019,396 Total costs - 2,542,998,379-3,932,720,623-6,078,607,778 75,099,686,322 2,501,095,652 Costs: (3% discount) Drug costs* 2,583,676, ,916, ,336, ,267, ,789,160 Other costs 3,177,256, ,068,524-87,364, ,055, ,710,462 Total 5,760,933, ,847, ,971, ,212, ,078,697 Patient/family costs 14,033,377, ,967, ,102,239-1,421,448,246-2,114,631,919 Productivity costs 8,138,092,188 25,703,401-66,666, ,765, ,554,077 Total costs - 27,932,402, ,823, ,797,266 1,048,001,332-1,626,107,299 Costs: (5% discount) Drug costs* 1,743,911, ,099, ,777, ,784, ,998,671 Other costs 2,140,282,607 51,482,249-31,919,680-44,601,944-62,415,229 Total 3,884,194, ,617, ,858, ,182, ,583,443 Patient/family 9,484,136, ,914, ,244, ,256,229-1,204,656,538 costs Productivity costs 4,657,419,584 16,770,332-36,215,051-63,533, ,234,990 Total costs 18,025,750, ,067, ,601, ,607, ,308,085 73
76 Table A.5. Cost-effectiveness and cost-utility analysis, Australia ( : 5% discount) from a health sector perspective: incremental cost per LY gained, incremental cost per SVR achieved, and incremental cost per QALY gained Treatment Cost ($) cost Effect (LY lost) effect ICER* ($/LY) Reduction 3,626,576, ,838 Current 3,884,194, ,617, ,862 13,976 $18, ,150,052, ,858,149 95,396 8,466 $31, ,283,376, ,182,202 92,309 11,553 $34, ,470,777, ,583,443 88,554 15,308 $38,320 Treatment Cost ($) cost Effect (SVR) Reduction 3,626,576,853 71,922 effect ICER* ($/SVR) Current 3,884,194, ,617,376 88,992 17,069 15, ,150,052, ,858, ,597 16,605 16, ,283,376, ,182, ,731 24,740 16, ,470,777, ,583, ,151 36,160 16,222 Treatment Cost ($) cost Effect (QALY) Reduction 3,626,576,853 7,830,274 effect ICER* ($/QALY) Current 3,884,194, ,617,376 7,853,252 22,978 11, ,150,052, ,858,149 7,876,690 23,439 11, ,283,376, ,182,202 7,888,719 35,467 11, ,470,777, ,583,443 7,906,450 53,198 11,026 Table A.6. Sensitivity analysis: increase in health sector cost, including drug cost versus total cost savings, Health sector cost Current HCV treatment s Reduction Base case 14,298,244,303 78,118, ,387, ,103, ,832,780 10% increase 14,605,544,136 53,703,429-79,194, ,107, ,143,037 20% increase 14,912,843,969 29,288,809-54,001,662-90,111, ,453,294 30% increase 15,220,143,803 4,874,190-28,808,849-52,115, ,763,551 40% increase 15,527,443,636-19,540,430-3,616,036-14,120,104-47,073,808 50% increase 15,834,743,470-43,955,050 21,576,777 23,875,759 9,615,935 74
77 Appendix B: Additional results and tables for ACT Table B.1. Health impact of hepatitis C treatment strategies in ACT, Description Average number of HCV cases treated per year Health effects * HCV treatment s incremental, relative to the current Current Reduction Life years lost / gained Number of treatment gains (Sustained virological response) HCV cases / cases averted Liver failure cases / cases averted HCC cases / cases averted HCV-related liver transplant cases / cases averted Liver-related deaths / deaths averted Table B.2. Costs associated with hepatitis C treatment strategies in ACT, HCV treatment s Description Incremental $, relative to the current Current Reduction Costs: (undiscounted) Drug costs* 4,557, , ,852 1,042,812 1,690,543 Other costs 5,555, , , , ,034 Total 10,113, , ,243 1,289,878 2,091,577 Patient/family costs 25,036,283-32,869 46,372 67, ,604 Productivity costs 22,338,381 47,216-63, , ,783 Total costs 57,487, , ,426 1,250,885 2,023,397 Costs: (3% discount) Drug costs* 4,361, , , ,814 1,567,670 Other costs 5,315, , , , ,090 Total 9,677, , ,362 1,196,001 1,939,760 Patient/family costs 23,961,695-30,936 43,681 64, ,880 Productivity costs 14,128,788 28,866-38,631-65, ,583 Total costs 47,767, , ,412 1,194,780 1,934,058 Costs: (5% discount) Drug costs* 4,240, , , ,475 1,492,737 Other costs 5,168,521-97, , , ,432 Total 9,409, , ,086 1,138,756 1,847,169 Patient/family costs 23,301,096-29,742 42,018 61,854 98,323 Productivity costs 11,611,001 23,192-31,039-52,545-86,500 Total costs 44,321, , ,065 1,148,064 1,858,992 75
78 Table B.3. Health impact of hepatitis C treatment strategies in ACT, Description Average number of HCV cases treated per year Health effects * HCV treatment s incremental, relative to the current Current Reduction Life years lost / gained 5,023-1, ,276 Number of treatment gains ,362 (Sustained virological response) HCV cases / cases averted 11, Liver failure cases / cases averted HCC cases / cases averted HCV-related liver transplant cases / cases averted Liver-related deaths / deaths averted Table B.4. Costs associated with hepatitis C treatment strategies in ACT, HCV treatment s Description Incremental $, relative to the current Current Reduction Total number of HCV 3,290 1,895 5,586 7,362 11,246 cases treated Costs: (undiscounted) Drug costs* 82,119,621-14,091,283 11,931,272 17,373,654 24,159,732 Other costs 101,350,962 7,089,977-4,980,201-7,216,628-10,362,514 Total 183,470,583-7,001,306 6,951,071 10,157,026 13,797,218 Treated (% Total) 58% 50% 64% 66% 69% Patient/family costs 445,288,100 39,947,943-37,856,035-56,954,194-83,874,116 Treated 8% 6% 10% 11% 13% Productivity costs 389,574, ,564-3,507,703-6,522,776-12,353,574 Total costs 1,018,332,859 33,913,201-34,412,666-53,319,944-82,430,472 Costs: (3% discount) Drug costs* 35,034,013-6,181,889 5,665,827 8,383,326 12,051,782 Other costs 43,082,847 1,736,381-1,178,568-1,695,178-2,423,888 Total 78,116,860-4,445,508 4,487,259 6,688,148 9,627,894 Patient/family costs 190,289,028 13,002,679-12,749,429-19,271,058-28,676,950 Productivity costs 110,350, , ,390-1,623,722-3,004,517 Total costs 378,756,440 8,905,677-9,163,560-14,206,631-22,053,572 Costs: (5% discount) Drug costs* 23,647,007-4,191,058 4,029,234 6,017,183 8,800,473 Other costs 29,021, , , , ,786 Total 52,668,733-3,493,104 3,600,445 5,412,772 7,953,687 Patient/family costs 128,602,476 7,144,264-7,185,042-10,902,667-16,337,418 Productivity costs 63,153, , , ,300-1,562,803 Total costs 244,424,713 3,878,522-4,073,587-6,351,195-9,946,534 76
79 Table B.5. Cost-effectiveness and cost-utility analysis, ACT ( : 5% discount) from a health sector perspective: incremental cost per LY gained, incremental cost per SVR achieved, and incremental cost per QALY gained Treatment Cost ($) cost Effect (LY lost) effect ICER* ($/LY) Reduction 49,175,629 1,598 Current 52,668,733 3,493,104 1, $18, ,269,178 3,600,445 1, $31, ,081,504 5,412,772 1, $34, ,622,419 7,953,687 1, $38,313 Treatment Cost ($) cost Effect (SVR) Reduction 49,175, effect ICER* ($/SVR) Current 52,668,733 3,493,104 1, , ,269,178 3,600,445 1, , ,081,504 5,412,772 1, , ,622,419 7,953,687 1, ,219 Treatment Cost ($) cost Effect (QALY) Reduction 49,175, ,177 effect ICER* ($/QALY) Current 52,668,733 3,493, , , ,269,178 3,600, , , ,081,504 5,412, , , ,622,419 7,953, , ,024 77
80 Appendix C: Additional results and tables for NSW Table C.1. Health impact of hepatitis C treatment strategies in NSW, Description 78 Current HCV treatment s incremental, relative to the current Reduction Average number of HCV cases treated per year 1, ,513 1,874 2,641 Health effects * Life years lost / gained 5, Number of treatment gains (Sustained virological response) ,500 2,432 HCV cases / cases averted 14, Liver failure cases / cases averted HCC cases / cases averted HCV-related liver transplant cases / cases averted Liver-related deaths / deaths averted Table C.2. Costs associated with hepatitis C treatment strategies in NSW, HCV treatment s Description Incremental $, relative to the current Current Reduction Costs: (undiscounted) Drug costs* 101,887,576-10,399,686 14,839,687 23,300,872 37,781,534 Other costs 124,218,173-2,460,295 3,508,476 5,521,094 8,963,390 Total 226,105,749-12,859,982 18,348,162 28,821,966 46,744,924 Patient/family costs 559,760, , ,649 1,518,537 2,409,362 Productivity costs 499,443,218 1,042,979-1,518,373-2,387,572-3,928,648 Total costs 1,285,309,008-12,559,532 17,774,439 27,952,931 45,225,637 Costs: (3% discount) Drug costs* 97,507,860-9,626,647 13,757,966 21,602,539 35,035,224 Other costs 118,854,472-2,278,551 3,254,551 5,121,494 8,316,425 Total 216,362,332-11,905,198 17,012,517 26,724,033 43,351,650 Patient/family costs 535,734, , ,734 1,435,966 2,281,059 Productivity costs 315,892, , ,152-1,460,881-2,404,321 Total costs 1,067,989,242-11,966,084 16,977,099 26,699,118 43,228,387 Costs: (5% discount) Drug costs* 94,815,512-9,155,848 13,098,408 20,567,007 33,360,432 Other costs 115,557,199-2,167,824 3,099,659 4,877,741 7,921,717 Total 210,372,711-11,323,671 16,198,067 25,444,748 41,282,149 Patient/family costs 520,964, , ,115 1,384,717 2,201,313 Productivity costs 259,599, , ,009-1,174,412-1,933,119 Total costs 990,937,076-11,482,704 16,313,173 25,655,052 41,550,343
81 Table C.3. Health impact of hepatitis C treatment strategies in NSW, Description Average number of HCV cases treated per year Health effects * HCV treatment s incremental, relative to the current Current Reduction , ,785 2,352 3,592 Life years lost / gained 112,303-27,923 15,776 21,542 28,534 Number of treatment gains -17,549 15,056 21,909 30,455 (Sustained virological response) HCV cases / cases averted 247, ,235 4,150 7,859 Liver failure cases / cases averted 5,313-1, ,119 1,481 HCC cases / cases averted 2, HCV-related liver transplant 1, cases / cases averted Liver-related deaths / deaths averted 5,689-1, ,091 1,445 Table C.4. Costs associated with hepatitis C treatment strategies in NSW, HCV treatment s Description Incremental $, relative to the current Current Reduction Total number of HCV cases treated 73,560 42, , , ,432 Costs: (undiscounted) Drug costs* 1,836,024, ,025, ,824, ,437, ,161,424 Other costs 2,265,997, ,479, ,616, ,342, ,676,813 Total 4,102,021, ,546, ,208, ,094, ,484,611 Treated (% Total) 58% 50% 64% 66% 69% Patient/family costs 9,955,719, ,990, ,673,189-1,273,347,550-1,875,215,335 Treated 8% 6% 10% 11% 13% Productivity costs 8,710,073,107 21,601,342-78,538, ,832, ,195,545 Total costs 22,767,815, ,045, ,003,446-1,192,085,347-1,842,926,269 Costs: (3% discount) Drug costs* 783,287, ,178, ,852, ,429, ,449,703 Other costs 963,242,829 38,803,652-26,489,387-37,897,224-54,188,736 Total 1,746,530,821-99,375, ,362, ,532, ,260,967 Patient/family costs 4,254,469, ,601, ,960, ,839, ,131,607 Productivity costs 2,467,210,515 7,788,379-20,214,164-36,301,282-67,172,140 Total costs 8,468,210, ,014, ,811, ,608, ,042,780 Costs: (5% discount) Drug costs* 528,698,123-93,664,775 90,303, ,526, ,755,849 Other costs 648,865,280 15,593,517-9,677,885-13,511,047-18,929,272 Total 1,177,563,403-78,071,258 80,626, ,015, ,826,577 Patient/family costs 2,875,285, ,640, ,393, ,743, ,249,530 Productivity costs 1,411,982,103 5,080,269-10,981,822-19,255,425-34,938,931 Total costs 5,464,831,451 86,649,325-91,749, ,983, ,361,884 79
82 Table C.5. Cost-effectiveness and cost-utility analysis, NSW ( : 5% discount) from a health sector perspective: incremental cost per LY gained, incremental cost per SVR achieved, and incremental cost per QALY gained Treatment Cost ($) cost Effect (LY lost) effect ICER* ($/LY) Reduction 1,099,492,145 35,722 Current 1,177,563,403 78,071,258 31,487 4,235 $18, ,258,189,432 80,626,029 28,920 2,567 $31, ,298,578, ,015,568 27,986 3,501 $34, ,355,389, ,826,577 26,846 4,641 $38,315 Treatment Cost ($) cost Effect (SVR) Reduction 1,099,492,145 21,808 effect ICER* ($/SVR) Current 1,177,563,403 78,071,258 26,979 5,172 15, ,258,189,432 80,626,029 32,015 5,035 16, ,298,578, ,015,568 34,477 7,498 16, ,355,389, ,826,577 37,943 10,963 16,220 Treatment Cost ($) cost Effect (QALY) Reduction 1,099,492,145 2,373,893 effect ICER* ($/QALY) Current 1,177,563,403 78,071,258 2,380,854 6,961 11, ,258,189,432 80,626,029 2,387,962 7,107 11, ,298,578, ,015,568 2,391,603 10,749 11, ,355,389, ,826,577 2,396,984 16,130 11,025 80
83 Appendix D: Additional results and tables for NT Table D.1. Health impact of hepatitis C treatment strategies in NT, Description Current HCV treatment s incremental, relative to the current Reduction Average number of HCV cases treated per year Health effects * Life years lost / gained Number of treatment gains (Sustained virological response) HCV cases / cases averted Liver failure cases / cases averted HCC cases / cases averted HCV-related liver transplant cases / cases averted Liver-related deaths / deaths averted Table D.2. Costs associated with hepatitis C treatment strategies in NT, HCV treatment s Description Incremental $, relative to the current Current Reduction Costs: (undiscounted) Drug costs* 3,468, , , ,295 1,281,828 Other costs 4,228,605-82, , , ,300 Total 7,697, , , ,080 1,586,128 Patient/family costs 19,055,222-25,680 32,347 50,994 83,088 Productivity costs 17,001,883 34,952-51,391-82, ,748 Total costs 43,754, , , ,054 1,536,468 Costs: (3% discount) Drug costs* 3,319, , , ,244 1,188,581 Other costs 4,046,015-76, , , ,318 Total 7,365, , , ,381 1,470,899 Patient/family costs 18,237,348-24,137 30,592 48,252 78,620 Productivity costs 10,753,506 21,363-31,445-50,191-81,231 Total costs 36,356, , , ,442 1,468,288 Costs: (5% discount) Drug costs* 3,227, , , ,847 1,131,719 Other costs 3,933,770-73, , , ,907 Total 7,161, , , ,658 1,400,626 Patient/family costs 17,734,563-23,186 29,503 46,549 75,845 Productivity costs 8,837,200 17,161-25,279-40,351-65,306 Total costs 33,733, , , ,855 1,411,165 81
84 Table D.3. Health impact of hepatitis C treatment strategies in NT, Description Average number of HCV cases treated per year Health effects * HCV treatment s incremental, relative to the current Current Reduction Life years lost / gained 3, Number of treatment gains ,037 (Sustained virological response) HCV cases / cases averted 8, Liver failure cases / cases averted HCC cases / cases averted HCV-related liver transplant cases / cases averted Liver-related deaths / deaths averted Table D.4. Costs associated with hepatitis C treatment strategies in NT, HCV treatment s Description Incremental $, relative to the current Current Reduction Total number of HCV 2,504 1,442 4,253 5,604 8,559 cases treated Costs: (undiscounted) Drug costs* 62,501,519-10,722,736 9,082,693 13,223,192 18,389,176 Other costs 77,138,529 5,392,788-3,798,906-5,494,212-7,884,273 Total 139,640,048-5,329,948 5,283,786 7,728,980 10,504,903 Treated (% Total) 58% 50% 64% 66% 69% Patient/family costs 338,910,315 30,390,059-28,852,647-43,355,793-63,825,301 Treated 8% 6% 10% 11% 13% Productivity costs 296,506, ,313-2,673,269-4,965,354-9,400,755 Total costs 775,056,580 25,795,424-26,242,130-40,592,166-62,721,153 Costs: (3% discount) Drug costs* 26,664,506-4,702,042 4,317,467 6,381,358 9,172,563 Other costs 32,790,476 1,319, ,409-1,291,056-1,843,276 Total 59,454,982-3,382,097 3,416,059 5,090,302 7,329,287 Patient/family costs 144,829,668 9,886,611-9,732,037-14,672,798-21,817,771 Productivity costs 83,988, , ,947-1,236,248-2,285,933 Total costs 288,272,817 6,769,498-7,003,925-10,818,743-16,774,416 Costs: (5% discount) Drug costs* 17,997,817-3,186,531 3,073,182 4,580,769 6,697,471 Other costs 22,088, , , , ,366 Total 40,086,329-2,656,316 2,743,927 4,120,180 6,054,105 Patient/family costs 97,879,823 5,429,622-5,492,028-8,302,652-12,427,465 Productivity costs 48,066, , , ,871-1,188,824 Total costs 186,032,487 2,946,095-3,121,796-4,838,343-7,562,184 82
85 Table D.5. Cost-effectiveness and cost-utility analysis, NT ( : 5% discount) from a health sector perspective: incremental cost per LY gained, incremental cost per SVR achieved, and incremental cost per QALY gained Treatment Cost ($) cost Effect (LY lost) effect ICER* ($/LY) Reduction 37,430,013 1,216 Current 40,086,329 2,656,316 1, $18, ,830,257 2,743, $31, ,206,510 4,120, $34, ,140,435 6,054, $38,337 Treatment Cost ($) cost Effect (SVR) Reduction 37,430, effect ICER* ($/SVR) Current 40,086,329 2,656, , ,830,257 2,743,927 1, , ,206,510 4,120,180 1, , ,140,435 6,054,105 1, ,229 Treatment Cost ($) cost Effect (QALY) Reduction 37,430,013 80,812 effect ICER* ($/QALY) Current 40,086,329 2,656,316 81, , ,830,257 2,743,927 81, , ,206,510 4,120,180 81, , ,140,435 6,054,105 81, ,031 83
86 Appendix E: Additional results and tables for QLD Table E.1. Health impact of hepatitis C treatment strategies in QLD, Description Current HCV treatment s incremental, relative to the current Reduction Average number of HCV cases treated per year ,129 1,397 1,971 Health effects * Life years lost / gained 4, Number of treatment gains (Sustained virological response) ,119 1,816 HCV cases / cases averted 10, Liver failure cases / cases averted HCC cases / cases averted HCV-related liver transplant cases / cases averted Liver-related deaths / deaths averted Table E.2. Costs associated with hepatitis C treatment strategies in QLD, HCV treatment s Description Incremental $, relative to the current 84 Current Reduction Costs: (undiscounted) Drug costs* 75,967,593-7,885,763 11,079,522 17,379,935 28,207,937 Other costs 92,617,360-1,862,296 2,618,298 4,117,968 6,690,501 Total 168,584,954-9,748,059 13,697,820 21,497,904 34,898,438 Patient/family costs 417,358, , ,957 1,130,612 1,786,589 Productivity costs 372,384, ,269-1,137,596-1,781,740-2,938,150 Total costs 958,327,718-9,492,855 13,257,181 20,846,775 33,746,877 Costs: (3% discount) Drug costs* 72,702,067-7,301,460 10,272,144 16,113,271 26,158,156 Other costs 88,618,179-1,725,189 2,428,861 3,819,949 6,207,748 Total 161,320,246-9,026,649 12,701,005 19,933,220 32,365,904 Patient/family costs 399,444, , ,627 1,069,196 1,691,839 Productivity costs 235,529, , ,168-1,090,173-1,798,191 Total costs 796,294,068-9,049,308 12,664,464 19,912,243 32,259,553 Costs: (5% discount) Drug costs* 70,694,646-6,945,539 9,779,851 15,340,939 24,908,107 Other costs 86,159,729-1,641,639 2,313,303 3,638,159 5,913,218 Total 156,854,375-8,587,178 12,093,154 18,979,097 30,821,326 Patient/family costs 388,432, , ,436 1,031,075 1,632,933 Productivity costs 193,557, , , ,388-1,445,806 Total costs 738,843,933-8,686,030 12,169,877 19,133,784 31,008,452
87 Table E.3. Health impact of hepatitis C treatment strategies in QLD, Description Average number of HCV cases treated per year Health effects * HCV treatment s incremental, relative to the current Current Reduction ,331 1,753 2,678 Life years lost / gained 83,733-20,829 11,764 16,062 21,276 Number of treatment gains -13,088 11,226 16,336 22,708 (Sustained virological response) HCV cases / cases averted 184, ,667 3,094 5,860 Liver failure cases / cases averted 3,961-1, ,104 HCC cases / cases averted 2, HCV-related liver transplant cases / cases averted Liver-related deaths / deaths averted 4,242-1, ,078 Table E.4. Costs associated with hepatitis C treatment strategies in QLD, HCV treatment s Description Incremental $, relative to the current Current Reduction Total number of HCV 54,847 31,580 93, , ,473 cases treated Costs: (undiscounted) Drug costs* 1,368,944, ,930, ,935, ,621, ,734,841 Other costs 1,689,532, ,232,130-83,237, ,299, ,759,467 Total 3,058,476, ,698, ,698, ,321, ,975,374 Treated (% Total) 58% 50% 64% 66% 69% Patient/family costs 7,423,008, ,107, ,093, ,428,205-1,398,258,542 Treated 8% 6% 10% 11% 13% Productivity costs 6,494,250,355 16,115,616-58,566, ,737, ,947,137 Total costs 16,975,734, ,524, ,961, ,844,343-1,374,230,305 Costs: (3% discount) Drug costs* 584,021, ,090,289 94,577, ,750, ,901,562 Other costs 718,195,684 28,965,378-19,760,027-28,257,471-40,415,339 Total 1,302,216,942-74,124,911 74,817, ,492, ,486,222 Patient/family costs 3,172,142, ,870, ,259, ,247, ,096,732 Productivity costs 1,839,556,566 5,812,955-15,074,791-27,067,282-50,090,171 Total costs 6,313,915, ,558, ,516, ,821, ,700,681 Costs: (5% discount) Drug costs* 394,198,489-69,906,324 67,329, ,306, ,705,025 Other costs 483,795,172 11,647,163-7,222,985-10,074,614-14,122,487 Total 877,993,661-58,259,161 60,106,858 90,231, ,582,538 Patient/family costs 2,143,819, ,187, ,374, ,746, ,387,501 Productivity costs 1,052,775,943 3,793,508-8,190,388-14,357,485-26,055,356 Total costs 4,074,589,596 64,722,107-68,458, ,871, ,860,320 85
88 Table E.5. Cost-effectiveness and cost-utility analysis, QLD ( : 5% discount) from a health sector perspective: incremental cost per LY gained, incremental cost per SVR achieved, and incremental cost per QALY gained Treatment Cost ($) cost Effect (LY lost) effect ICER* ($/LY) Reduction 819,734,499 26,638 Current 877,993,661 58,259,161 23,477 3,161 $18, ,100,518 60,106,858 21,562 1,915 $31, ,225,154 90,231,493 20,866 2,611 $34, ,010,576, ,582,538 20,016 3,461 $38,306 Treatment Cost ($) cost Effect (SVR) effect ICER* ($/SVR) Reduction 819,734,499 16,255 Current 877,993,661 58,259,161 20,116 3,861 15, ,100,518 60,106,858 23,871 3,755 16, ,225,154 90,231,493 25,707 5,591 16, ,010,576, ,582,538 28,292 8,176 16,216 Treatment Cost ($) cost Effect (QALY) effect ICER* ($/QALY) Reduction 819,734,499 1,769,973 Current 877,993,661 58,259,161 1,775,170 5,197 11, ,100,518 60,106,858 1,780,471 5,301 11, ,225,154 90,231,493 1,783,185 8,015 11, ,010,576, ,582,538 1,787,199 12,029 11,022 86
89 Appendix F: Additional results and tables for SA Table F.1. Health impact of hepatitis C treatment strategies in South Australia, Description Current HCV treatment s incremental, relative to the current Reduction Average number of HCV cases treated per year Health Effects * Life years lost / gained 1, Number of treatment gains (Sustained virological response) HCV cases / cases averted 3, Liver failure cases / cases averted HCC cases / cases averted HCV-related liver transplant cases / cases averted Liver-related deaths / deaths averted Table F.2. Costs associated with hepatitis C treatment strategies in South Australia, HCV treatment s Description Incremental $, relative to the current Current Reduction Costs: (undiscounted) Drug costs* 25,699,551-2,591,152 3,688,757 5,934,493 9,548,078 Other costs 31,332, , ,989 1,403,843 2,264,334 Total 57,031,738-3,204,978 4,562,746 7,338,336 11,812,412 Patient/family costs 141,190, , , , ,157 Productivity costs 125,976, , , , ,953 Total costs 324,198,432-3,136,642 4,438,312 7,095,645 11,420,616 Costs: (3% discount) Drug costs* 24,594,836-2,398,087 3,419,049 5,502,834 8,854,341 Other costs 29,979, , ,529 1,302,458 2,100,974 Total 54,574,109-2,966,457 4,229,578 6,805,291 10,955,314 Patient/family costs 135,130, , , , ,224 Productivity costs 79,678, , , , ,964 Total costs 269,383,159-2,987,272 4,236,003 6,781,014 10,917,574 Costs: (5% discount) Drug costs* 23,915,733-2,280,522 3,254,629 5,239,604 8,431,265 Other costs 29,147, , ,827 1,240,605 2,001,306 Total 53,063,318-2,821,202 4,026,457 6,480,209 10,432,571 Patient/family costs 131,405, , , , ,368 Productivity costs 65,479, , , , ,648 Total costs 249,948,029-2,866,060 4,069,048 6,517,292 10,494,291 87
90 Table F.3. Health impact of hepatitis C treatment strategies in South Australia, Description Average number of HCV cases treated per year Health effects * HCV treatment s incremental, relative to the current Current Reduction Life years lost / gained 28,327-7,041 3,977 5,436 7,198 Number of treatment gains -4,426 3,796 5,528 7,682 (Sustained virological response) HCV cases / cases averted 62, ,047 1,983 Liver failure cases / cases averted 1, HCC cases / cases averted HCV-related liver transplant cases / cases averted Liver-related deaths / deaths averted 1, Table F.4. Costs associated with hepatitis C treatment strategies in South Australia, HCV treatment s Description Incremental $, relative to the current Current Reduction Total number of HCV 18,554 10,688 31,508 41,526 63,422 cases treated Costs: (undiscounted) Drug costs* 463,108,702-79,448,936 67,299,880 97,973, ,242,300 Other costs 571,562,737 39,956,168-28,126,299-40,726,519-58,447,270 Total 1,034,671,439-39,492,768 39,173,580 57,246,504 77,795,030 Treated (% Total) 58% 50% 64% 66% 69% Patient/family costs 2,511,175, ,169, ,685, ,319, ,038,485 Treated 8% 6% 10% 11% 13% Productivity costs 2,196,980,218 5,448,267-19,798,988-36,798,718-69,672,124 Total costs 5,742,827, ,124, ,311, ,871, ,915,578 Costs: (3% discount) Drug costs* 197,572,223-34,837,850 31,983,102 47,284,834 67,964,206 Other costs 242,963,189 9,779,268-6,667,081-9,575,865-13,674,412 Total 440,535,412-25,058,582 25,316,021 37,708,969 54,289,794 Patient/family costs 1,073,123,501 73,250,378-72,039, ,770, ,747,514 Productivity costs 622,315,300 1,963,236-5,092,774-9,164,149-16,946,263 Total costs 2,135,974,213 50,155,031-51,816,327-80,225, ,403,983 Costs: (5% discount) Drug costs* 133,355,880-23,608,464 22,760,097 33,946,060 49,630,303 Other costs 163,666,335 3,928,081-2,431,349-3,419,776-4,779,121 Total 297,022,215-19,680,383 20,328,748 30,526,284 44,851,182 Patient/family costs 725,245,868 40,227,136-40,635,053-61,561,754-92,155,327 Productivity costs 356,150,381 1,280,091-2,765,240-4,862,983-8,815,238 Total costs 1,378,418,464 21,826,844-23,071,545-35,898,452-56,119,383 88
91 Table F.5. Cost-effectiveness and cost-utility analysis, South Australia ( : 5% discount) from a health sector perspective: incremental cost per LY gained, incremental cost per SVR achieved, and incremental cost per QALY gained Treatment Cost ($) cost Effect (LY lost) effect ICER* ($/LY) Reduction 277,341,832 9,009 Current 297,022,215 19,680,383 7,942 1,067 $18, ,350,963 20,328,748 7, $31, ,548,499 30,526,284 7, $34, ,873,397 44,851,182 6,771 1,171 $38,302 Treatment Cost ($) cost Effect (SVR) Reduction 277,341,832 5,502 effect ICER* ($/SVR) Current 297,022,215 19,680,383 6,805 1,303 15, ,350,963 20,328,748 8,073 1,268 16, ,548,499 30,526,284 8,699 1,894 16, ,873,397 44,851,182 9,571 2,766 16,215 Treatment Cost ($) cost Effect (QALY) Reduction 277,341, ,779 effect ICER* ($/QALY) Current 297,022,215 19,680, ,534 1,754 11, ,350,963 20,328, ,323 1,790 11, ,548,499 30,526, ,248 2,715 11, ,873,397 44,851, ,603 4,070 11,021 89
92 Appendix G: Additional results and tables for TAS Table G.1. Health impact of hepatitis C treatment strategies in Tasmania, Description Average number of HCV cases treated per year Health effects * HCV treatment s incremental, relative to the current Current Reduction Life years lost / gained Number of treatment gains (Sustained virological response) HCV cases / cases averted 1, Liver failure cases / cases averted HCC cases / cases averted HCV-related liver transplant cases / cases averted Liver-related deaths / deaths averted Table G.2. Costs associated with hepatitis C treatment strategies in Tasmania, HCV treatment s Description Incremental $, relative to the current Current Reduction Costs: (undiscounted) Drug costs* 7,170, ,442 1,059,465 1,624,120 2,655,634 Other costs 8,741, , , , ,168 Total 15,912, ,657 1,309,266 2,009,580 3,285,802 Patient/family costs 39,393,217-52,682 62, , ,429 Productivity costs 35,148,336 72, , , ,820 Total costs 90,453, ,682 1,261,977 1,955,013 3,180,412 Costs: (3% discount) Drug costs* 6,862, , ,471 1,505,498 2,462,544 Other costs 8,364, , , , ,669 Total 15,226, ,784 1,214,251 1,862,997 3,047,213 Patient/family costs 37,702,409-49,532 59, , ,321 Productivity costs 22,230,939 44,407-67, , ,797 Total costs 75,159, ,908 1,206,459 1,866,309 3,039,737 Costs: (5% discount) Drug costs* 6,672, , ,517 1,433,179 2,344,792 Other costs 8,132, , , , ,911 Total 14,805, ,056 1,156,302 1,773,625 2,901,703 Patient/family costs 36,662,992-47,589 57, , ,661 Productivity costs 18,269,322 35,673-54,287-81, ,714 Total costs 69,737, ,972 1,159,698 1,792,924 2,921,651 90
93 Table G.3. Health impact of hepatitis C treatment strategies in Tasmania, Description Average number of HCV cases treated per year Health effects * HCV treatment s incremental, relative to the current Current Reduction Life years lost / gained 7,903-1,965 1,111 1,515 2,008 Number of treatment gains -1,235 1,060 1,541 2,143 (Sustained virological response) HCV cases / cases averted 17, Liver failure cases / cases averted HCC cases / cases averted HCV-related liver transplant cases / cases averted Liver-related deaths / deaths averted Table G.4. Costs associated with hepatitis C treatment strategies in Tasmania, HCV treatment s Description Incremental $, relative to the current Current Reduction Total number of HCV 5,177 2,982 8,794 11,583 17,694 cases treated Costs: (undiscounted) Drug costs* 129,210,826-22,168,538 18,776,181 27,337,879 38,015,016 Other costs 159,470,304 11,150,495-7,864,441-11,346,041-16,302,454 Total 288,681,129-11,018,043 10,911,740 15,991,838 21,712,563 Treated (% Total) 58% 50% 64% 66% 69% Patient/family costs 700,636,989 62,834,102-59,696,103-89,574, ,960,921 Treated 8% 6% 10% 11% 13% Productivity costs 612,973,994 1,520,281-5,530,747-10,258,961-19,436,274 Total costs 1,602,292,112 53,336,341-54,315,109-83,841, ,684,633 Costs: (3% discount) Drug costs* 55,124,141-9,722,256 8,929,242 13,188,272 18,962,742 Other costs 67,788,573 2,729,607-1,869,488-2,662,338-3,812,480 Total 122,912,714-6,992,649 7,059,755 10,525,934 15,150,262 Patient/family costs 299,409,535 20,444,307-20,153,359-30,293,183-45,113,980 Productivity costs 173,630, ,936-1,424,505-2,552,594-4,726,719 Total costs 595,952,841 13,999,593-14,518,109-22,319,843-34,690,437 Costs: (5% discount) Drug costs* 37,207,296-6,589,355 6,358,617 9,463,740 13,846,527 Other costs 45,664,157 1,096, , ,566-1,331,383 Total 82,871,453-5,492,716 5,673,773 8,516,174 12,515,144 Patient/family costs 202,349,036 11,229,241-11,381,990-17,130,797-25,699,605 Productivity costs 99,368, , ,411-1,353,445-2,458,430 Total costs 384,589,071 6,093,855-6,482,628-9,968,069-15,642,892 91
94 Table G.5. Cost-effectiveness and cost-utility analysis, Tasmania ( : 5% discount) from a health sector perspective: incremental cost per LY gained, incremental cost per SVR achieved, and incremental cost per QALY gained Treatment Cost ($) cost Effect (LY lost) effect ICER* ($/LY) Reduction 77,378,737 2,514 Current 82,871,453 5,492,716 2, $18, ,545,226 5,673,773 2, $31, ,387,626 8,516,174 1, $34, ,386,597 12,515,144 1, $38,323 Treatment Cost ($) cost Effect (SVR) Reduction 77,378,737 1,535 effect ICER* ($/SVR) Current 82,871,453 5,492,716 1, , ,545,226 5,673,773 2, , ,387,626 8,516,174 2, , ,386,597 12,515,144 2, ,223 Treatment Cost ($) cost Effect (QALY) Reduction 77,378, ,064 effect ICER* ($/QALY) Current 82,871,453 5,492, , , ,545,226 5,673, , , ,387,626 8,516, , , ,386,597 12,515, ,688 1,135 11,027 92
95 Appendix H: Additional results and tables for VIC Table H.1. Health impact of hepatitis C treatment strategies in Victoria, Description Average number of HCV cases treated per year Health effects * HCV treatment s incremental, relative to the current Current Reduction ,139 1,411 1,984 Life years lost / gained 4, Number of treatment gains ,132 1,826 (Sustained virological response) HCV cases / cases averted 10, Liver failure cases / cases averted HCC cases / cases averted HCV-related liver transplant cases / cases averted Liver-related deaths / deaths averted Table H.2. Costs associated with hepatitis C treatment strategies in Victoria, HCV treatment s Description Incremental $, relative to the current Current Reduction Costs: (undiscounted) Drug costs* 76,574,978-7,975,727 11,201,657 17,571,850 28,373,956 Other costs 93,357,858-1,882,706 2,645,795 4,161,347 6,732,553 Total 169,932,835-9,858,433 13,847,451 21,733,197 35,106,509 Patient/family costs 420,695, , ,379 1,128,590 1,815,859 Productivity costs 375,361, ,110-1,153,581-1,806,811-2,947,935 Total costs 965,989,862-9,592,977 13,389,250 21,054,975 33,974,433 Costs: (3% discount) Drug costs* 73,283,342-7,385,141 10,385,892 16,292,023 26,311,120 Other costs 89,326,702-1,744,190 2,454,496 3,860,394 6,246,518 Total 162,610,044-9,129,331 12,840,388 20,152,417 32,557,638 Patient/family costs 402,638, , ,427 1,067,736 1,718,951 Productivity costs 237,412, , ,014-1,105,612-1,804,051 Total costs 802,660,698-9,146,037 12,792,801 20,114,541 32,472,538 Costs: (5% discount) Drug costs* 71,259,871-7,025,379 9,888,467 15,511,635 25,053,146 Other costs 86,848,596-1,659,779 2,337,798 3,676,806 5,949,994 Total 158,108,467-8,685,157 12,226,265 19,188,441 31,003,141 Patient/family costs 391,538, , ,458 1,029,946 1,658,728 Productivity costs 195,104, , , ,852-1,450,450 Total costs 744,751,231-8,779,417 12,294,060 19,329,534 31,211,419 93
96 Table H.3. Health impact of hepatitis C treatment strategies in Victoria, Description Average number of HCV cases treated per year Health effects * HCV treatment s incremental, relative to the current Current Reduction ,341 1,767 2,699 Life years lost / gained 84,403-20,998 11,860 16,193 21,444 Number of treatment gains -13,194 11,317 16,468 22,888 (Sustained virological response) HCV cases / cases averted 186, ,680 3,119 5,906 Liver failure cases / cases averted 3,993-1, ,113 HCC cases / cases averted 2, HCV-related liver transplant cases / cases averted Liver-related deaths / deaths averted 4,276-1, ,086 Table H.4. Costs associated with hepatitis C treatment strategies in Victoria, HCV treatment s Description Incremental $, relative to the current Current Reduction Total number of HCV 55,285 31,830 93, , ,964 cases treated Costs: (undiscounted) Drug costs* 1,379,889, ,816, ,524, ,932, ,971,101 Other costs 1,703,040, ,196,527-83,922, ,289, ,107,415 Total 3,082,929, ,619, ,602, ,643, ,863,687 Treated (% Total) 58% 50% 64% 66% 69% Patient/family costs 7,482,357, ,505, ,232, ,145,614-1,409,294,086 Treated 8% 6% 10% 11% 13% Productivity costs 6,546,173,766 16,242,924-59,042, ,620, ,573,775 Total costs 17,111,460, ,128, ,671, ,122,559-1,385,004,175 Costs: (3% discount) Drug costs* 588,690, ,926,057 95,340, ,875, ,508,742 Other costs 723,937,875 29,206,220-19,928,564-28,498,826-40,719,013 Total 1,312,628,558-74,719,837 75,411, ,376, ,789,729 Patient/family costs 3,197,504, ,652, ,025, ,906, ,815,167 Productivity costs 1,854,264,390 5,860,547-15,199,338-27,290,762-50,480,648 Total costs 6,364,397, ,793, ,812, ,819, ,506,086 Costs: (5% discount) Drug costs* 397,350,223-70,478,254 67,877, ,120, ,872,477 Other costs 487,663,259 11,746,244-7,288,083-10,165,934-14,221,222 Total 885,013,482-58,732,010 60,589,245 90,954, ,651,255 Patient/family costs 2,160,960, ,179, ,387, ,274, ,478,006 Productivity costs 1,061,193,222 3,825,129-8,259,118-14,477,849-26,255,993 Total costs 4,107,167,180 65,272,410-69,057, ,796, ,082,745 94
97 Table H.5. Cost-effectiveness and cost-utility analysis, Victoria ( : 5% discount) from a health sector perspective: incremental cost per LY gained, incremental cost per SVR achieved, and incremental cost per QALY gained Treatment Cost ($) cost Effect (LY lost) effect ICER* ($/LY) Reduction 826,281,472 26,852 Current 885,013,482 58,732,010 23,665 3,187 $18, ,602,728 60,589,245 21,734 1,931 $31, ,968,471 90,954,988 21,032 2,633 $34, ,018,664, ,651,255 20,177 3,488 $38,320 Treatment Cost ($) cost Effect (SVR) Reduction 826,281,472 16,384 effect ICER* ($/SVR) Current 885,013,482 58,732,010 20,277 3,893 15, ,602,728 60,589,245 24,063 3,787 16, ,968,471 90,954,988 25,914 5,638 16, ,018,664, ,651,255 28,516 8,239 16,222 Treatment Cost ($) cost Effect (QALY) Reduction 826,281,472 1,784,123 effect ICER* ($/QALY) Current 885,013,482 58,732,010 1,789,363 5,241 11, ,602,728 60,589,245 1,794,709 5,346 11, ,968,471 90,954,988 1,797,445 8,082 11, ,018,664, ,651,255 1,801,484 12,121 11,026 95
98 Appendix I: Additional results and tables for WA Table I.1. Health impact of hepatitis C treatment strategies in Western Australia, Description Average number of HCV cases treated per year Health effects * HCV treatment s incremental, relative to the current Current Reduction Life years lost / gained 2, Number of treatment gains (Sustained virological response) HCV cases / cases averted 5, Liver failure cases / cases averted HCC cases / cases averted HCV-related liver transplant cases / cases averted Liver-related deaths / deaths averted Table I.2. Costs associated with hepatitis C treatment strategies in WA, HCV treatment s Description Incremental $, relative to the current Current Reduction Costs: (undiscounted) Drug costs* 38,202,047-3,856,845 5,535,863 8,711,317 14,144,308 Other costs 46,574, ,588 1,309,461 2,065,377 3,356,524 Total 84,776,991-4,770,433 6,845,324 10,776,694 17,500,832 Patient/family costs 209,877, , , , ,000 Productivity costs 187,262, , , ,479-1,468,627 Total costs 481,916,994-4,668,859 6,637,626 10,464,054 16,941,205 Costs: (3% discount) Drug costs* 36,559,902-3,569,548 5,131,914 8,075,966 13,115,805 Other costs 44,563, ,954 1,214,582 1,915,787 3,114,161 Total 81,123,759-4,415,502 6,346,496 9,991,753 16,229,966 Patient/family costs 200,869, , , , ,379 Productivity costs 118,441, , , , ,771 Total costs 400,434,652-4,446,360 6,338,803 9,992,760 16,191,574 Costs: (5% discount) Drug costs* 35,550,425-3,394,599 4,885,630 7,688,586 12,488,603 Other costs 43,327, ,754 1,156,710 1,824,541 2,966,300 Total 78,877,989-4,199,353 6,042,340 9,513,127 15,454,903 Patient/family costs 195,331, , , , ,169 Productivity costs 97,334, , , , ,616 Total costs 371,544,535-4,265,932 6,090,411 9,601,250 15,562,455
99 Table I.3. Health impact of hepatitis C treatment strategies in Western Australia, Description Average number of HCV cases treated per year Health effects * HCV treatment s incremental, relative to the current Current Reduction ,347 Life years lost / gained 42,107-10,466 5,914 8,076 10,698 Number of treatment gains -6,579 5,645 8,214 11,418 (Sustained virological response) HCV cases / cases averted 92, ,556 2,947 Liver failure cases / cases averted 1, HCC cases / cases averted 1, HCV-related liver transplant cases / cases averted Liver-related deaths / deaths averted 2, Table I.4. Costs associated with hepatitis C treatment strategies in WA, HCV treatment s Description Incremental $, relative to the current Current Reduction Total number of HCV 27,581 15,887 46,842 61,715 94,270 cases treated Costs: (undiscounted) Drug costs* 688,405, ,101, ,039, ,649, ,536,285 Other costs 849,620,656 59,397,217-41,838,914-60,477,074-86,853,459 Total 1,538,025,825-58,704,347 58,200,654 85,172, ,682,827 Treated (% Total) 58% 50% 64% 66% 69% Patient/family costs - 3,732,830, ,722, ,774, ,360, ,047,285 Treated 8% 6% 10% 11% 13% Productivity costs 3,265,782,667 8,099,202-29,442,889-54,671, ,550,703 Total costs - 8,536,639, ,117, ,017, ,859, ,915,161 Costs: (3% discount) Drug costs* 293,688,572-51,788,471 47,553,109 70,275, ,029,051 Other costs 361,161,757 14,537,792-9,926,759-14,199,487-20,310,752 Total 654,850,329-37,250,679 37,626,350 56,076,062 80,718,299 Patient/family costs - 1,595,184, ,893, ,179, ,487, ,349,699 Productivity costs 925,063,359 2,918,459-7,576,662-13,606,961-25,182,217 Total costs 3,175,097,838 74,561,499-77,130, ,018, ,813,616 Costs: (5% discount) Drug costs* 198,231,797-35,096,357 33,847,767 50,436,958 73,770,580 Other costs 243,288,020 5,839,522-3,625,461-5,058,793-7,092,414 Total 441,519,817-29,256,834 30,222,306 45,378,165 66,678,166 Patient/family costs 1,078,068,426 59,803,495-60,481,284-91,345, ,915,571 Productivity costs 529,412,672 1,902,916-4,115,591-7,216,616-13,097,454 Total costs 2,049,000,916 32,449,577-34,374,570-53,184,396-83,334,859 97
100 Table I.5. Cost-effectiveness and cost-utility analysis, Western Australia ( : 5% discount) from a health sector perspective: incremental cost per LY gained, incremental cost per SVR achieved, and incremental cost per QALY gained Treatment Cost ($) cost Effect (LY lost) effect ICER* ($/LY) Reduction 412,262,983 13,392 Current 441,519,817 29,256,834 11,806 1,586 $18, ,742,123 30,222,306 10, $31, ,897,983 45,378,165 10,494 1,312 $34, ,197,983 66,678,166 10,066 1,740 $38,325 Treatment Cost ($) cost Effect (SVR) Reduction 412,262,983 8,178 effect ICER* ($/SVR) Current 441,519,817 29,256,834 10,116 1,937 15, ,742,123 30,222,306 12,003 1,887 16, ,897,983 45,378,165 12,926 2,810 16, ,197,983 66,678,166 14,226 4,110 16,224 Treatment Cost ($) cost Effect (QALY) Reduction 412,262, ,078 effect ICER* ($/QALY) Current 441,519,817 29,256, ,686 2,608 11, ,742,123 30,222, ,349 2,664 11, ,897,983 45,378, ,714 4,028 11, ,197,983 66,678, ,732 6,046 11,028 98
101 Appendix J: Methods and data sources A dynamic mathematical transmission model of HCV infection was developed to describe the transmission of HCV through a population and track the disease progression of HCVinfected individuals. A schematic diagram of the model structure is shown in Figure J.1. The model is a compartmental model based on 240 ordinary differential equations, which describe the estimated number of people in a population in each mutually exclusive compartment based on HCV-related and behavioural status. The model was solved numerically in MATLAB software and was used to estimate the number of people in each HCV health state, including important clinical endpoints such as liver failure, HCC, and liver transplant, as well as liver-related death. These outputs were used as inputs in an economic analysis to estimate the economic burden of hepatitis C from the year 2010 until 2039 (30- year time horizon). A cost-effectiveness (CEA) and cost-utility (CUA) analysis was performed to compare the costs and benefits associated with current levels of treatment for hepatitis C with four alternative hepatitis C treatment s. Currently, approximately 3,500 people infected with hepatitis C (~1-2% of all chronic hepatitis C cases) receive combination PEG- IFN and ribavirin therapy each year in Australia [3]. In this study we simulate the following treatment s: Current treatment : no change from current practice; Reduction : treatments decline to 2,000 from 2010 onwards; 1: treatments increase steadily to 6,000 per year from 2011 onwards; 2: treatments increase steadily to 8,000 per year from 2012 onwards; 3: treatments increase steadily to 12,000 per year from 2014 onwards. Health benefits, measured in terms of life years (LYs) gained, quality-adjusted life years (QALYs) gained, and total health care-related costs for each treatment strategy were computed from a societal perspective, which accounts for benefits, risks, and costs to all parties according to the Panel on Cost-Effectiveness of Health and Medicine [31] (although patient-time costs and productivity costs were excluded in the CEA). Other key health outcomes of the analysis include the number of new liver failure cases averted, new HCC cases averted, the number of liver transplants avoided, and the number of liver-related deaths averted. The years of potential life lost due to HCV was estimated using the life expectancy of the average Australian [32], adjusted for premature mortality associated with hepatitis C [23]. Based on published literature [23, 33], it was assumed that the average age at liver-related death was 65 (range, 61-70) years. 99
102 The comparative efficiencies of alternative HCV treatment s were measured by the incremental cost-effectiveness ratio (ICER), defined as the additional cost of a specific strategy, divided by its additional health benefit, expressed as cost per QALY gained. The ICER for an alternative treatment was computed in reference to the next most effective option. All costs and benefits were discounted at an annual rate of 5%, based on Pharmaceutical Benefits Advisory Committee guidelines to reflect the higher present value of money [30]. Data sources The model was parameterised using the best available biological, behavioural, clinical and epidemiological data from the National Annual Surveillance Reports [3], Australian Needle and Syringe Program Survey behavioural reports [34], and published peer-reviewed literature. These values were used to estimate the annual incidence of HCV, as previously described [35], and important clinical endpoints. Stage-specific transition probabilities were derived from a meta-analysis of more than 100 hepatitis C natural history studies [36]. Transition probabilities for end-stage liver disease (i.e., progression from F4 to liver failure or HCC) were derived from pooled results of published literature [37-55]. Competing mortality risk data were obtained from the published literature [42, 46, 54, 56]. Characteristics of individuals with chronic HCV infection undergoing treatment, including liver disease stage were obtained from an Australian HCV Clinical Audit Study (unpublished). Treatment efficacy data as a function of genotype and stage of liver disease were based on a published randomised controlled trial [9]. The model inputs that characterise the population and the natural history of hepatitis C with their uncertainty bounds are summarised in Table J.1 and Table J.2. Mathematical HCV epidemic transmission model The model describes IDUs and non-idus aged in Australia (Figure 1). Definitions for IDU status were based on the Australian NSP Survey [34]: a regular IDU is defined as someone who reported injecting more than weekly in the month prior to the survey; and an occasional IDU is defined as someone who reported injecting less than weekly in the month prior to the survey. These are generally consistent with the previous HCV Projections Working Group definitions [5]. Non-IDUs considered were those who acquired HCV through routes other than injecting drug use. The model tracked the shifts in the number of IDUs in the population, including the entry of new injectors, transitions between injecting status (e.g., transition from occasional to regular), and the rate of cessation of injecting. The infection of IDUs with HCV was simulated based on injecting behaviour and mixing in the population. The analyses were stratified by gender and genotype. The model inputs that characterise the population are summarised in Table J.1. Natural history model of hepatitis C The model tracked the natural history of disease progression for people infected with HCV and captures the fact that an individual who is infected with HCV and clears the virus remains susceptible to re-infection. Among spontaneous clearers, it was assumed that reinfection rate was similar to that of the initial infection. Among those who had achieved a successful treatment and cleared the virus (sustained virological response), it was assumed that re-infection rate is decreased to approximately 10% of the initial infection rate [14-16]. 100
103 Fifteen compartments describe IDUs and non-idus who are monoinfected with HCV: in acute stage, liver fibrosis stages F0, F1, F2, F3, F4 (compensated cirrhosis), and for each of these, whether they are untreated or receiving treatment. People infected with HCV who have advanced fibrosis can progress to clinical outcomes of liver failure, HCC, or may receive a liver transplant. It was assumed that individuals that progress to these three clinical outcomes no longer inject drugs. Annual transition probabilities determined the movements of individuals through different health states. We assumed that liver disease progresses one stage at a time. We also assumed that regression from a later to an earlier stage (e.g., F1 to F0, F3 to F2) does not occur, although there is evidence to suggest that this may occur in some individuals with successful treatment [57]. Each year, individuals face competing mortality risks from liver failure, HCC, and other causes unrelated to HCV, including drugrelated and background death. Annual background death rates were adjusted taking into account premature mortality due to HCV infection [23, 33]. The model inputs that characterise the natural history of hepatitis C are summarised in Table J.2. HCV treatment Based on an Australian HCV Clinical Audit Study (unpublished), the proportion of people with chronic HCV infection within each stage commencing treatment is as follows: 58% F0 stage; 44% F1 stage; 66% F2 stage; 68% F3 stage; and 62% F4 stage (Table J.2). The overall proportion of IDUs among the treated population is approximately 80%. Current IDUs represent approximately 5% of the treated population. The current standard treatment for chronic hepatitis C is combination therapy with pegylated interferon (PEG-IFN) alfa and ribavirin administered for 24 weeks for HCV genotypes 2 or 3 or 48 weeks for HCV genotype 1 [9, 11, 12]. We assumed that people with acute HCV infection and those in the advanced disease stages (i.e., liver failure, HCC) would not undergo treatment on the basis that only a small minority of these groups would receive treatment each year in real life. However, cases with liver failure and HCC are considered for liver transplantation. We also assumed that antiviral therapy for hepatitis C is considered only once. Patients who do not achieve sustained response to therapy receive no further treatment. Non-adherence to therapy (~15%) [58, 59] was also considered and hepatitis C treatment cost adjusted accordingly. Model calibration The mathematical model was calibrated to be consistent with available epidemiologic data in Australia in terms of incidence and prevalence of HCV and to reflect clinical data on progression of HCV infection, that is, incidence of liver failure and HCC, the number of liver transplants and liver-related death, and the number of people treated in the year 2008.[2] We assume that changes in treatment numbers would not have a major impact on these estimates in the base year (2010). Costs Resource use was considered under the following broad headings: i) health sector resource use; ii) patient and family resource use; and iii) productivity losses and gains. Resource use in other sectors such as voluntary sector and other home help visits associated with 101
104 treatment are difficult to identify, measure or value. Therefore, these costs were not included in this analysis. Annual health care costs of patients in each HCV state were identified through published literature [28, 60] and the creation of a model of service delivery reflecting current practice. Health care-related costs include specialist and GP visits, medications, prescription drugs, laboratory and diagnostic tests, procedures, emergency department visits, hospitalisations, nursing personnel, psychological support, social support, counselling and education. Based on a Canadian population-based study (Paterson et al, unpublished), we assumed that mental health services are used in 50% of the people infected with chronic HCV infection. The unit costs of hospitalisation were estimated based on the frequency and proportions of admission to hospital with different health states of HCV and deriving a weighted average cost per admission in a health state using cost weights for admission to an Australian public hospital [61, 62]. Total costs are quantities of resource use multiplied by their unit costs. Unit costs for resource categories were based on the Medical Benefits Schedule (MBS) [63], Pharmaceutical Benefits Scheme (PBS) [64], National Admitted Patient Care Collection (NAPCC) [61], and National Hospital Cost Data Collection [65]. All costs were expressed in 2008 Australian dollars using the health care component of the Consumer Price Index. Annual health care costs of hepatitis C and patient and family time costs are summarised in Table 3. In the absence of Australian data, patient and family resource use was estimated based on a multicentre Canadian study conducted between 2006 and 2008 which used a convenience sampling method for comprehensive data collection, including patient s time, time of relatives/carers, and out-of-pocket expenses associated with medical care, including travel to and from care, waiting for appointments, receipt of care, and non-prescription medication costs during the three months prior to the survey (Federico, Krahn et al, unpublished). Australian costs were obtained using Purchasing Power Parities for GDP to convert Canadian dollars to Australian currency, and then inflated to 2008 dollars, using the Consumer Price Index for health care. Patient and carer/family time costs and out-of-pocket expenses are shown in Table J.3, J.4, and J.5. Productivity losses associated with hepatitis C were estimated using the friction cost method [66]. This method explicitly considers economic circumstances that limit production losses due to disease. In this study, a three-month replacement and gender-specific wages were used to estimate productivity loss per person with HCV, and discounted at 3%, 0%, and 5%. Inputs for friction costs involve estimating the workforce participation rate of HCV-infected individuals for the rest of their working life, compared with a cohort of population controls who are not HCV infected, measuring their respective disability, mortality, workplace absenteeism, and employment/work force participation. Mortality among HCV-infected individuals was estimated using a decision tree in DATA PRO [67]. Survival time and agespecific mortality rates of an HCV-infected population was compared with that of the general population [68]. The proportion of full-time and part-time employment among people infected with hepatitis C was based on a study evaluating the acceptability of different methods of HCV testing among IDUs recruited through primary healthcare and drug treatment services [69, 70]. In this study, it was found that 61% of the IDUs with chronic hepatitis C reported unemployment. 102
105 Utilities Utilities for HCV-related health states, sustained response to treatment, and disutility associated with HCV treatment, was based on peer-reviewed publications [71-73] and presented in Table J.6. A QALY framework was used in the economic analyses [31, 74]. The amount of time an individual spends in a given health state is multiplied by the health state preference value to calculate the number of QALYs gained. Thus, the QALY approach provides a combined measure of the benefits of an intervention that both extends life and maintains quality of life [75, 76]. Uncertainty and sensitivity analyses In order to identify factors that are the most influential for yielding variation in model outputs, one-way sensitivity analyses were performed by varying key model parameters (e.g., transition probabilities, treatment efficacy, costs, utilities, and discount rate) within the ranges specified in Table 2, Table J.2, and Table J.6. The ranges were based on 95% confidence intervals where available or calculable. Health care costs were halved and doubled to obtain lower and upper limits. Latin hypercube sampling [77-79], an efficient type of stratified Monte Carlo sampling, was used to sample 100 parameter sets using the SaSAT software [79]. The model was then run 100 times, once for each set of parameter values, as an uncertainty analysis. 103
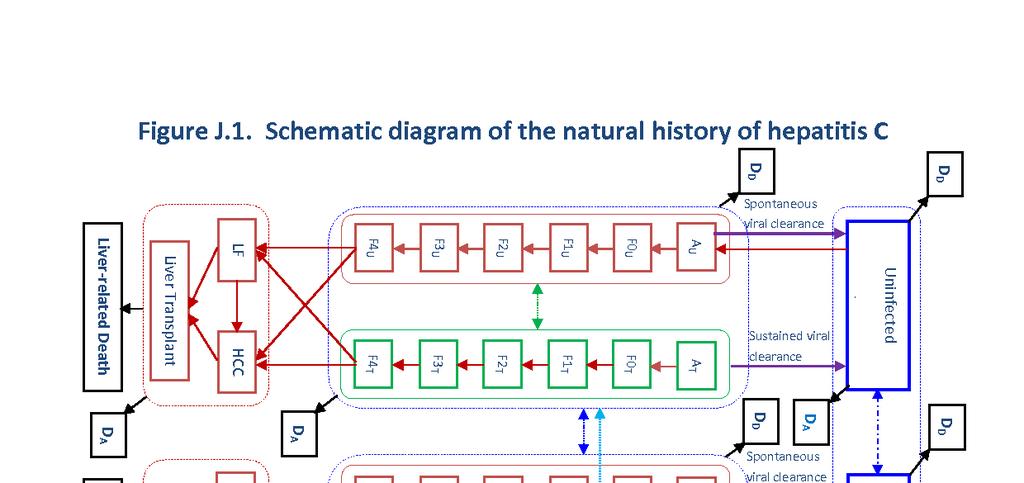
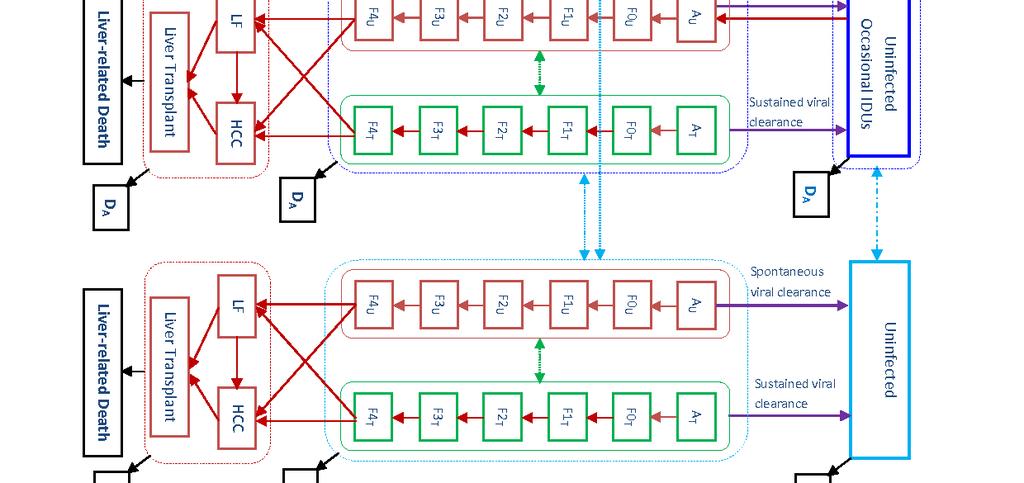
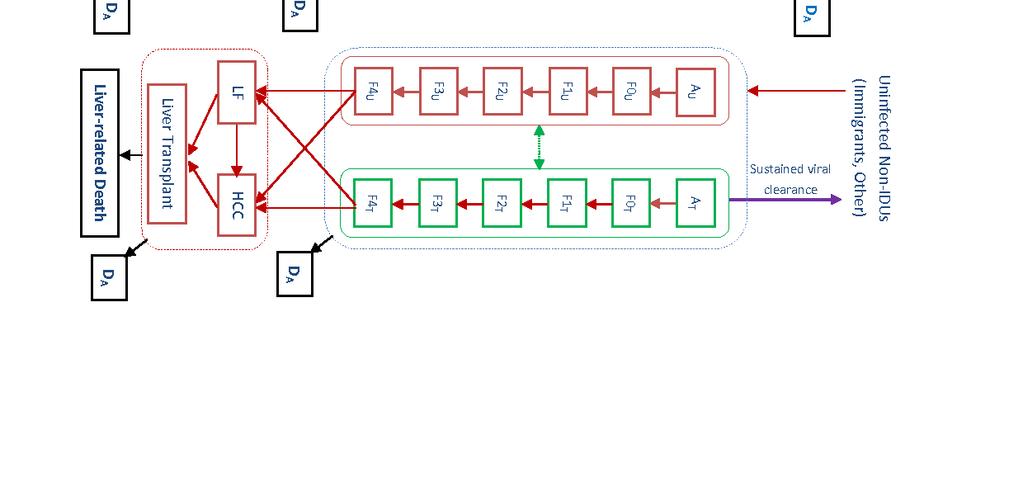
106 104
Hepatitis B and C in Australia. Annual Surveillance Report Supplement 2016
 Hepatitis B and C in Australia Annual Surveillance Report Supplement 216 The Kirby Institute for infection and immunity in society 216 ISSN 226-163 (Online) This publication is available at Internet address
Monitoring hepatitis C treatment uptake in Australia
 Monitoring hepatitis C treatment uptake in Australia Issue #5 September 216 1 Reimbursements for new treatment for chronic hepatitis C during March to July 216 An estimated 18,581 patient PBS initial prescriptions
William W.L. Wong, PhD School of Pharmacy University of Waterloo. CADTH Symposium April 17, 2018
 I n t e g r a t i n g 2 0 1 7 m o d e l - b a s e d e s t i m a t e s o f h e p a t i t i s C v i r u s ( H C V ) p r e v a l e n c e i n t o t h e e v a l u a t i o n o f H C V s c r e e n i n g c o s
Monitoring hepatitis C treatment uptake in Australia
 Monitoring hepatitis C treatment uptake in Australia Issue #7 July 217 1 Initiations of new treatment for chronic hepatitis C in 216 An estimated 32,4 individuals initiated direct acting antiviral (DAA)
Economic issues in Hepatitis C. Richard Grieve London School of Hygiene and Tropical Medicine
 Economic issues in Hepatitis C Richard Grieve London School of Hygiene and Tropical Medicine Acknowledgements Mild Hepatitis C study Principal Investigators: Howard Thomas, Janice Main Centre co-ordinators
Supplementary Online Content
 Supplementary Online Content Chahal HS, Marseille EA, Tice JA, et al. Cost-effectiveness of early treatment of hepatitis C virus genotype 1 by stage of liver fibrosis in a US treatment-naive population.
Technology appraisal guidance Published: 22 September 2010 nice.org.uk/guidance/ta200
 Peginterferon alfa and ribavirin for the treatment of chronic hepatitis C Technology appraisal guidance Published: 22 September 2010 nice.org.uk/guidance/ta200 NICE 2018. All rights reserved. Subject to
Boceprevir for previously untreated patients with chronic hepatitis C Genotype 1 infection: a US-based cost-effectiveness modeling study
 Ferrante et al. BMC Infectious Diseases 2013, 13:190 RESEARCH ARTICLE Open Access Boceprevir for previously untreated patients with chronic hepatitis C Genotype 1 infection: a US-based cost-effectiveness
HTA: Models, Costs & Benefits.
 HTA: Models, Costs & Benefits John.Cairns@lshtm.ac.uk Explicit evaluation of costs and benefits Advantages Potential for more consistent decision making Potential for more transparent decision making Facilitates
Bloodborne viral and sexually transmitted infections in Aboriginal and Torres Strait Islander people: Annual Surveillance Report
 Bloodborne viral and sexually transmitted infections in Aboriginal and Torres Strait Islander people: Annual Surveillance Report 214 The Kirby Institute for infection and immunity in society 214 ISSN 1835
Technology appraisal guidance Published: 27 November 2013 nice.org.uk/guidance/ta300
 Peginterferon alfa and ribavirin for treating chronic hepatitis C in children and young people Technology appraisal guidance Published: 27 November 2013 nice.org.uk/guidance/ta300 NICE 2018. All rights
Peginterferon alfa and ribavirin for the treatment of chronic hepatitis C. Part review of NICE technology appraisal guidance 75 and 106
 Issue date: September 2010 Peginterferon alfa and ribavirin for the treatment of chronic hepatitis C Part review of NICE technology appraisal guidance 75 and 106 National Institute for Health and Clinical
Hepatitis C treatment for people who inject drugs: are directacting antivirals cost-effective?
 Hepatitis C treatment for people who inject drugs: are directacting antivirals cost-effective? Daniëla K. van Santen, Anneke S. de Vos, Amy Matser, Sophie B. Willemse, Karen Lindenburg, Mirjam E.E. Kretzschmar,
AUSTRALIAN NSP SURVEY NATIONAL DATA REPORT
 Needle Syringe Programs and Harm Reduction Services in Australia AUSTRALIAN NSP SURVEY NATIONAL DATA REPORT - Prevalence of HIV, HCV and injecting and sexual behaviour among NSP attendees The Australian
Health and economic consequences of HCV lookback Pereira A
 Health and economic consequences of HCV lookback Pereira A Record Status This is a critical abstract of an economic evaluation that meets the criteria for inclusion on NHS EED. Each abstract contains a
Cost effectiveness of sofosbuvir and ledipasvir (Harvoni ) in combination with other medicinal products for the treatment of hepatitis C infection
 in combination with other medicinal products for the treatment of hepatitis C infection") Cost effectiveness of sofosbuvir and ledipasvir (Harvoni ) in combination with other medicinal products for the treatment of hepatitis C infection The NCPE has issued a recommendation regarding the cost
Cost effectiveness of sofosbuvir and ledipasvir (Harvoni ) in combination with other medicinal products for the treatment of hepatitis C infection The NCPE has issued a recommendation regarding the cost
Resource impact report: Sofosbuvir velpatasvir for treating chronic hepatitis C TA430
 Putting NICE guidance into practice Resource impact report: Sofosbuvir velpatasvir for treating chronic hepatitis C TA430 Published: January 2017 Summary Sofosbuvir velpatasvir is recommended as an option
Common Drug Review Pharmacoeconomic Review Report
 Common Drug Review Pharmacoeconomic Review Report October 2014 Drug Sofosbuvir (Sovaldi) (400 mg/tablet) Indication Sofosbuvir is indicated for the treatment of chronic hepatitis C virus (CHC) infection
Horizon Scanning Centre November Faldaprevir with BI for chronic hepatitis C infection, genotype 1 SUMMARY NIHR HSC ID: 7688
 Horizon Scanning Centre November 2012 Faldaprevir with BI 207127 for chronic hepatitis C infection, genotype 1 SUMMARY NIHR HSC ID: 7688 This briefing is based on information available at the time of research
Hepatitis C Treatment in Oregon
 The Hepatitis C Advisory Group, 12/21/2014 Hepatitis C Treatment in Oregon Introduction The rising health care burden of HCV infection in Oregon is occurring at this time of growing interest in containing
Factsheet: Treatments for hepatitis C Direct Acting Antivirals (DAAs)
") Factsheet: Treatments for hepatitis C Direct Acting Antivirals (DAAs) For more information about anything in this factsheet, phone the Hepatitis Infoline on 1800 703 003 or go to www.hepvic.org.au The
Factsheet: Treatments for hepatitis C Direct Acting Antivirals (DAAs) For more information about anything in this factsheet, phone the Hepatitis Infoline on 1800 703 003 or go to www.hepvic.org.au The
Scottish Medicines Consortium
 Scottish Medicines Consortium pegylated interferon α 2b (ViraferonPeg ), 50, 80, 100, 120 or 150 micrograms powder for solution for injection in pre-filled pen, in combination with ribavirin (Rebetol ),
The Disease Burden of Hepatitis C in Belgium : development of a realistic disease control strategy
 280 POSITION PAPER : BELGIAN WORKING GROUP FOR HEPATITIS C The Disease Burden of Hepatitis C in Belgium : development of a realistic disease control strategy P. Stärkel 1, D. Vandijck 2,3, W. Laleman 4,
National Clinical Guidelines for the treatment of HCV in adults. Version 4
 National Clinical Guidelines for the treatment of HCV in adults Version 4 November 2017 Sponsors and Authorship The guidelines have been authored on behalf of the viral hepatitis clinical leads and MCN
TREATMENT OF RECENTLY ACQUIRED HEPATITIS C VIRUS INFECTION (ATAHC II)
") TREATMENT OF RECENTLY ACQUIRED HEPATITIS C VIRUS INFECTION (ATAHC II) A national study to find the best treatment strategy for people with recently acquired hepatitis C infection. introduction This information
TREATMENT OF RECENTLY ACQUIRED HEPATITIS C VIRUS INFECTION (ATAHC II) A national study to find the best treatment strategy for people with recently acquired hepatitis C infection. introduction This information
CDEC FINAL RECOMMENDATION
 CDEC FINAL RECOMMENDATION DACLATASVIR (Daklinza Bristol-Myers Squibb Canada Inc.) Indication: Chronic Hepatitis C Genotype 1, 2, or 3 Infection in Adults Recommendation: The Canadian Drug Expert Committee
Technology appraisal guidance Published: 21 February 2018 nice.org.uk/guidance/ta507
 Sofosbuvir velpatasvir voxilaprevir for treating chronic hepatitis C Technology appraisal guidance Published: 21 February 2018 nice.org.uk/guidance/ta507 NICE 2018. All rights reserved. Subject to Notice
Hepatitis C Virus (HCV) & Infectious Disease 101 for Hubs & Spokes April 24, :00 pm 1:00 pm
 & Infectious Disease 101 for Hubs & Spokes April 24, :00 pm 1:00 pm") Hepatitis C Virus (HCV) & Infectious Disease 101 for Hubs & Spokes April 24, 2018 12:00 pm 1:00 pm Presenters: Thomas E. Freese, PhD, Larissa Mooney, MD, & Rachel McLean, MPH, Chief, Office of Viral Hepatitis
Hepatitis C Virus (HCV) & Infectious Disease 101 for Hubs & Spokes April 24, 2018 12:00 pm 1:00 pm Presenters: Thomas E. Freese, PhD, Larissa Mooney, MD, & Rachel McLean, MPH, Chief, Office of Viral Hepatitis
HCV elimination : lessons from Scotland
 HCV elimination : lessons from Scotland Sharon Hutchinson Glasgow Caledonian University / Health Protection Scotland BHIVA Hepatology Highlights, Edinburgh, 17 th April 2018 Disclosures Honoraria from
HEPATITIS C WORKING GROUP
 Recommendations on Hepatitis C Screening for Adults (2017): Guideline Presentation Speaker deck (Slide 3) HEPATITIS C WORKING GROUP The Hepatitis C Working Group included members from the Canadian Task
Successful hepatitis C treatment lowers risk of death for people with HIV and HCV co infection
 Successful hepatitis C treatment lowers risk of death for people with HIV and HCV co infection Liz Highleyman Produced in collaboration with hivandhepatitis.com Published: 28 October 2015 Jump to Trends
The epidemiology of hepatitis C infection in Ontario, 2004
 The epidemiology of hepatitis C infection in Ontario, 2004 Robert S. Remis MD, MPH, FRCPC Department of Public Health Sciences University of Toronto Ontario Ontrario Harm Reduction Distribution Program
Technology appraisal guidance Published: 24 January 2018 nice.org.uk/guidance/ta499
 Glecaprevir pibrentasvir for treating chronic hepatitis C Technology appraisal guidance Published: 24 January 2018 nice.org.uk/guidance/ta499 NICE 2018. All rights reserved. Subject to Notice of rights
Impact of Screening and Treatment for Hepatitis C Virus (HCV) Infection in Switzerland
 Infection in Switzerland") 1 Impact of Screening and Treatment for Hepatitis C Virus (HCV) Infection in Switzerland A Comprehensive Mathematical Model of the Swiss HCV Epidemic Final report Janne Estill*, Maryam Sadeghimehr*, Olivia
1 Impact of Screening and Treatment for Hepatitis C Virus (HCV) Infection in Switzerland A Comprehensive Mathematical Model of the Swiss HCV Epidemic Final report Janne Estill*, Maryam Sadeghimehr*, Olivia
Hepatitis C Management and Treatment
 Hepatitis C Management and Treatment Kaya Süer Near East University Faculty of Medicine Infectious Diseases and Clinical Microbiology 1 Discovery of Hepatitis C Key facts Hepatitis C: the virus can cause
Hepatitis C Update on New Treatments
 Hepatitis C Update on New Treatments Kevork M. Peltekian, MD, FRCPC 44th Annual Dalhousie Spring Refresher Course - Therapeutics April 5 - April 7, 2018 Halifax Convention Centre Disclosures Conflicts
AIHW Dental Statistics and Research Unit Research Report No. 26 Access to dental services among Australian children and adults
 AIHW Dental Statistics and Research Unit Research Report No. Access to dental services among Australian children and adults This report provides information on the use of dental services among Australian
National Clinical Guidelines for the treatment of HCV in adults. Version 3
 National Clinical Guidelines for the treatment of HCV in adults Version 3 January 2017 Sponsors and Authorship The guidelines have been authored on behalf of the viral hepatitis clinical leads and MCN
Assessment of sofosbuvir (Sovaldi )
") Assessment of sofosbuvir (Sovaldi ) Summary of the national assessments of sofosbuvir (Sovaldi ) for the treatment of Hepatitis C December 18, 2014 Health Care Institute, Diemen, NL Lead Partner WP5 EUnetHTA
Assessment of sofosbuvir (Sovaldi ) Summary of the national assessments of sofosbuvir (Sovaldi ) for the treatment of Hepatitis C December 18, 2014 Health Care Institute, Diemen, NL Lead Partner WP5 EUnetHTA
National Cross Cultural Dementia Network (NCCDN) A Knowledge Network of value
 A Knowledge Network of value") National Cross Cultural Dementia Network (NCCDN) A Knowledge Network of value One in eight Australians with dementia do not speak English at home. Dementia does not discriminate; it affects all people
National Cross Cultural Dementia Network (NCCDN) A Knowledge Network of value One in eight Australians with dementia do not speak English at home. Dementia does not discriminate; it affects all people
National Clinical Guidelines for the treatment of HCV in adults. Version 5
 National Clinical Guidelines for the treatment of HCV in adults Version 5 June 2018 Sponsors and Authorship The guidelines have been authored on behalf of the viral hepatitis clinical leads and MCN co-ordinators
NATIONAL INSTITUTE FOR CLINICAL EXCELLENCE. Final Appraisal Determination
 NATIONAL INSTITUTE FOR CLINICAL EXCELLENCE Final Appraisal Determination Interferon alfa (pegylated and non-pegylated) and ribavirin for the treatment of chronic hepatitis C 1 Guidance 1.1 Combination
2016: The State of HIV & Hepatitis C in the District
 2016: The State of HIV & Hepatitis C in the District Travis A. Gayles, MD, PhD Chief Medical Officer, HIV/AIDS, Hepatitis, STD, and TB Administration Division Chief, STD and TB Control February 29, 2016
Exploring the risks of liver cancer after successful treatment for hepatitis C virus
 CATIE-News CATIE s bite-sized HIV and hepatitis C news bulletins. Exploring the risks of liver cancer after successful treatment for hepatitis C virus 11 June 2013 In Canada and other high-income countries,
CHAPTER 2. Prevalence of Renal Replacement Therapy for End Stage Kidney Disease
 CHAPTER 2 Prevalence of Renal Replacement Therapy for End Stage Kidney Disease Summarising the number of prevalent renal replacement therapy patients in Australia and New Zealand, the prevalence rate per
About the National Centre for Pharmacoeconomics
 Cost effectiveness of sofosbuvir (in combination with either ribavirin or pegylated interferon + ribavirin) (Sovaldi ) for the treatment of hepatitis C infection The NCPE has issued a recommendation regarding
WHO COLLABORATING CENTRE FOR VIRAL HEPATITIS THE PETER DOHERTY INSTITUTE FOR INFECTION AND IMMUNITY
 HEPATITIS C MAPPING PROJECT HEPATITIS B MAPPING PROJECT Estimates of geographic diversity in chronic hepatitis C prevalence, diagnosis, Estimates of CHB prevalence and cultural monitoring and treatment
ClinicalTrials.gov Protocol Registration and Results System (PRS) Receipt Release Date: June 25, ClinicalTrials.gov ID: NCT
 Receipt Release Date: June 25, ClinicalTrials.gov ID: NCT") ClinicalTrials.gov Protocol Registration and Results System (PRS) Receipt Release Date: June 25, 2014 ClinicalTrials.gov ID: NCT00372385 Study Identification Unique Protocol ID: VX05-950-104EU Brief Title:
ClinicalTrials.gov Protocol Registration and Results System (PRS) Receipt Release Date: June 25, 2014 ClinicalTrials.gov ID: NCT00372385 Study Identification Unique Protocol ID: VX05-950-104EU Brief Title:
07-Nov HCV infection in India. Cost-effectiveness of hepatitis C treatment: The Indian Scenario. Incremental cost-effectiveness plane
 Cost-effectiveness of hepatitis C : The Indian Scenario HCV infection in India Disease burden: 6 to 7 million viremic cases (0.5-0.6% of population), mainly genotype 3 Generic DAAs available at low cost
Oral health trends among adult public dental patients
 DENTAL STATISTICS & RESEARCH Oral health trends among adult public dental patients DS Brennan, AJ Spencer DENTAL STATISTICS AND RESEARCH SERIES Number 30 Oral health trends among adult public dental patients
Review of methodological issues in costeffectiveness analyses relating to injecting drug users, and case-study illustrations
 J. R. Statist. Soc. A (2014) 177, Part 3, pp. 625 642 Review of methodological issues in costeffectiveness analyses relating to injecting drug users, and case-study illustrations Simon R. White and Sheila
Authors Natasha K. Martin 1,2 Alec Miners 1 Peter Vickerman 1,2. Tropical Medicine, Tavistock Place, London, UK. Whatley Road, Bristol, UK
 Assessing the cost-effectiveness of interventions aimed at promoting and offering hepatitis C testing to injecting drug users: An economic modelling report Authors Natasha K. Martin 1,2 Alec Miners 1 Peter
Ari Bunim, M.D. Director of Hepatology New York Hospital Queens Assistant Professor of Clinical Medicine Weill Cornell Medical College
 Ari Bunim, M.D. Director of Hepatology New York Hospital Queens Assistant Professor of Clinical Medicine Weill Cornell Medical College New York State Law Goes into Effect January 1, 2014 Hepatitis C Virus
Technology appraisal guidance Published: 25 November 2015 nice.org.uk/guidance/ta363
 Ledipasvir sofosbuvir for treating chronic hepatitis C Technology appraisal guidance Published: 25 November 2015 nice.org.uk/guidance/ta363 NICE 2018. All rights reserved. Subject to Notice of rights (https://www.nice.org.uk/terms-and-conditions#notice-ofrights).
POSITION PAPER : BELGIAN WORKING GROUP FOR HEPATITIS C 285. Current and future health and economic impact of hepatitis C in Belgium
 POSITION PAPER : BELGIAN WORKING GROUP FOR HEPATITIS C 285 Current and future health and economic impact of hepatitis C in Belgium D. Vandijck 1,2, C. Moreno 3, P. Stärkel 4, P. Van Damme 5, H. Van Vlierberghe
2.0 Synopsis. ABT-450/r, ABT-267 M Clinical Study Report R&D/17/0539. (For National Authority Use Only)
") 2.0 Synopsis AbbVie Inc. Name of Study Drug: ABT-450, ritonavir, ABT-267, ribavirin, pegylated interferon Name of Active Ingredient: ABT-450, Ritonavir, ABT-267, Ribavirin, Pegylated interferon Individual
2.0 Synopsis AbbVie Inc. Name of Study Drug: ABT-450, ritonavir, ABT-267, ribavirin, pegylated interferon Name of Active Ingredient: ABT-450, Ritonavir, ABT-267, Ribavirin, Pegylated interferon Individual
Safety of Treatment in Cirrhotics in the Era of New Antiviral Therapies for Hepatitis C Virus
 Safety of Treatment in Cirrhotics in the Era of New Antiviral Therapies for Hepatitis C Virus JEFFREY NADELSON MD, ALAN EPSTEIN MD, THOMAS SEPE MD BOSTON UNIVERSITY SCHOOL OF MEDICINE ROGER WILLIAMS MEDICAL
Appendix 5 (as supplied by the author): GRADE Evidence to Decision Framework (1)
: GRADE Evidence to Decision Framework (1)") Appendix 5 (as supplied by the author): GRADE Evidence to Decision Framework (1) Question Should the general Canadian population be screened for Hepatitis C? POPULATION: General Canadian population (asymptomatic,
Appendix 5 (as supplied by the author): GRADE Evidence to Decision Framework (1) Question Should the general Canadian population be screened for Hepatitis C? POPULATION: General Canadian population (asymptomatic,
ARE STROKE UNITS COST EFFECTIVE? EVIDENCE FROM A NEW ZEALAND STROKE INCIDENCE AND POPULATION-BASED STUDY
 ARE STROKE UNITS COST EFFECTIVE? EVIDENCE FROM A NEW ZEALAND STROKE INCIDENCE AND POPULATION-BASED STUDY Braden Te Ao, Ph.D. Centre for Health Services Research & Policy, University of Auckland, National
ECONOMIC ANALYSIS TO SUPPORT NHS IMPLEMENTATION OF HEPATITIS C DRUGS: SCOPING STUDY
 Policy Research Unit in Economic Evaluation of Health & Care Interventions (EEPRU) ECONOMIC ANALYSIS TO SUPPORT NHS IMPLEMENTATION OF HEPATITIS C DRUGS: SCOPING STUDY May 2015 Report 046 Authors: Rita
Advances in Hepatitis C Virus Therapeutics HBV HIV HCV. Advances in HCV Therapeutics. Greg Dore. Viral Hepatitis Clinical Research Program
 Advances in Hepatitis C Virus Therapeutics Greg Dore Viral Hepatitis Clinical Research Program National Centre in HIV Epidemiology and Clinical Research Hepatitis C notifications: 199-23 Estimates of BBV
Economic and societal impact of direct-acting antiviral therapy in Hepatitis C Zoltán Kaló
 Economic and societal impact of directacting antiviral therapy in Hepatitis C Zoltán Kaló Professor of Health Economics ISPOR 19th Annual European Congress November 2 nd 2016 ATHCV16099925102016 Concerns
entecavir, 0.5mg and 1mg film-coated tablets and 0.05 mg/ml oral solution, Baraclude SMC No. (747/11) Bristol-Myers Squibb Pharmaceuticals Ltd
 Bristol-Myers Squibb Pharmaceuticals Ltd") entecavir, 0.5mg and 1mg film-coated tablets and 0.05 mg/ml oral solution, Baraclude SMC No. (747/11) Bristol-Myers Squibb Pharmaceuticals Ltd 09 December 2011 The Scottish Medicines Consortium (SMC) has
entecavir, 0.5mg and 1mg film-coated tablets and 0.05 mg/ml oral solution, Baraclude SMC No. (747/11) Bristol-Myers Squibb Pharmaceuticals Ltd 09 December 2011 The Scottish Medicines Consortium (SMC) has
REQUEST FOR INFORMATION - HEPATITIS C TREATMENTS
 10 August 2015 REQUEST FOR INFORMATION - HEPATITIS C TREATMENTS PHARMAC is seeking information from suppliers of novel direct-acting antiviral agents (DAAs) for the treatment of hepatitis C. This Request
HIV in Australia Annual surveillance short report 2018
 HIV in Australia Annual surveillance short report 218 The Kirby Institute for infection and immunity in society 218 ISSN 226-163 (Online) This publication and associated data are available at internet
Economic Analysis of Interventions for Smoking Cessation Aimed at Pregnant Women
 Y O R K Health Economics C O N S O R T I U M NATIONAL INSTITUTE FOR HEALTH AND CLINICAL EXCELLENCE Economic Analysis of Interventions for Smoking Cessation Aimed at Pregnant Women Supplementary Report
Identification of patients with chronic hepatitis B/C the UK
 Identification of patients with chronic hepatitis B/C the UK Will Irving Professor of Virology Chair, Department of Health Advisory Group on Hepatitis Deaths from end stage liver disease, or HCC, in those
in chronic hepatitis C in Australia
 Real world efficacy of antiviral therapy in chronic hepatitis C in Australia Issue #2 July 2018 1 Uptake and outcomes of new treatment for chronic hepatitis C during 20-20 in the REACH-C network The REACH-C
Hepatitis C COLVILLE FOCUSED DIAGNOSIS, MANAGEMENT, TREATMENT
 Hepatitis C COLVILLE FOCUSED DIAGNOSIS, MANAGEMENT, TREATMENT Background and affiliations BS (MIT); 3 years in international health (Mexico City and Honduras with Peace Corps); MS (Colorado State University);
Assessment of cost-effectiveness of universal hepatitis B immunization in a low-income country with intermediate endemicity using a Markov model
 Assessment of cost-effectiveness of universal hepatitis B immunization in a low-income country with intermediate endemicity using a Markov model Aggarwal R, Ghoshal U C, Naik S R Record Status This is
Pegylated Interferons and Ribavirins
 Pegylated Interferons and Ribavirins Goal(s): Cover drugs only for those clients where there is evidence of effectiveness and safety Length of Authorization: 16 weeks plus 12-36 additional weeks or 12
Modelling the Impact of Interventions Targeting High- Risk Populations on the HCV Epidemic in Resource- Limited Settings Pakistan as a Case Study
 1 Modelling the Impact of Interventions Targeting High- Risk Populations on the HCV Epidemic in Resource- Limited Settings Pakistan as a Case Study Aaron G. Lim, Matthew Hickman, Peter Vickerman Population
The Cost-Effectiveness of Birth Cohort and Universal Hepatitis C Antibody Screening in U.S. Primary Care Settings
 September 2011 The Cost-Effectiveness of Birth Cohort and Universal Hepatitis C Antibody Screening in U.S. Primary Care Settings Technical Report Prepared by David B. Rein John S. Wittenborn RTI International
PUBLISHED VERSION. Chrisopoulos S, Harford JE & Ellershaw A Oral health and dental care in Australia: key facts and figures 2015
 PUBLISHED VERSION Chrisopoulos S, Harford JE & Ellershaw A Oral health and dental care in Australia: key facts and figures 2015 Australian Institute of Health and Welfare and the University of Adelaide
TRANSPARENCY COMMITTEE
 The legally binding text is the original French version TRANSPARENCY COMMITTEE OPINION 10 December 2008 REBETOL 200 mg capsules Pack of 84 (CIP code: 351 971.9) Pack of 112 (CIP code: 373 277.8) Pack of
Definition: Active injection drug users - Those who have injected any drug(s) within the 12 month reporting period
 within the 12 month reporting period") Quality ID #387 (NQF 3060): Annual Hepatitis C Virus (HCV) Screening for Patients who are Active Injection Drug Users National Quality Strategy Domain: Effective Clinical Care 2018 OPTIONS FOR INDIVIDUAL
Quality ID #387 (NQF 3060): Annual Hepatitis C Virus (HCV) Screening for Patients who are Active Injection Drug Users National Quality Strategy Domain: Effective Clinical Care 2018 OPTIONS FOR INDIVIDUAL
Entecavir for the treatment of chronic hepatitis B infection
 DOI: 10.3310/hta13suppl3/05 Health Technology Assessment 2009; Vol. 13: Suppl. 3 Entecavir for the treatment of chronic hepatitis B infection J Shepherd,* E Gospodarevskaya, G Frampton and K Cooper Southampton
VIRAL HEPATITIS: SITUATION ANALYSIS AND PERSPECTIVES IN THE AFRICAN REGION. Report of the Secretariat. CONTENTS Paragraphs BACKGROUND...
 8 April 2014 REGIONAL COMMITTEE FOR AFRICA ORIGINAL: ENGLISH PROGRAMME SUBCOMMITTEE Sixty-fourth session Brazzaville, Republic of Congo, 9 11 June 2014 Provisional agenda item 6 VIRAL HEPATITIS: SITUATION
Factsheet: New Treatments for hepatitis C Direct Acting Antivirals (DAAs)
") Factsheet: New Treatments for hepatitis C Direct Acting Antivirals (DAAs) For more information about anything in this factsheet, phone the Hepatitis Infoline on 1800 703 003 or go to www.hepvic.org.au
Factsheet: New Treatments for hepatitis C Direct Acting Antivirals (DAAs) For more information about anything in this factsheet, phone the Hepatitis Infoline on 1800 703 003 or go to www.hepvic.org.au
PRESENTATION TO INVESTORS. I attach a PowerPoint presentation as presented by Biotron Limited's CEO, Dr Michelle Miller, to investors today.
 Level 2, 66 Hunter Street Sydney NSW 2000 Tel: (61-2) 9300 3344 Fax: (61-2) 9221 6333 E-mail: pnightingale@biotron.com.au Website: www.biotron.com.au 11 November 2010 The Manager Companies ASX Limited
Why make this statement?
 HCV Council 2014 10 clinical practice statements were evaluated by the Council A review of the available literature was conducted The level of support and level of evidence for the statements were discussed
Hepatitis C SYMPTOMS COMPLICATIONS
 Hepatitis C Hepatitis simply means "inflammation of the liver". Hepatitis C is a virus that was isolated in 1989. Since then, a tremendous amount has been learned about the virus. SYMPTOMS Hepatitis C
ANTIVIRAL THERAPY FOR HCV. Alfredo Alberti
 CLINICAL IMPACT OF SVR AFTER ANTIVIRAL THERAPY FOR HCV Alfredo Alberti Department of Histology,Microbiology and Medical Biotechnologies Molecular Hepatology Unit Venetian Institute of Molecular Medicine
VIRAL HEPATITIS: SITUATION ANALYSIS AND PERSPECTIVES IN THE AFRICAN REGION. Report of the Secretariat. CONTENTS Paragraphs BACKGROUND...
 5 November 2014 REGIONAL COMMITTEE FOR AFRICA ORIGINAL: ENGLISH Sixty-fourth session Cotonou, Republic of Benin, 3 7 November 2014 Provisional agenda item 11 VIRAL HEPATITIS: SITUATION ANALYSIS AND PERSPECTIVES
Topic: Sovaldi, sofosbuvir Date of Origin: March 14, Committee Approval Date: August 15, 2014 Next Review Date: March 2015
 Medication Policy Manual Policy No: dru332 Topic: Sovaldi, sofosbuvir Date of Origin: March 14, 2014 Committee Approval Date: August 15, 2014 Next Review Date: March 2015 Effective Date: October 1, 2014
The Changing World of Hepatitis C
 The Changing World of Hepatitis C Alnoor Ramji Gastroenterology & Hepatology Clinical Associate Professor Division of Gastroenterology University Of British Columbia St. Paul s Hospital Site Disclosures
Crucial factors that influence cost-effectiveness of universal hepatitis B immunization in India Prakash C
 Crucial factors that influence cost-effectiveness of universal hepatitis B immunization in India Prakash C Record Status This is a critical abstract of an economic evaluation that meets the criteria for
Hepatitis C. Core slides
 Hepatitis C Core slides This material was prepared by the Viral Hepatitis Prevention Board The slides (or subsets) can be reproduced for educational use only, with reference to the original source and
Annual Surveillance Report 2014 Supplement
 HIV in Australia Annual Surveillance Report 2014 Supplement Main findings A total of 1 236 cases of HIV infection were newly diagnosed in Australia in 2013, similar to levels in 2012 when the number of
Assessment of the allocation of HIV funding in Indonesia
 Assessment of the allocation of HIV funding in Indonesia Richard T. Gray 1, Josephine Reyes 1, Mardiati Nadjib 2, Pandu Harimurti 3, David P. Wilson 1 October 2012 1 The Kirby Institute, University of
HEPATITIS C TREATMENT GUIDANCE
 HEPATITIS C TREATMENT GUIDANCE These guidelines have been produced based on the NICE Guidance TA200 Peginterferon alfa and ribavirin for the treatment of chronic hepatitis c and the summaries of product
Supplementary Material*
 Supplementary Material* Najafzadeh M, Andersson K, Shrank WH, Krumme AA, Matlin OS, Brennan T, et al. Cost- Effectiveness of Novel Regimens for the Treatment of Hepatitis C Virus. Ann Intern Med. doi:10.7326/m14-1152
Technology appraisal guidance Published: 25 November 2015 nice.org.uk/guidance/ta364
 Daclatasvir for treating chronic hepatitis C Technology appraisal guidance Published: 25 November 2015 nice.org.uk/guidance/ta364 NICE 2018. All rights reserved. Subject to Notice of rights (https://www.nice.org.uk/terms-and-conditions#notice-ofrights).
Technology appraisal guidance Published: 28 January 2004 nice.org.uk/guidance/ta75
 Interferon alfa (pegylated and non- pegylated) and ribavirin for the treatment of chronic hepatitis C Technology appraisal guidance Published: 28 January 2004 nice.org.uk/guidance/ta75 NICE 2017. All rights
EXAMINING THE 3 Cs OF HEPATITIS C: CARE, CURE, CO$T
 EXAMINING THE 3 Cs OF HEPATITIS C: CARE, CURE, CO$T Update presented by Lisa Townshend-Bulson, MSN, FNP-C Followed by Round Table Discussion: ANTHC Liver Disease & Hepatitis Program Staff and Audience
How France is eliminating HCV and the role of screening strategies
 HCV Elimination Mini Policy Summit «Eliminating HCV in Romania» European Parliament, 27 September 2017 How France is eliminating HCV and the role of screening strategies Sylvie Deuffic-Burban, Inserm,
HEPATITIS C TREATMENT UPDATE
 HEPATITIS C TREATMENT UPDATE Hepatitis C: Burden of Disease in USA HCV is generally asymptomatic until advanced liver disease 4.1 million persons ever infected; 3.2 million chronic infections Up to 75%
Appendix This appendix was part of the submitted manuscript and has been peer reviewed. It is posted as supplied by the authors.
 Appendix This appendix was part of the submitted manuscript and has been peer reviewed. It is posted as supplied by the authors. Appendix to: Thompson AJV; Expert panel representing the Gastroenterological
The cost-effectiveness of raising the legal smoking age in California Ahmad S
 The cost-effectiveness of raising the legal smoking age in California Ahmad S Record Status This is a critical abstract of an economic evaluation that meets the criteria for inclusion on NHS EED. Each