Emergency Department Visits for Behavioral Health Conditions in Harris County, Texas,
|
|
|
- Monica Howard
- 5 years ago
- Views:
Transcription
1 Emergency Department Visits for Behavioral Health Conditions in Harris County, Texas, Prepared by School of Public Health UT Health Patrick Courtney, MA August
2 Table of Contents Executive Summary.3 Introduction and Methods.12 Results 14 Behavioral health related ED visits in general...14 Specific types of BHED visits...14 Demographics 14 BHED visits by month, day, hour, length of stay, and transport status 42 Top diagnoses for BHED visits.51 Geographic distribution of BHED visits in 2008 by ZIP code.57 2
3 Executive Summary Introduction In September 2008 a report was published on behavioral health related emergency department (BHED) visits by Harris County residents. That report examined visits to 16 hospitals over the period , along with visits to the Neuropsychiatric Center (NPC). The present report examines BHED visits to 25 hospitals in each of the years 2007 and Selection of hospitals Methods The earlier study used data from the same 16 hospitals over a three year period. This was to examine any trends that may have taken place. However, not every hospital in the study was able to supply all relevant discharge diagnoses. In addition, not every hospital supplied data on discharge status. The present report used data from 25 hospitals for the years 2007 and This is because a) every participating hospital supplied all discharge diagnoses that were available, b) every participating hospital supplied all visits, both admitted and discharged, and c) the 2008 data set also included data on transport status (e.g. ambulance vs. self). Data for both 2007 and 2008 years came from the same 25 hospitals. Because of the detailed nature of some of the analyses presented here, visits from the NPC were not included, nor was population rate setting done. Classification of types of BHED visits While the first two tables examine BHED visits from a general perspective, most of the report examines BHED visits according to the following mutually exclusive categories: A. Simple BHED: Visits with a behavioral health diagnosis as the primary diagnosis (ICD1), but no other behavioral health diagnosis (ICD 2 through 10). Such visits may or may not have a medical diagnosis on ICD 2 through 10. B. Complex BHED: Visits with a behavioral health diagnosis as the primary diagnosis (ICD1), and also at least one other behavioral health diagnosis (ICD2 through 10). 3
4 Such visits may or may not also have a medical diagnosis somewhere else on ICD2 through 10. C. Medical BHED: Visits with a medical diagnosis as the primary diagnosis (ICD1), and at least one behavioral health diagnosis (ICD 2 through 10). Such visits may or may not also have another medical diagnosis somewhere else on ICD 2 through 10. D. No BHED: Visits with no behavioral health diagnosis on ICD 1 through 10. Many of the tables in the BHED report correspond roughly to a combination of the first three categories. However, the demographics (e.g. payer source, gender) of that report only correspond to the first two categories. The third category was not covered in the BHED report. The fourth category is only covered in Table 3 for this report and not thereafter. To an extent, the concepts of co morbidity or co occurring disorders are akin to the second and third categories. However, visits in the first category, as noted, may or may not have a medical diagnosis as well (although not examined as such here). Certain detailed analyses of secondary BHED visits (e.g. ICD2 vs. ICD5) are beyond the scope of this report. understanding. A summary of the first three definitions is repeated throughout the report for ease of Points of comparison In order to make it easier to compare/contrast the findings of this report, the following documents will be referenced as needed throughout the report: BHED: The earlier BHED report Harris: An analysis of primary care related ED (PCRED) visits to Harris County hospitals national: A report from the Agency for Healthcare Research and Quality on BHED visits among adults in Begley C, Burau K, Courtney P, Hickey S, Rowan P. Emergency department visits for behavioral health conditions in Harris County, Texas, A report for the Houston-Galveston Area EMS/Trauma Policy Council and the Harris County Healthcare Alliance. September Available at 2 Begley C, Courtney P, Burau K. Houston hospitals emergency department use study: January 1, 2008 through December 31, April Available at 3 Owens PL, Mutter R, Stocks C. Mental health and substance abuse-related emergency department visits among adults, HCUP Statistical Brief #92. July Agency for Healthcare Research and Quality, Rockville, MD. Available at 4
5 Results Behavioral health related ED visits in general When all age groups were examined, nearly the same percentage of ED visits in Harris County had a behavioral diagnosis as the primary diagnosis in 2007 as in 2008 (2.4% in 2007 and 2.0% in 2008, Table 1). However, the percentage of visits that had a BHED diagnosis on one of the remaining diagnoses dropped from 9.8% in 2007 to 7.3% in When examined in terms of whether the visit had any BHED diagnosis, 11.2% of visits in 2007 had a BHED diagnosis, compared with 8.3% in 2008 (Table 1). When BHED visits were examined with regards to the percentage of visits that had a behavioral diagnosis as the first diagnosis, 21.5% of BHED visits in Harris County in 2007 had a BHED component on the first diagnosis, and 24.6% in 2008 had it on the first diagnosis. In other words, the majority of BHED visits in Harris County in 2007 and 2008 did not have a behavioral diagnosis as the first diagnosis. Table 2 repeats Table 1, but is restricted only to adults. This was to replicate one statistic from the 2007 national report. Other than Table 2, this entire report uses all ages. Specific types of BHED visits The percentage of ED visits in Harris County with no behavioral diagnosis at all increased from 88.8% in 2007 to 91.7% in 2008 (Table 3). The percentage of simple BHED visits was 1.4% of total ED visits in 2007 and 1.0% in The percentage of complex BHED visits was 1.0% of total ED visits in 2007 and 1.0% in The percentage of medical BHED visits was 8.8% of total ED visits in 2007 and 6.3% in The majority of BHED visits in Harris County were for visits whose primary purpose is medical, but who also have a behavioral component. Demographics Payer source More than four in ten simple BHED visits (44.3%) and complex BHED visits (42.3%) in 2007 were by persons who were uninsured. However, in 2008 the uninsured represented 32.3% of simple BHED visits and 39.0% of complex BHED visits (Table 4, Figures 5
6 1-4). The most predominant category for persons enrolled in Medicaid was complex BHED visits (19.5% of complex BHED in 2007 and 19.3% of complex BHED in 2008). By contrast, persons enrolled in Medicare made up 29.1% of medical BHED visits in 2007 and more than one third (36.2%) of medical BHED visits in 2008 (Table 1, Figures 5-6). The predominant payer source (or lack thereof) varied according to specific type of BHED visit. Race/ethnicity More than one third (36.3%) of simple BHED visits in 2007 were by persons who were White, yet they made up nearly half of all complex BHED visits (48.5%) and nearly half of all medical BHED visits (49.6%). In 2008 just over four in ten (40.2%) of simple BHED visits, 43.2% of complex BHED visits, and nearly half (48.1%) of medical BHED visits were by persons who were White. Hispanics made up 27.4% of simple BHED visits in 2007 but only 17.4% of medical BHED visits. In 2008 Hispanics made up 25.6% of simple BHED visits and 19.4% of medical BHED visits. Blacks made up 27.9% of medical BHED visits in both 2007 and 2008 (Table 5, Figures 7-12). Age More than four in ten complex BHED visits were by adults age 26 to 44 (41.7% in 2007 and 40.8% in 2008). In contrast, fewer than three in ten medical BHED visits were by adults age 26 to 44 (29.9% in 2007, 26.2% in 2008). Children made up just over one in ten simple BHED visits (11.1% in 2007 and 11.6% in 2008), but a smaller percentage of complex BHED visits (6.6% in 2007, 6.3% in 2008). More than half of medical BHED visits were by persons age 45 and over (53.8% in 2007 and 56.2% in 2008). (Table 6, Figures 13-18). Gender The majority of simple BHED visits (54.0% in 2007, 54.8% in 2008) and medical BHED visits (54.5% in 2007, 57.7% in 2008) were by persons who were female. However, the majority of complex BHED visits (53.3% in 2007, 53.4% in 2008) were by persons who were male (Table 7, Figures 19-24). Discharge status Fewer than one in five simple BHED visits (18.1% in 2007, 15.0% in 2008) resulted in an admission or a hospitalization. Just over one in five (22.6%) complex BHED visits in 2007 resulted in an admission, but that dropped slightly to 19.4% in The group most likely in both years to result in an admission were those with a medical BHED visit (27.8% 6
7 in 2007 and 25.9% in 2008) (Table 8, Figures 25-30). Interaction of payer source and discharge status Tables 9 and 10 present the three types of BHED visits from the perspective of the interaction of payer source and discharge status. In both years, Medicare enrollees with a medical BHED visit were the ones most likely to have an admission (50.0% of medical BHED visits by Medicare enrollees in 2007, 43.9% in 2008). In both years, Medicaid enrollees were more likely than the uninsured for all three classes of BHED visits to have had an admission. For example, 19.9% of Medicaid enrollees with a complex BHED visit were admitted in 2008, but only 16.3% of the uninsured with a complex BHED visit were admitted. Also in 2008, 23.0% of Medicaid enrollees with a medical BHED visit were admitted, but only 15.5% of the uninsured with a medical BHED visit were admitted. For CHIP, Medicaid, and Medicare enrollees, and for those with commercial insurance, in both years complex BHED visits were more likely than simple BHED visits to result in an admission. BHED visits by month, day, hour, length of stay, and transport status Simple BHED visits were more frequent than complex BHED visits for every month of the year in 2007, but they were closer in frequency in 2008 (Figures 31 & 33). Medical BHED visits peaked in September in 2007 but September in 2008 saw a slight drop (Figures 32 & 34). Hurricane Ike made landfall in September 2008 and led to the temporary closure of some of the EDs in this study. Simple BHED visits were more frequent than complex BHED visits for every day of the week in 2007, but they were closer in frequency in 2008 (Figures 35 & 37). Medical BHED visits peaked on Monday in both 2007 and 2008 (Figures 36 & 38). BHED visits of every kind were at their lowest levels at the hours of 4 6 AM, and they peaked from late morning to early evening (Figures 39-42). Mean length of stay was measured for non hospitalized visits of less than 24 hours each (Table 11). Complex BHED visits consistently had the longest length of stay (6.74 hours in 2007, 6.81 hours in 2008). 7
8 The 2008 ED dataset included a variable on whether the visit included an ambulance transport or a self transport. Type of BHED visit in 2008 by transport is presented in Table 12. More than three in ten (31.9%) simple BHED visits involved an ambulance transport, 36,1% of complex BHED visits involved an ambulance transport, and more than four in ten (42.2%) of medical BHED visits involved an ambulance transport. Top diagnoses for BHED visits Table 13 presents simple and complex BHED visits according to whether their first or primary diagnosis was for mental health, alcohol, or drug related reasons. In both 2007 and 2008, the majority of simple BHED visits had a mental health condition as the primary diagnosis (72.0% in 2007 and 79.0% in 2008). However, those percentages dropped for complex BHED visits (59.5% in 2007, 69.6% in 2008). Alcohol and drug related conditions combined made up 28.0% of simple BHED visits in 2007, but 40.6% of complex BHED visits. In 2008, alcohol and drug related conditions made up 21.0% of simple BHED visits but 30.3% of complex BHED visits. Tables 14, 15, and 17 present the top diagnoses for BHED visits, and Table 16 presents the top primary/medical diagnoses for medical BHED visits. Various forms of anxiety, depression, and alcohol use/abuse were among the top BHED diagnoses (Tables 14, 15, and 17). Cocaine abuse was one of the top primary diagnoses for complex BHED visits (Table 15), as well as one of the top secondary (ICD2) BHED diagnoses for medical BHED visits (Table 17). Chest pain and pneumonia were the top medical diagnoses for medical BHED visits in both 2007 and 2008 (Table 16). While schizophrenia is often considered to be a serious and persistent mental illness, Table 14 indicates that many persons in both 2007 and 2008 were diagnosed with it in an ED setting but with no other BHED problems. Bipolar disorder, unspecified, was one of the top secondary BHED diagnoses for persons who present primarily with a medical disorder (Table 18). 8
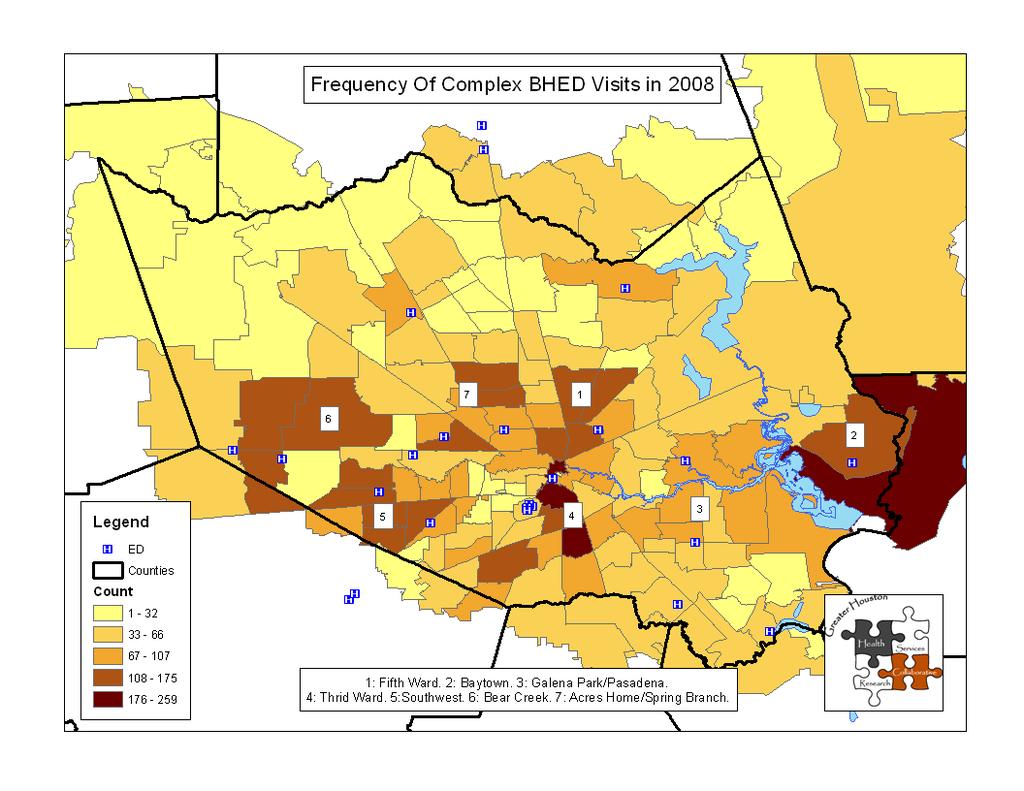
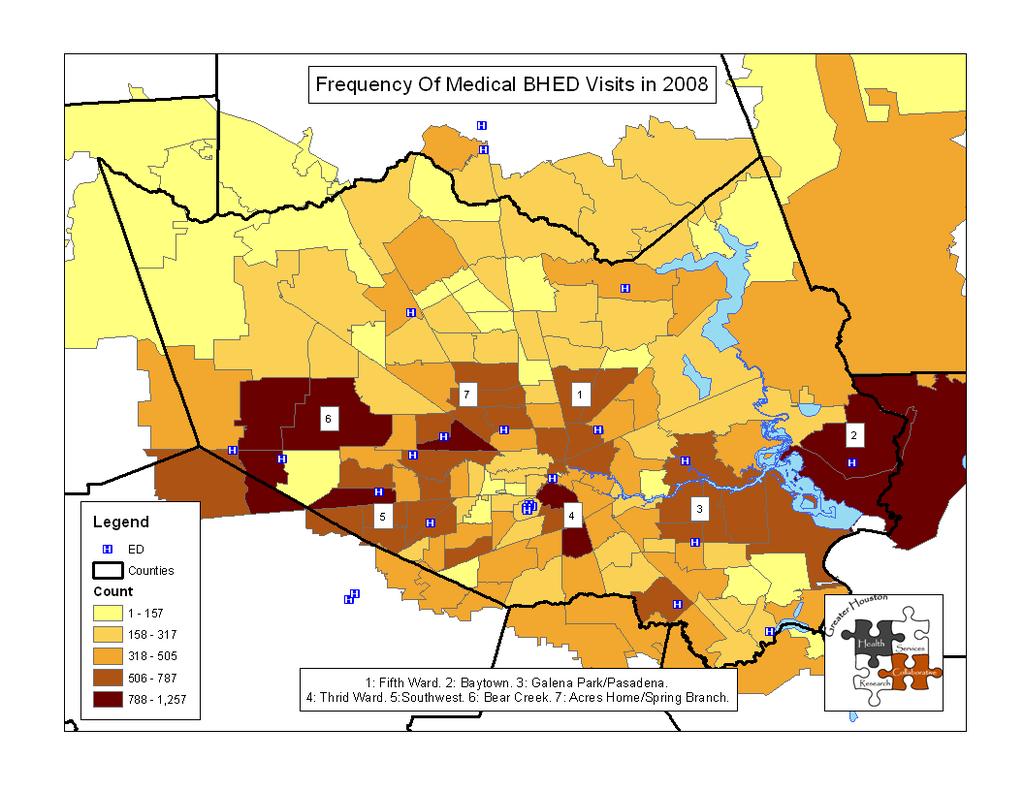
9 Geographic distribution of BHED visits in 2008 by ZIP code The following maps show the three categories of BHED visits by ZIP code of residence. For the sake of simplicity, only visits in 2008 are shown. In contrast to maps in the 2008 Harris report, distributions were broken up according to natural breaks rather than quintiles. Natural breaks more clearly shows the highest concentrations of visits. While some of the largest frequencies of simple and medical BHED visits were on the far western and far eastern edges of Harris County (Maps 1 and 3), some of the highest concentrations of complex BHED visits were in the Third Ward and South Park areas (Map 3). Table 18 gives the frequency counts for the top ZIP codes behind each map. The Baytown area ZIP code of was one of the top ZIP codes for all three types of BHED visits in 2008 Discussion Earlier BHED report vs. current report This report was not intended to be a replication of the earlier report. Nevertheless, some comparisons can be made. Despite some differences (16 hospitals vs. 25 hospitals, primary discharge diagnoses for demographics vs. all discharge diagnoses for demographics), the uninsured continue to represent the plurality of BHED visits (in the present study, simple and complex BHED visits). Persons who are male represent a slight majority of BHED visits (in the present study, complex BHED visits). Adults age 26 to 44 continue to represent a plurality of BHED visits (in the present study, simple and complex BHED visits). However, the present study found a higher percentage of ED visits with a behavioral component than in the earlier study. This is especially noteworthy since the earlier study included visits to the NPC and this study does not. The difference is likely due to three factors: a) an increase in BHED visits over the passage of time, b) the earlier study estimated the number of BHED visits, whereas the present study used actual diagnoses for all ten possible codes, c) the additional hospitals in this study possibly captured a higher percentage of behavioral problems 9
10 than in the 16 hospitals from the earlier study. Types of BHED visits Simple and complex BHED visits In some respects, simple and complex BHED visits are very similar. Both involved emergency room visits whose primary purpose is for a mental health, alcohol, or drug problem. Also, in this study both are predominantly uninsured. People in both groups are likely best served by the public and/or private mental health and substance abuse outpatient systems. The high percentage of people who go to the emergency department with a BHED visit may reflect their inability to access care on an outpatient basis. However, in many other respects, persons with simple and complex BHED visits represent different groups. The two differ in terms of gender, age, length of stay, discharge status, use of an ambulance, and having an alcohol or drug concern as the primary diagnosis. In much the same way that some medical problems are simple and some are complex, persons with complex BHED visits likely need a more intensive array of services than those with a simple BHED visit. Medical BHED visits In both 2007 and 2008, the majority of ED visits that had a behavioral component came in primarily for a medical reason, and secondarily for a behavioral reason. The public and private mental health systems do not address medical problems. However, untreated behavioral problems can often exacerbate medical problems. For example, a person with untreated depression may not feel motivated to take medication for hypertension or asthma, and a depressed diabetic may not be eating properly. The findings here indicate the need to emphasize behavioral health care as a factor or co partner in medical care. It is not clear from this report if persons with a medical BHED visit were receiving behavioral health services or not. Aged and disabled persons deserve special focus. As mentioned earlier, in 2008 more than one third of all medical BHED visits were by Medicare enrollees. In both 2007 and 2008 more than half of all medical BHED visits were by persons age 45 and over. Medical BHED visits by persons age 65 and over were three times as likely as 2008 PCRED visits by persons age 65 and over. A further exploration of this population is warranted both of this research data 10
11 but also of the medical and behavioral needs of the elderly and disabled. Limitation Payer source is only being used as a demographic variable in this report. No statements are being made about public and private insurance coverage for mental health, alcohol, or drug related concerns. 11
12 Introduction In September 2008 a report was published on behavioral health related emergency department (BHED) visits by Harris County residents. That report examined visits to 16 hospitals over the period , along with visits to the Neuropsychiatric Center (NPC). The present report examines BHED visits to 25 hospitals in each of the years 2007 and Selection of hospitals Methods The earlier study used data from the same 16 hospitals over a three year period. This was to examine any trends that may have taken place. However, not every hospital in the study was able to supply all relevant discharge diagnoses. In addition, not every hospital supplied data on discharge status. The present report used data from 25 hospitals for the years 2007 and This is because a) every participating hospital supplied all discharge diagnoses that were available, b) every participating hospital supplied all visits, both admitted and discharged, and c) the 2008 data set also included data on transport status (e.g. ambulance vs. self). Data for both 2007 and 2008 years came from the same 25 hospitals. Because of the detailed nature of some of the analyses presented here, visits from the NPC were not included, nor was population rate setting done. Classification of types of BHED visits While the first two tables examine BHED visits from a general perspective, most of the report examines BHED visits according to the following mutually exclusive categories: A. Simple BHED: Visits with a behavioral health diagnosis as the primary diagnosis (ICD1), but no other behavioral health diagnosis (ICD 2 through 10). Such visits may or may not have a medical diagnosis on ICD 2 through 10. B. Complex BHED: Visits with a behavioral health diagnosis as the primary diagnosis (ICD1), and also at least one other behavioral health diagnosis (ICD2 through 10). Such visits may or may not also have a medical diagnosis somewhere else on ICD2 through
13 C. Medical BHED: Visits with a medical diagnosis as the primary diagnosis (ICD1), and at least one behavioral health diagnosis (ICD 2 through 10). Such visits may or may not also have another medical diagnosis somewhere else on ICD 2 through 10. D. No BHED: Visits with no behavioral health diagnosis on ICD 1 through 10. Many of the tables in the BHED report correspond roughly to a combination of the first three categories. However, the demographics (e.g. payer source, gender) of that report only correspond to the first two categories. The third category was not covered in the BHED report. The fourth category is only covered in Table 3 for this report and not thereafter. To an extent, the concepts of co morbidity or co occurring disorders are akin to the second and third categories. However, visits in the first category, as noted, may or may not have a medical diagnosis as well (although not examined as such here). Certain detailed analyses of secondary BHED visits (e.g. ICD2 vs. ICD5) are beyond the scope of this report. understanding. A summary of the first three definitions is repeated throughout the report for ease of Points of comparison In order to make it easier to compare/contrast the findings of this report, the following documents will be referenced as needed throughout the report: BHED: The earlier BHED report Harris: An analysis of primary care related ED (PCRED) visits to Harris County hospitals national: A report from the Agency for Healthcare Research and Quality on BHED visits among adults in Begley C, Burau K, Courtney P, Hickey S, Rowan P. Emergency department visits for behavioral health conditions in Harris County, Texas, A report for the Houston-Galveston Area EMS/Trauma Policy Council and the Harris County Healthcare Alliance. September Available at 2 Begley C, Courtney P, Burau K. Houston hospitals emergency department use study: January 1, 2008 through December 31, April Available at 3 Owens PL, Mutter R, Stocks C. Mental health and substance abuse-related emergency department visits among adults, HCUP Statistical Brief #92. July Agency for Healthcare Research and Quality, Rockville, MD. Available at 13
14 Results Behavioral health related ED visits in general When all age groups were examined, nearly the same percentage of ED visits in Harris County had a behavioral diagnosis as the primary diagnosis in 2007 as in 2008 (2.4% in 2007 and 2.0% in 2008, Table 1). However, the percentage of visits that had a BHED diagnosis on one of the remaining diagnoses dropped from 9.8% in 2007 to 7.3% in When examined in terms of whether the visit had any BHED diagnosis, 11.2% of visits in 2007 had a BHED diagnosis, compared with 8.3% in 2008 (Table 1). When BHED visits were examined with regards to the percentage of visits that had a behavioral diagnosis as the first diagnosis, 21.5% of BHED visits in Harris County in 2007 had a BHED component on the first diagnosis, and 24.6% in 2008 had it on the first diagnosis. In other words, the majority of BHED visits in Harris County in 2007 and 2008 did not have a behavioral diagnosis as the first diagnosis. Table 2 repeats Table 1, but is restricted only to adults. This was to replicate one statistic from the 2007 national report. Other than Table 2, this entire report uses all ages. Specific types of BHED visits The percentage of ED visits in Harris County with no behavioral diagnosis at all increased from 88.8% in 2007 to 91.7% in 2008 (Table 3). The percentage of simple BHED visits was 1.4% of total ED visits in 2007 and 1.0% in The percentage of complex BHED visits was 1.0% of total ED visits in 2007 and 1.0% in The percentage of medical BHED visits was 8.8% of total ED visits in 2007 and 6.3% in The majority of BHED visits in Harris County were for visits whose primary purpose is medical, but who also have a behavioral component. Demographics Payer source More than four in ten simple BHED visits (44.3%) and complex BHED visits (42.3%) in 2007 were by persons who were uninsured. However, in 2008 the uninsured represented 32.3% of simple BHED visits and 39.0% of complex BHED visits (Table 4, Figures 14
15 1-4). The most predominant category for persons enrolled in Medicaid was complex BHED visits (19.5% of complex BHED in 2007 and 19.3% of complex BHED in 2008). By contrast, persons enrolled in Medicare made up 29.1% of medical BHED visits in 2007 and more than one third (36.2%) of medical BHED visits in 2008 (Table 1, Figures 5-6). The predominant payer source (or lack thereof) varied according to specific type of BHED visit. Race/ethnicity More than one third (36.3%) of simple BHED visits in 2007 were by persons who were White, yet they made up nearly half of all complex BHED visits (48.5%) and nearly half of all medical BHED visits (49.6%). In 2008 just over four in ten (40.2%) of simple BHED visits, 43.2% of complex BHED visits, and nearly half (48.1%) of medical BHED visits were by persons who were White. Hispanics made up 27.4% of simple BHED visits in 2007 but only 17.4% of medical BHED visits. In 2008 Hispanics made up 25.6% of simple BHED visits and 19.4% of medical BHED visits. Blacks made up 27.9% of medical BHED visits in both 2007 and 2008 (Table 5, Figures 7-12). Age More than four in ten complex BHED visits were by adults age 26 to 44 (41.7% in 2007 and 40.8% in 2008). In contrast, fewer than three in ten medical BHED visits were by adults age 26 to 44 (29.9% in 2007, 26.2% in 2008). Children made up just over one in ten simple BHED visits (11.1% in 2007 and 11.6% in 2008), but a smaller percentage of complex BHED visits (6.6% in 2007, 6.3% in 2008). More than half of medical BHED visits were by persons age 45 and over (53.8% in 2007 and 56.2% in 2008). (Table 6, Figures 13-18). Gender The majority of simple BHED visits (54.0% in 2007, 54.8% in 2008) and medical BHED visits (54.5% in 2007, 57.7% in 2008) were by persons who were female. However, the majority of complex BHED visits (53.3% in 2007, 53.4% in 2008) were by persons who were male (Table 7, Figures 19-24). Discharge status Fewer than one in five simple BHED visits (18.1% in 2007, 15.0% in 2008) resulted in an admission or a hospitalization. Just over one in five (22.6%) complex BHED visits in 2007 resulted in an admission, but that dropped slightly to 19.4% in The group most likely in both years to result in an admission were those with a medical BHED visit (27.8% 15
16 in 2007 and 25.9% in 2008) (Table 8, Figures 25-30). Interaction of payer source and discharge status Tables 9 and 10 present the three types of BHED visits from the perspective of the interaction of payer source and discharge status. In both years, Medicare enrollees with a medical BHED visit were the ones most likely to have an admission (50.0% of medical BHED visits by Medicare enrollees in 2007, 43.9% in 2008). In both years, Medicaid enrollees were more likely than the uninsured for all three classes of BHED visits to have had an admission. For example, 19.9% of Medicaid enrollees with a complex BHED visit were admitted in 2008, but only 16.3% of the uninsured with a complex BHED visit were admitted. Also in 2008, 23.0% of Medicaid enrollees with a medical BHED visit were admitted, but only 15.5% of the uninsured with a medical BHED visit were admitted. For CHIP, Medicaid, and Medicare enrollees, and for those with commercial insurance, in both years complex BHED visits were more likely than simple BHED visits to result in an admission. 16
17 Table 1. Behavioral health related ED visits in general all ages A B C All ages Frequency Percentage Total ED visits, all areas 1,060,825 1,060, % 100.0% Total BHED, all areas, ICD1 25,799 21, % 2.1% Total BHED, all areas, ICD ,041 78, % 7.4% Total ED visits, eight county area 1,013,905 1,013, % 100.0% Total BHED, eight county area, ICD1 23,864 20, % 2.0% Total BHED, eight county area, ICD ,250 73, % 7.3% Total ED visits, Harris County 901, , % 100.0% Total BHED, Harris County, ICD1 21,587 18, % 2.0% Total BHED, Harris County, ICD ,252 65, % 7.3% Total ED visits, all areas 1,060,825 1,060, % 100.0% Total BHED, all areas, any diagnosis 118,840 89, % 8.4% Total ED visits, eight county area 1,013,905 1,013, % 100.0% Total BHED, eight county area, any diagnosis 111,951 83, % 8.3% Total ED visits, Harris County 901, , % 100.0% Total BHED, Harris County, any diagnosis 100,626 74, % 8.3% Percentage of BHED that were ICD1, all areas 21.7% 24.6% Percentage of BHED that were ICD1, eight county area 21.3% 24.3% Percentage of BHED that were ICD1, Harris County 21.5% 24.6% B BHED: An average of 6.8% of all ED visits in Harris County were for BHED visits. That report also included visits to the Neuropsychiatric Center, the present report does not Harris: 41.1% of total ED visits in Harris County in 2007 were PCRED, compared with 39.1% in C 2007 national: see next page for precise comparison. 17
18 Table 2. Behavioral health related ED visits in general adults age 18 and over A B C Adults age 18 and over Frequency Percentage Total ED visits, all areas 745, , % 100.0% Total BHED, all areas, ICD1 23,436 19, % 2.6% Total BHED, all areas, ICD ,640 72, % 9.5% Total ED visits, eight county area 707, , % 100.0% Total BHED, eight county area, ICD1 21,581 18, % 2.6% Total BHED, eight county area, ICD ,059 67, % 9.5% Total ED visits, Harris County 629, , % 100.0% Total BHED, Harris County, ICD1 19,601 16, % 2.6% Total BHED, Harris County, ICD ,710 60, % 9.5% Total ED visits, all areas 745, , % 100.0% Total BHED, all areas, any diagnosis 111,713 81, % 10.8% Total ED visits, eight county area 707, , % 100.0% Total BHED, eight county area, any diagnosis 105,192 76, % 10.7% Total ED visits, Harris County 629, , % 100.0% Total BHED, Harris County, any diagnosis 94,710 68, % 10.8% Percentage of BHED that were ICD1, all areas 21.0% 24.4% Percentage of BHED that were ICD1, eight county area 20.5% 24.1% Percentage of BHED that were ICD1, Harris County 20.7% 24.4% B BHED: See previous page for precise comparison Harris: See previous page for precise comparison. C 2007 national: 34.6% of all adult BHED visits had a BHED visit as the primary discharge diagnosis 18
19 Table 3. Specific types of behavioral health related ED visits all ages All areas Frequency Percent Frequency Percent A Simple BHED 14, % 10, % B Complex BHED 11, % 10, % C Medical BHED 93, % 67, % D No BHED 941, % 971, % Total 1,060, % 1,060, % Eight county area Frequency Percent Frequency Percent A Simple BHED 13, % 10, % B Complex BHED 10, % 10, % C Medical BHED 88, % 63, % D No BHED 901, % 929, % Total 1,013, % 1,013, % Harris County Frequency Percent Frequency Percent A Simple BHED 12, % 9, % B Complex BHED 9, % 9, % C Medical BHED 79, % 56, % D No BHED 801, % 825, % Total 901, % 899, % 2008 Harris: In the Harris County section above, simple BHED corresponds to primary diagnosis on page 55 of 2008 Harris, complex BHED corresponds to primary and any other diagnosis, and medical BHED corresponds to any other diagnosis. 19
20 Table 4. Specific BHED visits by payer source Frequencies Commercial CHIP Medicaid Medicare 2007 Oth. Gov. Oth. Priv. Uninsured Unknown Total A Simple BHED 2, ,932 1, , ,374 B Complex BHED 1, ,792 1, , ,213 C Medical BHED 19, ,703 23,021 1, , ,039 Commercial CHIP Medicaid Medicare 2008 Oth. Gov. Oth. Priv. Uninsured Unknown Total A Simple BHED 2, ,451 1, , ,021 B Complex BHED 1, ,806 1, , ,364 C Medical BHED 11, ,127 20, , ,287 Percentages Commercial CHIP Medicaid Medicare 2007 Oth. Gov. Oth. Priv. Uninsured Unknown Total A Simple BHED 22.4% 1.0% 15.6% 13.6% 1.8% 0.4% 44.3% 0.8% 100.0% B Complex BHED 21.0% 0.8% 19.5% 14.8% 1.1% 0.2% 42.3% 0.4% 100.0% C Medical BHED 24.2% 0.7% 14.8% 29.1% 1.6% 0.5% 28.7% 0.4% 100.0% 2008 Commercial CHIP Medicaid Medicare Oth. Gov. Oth. Priv. Uninsured Unknown Total A Simple BHED 28.1% 1.6% 16.1% 17.9% 2.7% 1.0% 32.3% 0.2% 100.0% B Complex BHED 19.4% 0.8% 19.3% 18.8% 0.8% 0.5% 39.0% 1.4% 100.0% C Medical BHED 21.0% 1.0% 16.2% 36.2% 1.3% 0.5% 22.9% 0.8% 100.0% Simple BHED: Visits with a behavioral health diagnosis as the primary diagnosis, but no other behavioral health diagnosis. Complex BHED: Visits with a behavioral health diagnosis as the primary diagnosis, and also at least one other behavioral health diagnosis. Medical BHED: Visits with a medical diagnosis as the primary diagnosis, and at least one behavioral health diagnosis BHED: 48.1% of hospital BHED visits were by the uninsured, 18.1% by commercially insured, 18.0% by Medicaid enrollees and 12.6% by Medicare enrollees Harris: 31.8% of PCRED visits were by the uninsured, 24.2% were by Medicaid enrollees, 11.0% were by Medicare enrollees, and 26.0% were by the commercially insured national: 20.1% of adult BHED visits nationwide were by the uninsured, 25.7% by the privately insured, 19.8% by Medicaid enrollees, and 30.1% by Medicare enrollees. 20
21 Figure Simple BHED by payer source Unknown, 0.8% Commercial, 22.4% Uninsured, 44.3% Medicaid, 15.6% CHIP, 1.0% Oth. Priv., 0.4% Oth. Gov., 1.8% Medicare, 13.6% Figure Simple BHED by payer source Unknown, 0.2% Uninsured, 32.3% Commercial, 28.1% Oth. Priv., 1.0% Oth. Gov., 2.7% Medicare, 17.9% Medicaid, 16.1% CHIP, 1.6% 21
22 Figure Complex BHED by payer source Unknown, 0.4% Uninsured, 42.3% Commercial, 21.0% Medicaid, 19.5% CHIP, 0.8% Oth. Priv., 0.2% Oth. Gov., 1.1% Medicare, 14.8% Figure Complex BHED by payer source Unknown, 1.4% Uninsured, 39.0% Commercial, 19.4% Medicaid, 19.3% CHIP, 0.8% Oth. Priv., 0.5% Oth. Gov., 0.8% Medicare, 18.8% 22
23 Figure Medical BHED by payer source Unknown, 0.4% Uninsured, 28.7% Commercial, 24.2% CHIP, 0.7% Oth. Priv., 0.5% Oth. Gov., 1.6% Medicare, 29.1% Medicaid, 14.8% Figure Medical BHED by payer source Unknown, 0.8% Oth. Priv., 0.5% Uninsured, 22.9% Commercial, 21.0% CHIP, 1.0% Oth. Gov., 1.3% Medicaid, 16.2% Medicare, 36.2% 23
24 Table 5. Specific BHED visits by race Frequencies 2007 Asian Black Hispanic Am. Ind. Other Unknown White Total A Simple BHED 127 3,726 3, ,487 12,374 B Complex BHED 69 2,474 1, ,467 9,213 C Medical BHED ,034 13, ,733 1,589 39,191 79, Asian Black Hispanic Am. Ind. Other Unknown White Total A Simple BHED 158 2,329 2, ,626 9,021 B Complex BHED 117 2,910 1, ,046 9,364 C Medical BHED ,695 10, , ,067 56,287 Percentages 2007 Asian Black Hispanic Am. Ind. Other Unknown White Total A Simple BHED 1.0% 30.1% 27.4% 0.1% 2.8% 2.3% 36.3% 100.0% B Complex BHED 0.7% 26.9% 19.3% 0.0% 2.8% 1.8% 48.5% 100.0% C Medical BHED 0.9% 27.9% 17.4% 0.0% 2.2% 2.0% 49.6% 100.0% 2008 Asian Black Hispanic Am. Ind. Other Unknown White Total A Simple BHED 1.8% 25.8% 25.6% 0.1% 4.7% 1.8% 40.2% 100.0% B Complex BHED 1.2% 31.1% 20.2% 0.1% 3.4% 0.8% 43.2% 100.0% C Medical BHED 1.4% 27.9% 19.4% 0.1% 2.3% 0.8% 48.1% 100.0% Simple BHED: Visits with a behavioral health diagnosis as the primary diagnosis, but no other behavioral health diagnosis. Complex BHED: Visits with a behavioral health diagnosis as the primary diagnosis, and also at least one other behavioral health diagnosis. Medical BHED: Visits with a medical diagnosis as the primary diagnosis, and at least one behavioral health diagnosis BHED: 31.9% of hospital BHED visits were by persons who were Black, 29.3% were by persons who were Hispanic, and 35.0% were by persons who were White Harris: 31.5% of PCRED visits were by persons who were Black, 33.5% were by persons who were Hispanic, and 35.9% were by persons who were White national: Race/ethnicity was not presented in this report. 24
25 Figure Simple BHED by race Asian, 1.0% White, 36.3% Black, 30.1% Unknown, 2.3% Other, 2.8% Am. Ind., 0.1% Hispanic, 27.4% Figure Simple BHED by race Asian, 1.8% White, 40.2% Black, 25.8% Hispanic, 25.6% Unknown, 1.8% Other, 4.7% Am. Ind., 0.1% 25
26 Figure Complex BHED by race Asian, 0.7% White, 48.5% Black, 26.9% Hispanic, 19.3% Unknown, 1.8% Other, 2.8% Am. Ind., 0.0% Figure Complex BHED by race Asian, 1.2% White, 43.2% Black, 31.1% Hispanic, 20.2% Unknown, 0.8% Other, 3.4% Am. Ind., 0.1% 26
27 Figure Medical BHED by race Asian, 0.9% White, 49.6% Black, 27.9% Hispanic, 17.4% Unknown, 2.0% Other, 2.2% Am. Ind., 0.0% Figure Medical BHED by race Asian, 1.4% White, 48.1% Black, 27.9% Hispanic, 19.4% Unknown, 0.8% Other, 2.3% Am. Ind., 0.1% 27
28 Table 6. Specific BHED by age 0 to to to 44 Frequencies to Other/Unk Total A Simple BHED 1,373 2,184 4,691 3, ,374 B Complex BHED 612 1,560 3,843 2, ,213 C Medical BHED 3,928 8,929 23,596 24,934 17, ,039 0 to to to to Other/Unk Total A Simple BHED 1,042 1,518 3,195 2, ,021 B Complex BHED 593 1,484 3,824 2, ,364 C Medical BHED 4,257 5,342 14,743 16,484 15, ,287 Percentages to to to to Other/Unk Total A Simple BHED 11.1% 17.6% 37.9% 26.2% 7.2% 0.0% 100.0% B Complex BHED 6.6% 16.9% 41.7% 28.9% 5.8% 0.0% 100.0% C Medical BHED 5.0% 11.3% 29.9% 31.5% 22.3% 0.0% 100.0% to to to to Other/Unk Total A Simple BHED 11.6% 16.8% 35.4% 26.4% 9.4% 0.3% 100.0% B Complex BHED 6.3% 15.8% 40.8% 30.5% 6.3% 0.2% 100.0% C Medical BHED 7.6% 9.5% 26.2% 29.3% 26.9% 0.6% 100.0% Simple BHED: Visits with a behavioral health diagnosis as the primary diagnosis, but no other behavioral health diagnosis. Complex BHED: Visits with a behavioral health diagnosis as the primary diagnosis, and also at least one other behavioral health diagnosis. Medical BHED: Visits with a medical diagnosis as the primary diagnosis, and at least one behavioral health diagnosis BHED: 40.8% of hospital BHED visits were by adults age 26-44, 10.5% were by children age 17 and under, 16.7% by adults age 18-25, 25.8% by adults age 45-64, and 6.3% by adults age 65 and over Harris: 25.8% of PCRED visits were by adults age 26-44, 32.8% were by children age 17 and under, 13.4% were by adults age 18-25, 19.4% by adults age 45-64, and 8.7% by adults age 65 and over national: Only adults age 18 and over were reported. 46.4% of BHED visits nationwide were by adults age 18-44, 34.5% by adults age 45-64, and 18.9% by adults age 65 and over. 28
29 Figure Simple BHED by age 65 +, 7.2% Other/Unk, 0.0% 0 to 17, 11.1% 45 to 64, 26.2% 18 to 25, 17.6% 26 to 44, 37.9% Figure Simple BHED by age Other/Unk, 0.3% 65 +, 9.4% 0 to 17, 11.6% 45 to 64, 26.4% 18 to 25, 16.8% 26 to 44, 35.4% 29
30 Figure Complex BHED by age 65 +, 5.8% Other/Unk, 0.0% 0 to 17, 6.6% 45 to 64, 28.9% 18 to 25, 16.9% 26 to 44, 41.7% Figure Complex BHED by age Other/Unk, 0.2% 65 +, 6.3% 0 to 17, 6.3% 45 to 64, 30.5% 18 to 25, 15.8% 26 to 44, 40.8% 30
31 Figure Medical BHED by age Other/Unk, 0.0% 0 to 17, 5.0% 65 +, 22.3% 18 to 25, 11.3% 45 to 64, 31.5% 26 to 44, 29.9% Figure Medical BHED by age Other/Unk, 0.6% 0 to 17, 7.6% 18 to 25, 9.5% 65 +, 26.9% 26 to 44, 26.2% 45 to 64, 29.3% 31
32 Table 7. Specific BHED visits by gender Frequencies 2007 Female Male Unk Total A Simple BHED 6,686 5, ,374 B Complex BHED 4,307 4, ,213 C Medical BHED 43,103 35, , Female Male Unk Total A Simple BHED 4,945 4, ,021 B Complex BHED 4,360 5, ,364 C Medical BHED 32,464 23, ,287 Percentages 2007 Female Male Unk Total A Simple BHED 54.0% 46.0% 0.0% 100.0% B Complex BHED 46.7% 53.3% 0.0% 100.0% C Medical BHED 54.5% 45.5% 0.0% 100.0% 2008 Female Male Unk Total A Simple BHED 54.8% 45.2% 0.0% 100.0% B Complex BHED 46.6% 53.4% 0.0% 100.0% C Medical BHED 57.7% 42.3% 0.0% 100.0% Simple BHED: Visits with a behavioral health diagnosis as the primary diagnosis, but no other behavioral health diagnosis. Complex BHED: Visits with a behavioral health diagnosis as the primary diagnosis, and also at least one other behavioral health diagnosis. Medical BHED: Visits with a medical diagnosis as the primary diagnosis, and at least one behavioral health diagnosis BHED: 50.3% of hospital BHED visits were by male patients, and 49.7% were by female patients Harris: 57.8% of PCRED visits were by female patients, and 42.1% were by male patients national: 53.9% of adult BHED visits nationwide were by female patients. 32
33 Figure Simple BHED by gender Unk, 0.0% Male, 46.0% Female, 54.0% Figure Simple BHED by gender Unk, 0.0% Male, 45.2% Female, 54.8% 33
34 Figure Complex BHED by gender Unk, 0.0% Male, 53.3% Female, 46.7% Figure Complex BHED by gender Unk, 0.0% Male, 53.4% Female, 46.6% 34
35 Figure Medical BHED by gender Unk, 0.0% Male, 45.5% Female, 54.5% Figure Medical BHED by gender Unk, 0.0% Male, 42.3% Female, 57.7% 35
36 Table 8. Specific BHED visits by discharge status Adm 1 Frequencies 2007 DC 2 Total A Simple BHED 2,243 10,131 12,374 B Complex BHED 2,085 7,128 9,213 C Medical BHED 21,999 57,040 79,039 Adm 2008 DC Total A Simple BHED 1,350 7,671 9,021 B Complex BHED 1,819 7,545 9,364 C Medical BHED 14,581 41,706 56,287 Percentages Adm 2007 DC Total A Simple BHED 18.1% 81.9% 100.0% B Complex BHED 22.6% 77.4% 100.0% C Medical BHED 27.8% 72.2% 100.0% 2008 Adm DC Total A Simple BHED 15.0% 85.0% 100.0% B Complex BHED 19.4% 80.6% 100.0% C Medical BHED 25.9% 74.1% 100.0% Simple BHED: Visits with a behavioral health diagnosis as the primary diagnosis, but no other behavioral health diagnosis. Complex BHED: Visits with a behavioral health diagnosis as the primary diagnosis, and also at least one other behavioral health diagnosis. Medical BHED: Visits with a medical diagnosis as the primary diagnosis, and at least one behavioral health diagnosis BHED: Discharge status was not computed in this manner Harris: Discharge status was not computed in this manner. PCRED visits (all of which were discharged/non hospitalized) were compared with all other ED visits (admitted/hospitalized were a part of this group). 1 Admitted: Admitted to/hospitalized at same facility or transferred to another facility. 2 DC: Discharged to home or self care/non hospitalized. 36
37 Figure Simple BHED by discharge status Adm, 18.1% DC, 81.9% Figure Simple BHED by discharge status Adm, 15.0% DC, 85.0% 37
38 Figure Complex BHED by discharge status Adm, 22.6% DC, 77.4% Figure Complex BHED by discharge status Adm, 19.4% DC, 80.6% 38
39 Figure Medical BHED by discharge status Adm, 27.8% DC, 72.2% Figure Medical BHED by discharge status Adm, 25.9% DC, 74.1% 39
40 Table 9. Admission status by payer source for BHED visits in frequencies Commercial CHIP Medicaid Medicare Oth. Gov. Oth. Priv. Uninsured Unknown Total A Simple BHED Adm ,243 DC 2, ,532 1, , ,131 Total 2, ,932 1, , ,374 B Complex BHED Adm ,085 DC 1, , , ,128 Total 1, ,792 1, , ,213 C Medical BHED Adm 3, ,688 11, , ,999 DC 15, ,015 11,362 1, , ,040 Total 19, ,703 23,021 1, , , percentages Commercial CHIP Medicaid Medicare Oth. Gov. Oth. Priv. Uninsured Unknown Total A Simple BHED Adm 14.4% 9.3% 20.7% 27.0% 10.8% 8.3% 16.4% 46.6% 18.1% DC 85.6% 90.7% 79.3% 73.0% 89.2% 91.7% 83.6% 53.4% 81.9% Total 100.0% 100.0% 100.0% 100.0% 100.0% 100.0% 100.0% 100.0% 100.0% B Complex BHED Adm 23.7% 13.9% 23.4% 38.1% 24.0% 21.4% 16.3% 31.6% 22.6% DC 76.3% 86.1% 76.6% 61.9% 76.0% 78.6% 83.7% 68.4% 77.4% Total 100.0% 100.0% 100.0% 100.0% 100.0% 100.0% 100.0% 100.0% 100.0% C Medical BHED Adm 19.6% 10.1% 23.0% 50.6% 16.4% 12.8% 15.5% 23.0% 27.8% DC 80.4% 89.9% 77.0% 49.4% 83.6% 87.2% 84.5% 77.0% 72.2% Total 100.0% 100.0% 100.0% 100.0% 100.0% 100.0% 100.0% 100.0% 100.0% 2007 national: 15.1% of adult ED visits by the uninsured for mental health reasons resulted in an admission, and 23.8% of adult ED visits by the uninsured for substance abuse reasons resulted in an admission. By contrast, 58.9% of adult ED visits by Medicare enrollees for mental health reasons resulted in an admission, and 58.0% of adult ED visits by Medicare enrollees for substance abuse reasons resulted in an admission. 40
41 Table 10. Admission status by payer source for BHED visits in frequencies Commercial CHIP Medicaid Medicare Oth. Gov. Oth. Priv. Uninsured Unknown Total A Simple BHED Adm ,350 DC 2, ,179 1, , ,671 Total 2, ,451 1, , ,021 B Complex BHED Adm ,819 DC 1, ,446 1, , ,545 Total 1, ,806 1, , ,364 C Medical BHED Adm 1, ,720 8, , ,581 DC 10, ,407 11, , ,706 Total 11, ,127 20, , , percentages Commercial CHIP Medicaid Medicare Oth. Gov. Oth. Priv. Uninsured Unknown Total A Simple BHED Adm 12.0% 8.8% 18.7% 20.6% 10.6% 22.6% 13.0% 10.5% 15.0% DC 88.0% 91.2% 81.3% 79.4% 89.4% 77.4% 87.0% 89.5% 85.0% Total 100.0% 100.0% 100.0% 100.0% 100.0% 100.0% 100.0% 100.0% 100.0% B Complex BHED Adm 19.0% 22.7% 19.9% 25.6% 12.8% 20.5% 16.3% 23.7% 19.4% DC 81.0% 77.3% 80.1% 74.4% 87.2% 79.5% 83.7% 76.3% 80.6% Total 100.0% 100.0% 100.0% 100.0% 100.0% 100.0% 100.0% 100.0% 100.0% C Medical BHED Adm 14.6% 11.6% 18.8% 43.9% 16.9% 14.1% 14.3% 21.8% 25.9% DC 85.4% 88.4% 81.2% 56.1% 83.1% 85.9% 85.7% 78.2% 74.1% Total 100.0% 100.0% 100.0% 100.0% 100.0% 100.0% 100.0% 100.0% 100.0% 2007 national: 15.1% of adult ED visits by the uninsured for mental health reasons resulted in an admission, and 23.8% of adult ED visits by the uninsured for substance abuse reasons resulted in an admission. By contrast, 58.9% of adult ED visits by Medicare enrollees for mental health reasons resulted in an admission, and 58.0% of adult ED visits by Medicare enrollees for substance abuse reasons resulted in an admission. 41
42 BHED visits by month, day, hour, length of stay, and transport status Simple BHED visits were more frequent than complex BHED visits for every month of the year in 2007, but they were closer in frequency in 2008 (Figures 31 & 33). Medical BHED visits peaked in September in 2007 but September in 2008 saw a slight drop (Figures 32 & 34). Hurricane Ike made landfall in September 2008 and led to the temporary closure of some of the EDs in this study. Simple BHED visits were more frequent than complex BHED visits for every day of the week in 2007, but they were closer in frequency in 2008 (Figures 35 & 37). Medical BHED visits peaked on Monday in both 2007 and 2008 (Figures 36 & 38). BHED visits of every kind were at their lowest levels at the hours of 4 6 AM, and they peaked from late morning to early evening (Figures 39-42). Mean length of stay was measured for non hospitalized visits of less than 24 hours each (Table 11). Complex BHED visits consistently had the longest length of stay (6.74 hours in 2007, 6.81 hours in 2008). The 2008 ED dataset included a variable on whether the visit included an ambulance transport or a self transport. Type of BHED visit in 2008 by transport is presented in Table 12. More than three in ten (31.9%) simple BHED visits involved an ambulance transport, 36,1% of complex BHED visits involved an ambulance transport, and more than four in ten (42.2%) of medical BHED visits involved an ambulance transport. 42
43 Jan Feb Mar Apr May Jun Jul Aug Sep Oct Nov Dec Jan Feb Mar Apr May Jun Jul Aug Sep Oct Nov Dec Figure BHED visits by month of the year simplex and complex 1,200 1, A Simple BHED B Complex BHED Figure BHED visits by month of the year simplex, complex, and medical 8,000 7,000 6,000 5,000 4,000 3,000 2,000 A Simple BHED B Complex BHED C Medical BHED 1, Harris: ED visits overall peaked in January. 43
44 Jan Feb Mar Apr May Jun Jul Aug Sep Oct Nov Dec Jan Feb Mar Apr May Jun Jul Aug Sep Oct Nov Dec Figure BHED visits by month of the year simplex and complex 1,200 1, A Simple BHED B Complex BHED Figure BHED visits by month of the year simplex, complex, and medical 6,000 5,000 4,000 3,000 2,000 A Simple BHED B Complex BHED C Medical BHED 1, Harris: ED visits overall peaked in January. 44
45 Figure BHED visits by day of the week simple and complex 2,000 1,800 1,600 1,400 1,200 1, Sun Mon Tue Wed Thu Fri Sat A Simple BHED B Complex BHED Figure BHED visits by day of the week simple, complex, and medical 14,000 12,000 10,000 8,000 6,000 4,000 A Simple BHED B Complex BHED C Medical BHED 2,000 0 Sun Mon Tue Wed Thu Fri Sat 2008 Harris: ED visits overall peaked on Sunday. 45
46 Figure BHED visits by day of the week simple and complex 1,450 1,400 1,350 1,300 1,250 1,200 A Simple BHED B Complex BHED 1,150 1,100 1,050 Sun Mon Tue Wed Thu Fri Sat Figure BHED visits by day of the week simple, complex, and medical 9,000 8,000 7,000 6,000 5,000 4,000 3,000 A Simple BHED B Complex BHED C Medical BHED 2,000 1,000 0 Sun Mon Tue Wed Thu Fri Sat 2008 Harris: ED visits overall peaked on Sunday. 46
47 12:00 AM 1:00 AM 2:00 AM 3:00 AM 4:00 AM 5:00 AM 6:00 AM 7:00 AM 8:00 AM 9:00 AM 10:00 AM 11:00 AM 12:00 PM 1:00 PM 2:00 PM 3:00 PM 4:00 PM 5:00 PM 6:00 PM 7:00 PM 8:00 PM 9:00 PM 10:00 PM 11:00 PM 12:00 AM 1:00 AM 2:00 AM 3:00 AM 4:00 AM 5:00 AM 6:00 AM 7:00 AM 8:00 AM 9:00 AM 10:00 AM 11:00 AM 12:00 PM 1:00 PM 2:00 PM 3:00 PM 4:00 PM 5:00 PM 6:00 PM 7:00 PM 8:00 PM 9:00 PM 10:00 PM 11:00 PM Figure BHED visits by hour of the day simple and complex A Simple BHED B Complex BHED Figure BHED visits by hour of the day simple, complex, and medical 5,000 4,500 4,000 3,500 3,000 2,500 2,000 1,500 1,000 A Simple BHED B Complex BHED C Medical BHED Harris: ED visits overall peaked from 11 AM to 7 PM. 47
48 12:00 AM 1:00 AM 2:00 AM 3:00 AM 4:00 AM 5:00 AM 6:00 AM 7:00 AM 8:00 AM 9:00 AM 10:00 AM 11:00 AM 12:00 PM 1:00 PM 2:00 PM 3:00 PM 4:00 PM 5:00 PM 6:00 PM 7:00 PM 8:00 PM 9:00 PM 10:00 PM 11:00 PM 12:00 AM 1:00 AM 2:00 AM 3:00 AM 4:00 AM 5:00 AM 6:00 AM 7:00 AM 8:00 AM 9:00 AM 10:00 AM 11:00 AM 12:00 PM 1:00 PM 2:00 PM 3:00 PM 4:00 PM 5:00 PM 6:00 PM 7:00 PM 8:00 PM 9:00 PM 10:00 PM 11:00 PM Figure BHED visits by hour of the day simple and complex A Simple BHED B Complex BHED Figure BHED visits by hour of the day simple, complex, and medical 3,500 3,000 2,500 2,000 1,500 1,000 A Simple BHED B Complex BHED C Medical BHED Harris: ED visits overall peaked from 11 AM to 7 PM. 48
49 Table 11. Mean length of stay (in hours) in the emergency department for visits of less than 24 hours each. Type of visit 2007 Mean (sd) 2008 Mean (sd) A. Simple BHED 5.69 (4.58) 4.57 (4.01) B. Complex BHED 6.74 (5.12) 6.81 (5.19) C. Medical BHED 5.34 (4.76) 6.07 (5.18) Simple BHED: Visits with a behavioral health diagnosis as the primary diagnosis, but no other behavioral health diagnosis. Complex BHED: Visits with a behavioral health diagnosis as the primary diagnosis, and also at least one other behavioral health diagnosis. Medical BHED: Visits with a medical diagnosis as the primary diagnosis, and at least one behavioral health diagnosis BHED: Mean LOS for non hospitalized hospital based BHED visits was 6.1 hours in 2004, 5.9 hours in 2005 and 5.9 hours in Harris: Mean LOS for non hospitalized BHED visits in 2007 was 6.05 hours, compared with 5.52 hours in Mean LOS for non hospitalized medical visits in 2007 was 4.50 hours, compared with 4.48 hours in
50 Table 12. Types of BHED visits in 2008 by Transport Ambulance Other Frequencies Self Unknown Total A Simple BHED 2, , ,021 B Complex BHED 3, , ,364 C Medical BHED 23, ,678 2,358 56,287 Percentages Ambulance Other Self Unknown Total A Simple BHED 31.9% 1.8% 60.8% 5.6% 100.0% B Complex BHED 36.1% 4.7% 50.6% 8.6% 100.0% C Medical BHED 42.2% 0.9% 52.7% 4.2% 100.0% In the 2010 ambulance report 1, 17.6% of all ED visits in Harris County had an ambulance transport, and 77.1% had a self transport. For BHED visits in that report with an ambulance transport, 41.3% were White, 39.9% were uninsured, 51.6% were female, 36.1% were age 26-44, and 19.3% were admitted Harris: 10.8% of PCRED visits had an ambulance transport, and 20.9% of all other ED visits had an ambulance transport. 1 Courtney P. Emergency department visits to Harris County hospitals in 2008 that involved transportation by ambulance. June Available at 50
51 Top diagnoses for BHED visits Table 13 presents simple and complex BHED visits according to whether their first or primary diagnosis was for mental health, alcohol, or drug related reasons. In both 2007 and 2008, the majority of simple BHED visits had a mental health condition as the primary diagnosis (72.0% in 2007 and 79.0% in 2008). However, those percentages dropped for complex BHED visits (59.5% in 2007, 69.6% in 2008). Alcohol and drug related conditions combined made up 28.0% of simple BHED visits in 2007, but 40.6% of complex BHED visits. In 2008, alcohol and drug related conditions made up 21.0% of simple BHED visits but 30.3% of complex BHED visits. Tables 14 (2007) and 15 (2008) go one step further and break down Table 13 by payer source. Six in ten (60.6%) of all simple BHED visits in 2007 whose primary diagnosis was alcohol related were by persons who were uninsured. In 2008 that same percentage dropped to 49.5%. Half (50.9%) of all simple BHED visits in 2007 whose primary diagnosis was drug related were by persons who were uninsured. In 2008 that same percentage dropped to 43.0%. The uninsured made up 38.1% of all simple BHED visits in 2007 whose primary diagnosis was mental health related, but that percentage dropped to 28.3% in However, the percentage of uninsured complex BHED visits, whose primary diagnosis was mental health related, changed very little from 2007 (35.3%) to 2008 (34.8%). While there were some differences between 2007 and 2008, the plurality (and in some cases majority) of visits whose primary focus was a drug or alcohol problem were by persons who were uninsured. Tables 14, 15, and 17 present the top diagnoses for BHED visits, and Table 16 presents the top primary/medical diagnoses for medical BHED visits. Various forms of anxiety, depression, and alcohol use/abuse were among the top BHED diagnoses (Tables 14, 15, and 17). Cocaine abuse was one of the top primary diagnoses for complex BHED visits (Table 15), as well as one of the top secondary (ICD2) BHED diagnoses for medical BHED visits (Table 17). 51
52 Chest pain and pneumonia were the top medical diagnoses for medical BHED visits in both 2007 and 2008 (Table 16). While schizophrenia is often considered to be a serious and persistent mental illness, Table 14 indicates that many persons in both 2007 and 2008 were diagnosed with it in an ED setting but with no other BHED problems. Bipolar disorder, unspecified, was one of the top secondary BHED diagnoses for persons who present primarily with a medical disorder (Table 18). 52
53 Table 13. Primary discharge diagnoses 1 (mental, drug, or alcohol) for simple and complex BHED visits 2007 frequencies 2008 frequencies Mental health Alcohol Drug Total Mental health Alcohol Drug Total A Simple BHED 8,504 2, ,805 7,128 1, ,021 B Complex BHED 5,413 2,590 1,097 9,100 6,520 1, , percentages 2008 percentages Mental health Alcohol Drug Total Mental health Alcohol Drug Total A Simple BHED 72.0% 23.9% 4.1% 100.0% 79.0% 14.3% 6.7% 100.0% B Complex BHED 59.5% 28.5% 12.1% 100.0% 69.6% 20.0% 10.3% 100.0% 2007 national: 63.7% of all BHED visits nationwide were for mental health conditions, 24.4% were for substance abuse conditions, and 11.9% were for comorbid mental health and substance abuse conditions. 1 ICD1. 53
54 Table Primary discharge diagnoses 1 (mental, drug, or alcohol) for simple and complex BHED visits broken down by payer source 2007 Frequencies Mental Health Commercial CHIP Medicaid Medicare Oth. Gov. Oth. Priv. Uninsured Unknown Total A Simple BHED 2, ,538 1, , ,504 B Complex BHED 1, , , ,413 Alcohol Commercial CHIP Medicaid Medicare Oth. Gov. Oth. Priv. Uninsured Unknown A Simple BHED , ,820 B Complex BHED , ,590 Drug Commercial CHIP Medicaid Medicare Oth. Gov. Oth. Priv. Uninsured Unknown A Simple BHED B Complex BHED , Percentages Mental Health Commercial CHIP Medicaid Medicare Oth. Gov. Oth. Priv. Uninsured Unknown Total A Simple BHED 24.2% 1.1% 18.1% 17.0% 1.1% 0.3% 38.1% 0.3% 100.0% B Complex BHED 20.8% 0.9% 23.3% 18.3% 1.0% 0.2% 35.3% 0.3% 100.0% Alcohol Commercial CHIP Medicaid Medicare Oth. Gov. Oth. Priv. Uninsured Unknown A Simple BHED 15.9% 0.7% 10.1% 6.1% 4.0% 0.6% 60.6% 2.1% 100.0% B Complex BHED 19.6% 0.5% 14.1% 9.5% 1.5% 0.1% 54.1% 0.6% 100.0% Drug Commercial CHIP Medicaid Medicare Oth. Gov. Oth. Priv. Uninsured Unknown A Simple BHED 20.6% 1.2% 14.3% 7.1% 1.7% 0.4% 50.9% 3.7% 100.0% B Complex BHED 23.5% 0.8% 14.4% 11.3% 0.7% 0.2% 48.3% 0.7% 100.0% 54
55 Table Primary discharge diagnoses 1 (mental, drug, or alcohol) for simple and complex BHED visits broken down by payer source 2008 Frequencies Mental Health Commercial CHIP Medicaid Medicare Oth. Gov. Oth. Priv. Uninsured Unknown Total A Simple BHED 2, ,205 1, , ,128 B Complex BHED 1, ,355 1, , ,520 Alcohol Commercial CHIP Medicaid Medicare Oth. Gov. Oth. Priv. Uninsured Unknown A Simple BHED ,290 B Complex BHED ,875 Drug Commercial CHIP Medicaid Medicare Oth. Gov. Oth. Priv. Uninsured Unknown A Simple BHED B Complex BHED Percentages Mental Health Commercial CHIP Medicaid Medicare Oth. Gov. Oth. Priv. Uninsured Unknown Total A Simple BHED 30.7% 1.7% 16.9% 19.9% 1.7% 0.6% 28.3% 0.2% 100.0% B Complex BHED 19.0% 0.9% 20.8% 22.0% 0.7% 0.4% 34.8% 1.4% 100.0% Alcohol Commercial CHIP Medicaid Medicare Oth. Gov. Oth. Priv. Uninsured Unknown A Simple BHED 16.6% 1.1% 10.0% 10.2% 8.8% 3.3% 49.5% 0.5% 100.0% B Complex BHED 18.9% 0.5% 15.9% 9.8% 1.2% 0.6% 51.4% 1.7% 100.0% Drug Commercial CHIP Medicaid Medicare Oth. Gov. Oth. Priv. Uninsured Unknown A Simple BHED 21.9% 2.0% 19.4% 11.3% 1.7% 0.8% 43.0% 0.0% 100.0% B Complex BHED 22.5% 0.8% 15.8% 15.1% 1.0% 0.4% 43.2% 1.1% 100.0% 55
56 Table 14. Top primary diagnoses 1 for simple BHED visits ICD Description Count ICD Description Count Anxiety state, unspec 1, Anxiety 1, Alcohol abuse, unspec 1, Depressive d/o, nec Depressive disorder, nec 1, Anxiety state, unspecified Unspecified psychosis Panic disorder without agoraphobia Other, mixed, or unspecified drug abuse Alcohol abuse, unspecified Tension headache Unspecified psychosis Unspecified schizophrenia, unspec Hyperventilation Panic disorder without agoraphobia Major depressive disorder, single episode Bipolar disorder, unspec Postconcussion syndrome Major depr disorder, single episode, unspec Other, mixed, or unspecified drug abuse Cocaine abuse, unspecified 315 V704 Examination for medicolegal reasons Hyperventilation Predominant disturbance of emotions Postconcussion syndrome Alcoholic cirrhosis of liver Predominant disturbance of emotions Other, mixed, or unspecified drug abuse Oth persistent mental d/o due to conditions class Persistent mental d/os due to conditions classified elsew 122 V704 Examination for medicolegal reasons Other and unspecified bipolar disorders Schizoaffective disorder, unspecified Major depr d/o, single episode, unspec Unspecified nonpsychotic mental disorder Respiratory malfunc. arising from mental factors Anxiety, dissociative and somatoform disorders Cocaine abuse Alcoholic cirrhosis of liver Unspecified schizophrenia, unspeficied Unspecified episodic mood disorder Schizoaffective disorder, unspecified Other and unspecified alcohol dependence Dysthymic disorder Dysthymic disorder Unspecified schizophrenia Nondependent abuse of drugs Bipolar disorder, unspecified Schizophrenic d/o, paranoid type, unspec Schizophrenia, paranoid type, unspeficied 72 1 ICD1 2 Appears to be missing a digit. 56
57 Table 15. Top primary diagnoses 1 for complex BHED visits ICD Description Count ICD Description Count 311 Depressive disorder, nec Depressive disorder, not elsewhere classified 1, Alcohol abuse, unspecified Unspecified psychosis Anxiety state, unspecified Unspecified nonpsychotic mental disorder Unspecified psychosis Alcohol withdrawal Cocaine abuse, unspecified Alcohol abuse, unspecified Major depressive d/o, single episode, unspec Alcoholic cirrhosis of liver Alcoholic cirrhosis of liver Anxiety Drug withdrawal Anxiety state, unspecified Alcohol withdrawal Major depressive disorder, single episode Bipolar disorder, unspecified Schizoaffective disorder, unspecified Other, mixed, or unspecified drug abuse Drug-induced mental disorders Unspecified schizophrenia Major depr d/o, single episode, unspecified Panic disorder without agoraphobia Unspecified disturbance of conduct Schizoaffective disorder, unspecified Bipolar disorder, unspecified Bipolar I d/0, most recent episode depr, unspec Unspecified schizophrenia, unspeficied Alcohol withdrawal delirium Panic disorder without agoraphobia Hyperventilation Cocaine abuse, unspecified Unspecified episodic mood disorder Other, mixed, or unspecified drug abuse Mental d/os complicating pregnancy, unspec Schizophrenia, paranoid type, unspecified Sedative, hypnotic or anxiolytic abuse, unspec Pathological drug intoxication Other and unspecified alcohol dependence Hyperventilation Major depr d/o, recurrent episode, unspecified Alcohol-induced mental disorders Cannabis abuse, unspecified Bipolar I d/o, most recent episode depr Acute alcoholic intoxication, unspecified Bipolar I d/o, most recent episode depr, unspec Alcoholic gastritis, no mention of hemorrhage Major depr d/o, recurrent episode, severe 77 1 ICD1 2 Appears to be missing a digit. 57
58 Table 16. Top primary (medical) diagnoses 1 for medical BHED visits ICD Description Count ICD Description Count Chest pain, other 2, Chest pain, other 1, Chest pain, unspecified 1, Chest pain 1, Pneumonia, organism unspecified 1, Pneumonia, organism unspecified 1, Urinary tract infection, site not specified 1, Other disorders of urethra and urinary tract Convulsive disorder NOS 1, Transient alteration of awareness Acute exacerbation of COPD 1, Chest pain, unspecified Transient alteration of awareness 1, Convulsive disorder NOS Congestive heart failure, unspecified 1, Acute exacerbation of COPD Headache Altered mental status Essential hypertension, unspecfiied 915 V6284 Suicidal ideation Epilepsy, unspecified, not intractable Urinary tract infection, site not specified Cellulitis of leg, except foot Essential hypertension, unspecified Cerebral artery occlusion, unspec, with cerebral Dehydration Acute bronchitis Palpitations Abdominal pain, unspecified site Cerebral artery occlusion, unspec, with cerebral Painful respiration Poisoning by benzodiazepene-based tranquilizers Acute pancreatitis Dizziness and giddiness Contusion of face, scalp, and neck except eye Epilepsy, unspecified, not intractable Dehydration Acute renal failure, unspecified Oth and unspec noninfectious gastroenteritis and Abdominal pain, unspecified site Hearing loss Hearing loss Coronary atherosclerosis of native coronary arte 639 V681 Issue of repeat prescriptions Abdominal pain, unspecified site Contusion of face, scalp, and neck except eye Poisoning by benzodiazepene based tranquilizers Symptoms involving head and neck Dizziness and giddiness Headache ICD1 58
59 Table 17. Top secondary diagnoses 1 that are behavioral for medical BHED visits ICD Description Count ICD Description Count 3051 Tobacco use disorder 6, Anxiety 1, Anxiety state, unspecified 2, Depressive disorder, not elsewhere classified 1, Alcohol abuse, unspecified 1, Anxiety state, unspecified Depressive disorder, not elsewhere classified 1, Alcohol abuse, unspecified Cocaine abuse, unspecified 1, Other and unspecified bipolar disorders Other, mixed, or unspecified drug abuse Oth persistent mental d/os due to conditions class Bipolar disorder, unspecified Bipolar disorder, unspecified Unspecified schizophrenia, unspeficied Cocaine abuse, unspecified Alcoholic cirrhosis of liver Attention deficit disorder with hyperactivity Oth persistent mental d/o due to conditions class Tobacco use disorder Attention deficit disorder with hyperactivity Other, mixed, or unspecified drug abuse Cannabis abuse, unspecified Cocaine abuse Other and unspecified alcohol dependence Unspecified psychosis Unspecified mental retardation Other, mixed, or unspecified drug abuse Unspecified psychosis Unspecified schizophrenia, unspeficied Pathological drug intoxication Panic disorder without agoraphobia Panic disorder without agoraphobia Alcohol withdrawal Hyperventilation Dysthymic disorder Anxiety, dissociative and somatoform disorders Hyperventilation Alcohol withdrawal Major depressive disorder, single episode Sedative, hypnotic or anxiolytic abuse, unspec Cannabis abuse Autistic disorder, persistent or active state Major depressive disorder, single episode Dysthymic disorder Unspecified mental retardation Major depr d/o, single episode, unspecified Alcoholic cirrhosis of liver Attention deficit disorder without hyperactivity Other and unspecified alcohol dependence ICD2. Diagnoses 3 through 10 are not included here. 2 Appears to be missing a digit. 59
60 Geographic distribution of BHED visits in 2008 by ZIP code The following maps show the three categories of BHED visits by ZIP code of residence. For the sake of simplicity, only visits in 2008 are shown. In contrast to maps in the 2008 Harris report, distributions were broken up according to natural breaks rather than quintiles. Natural breaks more clearly shows the highest concentrations of visits. While some of the largest frequencies of simple and medical BHED visits were on the far western and far eastern edges of Harris County (Maps 1 and 3), some of the highest concentrations of complex BHED visits were in the Third Ward and South Park areas (Map 3). Table 18 gives the frequency counts for the top ZIP codes behind each map. The Baytown area ZIP code of was one of the top ZIP codes for all three types of BHED visits in 2008 Table 18. Top ten ZIP code frequencies for simple, complex, and medical BHED visits Map 1 Map 2 Map 3 ZIP Count ZIP Count ZIP Count , , , ,
61 Map 1 61
62 Map 2 62
63 Map 3 63
Emergency Department Boarding of Psychiatric Patients in Oregon
 College of Public Health and Human Sciences Emergency Department Boarding of Psychiatric Patients in Oregon Jangho Yoon, PhD, Jeff Luck, PhD April 25, 2017 Scope Quantify the extent of psychiatric emergency
Emergency Department (ED) Visits due to Drug Overdose. Montgomery County, OH January 1, 2016 December 31, 2016
 Visits due to Drug Overdose. Montgomery County, OH January 1, 2016 December 31, 2016") Introduction Emergency Department (ED) Visits due to Drug Overdose Montgomery County, OH January 1, 2016 December 31, 2016 EpiCenter is Ohio s statewide syndromic surveillance system that collects Emergency
Introduction Emergency Department (ED) Visits due to Drug Overdose Montgomery County, OH January 1, 2016 December 31, 2016 EpiCenter is Ohio s statewide syndromic surveillance system that collects Emergency
Alcohol & Drugs. Contents:
 Contents: Alcohol & Drugs Figure 1.1a Total Collisions Involving Alcohol by Year 72 1.1b Total Injury Collisions Involving Alcohol by Year 73 1.1c Total Fatal Collisions Involving Alcohol by Year 73 1.2a
KENT BISHOP M.D. ProMedica Chief Experience Officer President Women s Service Line
 KENT BISHOP M.D. ProMedica Chief Experience Officer President Women s Service Line 1 WHEN A VISION TAKES SHAPE. 2 3 4 Modern Facilities Clinical Service Lines Quality/ Safety Mental Health Clinical Research
Epidemiology of adolescent and young adult hospital utilization for alcohol and drug use, poisoning, and suicide attempts in the United States
 Journal of Adolescent and Family Health Volume 6 Issue 2 Article 4 November 2014 Epidemiology of adolescent and young adult hospital utilization for alcohol and drug use, poisoning, and suicide attempts
SUICIDE IN SAN DIEGO COUNTY:
 SUICIDE IN SAN DIEGO COUNTY: 1998-2007 www.sdchip.org Contents www.sdchip.org SUICIDE IN SAN DIEGO COUNTY: 1998-2007 CHIP's Message Dear Reader, Community Health Improvement Partners (CHIP) is pleased
Tri-County Opioid Safety Coalition Data Brief December 2017 Clackamas, Multnomah, and Washington Counties
 Medicaid-Funded Alternative Treatment for Back Pain in the Tri-County Region Key Findings The percentage of members with a back pain diagnosis who received an alternative treatment increased from 29% in
Financial Impact of Emergency Department Visits by Adults for Dental Conditions in Maryland
 Financial Impact of Emergency Department by Adults for Dental Conditions in Maryland Background Access to dental care remains challenging for many children and adults. Lack of preventive care services
Issue Brief From The University of Memphis Methodist LeBonheur Center for Healthcare Economics
 Issue Brief From The University of Memphis Methodist LeBonheur Center for Healthcare Economics September 12, 2007 Non-Urgent ED Use in Tennessee, 2004 Peter S. Miller, Rebecca A. Pope and Cyril F. Chang
Released: September 13, 2016 Prepared by: Office of Assessment and Planning, Anne Arundel County Department of Health
 Opioid Poisoning-Related Emergency Department Visits Anne Arundel County, 2010-2014 Released: September 13, 2016 Prepared by: Office of Assessment and Planning, Anne Arundel County Department of Health
U.S. Counties Vulnerability to Rapid Dissemination of HIV/HCV Infections Among People Who Inject Drugs
 U.S. Counties Vulnerability to Rapid Dissemination of HIV/HCV Infections Among People Who Inject Drugs Michelle Van Handel, MPH Health Scientist National Center for HIV/AIDS, Viral Hepatitis, STDs and
Blood Alcohol Levels for Fatally Injured Drivers
 Blood Alcohol Levels for Fatally Injured 137 138 CONTENTS TABLES PAGE Table 1 Blood Alcohol Levels of Fatally Injured by Age Groups.... 141 Table 2 Blood Alcohol Levels of Fatally Injured by Time of Day....
Influenza Season, Boston
 2014-2015 Influenza Season, Boston Infectious Disease Bureau Boston Public Health Commission Influenza Surveillance: Boston, 2014-2015 Influenza cases diagnosed in Boston and confirmed by any laboratory
HEALTH CARE EXPENDITURES ASSOCIATED WITH PERSISTENT EMERGENCY DEPARTMENT USE: A MULTI-STATE ANALYSIS OF MEDICAID BENEFICIARIES
 HEALTH CARE EXPENDITURES ASSOCIATED WITH PERSISTENT EMERGENCY DEPARTMENT USE: A MULTI-STATE ANALYSIS OF MEDICAID BENEFICIARIES Presented by Parul Agarwal, PhD MPH 1,2 Thomas K Bias, PhD 3 Usha Sambamoorthi,
Influenza Season, Boston
 2016-2017 Influenza Season, Boston Infectious Disease Bureau Boston Public Health Commission Boston Public Health Commission Influenza Surveillance: Boston, 2016-2017 Influenza cases diagnosed in Boston
Detroit: The Current Status of the Asthma Burden
 Detroit: The Current Status of the Asthma Burden Peter DeGuire, Binxin Cao, Lauren Wisnieski, Doug Strane, Robert Wahl, Sarah Lyon Callo, Erika Garcia, Michigan Department of Health and Human Services
04 Chapter Four Treatment modalities. Experience does not err, it is only your judgement that errs in expecting from her what is not in her power.
 Chapter Four Treatment modalities Experience does not err, it is only your judgement that errs in expecting from her what is not in her power. LEONARDO da Vinci Vol 2 esrd Ch pg 29 Contents 22 Incident
Statewide Statistics and Key Findings 1
 % s, 30 Days PHC4 s for Same Condition Jan 03 through Aug 04 Data Statewide information about readmissions and the key findings of this report are presented in this section. The study examines hospitalizations
Prevalence of Mental Illness
 Section 1 Prevalence of Mental Illness The prevalence of mental health problems or mental illness appears to be quite stable over time. Full epidemiological surveys of prevalence, reported using complex
Hospital Discharge Data
 Hospital Discharge Data West Virginia Health Care Authority Hospitalization data were obtained from the West Virginia Health Care Authority s (WVHCA) hospital discharge database. Data are submitted by
Using Hospital Admission and Readmission Patterns to Improve Outreach to Persons Living with HIV/AIDS in Pennsylvania
 Using Hospital Admission and Readmission Patterns to Improve Outreach to Persons Living with HIV/AIDS in Pennsylvania July 1, 2010 September 30, 2012 February 2014 Prepared by By Susan Elster, Colleen
BLOOD ALCOHOL LEVELS FOR FATALLY INJURED DRIVERS
 BLOOD ALCOHOL LEVELS FOR FATALLY INJURED DRIVERS 128 MOTOR VEHICLE CRASHES IN NEW ZEALAND 213 BLOOD ALCOHOL LEVELS FOR FATALLY INJURED DRIVERS 129 CONTENTS TABLES Table 1 Blood alcohol levels of fatally
Tobacco Use. Overview. General Data Note. Summary NYSDOH
 Tobacco Use * Note: For interpretation purposes, please print this report and supplemental document in color Overview Smoking is a leading cause of preventable death and can also cause many illnesses,
2017 State Of The County Health Report Jones County, NC
 217 State Of The County Health Report Jones County, NC Promoting sound health policies, preventing and controlling the spread of disease, and safeguarding the integrity of the environment for all citizens
Potentially Preventable Hospitalizations in Pennsylvania
 Potentially Preventable Hospitalizations in Pennsylvania Pennsylvania Health Care Cost Containment Council June 2012 About PHC4 The Pennsylvania Health Care Cost Containment Council (PHC4) is an independent
Sleep Market Panel. Results for June 2015
 Sleep Market Panel Results for June 2015 Notes: o This is a monthly trending report of panel member data along with additional analysis by: Sleep labs affiliated with Hospitals vs. Independent Labs o Hospital
Policy Evaluation: Step Therapy Prior Authorization of Combination Inhaled Corticosteroid / Long-Acting Beta-Agonists
 Drug Use Research & Management Program OHA Division of Medical Assistance Programs 500 Summer Street NE, E35; Salem, OR 97301-1079 Phone 503-947-5220 Fax 503-947-1119 Policy Evaluation: Step Therapy Prior
Influenza Season, Boston
 2015-2016 Influenza Season, Boston Infectious Disease Bureau Boston Public Health Commission Boston Public Health Commission Influenza Surveillance: Boston, 2015-2016 Influenza cases diagnosed in Boston
March 2012: Next Review September 2012
 9.13 Falls Falls, falls related injuries and fear of falling are crucial public health issues for older people. Falls are the most common cause of accidental injury in older people and the most common
Jefferson County School Based Health Centers Participation Report
 Jefferson County School Based Health Centers 212-213 Participation Report Background: School Based Health Centers (SBHCs) were established during the 28-29 school year to address a need for adolescent
DMAS UPDATE ON GAP PROGRAM. Cindi B. Jones, Director, DMAS House Appropriations Committee September 18, 2017
 DMAS UPDATE ON GAP PROGRAM Cindi B. Jones, Director, DMAS House Appropriations Committee September 18, 2017 Bridging the Mental Health Coverage GAP GAP s Inception The Governor s Access Plan 1 of a 10
Behavioral Health Hospital and Emergency Department Health Services Utilization
 Behavioral Health Hospital and Emergency Department Health Services Utilization Rhode Island Fee-For-Service Medicaid Recipients Calendar Year 2000 Prepared for: Prepared by: Medicaid Research and Evaluation
preventive health care measure
 introduction 98 < pre- & post-esrd preventive care 1 < diabetic care 12 < cancer screening 14 < chapter summary 16 Chapter Five preventive health care measure SSo neither ought you to attempt to cure the
The Allegheny County HealthChoices Program, 2008: The Year in Review
 The Allegheny County HealthChoices Program, : The Year in Review A publication of Allegheny HealthChoices, Inc. August 2009 Overview and Highlights HealthChoices is Pennsylvania s managed care program
Identifying Adult Mental Disorders with Existing Data Sources
 Identifying Adult Mental Disorders with Existing Data Sources Mark Olfson, M.D., M.P.H. New York State Psychiatric Institute Columbia University New York, New York Everything that can be counted does not
2018 Community Health Assessment
 2018 Community Health Assessment Community Health Status Assessment Linn County, IA Prepared by Amy Hockett, PhD, MPH, CHES Epidemiologist Linn County Public Health August 9, 2018 Community Health Status
California 2010 Pertussis Epidemic. Kathleen Winter, MPH Immunization Branch California Department of Public Health
 California 2010 Pertussis Epidemic Kathleen Winter, MPH Immunization Branch California Department of Public Health Overview Pertussis Background California Pertussis Epidemic Challenges and Success Ongoing
Performance Analysis:
 Performance Analysis: Healthcare Utilization of CCNC- Population 2007-2010 Prepared by Treo Solutions JUNE 2012 Table of Contents SECTION ONE: EXECUTIVE SUMMARY 4-5 SECTION TWO: REPORT DETAILS 6 Inpatient
Heart Attack Readmissions in Virginia
 Heart Attack Readmissions in Virginia Schroeder Center Statistical Brief Research by Mitchell Cole, William & Mary Public Policy, MPP Class of 2017 Highlights: In 2014, almost 11.2 percent of patients
Cost-Effectiveness of Lung Volume Reduction Surgery
 Cost-Effectiveness of Lung Volume Reduction Surgery The Health Industry Forum October 24, 2007 - Washington DC The National Emphysema Treatment Trial National Emphysema Treatment Trial (NETT) Multicenter,
Table 1: Summary of Texas Influenza (Flu) and Influenza-like Illness (ILI) Activity for the Current Week Texas Surveillance Component
 and Influenza-like Illness (ILI) Activity for the Current Week Texas Surveillance Component") Texas Surveillance Report 2017 2018 Season/2018 MMWR Week 03 (Jan. 14, 2018 Jan. 20, 2018) Report produced on 1/27/2018 Summary activity remains high across the state of Texas. Compared to the previous
Texas Surveillance Report 2017 2018 Season/2018 MMWR Week 03 (Jan. 14, 2018 Jan. 20, 2018) Report produced on 1/27/2018 Summary activity remains high across the state of Texas. Compared to the previous
Quad Cities July 3, 2008
 Community Ment al Health Definition, Programs, Trends and Challenges Quad Cities July 3, 2008 Presented by David L. Deopere, Ph.D. President, Robert Young Center Identify Catchment Area of not less than
Tennessee Department of Health in collaboration with Tennessee State University and University of Tennessee Health Science Center
 Tennessee Department of Health in collaboration with Tennessee State University and University of Tennessee Health Science Center 2006 Tennessee Department of Health 2006 ACKNOWLEDGEMENTS CONTRIBUTING
Care of Adults With Mental Health. U.S. Community Hospitals, 2004
 t t 4 t t 10 t t Care of Adults With Mental Health t and Substance Abuse Disorders in t t U.S. Community Hospitals, 2004 t t t t t t t t t t t t t t t t t t t Care of Adults With Mental Health and Substance
Breast Test Wales Screening Division Public Health Wales
 Breast Test Wales Screening Division Public Health Wales Programme Level Agreement with Welsh Government Quarterly Report October - December Breast Test Wales - Quarterly Report October - December Service
Reducing COPD Exacerbation Readmissions in a Community-Based Teaching Hospital
 Reducing COPD Exacerbation Readmissions in a Community-Based Teaching Hospital Dawn Waddell, PharmD, BCPS Clinical Pharmacy Manager Lisa Kingdon, PharmD, BCPS Clinical Pharmacy Specialist Dawn Waddell
Quit Rates of New York State Smokers
 Quit Rates of New York State Smokers Sara M. Abrams, MPH Data Manager NYS Smokers Quitline Sara.Abrams@roswellpark.org September 6, 20 Presentation Outline Basic Quitline Service How Quit Rates are defined
Influenza A (H1N1)pdm09 in Minnesota Epidemiology
pdm09 in Minnesota Epidemiology") Influenza A (H1N1)pdm09 in Minnesota Epidemiology Infectious Disease Epidemiology, Prevention and Control Division PO Box 64975 St. Paul, MN 55164-0975 Number of Influenza Hospitalizations by Influenza
Influenza A (H1N1)pdm09 in Minnesota Epidemiology Infectious Disease Epidemiology, Prevention and Control Division PO Box 64975 St. Paul, MN 55164-0975 Number of Influenza Hospitalizations by Influenza
Facilitating Access to Mental Health Services: A Look at Medicaid, Private Insurance, and the Uninsured
 June 2017 Fact Sheet Facilitating Access to Mental Health Services: A Look at Medicaid, Private Insurance, and the Uninsured In 2015, over 43 million adults had a mental illness and nearly 10 million had
Opioid Deaths in South Carolina. Daniela Nitcheva, PhD Division of Biostatistics Bureau of Public Health Statistics
 Opioid Deaths in South Carolina Daniela Nitcheva, PhD Division of Biostatistics Bureau of Public Health Statistics Death Certificates ICD-10 Codes Literal text for cause of death is sent to the National
Trends in Pneumonia and Influenza Morbidity and Mortality
 Trends in Pneumonia and Influenza Morbidity and Mortality American Lung Association Epidemiology and Statistics Unit Research and Health Education Division November 2015 Page intentionally left blank Introduction
HAEMOPHILUS INFLUENZAE INVASIVE DISEASE
 23 Annual Morbidity Report HAEMOPHILUS INFLUENZAE INVASIVE DISEASE CRUDE DATA 35 Annual Incidence a LA County.37 California b. United States c.2 Age at Diagnosis Mean 4. years Median 36. years Range Birth
Palm Beach County March 19, 2012
 Palm Beach County March 19, 2012 Timeline Dates and Agenda Date January 27, 2012 BMH Advisory Council Meeting Draft Agenda Introduction: Planning and Process Palm Beach County Quantitative Data (Part I)
Pre-Conception & Pregnancy in Ohio
 Pre-Conception & Pregnancy in Ohio Elizabeth Conrey, PhD 1 January 217 1 State Maternal and Child Health Epidemiologist, Ohio Department of Health EXECUTIVE SUMMARY The primary objective of the analyses
alcohol and drug Treatment Services Report Hawai i,
 alcohol and drug Treatment Services Report Hawai i, 2000 2008 EXECUTIVE SUMMARY This report focuses on alcohol and drug treatment services provided by agencies that the Alcohol and Drug Abuse Division
CHILDHOOD ALLERGIES IN AMERICA
 CHILDHOOD ALLERGIES IN AMERICA Severe Allergic Reactions Causing More Emergency Room Visits for U.S. Children PUBLISHED MARCH 13, 2018 ( 2 ) EXECUTIVE SUMMARY In this report, the Blue Cross Blue Shield
DENTAL RELATED VISITS TO HOSPITAL EMERGENCY ROOMS- PAY ME NOW OR PAY ME LATER Oral Health Florida Conference July 31, 2014 Orlando
 Frank Catalanotto, DMD Professor and Chair Department of Community Dentistry and Behavioral Science University of Florida College of Dentistry College of Dentistry DENTAL RELATED VISITS TO HOSPITAL EMERGENCY
New York Medicaid Beneficiaries with Mental Health and Substance Abuse Conditions
 Medicaid institute at united Hospital Fund New York Medicaid Beneficiaries with Mental Health and Substance Abuse Conditions About the Medicaid Institute at United Hospital Fund Established in 2005, the
Flu Watch. MMWR Week 3: January 14 to January 20, and Deaths. Virologic Surveillance. Influenza-Like Illness Surveillance
 Flu Watch MMWR Week 3: January 14 to January 2, 218 All data are provisional and subject to change as more reports are received. Geographic Spread South Carolina reported widespread activity this week.
Influenza Season, Boston
 2017-2018 Influenza Season, Boston Infectious Disease Bureau SLIDE 1 Influenza Surveillance, Boston, 2017-2018 The 2017-2018 influenza season refers to the period between 10/1/2017-5/5/2018. Influenza
Exploring the Relationship Between Substance Abuse and Dependence Disorders and Discharge Status: Results and Implications
 MWSUG 2017 - Paper DG02 Exploring the Relationship Between Substance Abuse and Dependence Disorders and Discharge Status: Results and Implications ABSTRACT Deanna Naomi Schreiber-Gregory, Henry M Jackson
Issue Brief. Eliminating Adult Dental Benefits in Medi-Cal: An Analysis of Impact. Introduction. Background
 Eliminating Adult Dental Benefits in Medi-Cal: An Analysis of Impact Introduction In 2009, California eliminated non-emergency dental services for adults in its Medicaid program, Medi-Cal. The California
Translating Health Services Research in Sickle Cell Disease to Policy
 Translating Health Services Research in Sickle Cell Disease to Policy Jean L. Raphael, MD, MPH Associate Professor of Pediatrics Baylor College of Medicine Director, Center for Child Health Policy and
Outbreak Response/Epidemiology Influenza Weekly Report Arkansas
 Nathaniel Smith, MD, MPH, Director and State Health Officer Outbreak Response/Epidemiology Influenza Weekly Report Arkansas 2018-2019 Week Ending Saturday 10/20/2018 Dirk Haselow, MD, PhD State Epidemiologist,
Community Intervention Pre-crisis Team (CIPT) Report Executive Summary
 Report Executive Summary") Community Intervention Pre-crisis Team (CIPT) Report Executive Summary Data from: January-December 1 TABLE OF CONTENTS Overview... Community Outreach Activity... Community Access Telephone Line Activity...
Community Intervention Pre-crisis Team (CIPT) Report Executive Summary Data from: January-December 1 TABLE OF CONTENTS Overview... Community Outreach Activity... Community Access Telephone Line Activity...
Flu Watch. MMWR Week 4: January 21 to January 27, and Deaths. Virologic Surveillance. Influenza-Like Illness Surveillance
 Flu Watch MMWR Week 4: January 21 to January 27, 218 All data are provisional and subject to change as more reports are received. Geographic Spread South Carolina reported widespread activity this week.
Maryland s Behavioral Health Crisis. The Hospital Perspective
 Maryland s Behavioral Health Crisis The Hospital Perspective Topics to Cover The National Experience Maryland s Experience Hospital Data 2 The National Experience 3 Behavioral and Physical Health are Linked
medicaid and the The Role of Medicaid for People with Diabetes
 on medicaid and the uninsured The Role of for People with Diabetes November 2012 Introduction Diabetes is one of the most prevalent chronic conditions and a leading cause of death in the United States.
PEDIATRIC SUMMARY REPORT, 2014 EMS & TRAUMA REGISTRIES. Texas Department of State Health Services Injury Epidemiology & Surveillance Branch
 PEDIATRIC SUMMARY REPORT, 2014 EMS & TRAUMA REGISTRIES Texas Department of State Health Services Injury Epidemiology & Surveillance Branch 1 Heidi Bojes, PhD Director, Environmental Epidemiology and Disease
UNDERSTANDING NEW HAMPSHIRE DENTAL CLAIMS DATA
 UNDERSTANDING NEW HAMPSHIRE DENTAL CLAIMS DATA Quality Assurance and Preliminary Analysis Institute for Health Policy and Practice at UNH Abbott Willard, MS MPH Jo Porter, MPH Amy Costello, MPH Funding
Spending estimates from Cancer Care Spending
 CALIFORNIA HEALTHCARE FOUNDATION August 2015 Estimating Cancer Care Spending in the California Medicare Population: Methodology Detail This paper describes in detail the methods used by Deborah Schrag,
Community Grants Strategy 2010 Evaluation Findings
 MFH Tobacco Prevention and Cessation Initiative Community Grants Strategy 2010 Evaluation Findings Introduction This report is part of a series developed to provide updates on the progress of the Missouri
Drug Overdose Morbidity and Mortality in Kentucky,
 Drug Overdose Morbidity and Mortality in Kentucky, 2000-2010 An examination of statewide data, including the rising impact of prescription drug overdose on fatality rates, and the parallel rise in associated
Children On Psychotropic Medications
 Children On Psychotropic Medications Considerations for Systematic Care of Children Using Rational Psychopharmacology as Part of an Overall Treatment Strategy Presented to Gabriel Myers Workgroup by Dr.
Alcohol and Drug Treatment Services
 Alcohol and Drug Treatment Services 2000 2003 2006 Provided by the Alcohol and Drug Abuse Division (ADAD) Hawai i Department of Health Provided by the Alcohol and Drug Abuse Division (ADAD) Hawai i Department
HEPATITIS A. Figure 35. Figure 36. Hepatitis A Incidence Rates by Year LAC and US,
 HEPATITIS A CRUDE DATA Number of Cases 839 Annual Incidence a LA County 9.1 California 9. United States 4.9 Age at Onset Mean 27 Median 22 Range months - 97 years Case Fatality LA County.% United States
Mental Illness and Substance Use Hospitalizations in New Hampshire,
 Mental Illness and Substance Use Hospitalizations in New Hampshire, 1997-2006 May, 2008 Part of the Access New Hampshire: Living with Disability in the Granite State Project To learn more about the Access
In each hospital-year, we calculated a 30-day unplanned. readmission rate among patients who survived at least 30 days
 Romley JA, Goldman DP, Sood N. US hospitals experienced substantial productivity growth during 2002 11. Health Aff (Millwood). 2015;34(3). Published online February 11, 2015. Appendix Adjusting hospital
Substance Abuse Treatment/Counseling
 Substance Abuse Treatment/Counseling Pg Service Category Definition - Part A 1 Public Comment re Substance Abuse Block Grant Funds, February 2018 2016 Houston HIV Care Services Needs Assessment Substance
Consultant-led Referral to Treatment (RTT) waiting times collection timetable: outcome of consultation
 waiting times collection timetable: outcome of consultation") Consultant-led Referral to Treatment (RTT) waiting times collection timetable: outcome of consultation Summary Between January and March 2014, NHS England consulted on a proposed change to the timetable
Consultant-led Referral to Treatment (RTT) waiting times collection timetable: outcome of consultation Summary Between January and March 2014, NHS England consulted on a proposed change to the timetable
TRENDS IN PNEUMONIA AND INFLUENZA MORBIDITY AND MORTALITY
 TRENDS IN PNEUMONIA AND INFLUENZA MORBIDITY AND MORTALITY AMERICAN LUNG ASSOCIATION RESEARCH AND PROGRAM SERVICES EPIDEMIOLOGY AND STATISTICS UNIT February 2006 TABLE OF CONTENTS Trends in Pneumonia and
The Burden Report: Cardiovascular Disease & Stroke in Texas
 The Burden Report: Cardiovascular Disease & Stroke in Texas Texas Cardiovascular Health and Wellness Program www.dshs.state.tx.us/wellness Texas Council on Cardiovascular Disease and Stroke www.texascvdcouncil.org
Tarrant County Influenza Surveillance Weekly Report CDC Week 11: Mar 10-16, 2019
 Tarrant County Public Health Division of Epidemiology and Health Information Tarrant County Influenza Surveillance Weekly Report 11: Mar 10-16, 2019 Influenza Activity Code: County and State Levels Tarrant
Seasonality of influenza activity in Hong Kong and its association with meteorological variations
 Seasonality of influenza activity in Hong Kong and its association with meteorological variations Prof. Paul Chan Department of Microbiology The Chinese University of Hong Kong Mr. HY Mok Senior Scientific
Effective Management of Substance Use Disorder Patients in an Emergency Department Setting
 Effective Management of Substance Use Disorder Patients in an Emergency Department Setting Les Sperling, CKF Chief Executive Officer Kim Spencer, CKF Program Director of Medical Services Angela Gamber,
Asthma Burden. in the C HILDREN S H EALTH I NSURANCE PROGRAM Population. Asthma Control Program Pennsylvania Asthma Surveillance System
 Asthma Burden in the C HILDREN S H EALTH I NSURANCE PROGRAM Population Asthma Control Program Pennsylvania Asthma Surveillance System TABLE OF CONTENTS Introduction...1 Methodology...2 Summary...3 Figure
TB Outbreak in a Homeless Shelter
 TB Outbreak in a Homeless Shelter Objectives Epidemiology of Outbreak Population Health Interventions Population Health Goals 2007 One active case identified Less than compliant Prolonged recovery Contact
PHPG. Utilization and Expenditure Analysis for Dually Eligible SoonerCare Members with Chronic Conditions
 PHPG The Pacific Health Policy Group Utilization and Expenditure Analysis for Dually Eligible SoonerCare Members with Chronic Conditions Prepared for: State of Oklahoma Oklahoma Health Care Authority April
Poisoning Death Review Report. Montgomery County, 2017
 Poisoning Death Review Report Public Health Dayton & Montgomery County Prepared by Epidemiology Section Published May 15, 2018 Page 2 of 53 Contents Executive Summary... 5 Number of Drug Overdose... 5
Interpretability of Sudden Concept Drift in Medical Informatics Domain
 Interpretability of Sudden Concept Drift in Medical Informatics Domain Gregor Stiglic, Peter Kokol Faculty of Health Sciences University of Maribor Slovenia Presentation Outline Visualization of Concept
Marijuana Possession Arrests Continue Under Mayor de Blasio
 Marijuana Arrest Research Project For Immediate Release Contact: Loren Siegel (917) 584 0869 May 9, 2014 Marijuana Possession Arrests Continue Under Mayor de Blasio and NYPD Police Commissioner Bratton
Chapter 2: Identification and Care of Patients With CKD
 Chapter 2: Identification and Care of Patients With CKD Over half of patients in the Medicare 5% sample (aged 65 and older) had at least one of three diagnosed chronic conditions chronic kidney disease
Online Supplement to A Data-Driven Model of an Appointment-Generated Arrival Process at an Outpatient Clinic
 Online Supplement to A Data-Driven Model of an Appointment-Generated Arrival Process at an Outpatient Clinic Song-Hee Kim, Ward Whitt and Won Chul Cha USC Marshall School of Business, Los Angeles, CA 989,
Positive Living Conference
 Positive Living Conference Ft. Walton Beach, Thomas Liberti Chief, Bureau of HIV/AIDS Department of Health March 11, 2011 Tallahassee, 1 The Epidemic in, 2010 60% White Population: 18.8 million (4 th 16%
CHS 2009 Baltimore City Community Health Survey: Summary Results Report
 CHS 2009 Baltimore City Community Health Survey: Summary Results Report About the Survey: A representative sample of 1,134 Baltimore residents participated in the Community Health Survey The survey reached
Chapter 2: Identification and Care of Patients With CKD
 Chapter 2: Identification and Care of Patients With Over half of patients from the Medicare 5% sample (restricted to age 65 and older) have a diagnosis of chronic kidney disease (), cardiovascular disease,
FGSZ Zrt. from 28 February 2019 till 29 February 2020 AUCTION CALENDAR: YEARLY YEARLY BUNDLED AT CROSS BORDER POINTS
 AUCTION CALENDAR: YEARLY YEARLY BUNDLED AT CROSS BORDER POINTS FIRM CAPACITY - First Monday of July 01.06.2019* 01.07.2019 07:00 01.10.2019 04:00 01.10.2020 04:00 2019/2020 01.10.2020 04:00 01.10.2021
A SUMMARY REPORT ON NEW JERSEY HOSPITAL READMISSIONS 30 DAYS AFTER CABG SURGERY
 A SUMMARY REPORT ON NEW JERSEY HOSPITAL READMISSIONS 3 DAYS AFTER CABG SURGERY 1999-21 Health Care Quality Assessment Division of Health Care Quality & Oversight December, 24 Introduction This report presents
2014 Hospital Inpatient Discharge Data Annual Report
 2014 Hospital Inpatient Discharge Data Annual Report Health Systems Epidemiology Program Epidemiology and Response Division New Mexico Department of Health 2014 Hospital Inpatient Discharge Data Report
HIV, STDs, and TB: An Overview of Testing Results (1997)
") HIV, STDs, and TB: An Overview of Testing Results (1997) prepared for Delaware Department of Health and Social Services Division of Public Health by Edward C. Ratledge and Anne M. Gurchik Center for Applied
HIV, STDs, and TB: An Overview of Testing Results (1997) prepared for Delaware Department of Health and Social Services Division of Public Health by Edward C. Ratledge and Anne M. Gurchik Center for Applied