Prices. Peru, potential cocaine production (mt), 1994 to Peru, monthly farm-gate prices of sun-dried coca leaf and coca paste (US$/kg)
|
|
|
- Karen Cobb
- 5 years ago
- Views:
Transcription
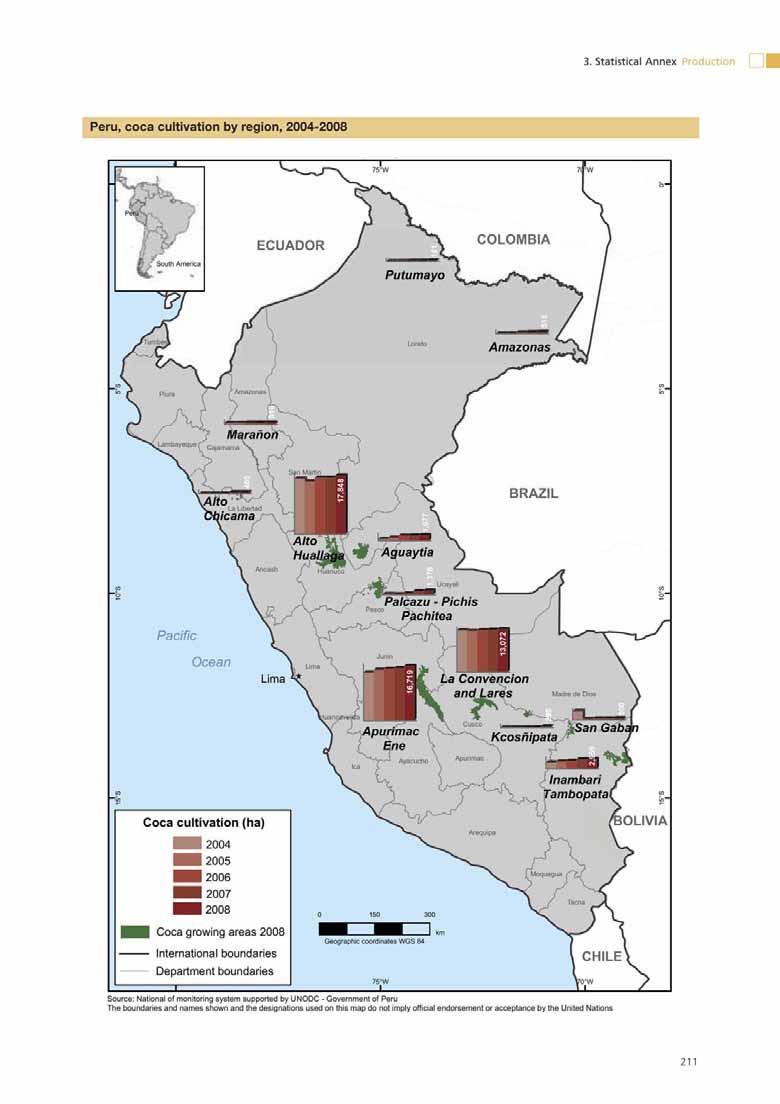
1 World Drug Report 2009 Metric tons Peru, potential cocaine production (mt), 1994 to 2008 Sources: US Dept. of State ( ), National monitoring system supported by UNODC (since 2000) based on conversion rates for coca leaf to cocaine from US Dept. of State Production Note: Production estimates from 2003 to 2005 were revised in 2007 based on updated information available on the amount of coca leaf necessary to produce 1 kg of cocaine. Prices In 2008, prices for coca leaf - which in Peru is traded as sun-dried leaf - coca paste and cocaine all increased compared to 2007, despite increases in coca leaf production. The simple average farm-gate price of sun-dried coca leaf traded outside the Government-controlled market was US$ 3.4/kg, over one third more than in 2007, compared to just US$ 1.7/kg for coca leaf traded under Government control. Wage labour costs for coca harvesting increased noticeably in the main coca cultivation regions, for example in Monzón in Alto Huallaga from under 14 Peruvian soles per day in 2007 to more than 23 soles in Costs of other agricultural inputs such as fertilizer (urea) also went up, which may explain at least partly the price increase in coca leaf. Some farmers produce coca paste, called locally pasta básica de cocaína lavada. Farm-gate prices of coca paste increased by 21% in 2008 and reached US$ 723/kg. Higher prices for precursor chemicals were observed in coca cultivating regions, which may have contributed to the increase. Production costs and price mechanisms for illicit trading and trafficking of coca derivatives are not well understood and are thought to be influenced by the presence of armed groups in coca cultivating regions. However, the proportional price increase in 2008 was smaller the more refined the product, that is largest at the level of the coca leaf (36%) and smallest at the level of cocaine HCl (10%), which may indicate that local factors played a more important role than external ones. Peru, monthly farm-gate prices of sun-dried coca leaf and coca paste (US$/kg) US$/kg (coca leaf) US$/kg (coca paste) 0 Sun-dried coca leaf Coca paste (pasta básica de cocaína lavada) 210
2
3
4 3.2 Seizures A complete set of seizures tables can be found on the UNODC website at: 213
5 3.3 Seizures of illicit laboratories A complete set of seizures tables can be found on the UNODC website at: 214
6 3.4 Prices Opiates: Wholesale, street prices and purity levels Retail prices (street price), US$/gram EUROPE Austria Belgium Denmark Finland France Germany Greece Italy Luxembourg Netherlands Norway 1, Iceland Portugal Spain Sweden Switzerland United Kingdom Ireland verage unweighted in US$ 290 A inflation adjusted 2007 US$ 460 Weighted average in US$ Inflation adjusted in 2007 US$ Weighted average in Euro Adjusted for inflation in 2007 Euro Sources: UNODC ARQ data, EUROPOL and UNODC estimates (in italics) USA - street price Inflation adjusted in 2007 US$ Purity adjusted 1, Purity & inflation adjusted 1,612 1,419 1, Source: ONDCP, The Price and Purity of Illicit Drugs: (Reports prepared by the Institute for Defense Analysis for ONDCP (prices for 1 gram or less, at street purity), ONDCP, ONDCP, The Price & Purity of Illicit Drugs (prices for < 2 grams) for , Community Epidemiology Network - June 2005 (for 2004) and ONDCP (based on STRIDE) for 2005 to Wholesale, US$/kg EUROPE Austria 55,244 46,145 63,000 36,000 37,752 30,491 30,222 28,831 34,565 31,087 25,026 19,553 23,547 33,900 37,260 36,168 37,640 54,810 Belgium 30,000 30,000 28,500 26,600 29,586 32,580 24,307 21,761 20,847 18,557 18,360 20,292 22,229 20,960 23,040 23,336 18,820 20,554 Denmark 110, ,000 85,000 95, , ,805 86, ,465 65,693 61,507 23,585 32,889 20,803 41,770 32,820 37,741 35,967 33,091 Finland 353, , , , , , , , , , ,034 44,840 51,804 51,800 68,314 69,192 69,192 54,810 France 180,000 72,250 80,000 63,750 75,000 66,035 46,603 32,230 25,885 25,596 22,158 26,906 23,547 28,250 31,050 31,450 35,550 27,405 Germany 45,244 36,145 41,667 35,206 36,448 35,256 27,890 25,686 25,608 24,770 20,263 17,816 20,325 21,510 25,723 25,765 22,510 25,810 Greece 90,000 70,000 35,000 28,000 29,536 34,362 39,090 28,775 21,020 20,714 17,320 16,592 17,425 18,650 17,540 14,782 19,450 19,450 Italy 67,500 60, ,000 42,581 47,690 35,786 48,152 37,795 36,459 36,894 31,163 32,979 33,669 29,830 30,109 30,496 28,830 31,676 Luxembourg 86,000 75,000 75,000 49,500 86,000 57,079 59,852 54,786 52,630 50,368 48,000 50,369 50,369 24,700 43,473 44,030 44,030 31,451 Netherlands 23,850 25,000 26,550 23,850 23,850 24,384 20,572 13,810 14,056 16,985 14,703 15,757 29,199 17,730 17,730 18,240 16,625 16,957 Norway 220, , , , ,744 85,000 72,520 62,209 64,918 49,872 44,561 35,874 37,676 48,234 52,790 53,490 53,325 58,235 Portugal 50,000 55,000 46,667 31,500 32,428 43,171 45,902 38,841 30,483 29,339 25,398 31,310 25,839 31,000 34,075 34,512 34,512 20,554 Spain 160, , ,500 91,000 74,418 79,880 84,395 63,880 52,755 53,820 43,596 32,000 41,202 48,420 46,350 47,055 47,371 47,671 Sweden 140, , ,000 95, ,625 62,655 64,829 65,771 63,190 61,022 41,626 33,702 34,738 41,900 31,648 35,970 35,970 37,059 Switzerland 124, , ,875 47,460 52,823 54,850 41,665 37,234 34,294 33,422 29,568 16,082 19,149 22,340 23,580 25,420 21,470 23,180 United Kingdom 53,940 43,940 43,500 43,210 42,500 42,004 34,846 39,491 41,667 29,126 26,718 25,926 30,620 34,340 39,041 33,249 28,320 27,163 Ireland 63,940 53,940 53,500 53,210 52,500 81,479 77,643 36,531 34,396 43,478 37,600 36,441 36,441 30,510 30,510 33,967 33,967 33,967 Average unweighted in US$ 109,029 95, ,120 74,514 77,135 72,094 66,287 52,208 48,019 45,936 37,099 28,784 30,505 32,108 34,415 34,992 34,326 33,167 infl.adj. in US$ 172, , , , ,918 98,084 87,598 67,445 61,082 57,170 44,670 33,699 35,158 36,182 37,775 37,150 35,313 33,167 eighted average in US$ 96,048 W 69,304 79,023 55,551 56,652 52,828 48,491 39,325 36,587 34,398 28,942 25,998 28,574 30,357 32,470 31,902 30,811 30,050 Inflation adj. (kg) in 2007 US$ 152, , ,785 79,710 79,260 71,874 64,081 50,801 46,540 42,810 34,848 30,438 32,933 34,209 35,640 33,869 31,696 30,050 Inflation adj. (gram) in 2007 US$ Weighted in Euro (g) Adjusted for inflation in 2007 Euro (g) Sources: UNODC ARQ data, EUROPOL and UNODC estimates (in italics) USA Average in US$ in kg 162, , , , , , , , , ,000 81,200 59,500 50,750 65,500 68,800 65,000 65,000 71,200 Average in US$ in gram Inflation adj. (g) in 2007US$ Source: UNODC ARQ 215
7 World Drug Report
8 3. Statistical Annex Prices 217
9 World Drug Report
10 3. Statistical Annex Prices 219
11 World Drug Report Cocaine: Wholesale, street prices and purity levels Retail price (street price), US$/gram EUROPE Austria Belgium Denmark Finland France Germany Greece Iceland Italy Luxembourg Netherlands Norway Portugal Spain Sweden Switzerland United Kingdom Ireland Average unweighted in US-$ Inflation adjusted in 2007 US$ Weighted average in US-$ Inflation adjusted in 2007 US-$ Weighted average in Euro Inflation adjusted in 2007 Euro Sources: UNODC ARQ data and EUROPOL; UNODC estimates in italics USA street price in US$ Inflation adjusted in 2007 US$ Purity adjusted (100%) Purity and inflation adjusted Sources: for : Office of National Drug Control Policy, The Price and Purity of Illicit Drugs: Washington, DC, July 2008 and UNODC calculations for 2007 and 2008 based on ONDCP, The Price and Purity of Cocaine (STRIDE data); the purity adjusted price according to the first publication amounted to US$ 122 per gram in 2007 at 64% purity; according to STRIDE dataset (second source) street prices increased 24%, purity adjusted prices rose 72% over period, mainly due to falling purity levels (69% in 2006; 51% in 2008). Wholesale price, US$/kg EUROPE Austria 66,000 66,000 54,000 40,000 41,946 52,084 45,875 56,723 54,440 38,859 47,094 43,995 42,385 59,300 55,894 59,757 50,185 61,661 Belgium 25,000 24,000 38,250 28,000 26,920 30,560 21,927 17,025 19,167 23,859 22,376 26,771 28,111 29,610 32,480 32,480 32,480 47,958 Denmark 80,000 85,000 85,000 82,500 58,516 60,034 46,141 38,640 44,517 78,900 43,462 47,839 37,823 53,160 45,896 50,321 40,520 40,445 Finland 79,500 75,000 62,750 52,500 82,500 95,450 91,750 61,550 89,350 78,460 68,321 59,492 51,804 62,150 68,315 68,315 56,611 61,660 France 117,000 38,250 45,000 38,250 40,000 39,877 48,077 43,554 42,159 27,714 27,000 34,978 37,676 45,200 49,683 50,321 50,190 61,661 Germany 69,000 53,100 60,300 54,142 57,692 54,676 53,925 45,294 41,210 39,639 33,752 33,235 34,476 40,110 44,243 46,525 45,320 48,826 Greece 75,000 90,000 95,000 36,000 46,413 53,098 72,015 43,795 49,180 49,320 41,237 40,359 42,385 53,680 57,446 62,902 62,735 62,735 Italy 54,000 48,000 94,000 41,935 51,097 51,455 55,633 50,629 49,091 47,250 46,000 40,529 41,412 47,440 51,759 52,188 52,920 56,029 Luxembourg 93,919 95, ,521 50, , ,343 47,625 43,103 41,072 47,718 47,718 47,718 47,718 47,718 31,052 31,450 31,450 31,451 Netherlands 26,500 28,000 29,500 26,500 24,680 33,232 23,894 29,698 22,355 27,500 27,500 27,500 27,500 27,400 33,775 33,775 35,000 42,409 Norway 120, , , ,000 39,971 50,000 41,670 60,028 81,699 57,545 51,417 51,569 54,159 56,500 65,209 65,209 56,400 61,661 Portugal 39,500 39,285 33,000 27,000 27,950 34,483 42,591 37,908 33,447 30,000 28,000 29,080 31,046 32,410 36,399 36,399 31,365 34,256 Spain 65,000 60,000 55,000 35,000 36,434 41,322 38,760 36,806 38,924 38,898 30,882 38,898 31,511 38,830 42,167 41,321 41,210 46,274 Sweden 80,000 85,000 91,375 61,450 73,825 55,556 59,255 45,573 50,484 48,508 38,394 34,693 35,763 43,130 39,560 40,068 39,270 51,883 Switzerland 63,900 94, ,250 50,847 72,012 75,949 51,587 40,780 41,152 41,000 35,482 23,392 19,274 37,230 44,008 44,008 41,090 44,351 United Kingdom 47,850 46,475 20,625 43,210 45,000 46,774 40,625 47,500 47,500 33,981 38,168 36,008 35,848 40,880 50,036 50,036 50,943 74,447 Ireland 45,000 45,000 40,000 50,000 45,000 42,000 31,646 33,733 31,530 29,891 29,891 29,891 29,891 30,510 38,557 38,506 39,636 82,214 Average unweighted 67,481 64,312 68,298 48,717 54,562 56,347 47,823 43,079 45,722 43,473 38,629 37,997 36,987 43,839 46,263 47,270 44,549 53,525 inflation adjusted 107,051 97, ,934 69,903 76,336 76,660 63,198 55,651 58,160 54,104 46,512 44,485 42,629 49,400 50,780 50,184 45,829 53,525 Weighted average in US$ 67,793 51,895 57,392 43,998 47,040 48,150 47,754 43,975 43,434 38,491 35,580 36,095 35,950 42,322 46,913 47,772 46,996 55,958 Weighted average in US$ per gram Inflation adjusted in 2007 US$ 107,547 79,002 84,816 63,132 65,812 65,509 63,106 56,809 55,250 47,904 42,841 42,259 41,433 47,690 51,493 50,717 48,347 55,958 Inflation adjusted (gram) Weighted in Euro (g) Inflation adjusted in 2007 Euro (g) Sources: UNODC ARQ, EUROPOL; UNODC estimates in italics US wholesale price 45,430 48,300 48,100 44,730 42,180 38,640 35,700 34,320 31,960 30,870 29,580 21,500 23,000 21,500 22,066 20,500 26,500 31,000 US wholesale price per gram Inflation adjusted in 2007 US$ (g) Sources: ONDCP (prices for gram, at street purity), UNODC ARQ (mid-point of min/max prices). 220
12 3. Statistical Annex Prices 221
13 World Drug Report
14 3. Statistical Annex Prices 223
15 World Drug Report Cannabis: Wholesale, street prices and purity levels 224
16 3. Statistical Annex Prices 225
17 World Drug Report
18 3. Statistical Annex Prices 227
19 World Drug Report
20 3. Statistical Annex Prices 229
21 World Drug Report Amphetamine-type stimulants: Wholesale, street prices and purity levels 230
22 3. Statistical Annex Prices 231
23 World Drug Report
24 3. Statistical Annex Prices 233
25 World Drug Report
26 3.5 Consumption Annual Prevalence Opiates
27 World Drug Report
28 3. Statistical Annex Consumption 237
29 World Drug Report
30 3. Statistical Annex Consumption 239
31 240 World Drug Report Cocaine
32 3. Statistical Annex Consumption 241
33 World Drug Report
34 3. Statistical Annex Consumption 243
35 World Drug Report
36 3. Statistical Annex Consumption Cannabis 245
37 World Drug Report
38 3. Statistical Annex Consumption 247
39 World Drug Report
40 3. Statistical Annex Consumption 249
41 World Drug Report Amphetamine-type stimulants (excluding ecstasy) 250
42 Statistical Annex Consumption
43 World Drug Report
44 3. Statistical Annex Consumption 253
45 World Drug Report
46 Statistical Annex Consumption Ecstasy
47 World Drug Report
48 3. Statistical Annex Consumption 257
49 World Drug Report
50 3. Statistical Annex Consumption 259
51 World Drug Report Treatment demand Primary drugs of abuse among persons treated for drug problems in Africa Country/ Territory Source Treatment Year Cannabis Opiates Cocaine Distribution of main drugs in percentages* Amphetamine - type Stimulants Methaqualone Depressants Inhalants Khat Treatment Provided *** Algeria ARQ 1999/ 2006*** 81.3 % 6.6 % 0.2 % % - 1,436 Botswana SENDU/ 2003/ 2006** % 311 Burkina Faso ARQ % 4.0 % 2.7 % 28.0 % % - 75 Cameroon RAS (1) % 12.1 % 13.6 % % - d Cape Verde ARQ Central African Rep. ARQ % 58 Chad ARQ % % 18.8 % % - 16 Congo ARQ % 41 Côte d'ivoire ARQ % 4.1 % 3.0 % Egypt ARQ % 42.7 % % ,850 a Eritrea ARQ % 11.5 % 7.7 % % - 26 a Ethiopia ARQ % 18.8 % % 64 h Ghana GAP % 0.4 % 1.0 % ,531 Kenya Univ. (2) % 37.8 % 9.7 % 0.5 % % 1.2 % 11.4 % 402 Lesotho SENDU % 54 d Madagascar ARQ % % a Malawi SENDU % 796 Mauritius ARQ % 90.0 % % - 1,235 Mozambique SENDU % 54.7 % 11.4 % a Namibia ARQ 2005/ 2006*** 2.4 % 2.4 % 24.4 % 9.8 % 61.0 % Niger ARQ % % Nigeria Govt % 1.2 % 0.7 % 2.0 % % 3.7 % Sao Tome & Principe ARQ % 5.5 % 72.2 % a, e Senegal GAP % 1.0 % 2.0 % 1.0 % % a Seychelles ARQ % 45.0 % a, d Sierra Leone ARQ % % ,067 b, c South Africa ARQ % 20.3 % 17.3 % 24.4 % 4.2 % ,813 b Swaziland SENDU % 0.9 % 0.9 % % 0.9 % Tanzania SENDU % 32.7 % Togo ARQ % 4.3 % 4.9 % % e Tunisia ARQ f Zambia ARQ Total 151,194 Average (unweighted) 62.8 % 16.5 % 7.2 % 5.1 % 2.9 % 1.9 % 6.0 % 3.1 % Data primarily reflect (codes) * Note that treatment definitions and reporting differ from country to country; totals which exceed 100% represent poly-drug use reporting. a Geographically limited reporting (eg the Capital city) ** Figures may reflect number of persons or treatment episodes depending on Member State; figures exclude alcohol and nicotine. b Publicly funded treatment *** The second year specified is for the number of people treated (last column). c NGO/ privately funded treatment (1) Proxy: drugs locally consumed, based on key informants from social services (health affairs), from traditional healers, and repression. d Inpatient/ hospitalization modality (2) Proxy: cohort of abusers identified from rehabilitation centres, treatment centres, hospitals, streets, and drug dens within 5 urban areas. e Outpatient modality f Limited subpopulation (eg prison, youth, etc) Sources: UNODC, Annual Reports Questionnaires (ARQ) and Field Office (FO) data, Southern African Development g Opioid substitution treatment (eg methadone) Community Epidemiology Network on Drug Use (SENDU), International Psychology Reporter, h First-time treatment entrants (not returning clients) UNODC Global Assessment Programme on Drug Abuse (GAP) i Treatment admissions (not persons) Data Primarily Reflect 260
52 3. Statistical Annex Consumption Primary drugs of abuse among persons treated for drug problems in America Cocaine Group Amphetamine-type stimulants Sum of all Cocaine Cocaine Basuco Crack Amphetamines Ecstasy Inhalants Tranquilizers Country/ Territory Sources Treatment Year Cannabis Opiates Argentina ARQ % 0.5% 51.2% 51.2% 14.0% 0.5% 0.4% 7.3% 2,434 a Treatment Provided ** Data Primarily Reflect Bahamas ARQ % 40.3% 40.3% 647 b, d, e Barbados SIDUC/ARQ 1998/ 2006*** 27.8% 72.3% 5.6% 66.7% 111 Bolivia SIDUC/ARQ 1998/ 2005*** 14.7% 54.9% 23.1% 31.8% 1.4% 23.5% 14,396 Brazil ARQ ,000 CAMH/ DATIS 30.7% 15.9% 40.4% 40.4% 2.8% 3.3% 0.6% 3.6% 66,062 a (Ontario) Canada (Ontario) 2008 Chile ARQ % 0.1% 73.3% 73.3% 2.7% 3.40% 4.4% 7,750 d, e Colombia SIDUC % 56.3% 28.1% 28.2% 3.6% 4.8% Costa Rica ARQ % 0.1% 62.4% 62.4% 1.4% 5.0% 14,899 d, e Dominican Rep. ARQ % 5.9% 75.1% 40.0% 35.1% 0.1% 0.7% 7,590 d, e Ecuador ARQ % 4.2% 55.5% 55.5% 0.4% 3,550 d, e El Salvador ARQ 2004/ 2006*** 13.8% 63.8% 17.2% 46.6% 10,720 d, e Grenada ARQ % 40.0% 40.0% 250 a Guatemala ARQ % 36.8% 42.1% 21.1% 3,000 d, e Haiti ARQ/ Govt. 2002/ 2007*** 35.4% 2.1% 37.5% 37.5% 6.3% 27 Honduras SIDUC/ ARQ 1998/ 2006*** 34.4% 9.0% 3.1% 5.9% 9.0% 7,500 Jamaica ARQ % 43.0% 43.0% 349 a Mexico ARQ % 16.7% 37.1% 37.1% 26.2% 7.5% 41,005 b Nicaragua SIDUC/ Govt. 1998/ 2004*** 7.3% 77.3% 14.5% 62.8% 12.7% 1,502 d, e Panama SIDUC/ Govt. 1998/ 2006*** 5.1% 49.4% 48.9% 0.5% 0.5% 992 d, e Peru ARQ 2005/ 2006*** 31.1% 0.3% 67.0% 67.0% 0.3% 1.4% 35,482 a St. Lucia ARQ % 82.5% 82.5% 40 d St. Vincent & Grenadines ARQ/ Govt. 2004/ 2005*** 75.3% 24.7% 24.7% 196 d Trinidad & Tobago ARQ/ Govt. 2006/ 2006*** 48.8% 51.1% 51.1% 861 d, e Uruguay SIDUC/ ARQ 1998/ 2006*** 12.2% 46.4% 46.4% 0.6% 9.2% 9,159 a USA Govt. (TEDS) % 29.5% 23.0% 23.0% 14.4% 0.1% 0.7% 1,406,000 b (TEDS) Venezuela ARQ/ Govt % 0.4% 27.6% 19.2% 4.5% 3.9% 0.2% 0.1% 1.1% 0.6% 1,992 a, b, c Total 2,486,514 Total North America 23.3% 20.7% 33.5% 14.5% 3.3% 2.7% 2.2% 1,513,067 Total South America 33.2% 1.7% 52.1% 4.8% 5.1% 8.1% 3.2% 973,447 Average (unweighted) 32.0% 6.9% 49.9% 6.9% 4.8% 6.8% 2.8% Data primarily reflect (codes) * Note that treatment definitions and reporting differ from country to country; totals which exceed 100% represent poly-drug use reporting. a Geographically limited reporting (eg the Capital city) ** Figures may reflect number of persons or treatment episodes depending on Member State; figures exclude alcohol and nicotine. b Publicly funded treatment *** The second year specified is for the number of people treated (last column). c NGO/ privately funded treatment d Inpatient/ hospitalization modality Sources: UNODC Annual Reports Questionnaires data (ARQ); SIDUC, Treatment Centres Data 1998, Drug of impact; SIDUC 1997 Report; e Outpatient modality Substance Abuse and Mental Health Services Administration (SAMHSA), Treatment episode dataset TEDS, USA; Canadian Community f Limited subpopulation (eg prison, youth, etc) Epidemiology Network on Drug Use (CCENDU), Morbidity Statistics 2000/2001 (separations related to illicit drug use) g Opioid substitution treatment (eg methadone) h First-time treatment entrants (not returning clients) i Treatment admissions (not persons) 261
53 World Drug Report Primary drugs of abuse among persons treated for drug problems in Asia Distribution of main drug in percentages* Amphetamine-type stimulants Amphetamines- Group Ecstasy-Group Inhalants Sedatives Treatment Provided ** Country/ Territory Source Treatment Year Cannabis Opiates Cocaine Afghanistan ARQ ,660 a Armenia ARQ 2006/ 2007*** % 1.5% d Azerbaijan ARQ / UNODC Est % 75.0% % - Bahrain ARQ % ,488 f Bangladesh ARQ % 82.9% ,377 a Brunei Darussalam UNODC FO (DAINAP)/ARQ % China UNODC FO (DAINAP)/ARQ % - 0.6% 6.2% - 3.3% 105,151 Cambodia Govt./ UNODC % 0.1% % 0.3% 9.7% 0.3% 1,719 f Georgia ARQ % 1,092 d, e Hong Kong SAR, China Govt/ARQ 2004/ 2007*** 4.2% 72.5% - 3.9% ,893 d, e India ARQ 2004/ % 61.3% 1.5% 0.2% 0.9% 4.1% 81,802 d, e Indonesia ARQ % 97.2% - 1.8% % 3,777 d, e Iran Govt % 83.4% 0.2% 2.6% 0.1% ,109 Israel ARQ ,000 Japan Govt % % % d Jordan ARQ % % - 6% - 85 Kazakhstan ARQ % 94.7% - 0.1% - 3.1% - 9,728 d, e Kuwait ARQ % 31.1% 4.0% 19.1% 1.0% 16.0% 908 d, f Kyrgyzstan ARQ % 77.3% d, e Lao PDR ARQ % - 7.7% ,423 Lebanon ARQ / UNODC Est. 2004/ 2006*** 32.0% 57.0% 4.0% 0.5% - 6.0% 1,124 d Macau SAR, China ARQ % % - 1.5% 358 d, e Malaysia AMCEWG/ ARQ 2005/ 2007*** 15.4% 68.3% % 1.2% - - 7,135 b Maldives ARQ % 87.0% d, e Mongolia ARQ % 71.4% Myanmar UNODC FO (DAINAP)/ ARQ 2007/ 2007*** 5.9% 91.7% - 2.4% ,246 b, f Nepal AMCEWG/ARQ 1994/ 2006*** 5.4% 87.2% a Oman ARQ % f Pakistan ARQ % 49.0% ,000 a Philippines UNODC FO (DAINAP) % % 1.4% 5.0% 0.6% 4,287 Qatar ARQ 1997/ 2007*** 5.1% 25.4% - 1.7% % - 94 a, d Korea, Rep. ARQ % 0.5% 0.5% 82.8% 0.5% 355 d Saudi Arabia Govt./ Univ % 7.5% % - 0.7% 5.5% 1,059 a, d Singapore UNODC FO (DAINAP) % 56.3% % 6.9% % 504 d, e Syria ARQ % 94.9% 0.9% % 674 Sri Lanka ARQ % ,413 f Taiwan, Prov. of China NBCD Taiwan (POC) Health % 69.9% 0.1% 25.1% 0.5% 0.3% 2.8% 18,776 d Tajikistan ARQ 2004/ 2007*** % a, d Thailand UNODC FO (DAINAP) % 4.7% 0.04% 79.8% 1.0% 4.6% - 58,030 d, e Turkmenistan ARQ % 96.7% ,720 d, e United Arab Emirates ARQ Uzbekistan ARQ 2004/ 2007*** 16.8% 78.8% % 0.6% 6,676 b Viet Nam AMCEWG/ ARQ 2001/ 2007*** % - 2.0% ,000 Total 449,700 Average (unweighted) 10.0% 64.6% 0.3% 17.2% 0.6% 1.5% 1.8% Data Primarily Reflect 262
54 3. Statistical Annex Consumption Primary drugs of abuse among persons treated for drug problems in Europe Country/ Territory Source Amphetamine-type stimulants Treatment Year Cannabis Opiates Cocaine Amphetamines Ecstasy Hallucinogens Albania ARQ % 82.9% 5.7% 2,140 d, e Andorra ARQ Austria EMCDDA % 65.8% 6.3% 5,603 d, e Belarus ARQ % 63.2% 0.05% 3.6% 1.2% 3.0% 12.3% 2,532 d Belgium ARQ % 44.2% 13.0% 11.8% 1.7% 3,662 Bosnia & Herzegovina ARQ % 48.3% 0.7% 1.7% 1.0% 653 a Bulgaria ARQ % 98.5% 0.1% 0.5% 0.1 % 2,185 a Croatia ARQ % 77.7% 2.0% 3.2% 1.6% 2.0 % 7,464 b, d, e Cyprus ARQ % 56.7% 13.3 % 1.4 % 0.8 % 720 a Czech Rep. ARQ % 25.5% 0.1% 58.6 % 0.1 % 0.7 % 0.7 % 1.5 % 8,164 d, e Denmark ARQ % 53.4% 5.8% 7.9% 1.1% 0.1% 1.4 % 5,426 b, d, e Estonia EMCDDA % 5.8% 1,339 Finland EMCDDA % 56.1% 23.2% 4,865 a France ARQ % 49.4% 7.5% 0.3% 1.1% 79,600 b Germany EMCDDA/ ARQ 2006/ 2006*** 29.6% 49.8% 6.9% 6.2% 0.2% 42,638 e Greece ARQ % 87.7% 2.6% 0.1% 1.2 % 4,508 b, e Macedonia, FYR ARQ % 98.7% 902 a, d, e Hungary ARQ % 18.6% 1.9% 5.8% 2.1 % 31.7 % 13,457 a, d, e Iceland ARQ % 2.8% 16.7% 38.9 % 11.1 % 1,800 a Ireland Govt % 63.9% 10.7% 0.6% 1.8% 1.8 % 0.4 % 12,744 b Italy ARQ % 72.3% 14.0% 0.2% 0.5% 0.6 % 171,353 b Latvia ARQ % 70.7% 0.4% 16.7 % 4.9 % 635 d Liechtenstein ARQ % 15.6% 3.1 % 32 Lithuania ARQ % 80.8% 0.2% 2.6 % 0.1 % 1.1 % 2.6 % 5,715 d Luxembourg ARQ/ EMCDDA 2003/ 2006*** 8.0% 76.0% 11.0% 1,901 e, d Malta EMCDDA % 76.0% 8.0% 3.0 % 0.2 % 2,121 e Moldova ARQ/ UNODC 2004/ 2006**** 51.8 % 39.1% 3.8 % 5,327 Netherlands ARQ % 42.8% 31.2% 3.9% 0.7% 30,766 e Northern Ireland Govt % 12.1% 10.1% 4.0% 31.3 % 1,984 a Norway Focal Point EMCDDA % 52.0% 1.0 % 15.0 % 0.1 % 3,003 i Poland ARQ/ UNODC 2003/ 2006*** 3.0 % 23.3% 0.9% 8.9 % 0.6 % 10.1 % 2.7 % 13,198 d Portugal ARQ/ Focal Point EMCDDA 2004/ 2007*** 5.0% 63.0% 25.0% 1.0 % 34,266 d, e Romania ARQ % 93.0% 0.5% 0.2 % 1,893 d Russian Federation UNODC 2006/ 2007*** 6.0 % 89.0% 0.06% 1.0 % 356,188 b Scotland Govt % 68.6% 7.2% 2.1 % 0.9 % 5.4 % 12,562 a Slovakia ARQ % 51.1% 1.3% 26.8 % 1.0 % 1,927 d, e Slovenia EMCDDA % 91.1% 1.3% 0.1 % 0.2 % 3,000 e Spain ARQ % 39.3% 46.9% 0.8% 0.5% 0.1% 1.2 % 50,630 d, e Sweden ARQ % 28.0% 3.1% 40.6% 0.2% 8.3 % 6,962 d, e Switzerland Govt./ ARQ 2003/ 2007*** 14.2 % 43.9% 25.4% 0.5 % 0.8 % 0.3 % 3.0 % 20,000 d, e Turkey ARQ % 41.9% 3.8% 0.04 % 3.9 % 2.1 % 10.6 % 2,853 d Ukraine ARQ % 41,208 England & Wales Govt % 68.9% 11.1% 3.0% 0.5% 0.1 % 1.1 % 0.3 % 195,464 a, d, e Total Europe 1,163,809 Hypnotics and Sedatives Inhalants/ Solvents Treatment Provided ** Data Primarily Reflect Total East Europe 470,780 Total West Europe 693,029 Average (unweighted) Europe 19.5% 59.7% 8.4% 9.3% 1.6% 0.4% 5.1% 4.4% Average (unweighted) East Europe 16.6% 67.1% 1.3% 8.7% 1.4% 0.7% 6.4% 5.8% Average (unweighted) West Europe 21.6% 53.3% 13.3% 9.9% 1.7% 0.2% 4.4% 0.4% 263
55 World Drug Report Primary drugs of abuse among persons treated for drug problems in Oceania Distribution of main drugs in percentages* Data Amphetamine-type stimulants Treatment Primarily Country/ Territory Source Treatment Year Cannabis Opiates Cocaine Amphetamines Ecstasy Hallucinogens Sedatives Provided ** Reflect Australia Govt. 2006/2007*** 40.7% 21.8% 0.6% 22.0% 1.3% 3.0% 78,545 b New Zealand ARQ 2005/2007**** 53.2% 30.8% 0.2% 15.0% 0.9% 20,000 b Total 98,545 Average (unweighted) 47.0% 26.3% 0.4% 18.5% 1.3% 3.0% Data primarily reflect (codes) * Note that treatment definitions and reporting differ from country to country; totals which exceed 100% represent poly-drug use repo a Geographically limited reporting (eg the Capital city) ** Figures may reflect number of persons or treatment episodes depending on Member State; figures exclude alcohol and nicotine. b Publicly funded treatment *** Data for Australia refer to closed drug related treatment episodes over the July 2006-June 2007 period. c NGO/ privately funded treatment **** The second year specified is for the number of people treated (last column). d Inpatient/ hospitalization modality Source: UNODC, Annual Reports Questionnaire (ARQ) data e Outpatient modality f Limited subpopulation (eg prison, youth, etc) g Opioid substitution treatment (eg methadone) h First-time treatment entrants (not returning clients) i Treatment admissions (not persons) 264
56 3. Statistical Annex Consumption 3.6 Youth and school surveys Heroin HEROIN use amongst young people (ordered alphabetically by regions) Life-time Annual Last month Coverage (age/grade) % of young people who ever used % of young people who used at least once in the past year % of young people who used at least once in the past month Region Subregion Country/ Territory AFRICA East Africa Mauritius ARQ Year of Estimate Source Notes AFRICA Southern Africa South Africa ARQ AMERICAS Caribbean Antigua & Barbuda Secondary/ High School OAS (MEM) Bahamas ARQ Barbados ARQ Barbados Students (ages 13, 15, and 17) OAS (MEM) Students (ages 13, 15, and Dominica 17) OAS (MEM) Haiti ARQ Jamaica Ages OAS St. Vincent & Grenadines Students (ages 13, 15, and 17) OAS (MEM) Trinidad & Tobago ARQ AMERICAS Central America Belize ARQ El Salvador ARQ Guatemala ARQ Honduras ARQ Panama ARQ AMERICAS North America Canada ARQ Select regions (Cape Town) 265
57 World Drug Report 2009 Mexico ARQ Select regions USA Grade ARQ AMERICAS South America Argentina ARQ Bolivia ARQ Grades 7, 9 and OAS (MEM) Colombia Ecuador ARQ Guyana ARQ Paraguay Peru Suriname Youth (undefined) ARQ Ages not specified Students (ages 13-17) OAS (MEM) Secondary/ High School OAS (MEM) Uruguay ARQ Venezuela ARQ ASIA Central Asia and Transcaucasian countries Armenia ESPAD Georgia ARQ Kyrgyzstan ARQ ASIA East and South-East Asia Hong Kong SAR, China ARQ Macau SAR, China ARQ Myanmar ARQ Thailand ARQ ASIA Near and Middle East /South-West Asia Israel ARQ Jordan ARQ Lebanon ARQ Oman ARQ ASIA South Asia Bangladesh ARQ EUROPE East Europe Belarus ARQ Russian Federation ARQ Ukraine ESPAD EUROPE Southeast Europe Albania ARQ Bulgaria ARQ 266
58 3. Statistical Annex Consumption Croatia ARQ Romania ESPAD Turkey ESPAD EUROPE West & Central Europe Austria ESPAD Select regions (Flanders) Belgium ESPAD Cyprus ESPAD Czech Rep Govt./ ESPAD Heroin and opiates Denmark ARQ Estonia ARQ Faroe Isl ESPAD Finland ESPAD France ESPAD Germany ARQ Select regions Gibraltar ARQ Greece ESPAD Greenland ESPAD Hungary ARQ Iceland ESPAD Ireland ESPAD Isle of Man ESPAD Italy ESPAD Latvia ARQ Liechtenstein ARQ Lithuania ESPAD Luxembourg ARQ Malta ARQ Monaco ESPAD Netherlands ESPAD Norway ESPAD Poland ARQ Select regions (Budapest) 267
59 World Drug Report 2009 Portugal ESPAD Slovakia ARQ Slovenia ESPAD Spain ARQ Sweden ESPAD Switzerland ESPAD United Kingdom ESPAD OCEANIA Oceania Australia ARQ 268
60 3. Statistical Annex Consumption Cocaine COCAINE (unless otherwise noted) amongst young people (ordered alphabetically by regions) Region Subregion Country/ Territory Coverage (ag % of young people who ever used % of young people who used at least once in the past year % of young people who used at least once in the past month Year of Estimate Source Notes AFRICA Southern Africa South Africa ARQ Cocaine, any (HCl and/ or Crack); Select regions (Cape Town) AFRICA West and Central Africa Ghana ARQ Cocaine, any (HCl and/ or Crack) Secondary/ AMERICAS Caribbean Antigua & Barbuda High School OAS (MEM) Ages not specified Secondary/ Antigua & Barbuda High School OAS (MEM) Crack Bahamas ARQ Crack Bahamas ARQ Barbados Barbados Dominica Dominica Students (ages 13, 15, and 17) OAS (MEM) Crack Students (ages 13, 15, and 17) OAS (MEM) Students (ages 13, 15, and 17) OAS (MEM) Crack Students (ages 13, 15, and 17) OAS (MEM) Dominican Rep ARQ Dominican Rep ARQ Crack Dominican Rep ARQ Secondary/ High School OAS (MEM) Grenada Haiti ARQ Crack Cocaine, any (HCl and/ or Crack) 269
61 World Drug Report 2009 Haiti ARQ Jamaica Ages OAS Crack Jamaica Ages OAS St. Lucia St. Vincent & Grenadines St. Vincent & Grenadines Trinidad & Tobago Students (ages 13, 15, and 17) OAS (MEM) Students (ages 13, 15, and 17) OAS (MEM) Crack Students (ages 13, 15, and 17) OAS (MEM) Students (ages 13, 15, and 17) OAS (MEM) Crack Students (ages 13, 15, and Trinidad & Tobago 17) OAS (MEM) Turks & Caicos Isl ARQ Crack Turks & Caicos Isl ARQ Crack; Limited AMERICAS Central America Belize ARQ geography Belize ARQ Limited geography Belize ARQ Costa Rica Grades 7, 9 and 11 (ages 13-17) OAS (MEM) Crack Grades 7, 9 and 11 (ages Cocaine, any (HCl and/ or Crack); Limited geography Costa Rica 13-17) OAS (MEM) Cocaine, any (HCl and/ El Salvador ARQ or Crack) El Salvador ARQ Crack El Salvador ARQ Large cities Guatemala ARQ Crack Guatemala ARQ 270
62 3. Statistical Annex Consumption Secondary/ High School OAS (MEM) Crack Honduras Honduras ARQ Crack Secondary/ Honduras High School OAS (MEM) Honduras ARQ Nicaragua ARQ Crack Nicaragua ARQ Cocaine, any (HCl and/ or Crack); Limited AMERICAS North America Canada ARQ geography Cocaine, any (HCl and/ or Crack); Selecr Mexico ARQ regions Mexico ARQ Crack; Select regions Cocaine, any (HCl and/ USA Grade ARQ or Crack) USA Grade ARQ Crack USA Grade ARQ AMERICAS South America Argentina ARQ Crack Argentina ARQ Bolivia ARQ Crack Bolivia CICAD/ OAS Brazil CICAD/ OAS Chile Grades OAS (MEM) Crack Chile CICAD/ OAS Colombia CICAD/ OAS Ecuador ARQ Crack Ecuador CICAD/ OAS Guyana ARQ Cocaine, includes coca paste Crack; Limited Geography Guyana ARQ Limited geography Paraguay CICAD/ OAS Paraguay Students (undefined) OAS (MEM) Crack; Ages not specified 271
63 World Drug Report 2009 Students (ages 13-17) OAS (MEM) Crack Peru Peru CICAD/ OAS Secondary/ High School OAS (MEM) Suriname Secondary/ Suriname High School OAS (MEM) Crack Uruguay ARQ Limited geography Venezuela ARQ Crack Venezuela ARQ ASIA Central Asia and Transcaucasian countries Armenia ESPAD ASIA East and South-East Asia Hong Kong SAR, China ARQ Thailand Youth (undefined) ARQ Cocaine, any (HCl and/ or Crack) Cocaine, any (HCl and/ or Crack); Ages not specified ASIA Near and Middle East /South-West Asia Israel ARQ Crack Israel ARQ Cocaine, any (HCl and/ or Crack); Rapid Assessment Lebanon ARQ Cocaine, any (HCl and/ or Crack); Limited EUROPE East Europe Belarus ARQ geography Crack; Limited Belarus ARQ geography Belarus ARQ Limited geography Russian Federation ARQ/ ESPAD Crack Russian Federation ARQ Ukraine ESPAD Crack Ukraine ESPAD EUROPE Southeast Europe Albania ARQ Albania ARQ Bulgaria ARQ Cocaine, any (HCl and/ or Crack) Cocaine, any (HCl and/ or Crack) 272
64 3. Statistical Annex Consumption Cocaine, any (HCl and/ Croatia ARQ or Crack) Croatia ARQ Crack Romania ESPAD Crack Romania ESPAD Turkey ARQ Cocaine, any (HCl and/ or Crack) EUROPE West & Central Europe Austria ESPAD Crack Austria ESPAD Select regions (Flanders) Belgium ARQ Crack; Select regions Belgium ARQ (Flanders) Cyprus ESPAD Crack Cyprus ESPAD Czech Rep ESPAD Crack Czech Rep Govt./ ESPAD Denmark ARQ Estonia ARQ Crack Estonia ARQ Cocaine, any (HCl and/ or Crack) Faroe Isl ESPAD Crack Faroe Isl ESPAD Finland ESPAD Crack Finland ESPAD France ESPAD Crack France ESPAD Germany ARQ Crack; Select regions Germany ARQ Select regions Greece ESPAD Crack Greece ESPAD Greenland ESPAD Crack; Select regions (Budapest) Hungary ARQ Select regions Hungary ARQ (Budapest) Iceland ESPAD Crack 273
65 World Drug Report 2009 Iceland ESPAD Ireland ESPAD Crack Ireland ESPAD Isle of Man ESPAD Crack Isle of Man ESPAD Italy ESPAD Crack Italy ESPAD Latvia ARQ Crack Latvia ARQ Cocaine, any (HCl and/ or Crack) Liechtenstein ARQ Cocaine, any (HCl and/ Lithuania ESPAD or Crack) Lithuania ESPAD Crack Luxembourg ARQ Malta ARQ Crack Malta ARQ Monaco ESPAD Crack Monaco ESPAD Netherlands ESPAD Crack Netherlands ESPAD Norway ESPAD Crack Norway ESPAD Poland ARQ Crack Poland ARQ Portugal ESPAD Crack Portugal ESPAD Slovakia ARQ Slovakia ARQ Crack Slovenia ESPAD Crack Slovenia ESPAD Spain ARQ Spain ARQ Crack Spain ARQ Sweden ESPAD Crack Sweden ESPAD Switzerland ESPAD Crack Switzerland ESPAD United Kingdom ESPAD Crack United Kingdom ESPAD Cocaine, any (HCl and/ or Crack) Cocaine, any (HCl and/ or Crack) OCEANIA Oceania Australia ARQ Cocaine, any (HCl and/ or Crack) 274
66 3. Statistical Annex Consumption Cannabis CANNABIS use (unless otherwise noted) amongst young people (ordered alphabetically by regions) Region Subregion Country/ Territory Coverage (age/grade) Life-time Annual Last month % of young people who ever used % of young people who used at least once in the past year % of young people who used at least once in the past month Year of Estimate Source Notes AFRICA East Africa Ethiopia Youth (undefined) ARQ Ages not specified Kenya Govt. Madagascar ARQ Mauritius ARQ Seychelles ARQ AFRICA North Africa Algeria ARQ Students and nonstudents Egypt ARQ Morocco MedSPAD Select regions (Rabat) AFRICA Southern Africa South Africa ARQ AFRICA West and Central Africa Ghana ARQ AMERICAS Caribbean Antigua & Barbuda Secondary/ High School OAS (MEM) Bahamas ARQ Students (ages 13, 15, and 17) OAS (MEM) Barbados Students (ages 13, Dominica 15, and 17) OAS (MEM) Dominican Rep ARQ Grenada Secondary/ High School OAS (MEM) Select regions (Cape Town) Haiti ARQ Cannabis resin Haiti ARQ Jamaica Ages OAS St. Lucia Students (ages 13, 15, and 17) OAS (MEM) 275
67 World Drug Report 2009 St. Vincent & Grenadines Trinidad & Tobago Students (ages 13, 15, and 17) OAS (MEM) Students (ages 13, 15, and 17) OAS (MEM) Turks & Caicos Isl ARQ AMERICAS Central America Belize ARQ Select regions Grades 7, 9 and 11 Costa Rica (ages 13-17) OAS (MEM) El Salvador ARQ Guatemala ARQ Secondary/ High Honduras School OAS (MEM) Nicaragua ARQ AMERICAS North America Canada ARQ Mexico ARQ Select regions USA Grade ARQ AMERICAS South America Argentina ARQ Bolivia CICAD/ OAS Brazil CICAD/ OAS Chile CICAD/ OAS Colombia CICAD/ OAS Ecuador CICAD/ OAS Guyana ARQ Paraguay CICAD/ OAS Peru CICAD/ OAS Suriname Secondary/ High School OAS (MEM) Uruguay ARQ Venezuela Govt. ASIA Central Asia and Transcaucasian countries Armenia ESPAD Azerbaijan ARQ Georgia ARQ Kazakhstan ARQ Kyrgyzstan ARQ ASIA East and South-East Asia Hong Kong SAR, China ARQ Japan ARQ Korea, Rep ARQ Select regions Macau SAR, China ARQ 276
68 3. Statistical Annex Consumption Myanmar ARQ Thailand Youth (undefined) ARQ Ages not specified ASIA Near and Middle East /South-West Asia Israel ARQ Jordan ARQ Lebanon ARQ ASIA South Asia Bangladesh ARQ India ARQ Nepal (blank) ARQ EUROPE East Europe Belarus ARQ Russian Federation ARQ/ ESPAD Ukraine ESPAD EUROPE Southeast Europe Albania ARQ Bulgaria ARQ Croatia ARQ Romania ESPAD Turkey ARQ EUROPE West & Central Europe Austria ESPAD Cannabis resin; Rapid Situation Assessment Belgium ESPAD Select regions (Flanders) Cyprus ESPAD Czech Rep Govt./ ESPAD Denmark ARQ Estonia ARQ Finland ARQ France ESPAD Germany ARQ Select regions Greece ESPAD Hungary ARQ Iceland ESPAD Ireland ESPAD Italy ESPAD Latvia ARQ Liechtenstein ARQ Lithuania ESPAD Luxembourg ARQ Malta ARQ 277
69 World Drug Report 2009 Monaco ESPAD Netherlands ESPAD Norway ESPAD Poland ARQ Portugal ESPAD Slovakia ARQ Slovenia ESPAD Spain ARQ Sweden ESPAD Switzerland ESPAD United Kingdom ESPAD OCEANIA Oceania Australia ARQ 278
70 3. Statistical Annex Consumption Amphetamine-type stimulants Region Subregion Country/ Territory AMPHETAMINES-GROUP use (unless otherwise noted) amongst young people (ordered alphabetically by regions) Coverage (age/grade) Life-time Annual Last month % of young people who ever used % of young people who used at least once in the past year % of young people who used at least once in the past month AFRICA Southern Africa South Africa ARQ Year of Estimate Source Notes Methamphetamine; Cape Town Amphetamines (inclds. West and Central Africa Ghana ARQ non-ats stimulants) Ghana ARQ Methamphetamine AMERICAS Caribbean Antigua & Barbuda AMERICAS Central America Costa Rica Secondary/ High School OAS (MEM) Stimulants (inclds Amphetamines) Bahamas ARQ Methamphetamine Bahamas ARQ Ages 13, 15, and OAS (MEM) Barbados Ages 13, 15, Dominica and OAS (MEM) Dominican Rep ARQ Stimulants (inclds Amphetamines) Stimulants (inclds Amphetamines) Secondary/ High Stimulants (inclds Grenada School OAS (MEM) Amphetamines) Secondary/ High Stimulants (inclds Haiti School OAS (MEM) Amphetamines) Stimulants (inclds Jamaica Ages OAS Amphetamines) Ages 13, 15, Stimulants (inclds St. Lucia and OAS (MEM) Amphetamines) Ages 13, 15, Stimulants (inclds St. Vincent & Grenadines and OAS (MEM) Amphetamines) Ages 13, 15, Stimulants (inclds Trinidad & Tobago and OAS (MEM) Amphetamines) Turks & Caicos Isl ARQ Methamphetamine Grades 7, 9 and 11 (ages 13-17) OAS (MEM) 279
71 World Drug Report 2009 El Salvador ARQ Methamphetamine El Salvador ARQ Guatemala ARQ Amphetamine Stimulants (inclds Amphetamines) Honduras OAS (MEM) AMERICAS North America Canada ARQ Amphetamine Amphetamine; Select Mexico ARQ regions Methamphetamine; Mexico ARQ Select regions USA Grade ARQ Methamphetamine USA Grade ARQ Amphetamine AMERICAS South America Argentina CICAD/ OAS Bolivia CICAD/ OAS Brazil CICAD/ OAS Chile CICAD/ OAS Colombia CICAD/ OAS Ecuador CICAD/ OAS Guyana ARQ Methamphetamine Guyana ARQ Paraguay CICAD/ OAS Peru CICAD/ OAS Secondary/ High School OAS (MEM) Suriname Uruguay ARQ Stimulants (inclds Amphetamines) Venezuela ARQ Amphetamine ASIA Central Asia and Transcaucasian countries Armenia ESPAD Youth (undefined) ARQ Ages not specified Kazakhstan Youth Amphetamine; Ages Kazakhstan (undefined) ARQ not specified ASIA East and South-East Asia Hong Kong SAR, China Methamphetamine Hong Kong SAR, China Japan ARQ Methamphetamine 280
72 3. Statistical Annex Consumption Myanmar ARQ Youth (undefined) ARQ Methamphetamine; Yangon Methamphetamine; Ages not specified Thailand ASIA Near and Middle East /South-West Asia Israel ARQ Amphetamine Jordan ARQ Unversity students Rapid Situation Lebanon ARQ Assesment EUROPE East Europe Russian Federation ARQ Amphetamine Ukraine ESPAD EUROPE Southeast Europe Albania ARQ Bulgaria ARQ Amphetamine Bulgaria ARQ Methamphetamine Croatia ARQ Amphetamine Romania Turkey ESPAD May include non-ats EUROPE West & Central Europe Austria ESPAD stimulants Select regions Belgium ESPAD (Flanders) Cyprus ESPAD Czech Rep Govt./ ESPAD Methamphetamine Denmark ARQ Estonia ARQ Faroe Isl ESPAD Finland ARQ Amphetamine France ESPAD Germany ARQ Amphetamine Greece ESPAD Greenland ESPAD Hungary ARQ Amphetamine Iceland ESPAD Ireland ESPAD 281
73 World Drug Report 2009 Isle of Man ESPAD Italy ESPAD Latvia ARQ Amphetamine Liechtenstein ARQ Lithuania ESPAD Luxembourg Malta ARQ Amphetamine Netherlands ESPAD Norway ESPAD Poland ARQ Amphetamine Portugal ESPAD Slovakia ARQ Slovenia ESPAD Spain ARQ Amphetamine Sweden ESPAD Switzerland ESPAD United Kingdom ESPAD OCEANIA Oceania Australia ARQ Methamphetamine 282
74 3. Statistical Annex Consumption Ecstasy Region Subregion Country/ Territory ECSTASY-GROUP use amongst young people (ordered alphabetically by regions) Coverage (age/grade) Life-time Annual Last month % of young people who ever used % of young people who used at least once in the past year % of young people who used at least once in the past month Year of Estimate Source Notes AFRICA Southern Africa South Africa ARQ Secondary/ High AMERICAS Caribbean Antigua & Barbuda School OAS (MEM) Bahamas ARQ Students (ages Barbados 13, 15, and 17) OAS (MEM) Students (ages Dominica 13, 15, and 17) OAS (MEM) Dominican Rep ARQ Haiti ARQ Jamaica Ages OAS Students (ages St. Vincent & Grenadines 13, 15, and 17) OAS (MEM) Students (ages Trinidad & Tobago 13, 15, and 17) OAS (MEM) Turks & Caicos Isl ARQ AMERICAS Central America El Salvador ARQ Guatemala ARQ Honduras OAS (MEM) Nicaragua ARQ AMERICAS North America Canada ARQ USA Grade ARQ AMERICAS South America Argentina ARQ Bolivia CICAD/ OAS Select regions (Cape Town) Chile Grades OAS (MEM) Colombia CICAD/ OAS 283
75 World Drug Report 2009 Ecuador CICAD/ OAS Guyana ARQ Paraguay CICAD/ OAS Peru CICAD/ OAS Suriname Secondary/ High School OAS (MEM) Uruguay ARQ Venezuela ARQ ASIA Central Asia and Transcaucasian countries Armenia ESPAD Georgia ARQ Kazakhstan ARQ ASIA East and South-East Asia Hong Kong SAR, China ARQ Thailand Youth (undefined) ARQ Ages not specified ASIA Near and Middle East /South-West Asia Israel ARQ Lebanon ARQ EUROPE East Europe Belarus ARQ Russian Federation ARQ/ ESPAD Ukraine ESPAD EUROPE Southeast Europe Albania ARQ Bulgaria ARQ Croatia ARQ Romania ESPAD Turkey ARQ EUROPE West & Central Europe Austria ESPAD Belgium ESPAD Cyprus ESPAD Czech Rep Govt./ ESPAD Denmark ARQ Estonia ARQ Faroe Isl ESPAD Rapid Situation Assessment Select region (Flanders) 284
76 3. Statistical Annex Consumption Finland ARQ France ESPAD Germany ARQ Select regions Greece ESPAD Greenland ESPAD Hungary ARQ Iceland ESPAD Ireland ESPAD Isle of Man ESPAD Italy ESPAD Latvia ARQ Liechtenstein ARQ Lithuania ESPAD Luxembourg ARQ Malta ARQ Monoco ESPAD Netherlands ESPAD Norway ESPAD Poland ARQ Portugal ESPAD Slovakia ARQ Slovenia ESPAD Spain ARQ Sweden ESPAD Switzerland ESPAD United Kingdom ESPAD OCEANIA Oceania Australia ARQ 285
77 3.7 Drug-related crime RECORDED DRUG-RELATED CRIME/POSSESSION/ABUSE 1 RECORDED DRUG TRAFFICKING CRIME Country Count Count Change Count Count Change Year Year Country Year Year Rate Rate in rate Rate Rate in rate Africa Africa Algeria Count 5,702 c ,210 c 2006 Algeria Count 1,979ª ,733ª 2007 Rate Rate Mauritius Count 3,115 c ,851 c 2006 Mauritius Count 452 ª ª 2007 Rate Rate Morocco Count 6,860 c 2,005 9,038 c 2006 Morocco Count 9,615ª ,194 ª 2007 Rate Rate Namibia Count 549 ª ª 2007 Namibia Count 225 ª ª 2007 Rate Rate South Africa Count 61,631ª ,121ª 2007 South Africa Count 12,263ª ,697ª 2007 Rate Rate Central America and Caribbean Central America and Caribbean Bahamas Count 1,537ª ,363ª 2007 Bahamas Count 138ª ª 2007 Rate Rate Belize Count 1,375ª ª 2007 Belize Count 310ª ª 2007 Rate Rate Costa Rica Count 5,290 ª ,817 ª 2005 Costa Rica Count 1,024 ª ,205 ª 2006 Rate Rate El Salvador Count 1,388 ª ,866ª 2006 El Salvador Count 808 ª ª 2007 Rate Rate Panama Count 1,484 c ,150 c 2006 Panama Count 882ª ª 2006 Rate Rate North America North America Canada Count 19,483 c ,530 c 2006 Canada Count 8,937ª ,996ª 2007 Rate Rate Mexico Count 38,799 c ,667 c 2006 Mexico Count 20,443 ª ,890 ª 2007 Rate Rate USA Count 1,508,469* ,518,975* 2007 USA Count 337,882 * ,207 * 2007 Rate Rate South America South America Argentina Count 22,244 ª ,544ª 2006 Argentina Count 8,646 ª ,531 ª 2005 Rate Rate Chile Count 10,976 ª ,637ª 2007 Chile Count 6,050 ª ,534ª 2007 Rate Rate Ecuador Count 2,235 ª ,633 ª 2007 Ecuador Count 1,304ª ª 2007 Rate Rate Guyana Count 242 ª ª 2005 Guyana Count 247 ª ª 2005 Rate Rate Uruguay Count 1,594 c ,566 c 2006 Uruguay Count 329ª ª 2006 Rate Rate The column headed recorded drug-related crime/possession/abuse contains both data reported in the Annual Reports Questionnaire as possession/ abuse and in the Survey of Crime Trends and Operations of Criminal Justice Systems (UN-CTS) as drug-related crime. The definition applied by the Tenth UN-CTS for drug-related crime is intentional acts that involve the cultivation, production, manufacture, extraction, preparation, offering for sale, distribution, purchase, sale, delivery on any terms whatsoever, brokerage, dispatch, dispatch in transit, transport, importation, exportation and possession of internationally controlled drugs. Where applicable, reference may be made to the provisions of the Single Convention on Narcotic Drugs of 1961 and other regulations adopted in pursuance of the provisions of the Convention on Psychotropic Substances of 1971 and/or the Convention against Illicit Traffic in Narcotic Drugs and Psychotropic Substances of Where UN-CTS respondents indicated that drug trafficking crimes were included in drug-related crime, the count for drug trafficking was deducted from the count for drug-related crime before inclusion in the table. 286
78 3. Statistical Annex Consumption RECORDED DRUG-RELATED CRIME/POSSESSION/ABUSE RECORDED DRUG TRAFFICKING CRIME Country Count Count Change Count Count Change Year Year Country Year Year Rate Rate in rate Rate Rate in rate Central Asia/Transcaucasia Central Asia/Transcaucasia Armenia Count 411 c c 2006 Armenia Count 411ª ª 2007 Rate Rate Azerbaijan Count 2,053 c ,266 c 2006 Azerbaijan Count 901 c c 2006 Rate Rate Georgia Count 1,427 c ,926 c 2006 Georgia Count 94ª ª 2007 Rate Rate Kyrgyzstan Count 2,452ª ,162ª 2007 Kyrygyzstan Count 294ª ª 2007 Rate Rate Uzbekistan Count 5,301ª ,301ª 2007 Uzbekistan Count 9,261ª ,814ª 2007 Rate Rate East Asia East Asia Brunei Count 295 c c 2006 Brunei Count 0 c c 2006 Rate Rate 0 0 N.A. Hong Kong Count 3,669 ª ,854 ª 2007 Hong Kong Count 2,339 ª ,655ª 2007 Rate Rate Japan Count 23,681 c ,298 c 2006 Japan Count 1,477ª ,518ª 2007 Rate Rate Korea Count 3,268 ª ,469ª 2007 Korea Count 758 ª ,845ª 2007 Rate Rate Singapore Count 661 ª ,844 ª 2007 Singapore Count 61 ª ª 2007 Rate Rate Near Middle East/South West Asia Near Middle East/South West Asia Iran Count 288,483ª ,152 ª 2007 Iran Count 124,278ª ,236 ª 2007 Rate Rate Jordan Count 2,514ª ,874ª 2007 Jordan Count 746ª ª 2007 Rate Rate Lebanon Count 1,507 ª ,648ª 2007 Lebanon Count 546 ª ª 2007 Rate Rate Syria Count 3,198ª ,002ª 2007 Syria Count 831ª ª 2007 Rate Rate United Arab Emirates Count 506 c c 2006 United Arab Emirates Count 368ª ª 2006 Rate Rate South Asia South Asia Bangladesh Count 8,089ª ,476ª 2007 Bangladesh Count 14,133 c ,331 c 2006 Rate Rate Nepal Count 201 c c 2006 Nepal Count 214 c c 2006 Rate Rate Sri Lanka Count 28,007 ª ,280 ª 2007 Sri Lanka Count 34 ª ª 2007 Rate Rate Sources: (c) United Nations Survey of Crime Trends and Operations of Criminal Justice Systems. Definition of 'drug-related crime' applied by UNCTS: "Drug-related crime is defined as intentional acts that involve the cultivation, production, manufacture, extraction, preparation, offering for sale, distribution, purchase, sale, delivery, delivery on any terms whatsoever, brokerage, dispatch, dispatch in transit, transport, importation, exportation and possession of internationally controlled drugs. Where applicable, reference may be made to the provisions of the Single Convention on Narcotic Drugs of 1961 and other regulations adopted in pursuance of the porivsions of the Convention on Psychotropic Substances of 1971 and the United Nations Convention against Illicit Traffic in Narcotic Drugs and Psychotropic Substances of 1998." Definition of 'drug-trafficking' applied by UNCTS: "Drug offences, which are not in connection with personal use." (ª) United Nations Annual Reports Questionnaires.Definitiona applied by UNARQ: "Possession/abuse of drugs" and "Trafficking of drugs, including arrests made in the context of illicit cultivation and manufacture of drugs". (#) European Monitoring Centre for Drugs and Drug Addiction, Drug Law Offences. Definitions applied by EMCDDA: "Drug-law offences which are related to drug use and/or possesion for use." and "Drug-related dealing/trafficking/production refers to drug law offences which are related to drug dealing and/or drug trafficking/smuggling and/or drug production or any other offence related to these types of illicit activities." (*) National government sources. NOTE: The definition applied by national sources may not correspond to that applied by cross-national data collection instruments. United States of America: supl/index.html, Australia: (^) Statistical Office of the European Communities, Statistics in Focus. Definition applied by Eurostat: "Drug-trafficking includes illegal possession, cultivation, production, supplying, transportation, importing, exporting, financing etc. of drug operations which are not solely in coonection with personal use." 287
79 World Drug Report 2009 RECORDED DRUG-RELATED CRIME/POSSESSION/ABUSE RECORDED DRUG TRAFFICKING CRIME Country Count Count Change Count Count Change Year Year Country Year Year Rate Rate in rate Rate Rate in rate East Europe East Europe Belarus Count 2,376 ª ,278 ª 2005 Belarus Count 783 ª ,094 ª 2005 Rate Rate Moldova Count 1,681ª ,087ª 2006 Moldova Count 2,086 c ,997 c 2006 Rate Rate Russian Federation Count 96,890ª ,241ª 2005 Russian Federation Count 212,019ª ,218ª 2007 Rate Rate Ukraine Count 40,688 c ,444 c 2006 Ukraine Count 24,329 c ,186 c 2006 Rate Rate South East Europe South East Europe Bosnia and Herzegovina Count 236 c c 2006 Bosnia and Herzegovina Count 1355 c c 2006 Rate Rate Bulgaria Count 2,409ª ,524ª 2006 Bulgaria Count 448ª ª 2006 Rate Rate Croatia Count 5,124ª ,033ª 2007 Croatia Count 576ª ª 2007 Rate Rate FYROM Count 292 c c 2006 FYROM Count 98 c c 2006 Rate Rate Montenegro Count 355 c c 2006 Montenegro Count 294^ ^ 2007 Rate Rate Romania Count 944 c c 2006 Romania Count 1,314 c ,608 c 2006 Rate Rate Serbia Count 336 c c 2006 Serbia Count 4,968 c ,839 c 2006 Rate Rate Turkey Count 4,760ª ,354ª 2007 Turkey Count 7,022ª ,774ª 2007 Rate Rate West Central Europe West Central Europe Austria Count 25,089ª ,196ª 2007 Austria Count 2,224ª ,426ª 2007 Rate Rate Belgium Count 25,683ª ,720ª 2007 Belgium Count 8,650ª ,695ª 2007 Rate Rate Cyprus Count 404 c c 2006 Cyprus Count 289ª ª 2007 Rate Rate Czech Republic Count 648 c c 2006 Czech Republic Count 2,267ª ,248ª 2006 Rate Rate Denmark Count 16,630 c ,327c 2006 Denmark Count 2,738^ ,258^ 2007 Rate Rate UK: England and Wales Count 153,203 c ,732 c 2006 UK: England and Wales Count 25,276^ ,130^ 2007 Rate Rate Estonia Count 1,099 c c 2006 Estonia Count 686^ ,449^ 2007 Rate Rate Finland Count 15,064ª ,479ª 2007 Finland Count 5,177^ ,115^ 2007 Rate Rate France Count 101,047ª ,320ª 2007 France Count 19,258ª ,397ª 2007 Rate Rate Germany Count 232,502ª ,164ª 2007 Germany Count 62,131ª ,770ª 2007 Rate Rate Greece Count 12,823ª ,948ª 2006 Greece Count 4,667ª ,943ª 2006 Rate Rate Hungary Count 7,012 ª ,117 ª 2007 Hungary Count 7,627^ ,676^ 2007 Rate Rate Ireland Count 9,867 ª ,439 ª 2007 Ireland Count 3,160 c ,632 c 2006 Rate Rate Italy Count 7,603 c ,542 c 2006 Italy Count 24,456 c ,764 c 2007 Rate Rate Latvia Count 545ª ,531 ª 2007 Latvia Count 326ª ª 2007 Rate Rate Lithuania Count 682 ª ª 2007 Lithuania Count 329 ª ª 2007 Rate Rate Netherlands Count 6,348ª ,889ª 2007 Netherlands Count 14,161ª ,186ª 2007 Rate Rate UK: Northern Ireland Count 1,924 c ,411 c 2006 UK: Northern Ireland Count 349 c c 2006 Rate Rate Norway Count 16,866ª ,408ª 2007 Norway Count 5,747 # ,056 # 2005 Rate Rate Poland Count 50,114ª ,352ª 2007 Poland Count 24,433ª ,591ª 2007 Rate Rate Portugal Count 5,370 # ,216 # 2006 Portugal Count 3,535^ ,281^ 2007 Rate Rate UK: Scotland Count 34,634 c ,532 c 2006 UK: Scotland Count 9,613 c ,827 c 2007 Rate Rate Slovakia Count 1,993 c ,732 c 2006 Slovakia Count 843^ ^ 2007 Rate Rate Slovenia Count 2,944 # ,197 # 2006 Slovenia Count 1,026^ ,429^ 2007 Rate Rate Spain Count 188,125 ª ,559 ª 2007 Spain Count 22,493 ª ,238 ª 2007 Rate Rate Sweden Count 14,388 # ,819 # 2006 Sweden Count 4,670 c ,026 c 2007 Rate Rate Switzerland Count 40,432ª ,030ª 2007 Switzerland Count 2,757ª ,809ª 2007 Rate Rate Oceania Oceania Australia Count 62,209* 2004/05 66,530* 2006/07 Australia Count 14,613* 2004/05 15,709* 2006/07 Rate Rate New Zealand Count 8,672 c ,694 c 2006 New Zealand Count 4,293 c ,271 c 2006 Rate Rate The column headed recorded drug-related crime/possession/abuse contains both data reported in the Annual Reports Questionnaire as possession/abuse and in the Survey of Crime Trends and Operations of Criminal Justice Systems (UN-CTS) as drug-related crime. The definition applied by the Tenth UN-CTS for drug-related crime is intentional acts that involve the cultivation, production, manufacture, extraction, preparation, offering for sale, distribution, purchase, sale, delivery on any terms whatsoever, brokerage, dispatch, dispatch in transit, transport, importation, exportation and possession of internationally controlled drugs. Where applicable, reference may be made to the provisions of the Single Convention on Narcotic Drugs of 1961 and other regulations adopted in pursuance of the provisions of the Convention on Psychotropic Substances of 1971 and/or the Convention against Illicit Traffic in Narcotic Drugs and Psychotropic Substances of Where UN-CTS respondents indicated that drug trafficking crimes were included in drug-related crime, the count for drug trafficking was deducted from the count for drug-related crime before inclusion in the table. 288
80 3. Statistical Annex Consumption Trends in selected categories of police recorded crime in countries consistently reporting over the period (1995 = 100) Basis: 1995 =100 Intentional homicide (14 countries) Burglary (10 countries) Automobile theft (14 countries) Robbery (15 countries) Drug-related crime (14 countries) Comparison of drug-trafficking and drug-related crime rates for selected countries, Rate, per 100,000 population Africa (4 countries) Americas (9 countries) Asia (15 countries) Europe (28 countries) Region Drug trafficking Drug-related crime 289
81
82 4. METHODOLOGY
83
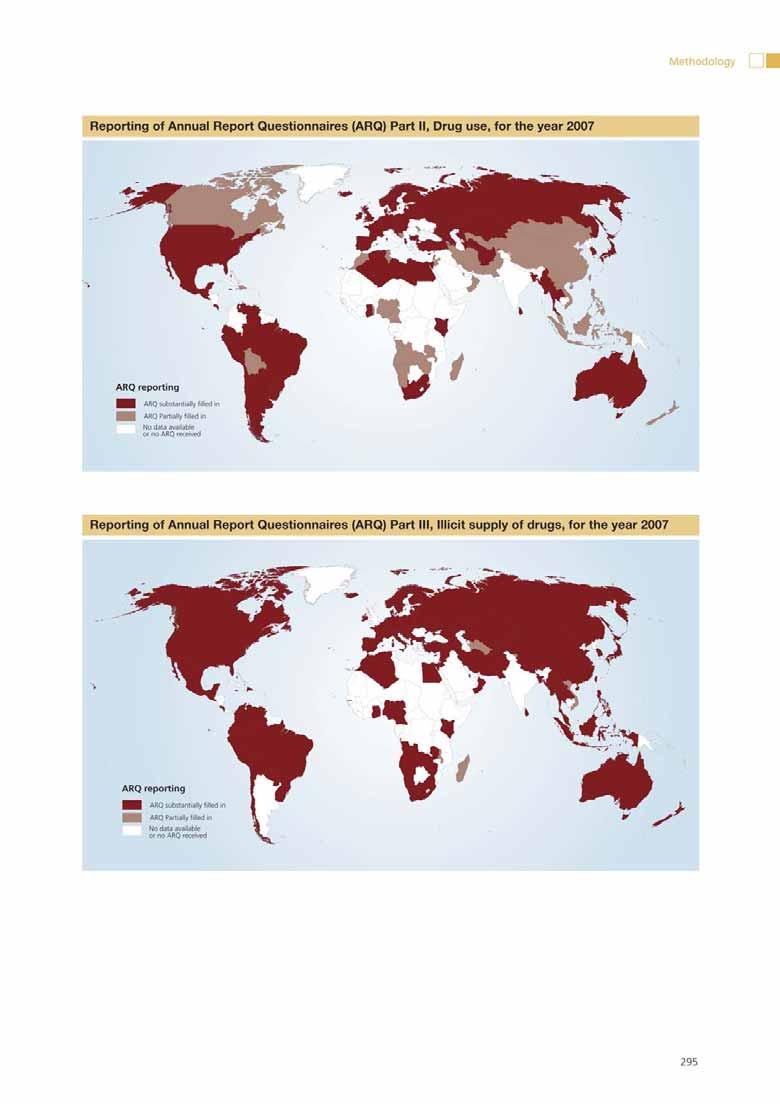
84 4.0 Methodology Considerable efforts have been made over the last few years to improve the estimates presented in this report. Nonetheless, challenges remain in making such estimates because of the gaps and variable quality of the data available. A major problem relates to the irregularity and incompleteness in reporting by Member States. First, the irregular intervals at which some Governments report may result in absence of data in some years. The lack of regular data, for which UNODC tries to compensate by referring to other sources, can influence the reported trend in a given year. Second, submitted questionnaires are not always complete or sufficiently comprehensive. Third, as will become clear in this section, many of the data collected are themselves subject to limitations and biases. These issues affect the quantity, quality and comparability of information received. Attempts have been made to provide information about the accuracy of the data throughout this Report. This section presents detailed information on the data sources and methods used to make the estimates featured throughout the Report. This information can be used to inform the reader s understanding of the quality of the data presented. Sources of information Under the international drug control conventions, Member States are formally required to provide drug-related information annually, as detailed by the Commission on Narcotic Drugs, to the Secretary-General of the United Nations (that is, the Secretariat of UNODC). The Commission on Narcotic Drugs developed the Annual Reports Questionnaire (ARQ) to collect these data. The 2009 World Drug Report is based primarily on data obtained from the ARQs returned by Governments to UNODC over the June 2008 to May 2009 period. Where no ARQ was submitted in this year, data from the previous ARQ submission were used. The data collected during this period ( ) normally refer to the drug situation in UNODC sent out the questionnaire to 192 countries, where some were also forwarded on to autonomous territories. UNODC received 118 replies to its questionnaire on Drug Use Demand (Part II) and 116 replies to its questionnaire on Illicit Supply of Drugs (Part III). a The best coverage was from countries in Europe (84% of all countries in Europe returned Part II and 87% Part III of the ARQ), followed Asia (76% both Demand and Supply), and the Americas (60% of the countries providing the Demand, and 57% the Supply ARQ). In the case of Africa, only a third of countries replied to the Supply ARQ and 38% to the Demand ARQ. In the Oceania region, two countries supplied information, equivalent to 14% of the countries in the region. Member States responses to the ARQs are shown on the subsequent maps. Typically, the ability of Member States to provide information on illicit drug supply is significantly better than their ability to provide demand-related information. However, as noted above, two more Member States responded to the Demand ARQ than the Supply ARQ. Both the Demand and Supply ARQ s have sets of key questions (see below). ARQs where more than 50% of these key questions were completed are defined as having been substantially filled in ; the rest were classified as having been partially filled in. This term reflects whether countries provided some replies to the key questions, but that not all of the data were provided, since in many cases Member States do not have the information. The analysis of the Supply ARQs submitted this year revealed that 84% of them were substantially completed compared to just 59% of the Demand ARQs. In order to identify the extent to which Member States are able to provided at least some information, a number of key questions in the ARQs were identified b : a b For the Supply ARQs (Part III), this included replies to the questions on drug seizures, i.e. on the quantities seized (replied by 95% of the countries returning the ARQ), the number of seizure cases (70%), trafficking (origin of drugs and/or destination (88%)), drug prices (90%), and drug related arrests and/or convictions (92%). From 115 and 113 Member States, respectively with additional responses from their territories. Each key question includes several subsections, typically by drug group (i.e. cannabis, cocaine, opiates, etc.). If Member States provide any quantifiable data in any part of key question s subsection, the key question is classified as filled-in. There is no assessment of the accuracy of completeness of the data or information provided. 293
85 World Drug Report 2009 For the Demand ARQs (Part II), the key questions used for the analysis referred to trends in drug use and ranking of drugs in terms of their prevalence among the general population (replied by 91% of the Member States); prevalence estimates (general population (50%), students (59%) and drug treatment (74%)). Information provided by Member States in ARQs form the basis for the estimates and trend analysis provided in the World Drug Report. Often, this information and data are not sufficient to provide an accurate or comprehensive picture of the world s drug situation. When necessary and where available, the data from the ARQs are thus supplemented with data from other sources. As in previous years, seizure data made available to UNODC via the ARQs was complemented primarily with data and reports from international organizations such as INTERPOL, the World Customs Organization (WCO), EUROPOL, the Organization of American States (OAC)/ Inter-American Drug Abuse Control Commission (CICAD), and data provided to UNODC by the Heads of National Law Enforcement Agencies (HONLEA) at their regional meetings, data provided through UNODC s Data for Africa project, and UNODC s Drug Use Information Network for Asia and the Pacific (DAINAP). In addition, Government reports and on-line electronic resources are used if they are located. Other sources considered included data published by the United States Department of State s Bureau for International Narcotics and Law Enforcement Affairs in its International Narcotics Control Strategy Report (INCSR). Price data for Europe was complemented with data from Europol. Precursor data presented are basically those collected by the International Narcotics Control Board (INCB). Demand-related information was obtained through a number of additional channels, including UNODC s Global Assessment Programme (GAP), the drug control agencies participating in UNODC s DAINAP network, as well as various national and regional epidemiological networks such as the European Monitoring Centre for Drugs and Drug Addiction (EMCDDA) and the Inter-American Drug Use Control Commission (CICAD). National government reports and scientific literature were also used as sources of information. This type of supplementary information is useful and needed as long as Member States lack the monitoring systems necessary to produce reliable, comprehensive and internationally comparable data. To this end, UNODC encourages and supports the improvement of national monitoring systems. Major progress has been made over the last few years in some of the main drug producing countries. In close cooperation with UNODC s Illicit Crop Monitoring Programme (ICMP) and with the support of major donors these countries have developed monitoring systems designed to identify extent of and trends in the cultivation of narcotic plants. These data form another basis for the trend analysis presented in the World Drug Report. There remain significant data limitations on the demand side. Despite commendable progress made in a number of Member States, in the area of prevalence estimates, for example, far more remains to be done to provide a truly reliable basis for trend and policy analysis and needs assessments. The work being done for the 2009 World Drug Report provides yet another opportunity to emphasise the global need for improving data collection and monitoring to improve the evidence base for effective policy. 294
86
3.5 Consumption Annual Prevalence Opiates
 3.5 Consumption 3.5.1 Annual Prevalence 3.5.1.1 Opiates EUROPE Western and Central Europe OPIATES AMERICA Central America Estonia, 2004 1.5 Panama** 0.2 Luxembourg, 2000 0.9 Honduras*, 2005 0.2 Latvia,
Drug Prices Report Opioids Retail and wholesale prices * and purity levels,by drug, region and country or territory (prices expressed in US$ )
") 1 / 11 Region/Subregion/ Country Africa Eastern Africa Kenya Madagascar Mauritius Uganda United Republic of Tanzania Northern Africa Algeria Egypt Libya Morocco Sudan Southern Africa Botswana Burkina Faso
1 / 11 Region/Subregion/ Country Africa Eastern Africa Kenya Madagascar Mauritius Uganda United Republic of Tanzania Northern Africa Algeria Egypt Libya Morocco Sudan Southern Africa Botswana Burkina Faso
מדינת ישראל. Tourist Visa Table
 Updated 23/05/2017 מדינת ישראל Tourist Visa Table Tourist visa exemption is applied to national and official passports only, and not to other travel documents. Exe = exempted Req = required Press the first
מדינת ישראל. Tourist Visa Table. Tourist visa exemption is applied to national and official passports only, and not to other travel documents.
 Updated 25/05/2015 ישראל Tourist Visa Table Tourist visa exemption is applied to national and official passports only, and not to other travel documents. (C) Bearers of official passports requiring tourist
APPENDIX II - TABLE 2.3 ANTI-TOBACCO MASS MEDIA CAMPAIGNS
 WHO REPORT ON THE GLOBAL TOBACCO EPIDEMIC, 2011 APPENDIX II - TABLE 2.3 ANTI-TOBACCO MASS MEDIA CAMPAIGNS (SEE TABLE 4.9) Africa The Americas South-East Asia Europe Eastern Mediterranean Western Pacific
THE CARE WE PROMISE FACTS AND FIGURES 2017
 THE CARE WE PROMISE FACTS AND FIGURES 2017 2 SOS CHILDREN S VILLAGES INTERNATIONAL WHERE WE WORK Facts and Figures 2017 205 58 79 families and transit 31 Foster homes 162 8 3 173 214 2 115 159 136 148
Current State of Global HIV Care Continua. Reuben Granich 1, Somya Gupta 1, Irene Hall 2, John Aberle-Grasse 2, Shannon Hader 2, Jonathan Mermin 2
 Current State of Global HIV Care Continua Reuben Granich 1, Somya Gupta 1, Irene Hall 2, John Aberle-Grasse 2, Shannon Hader 2, Jonathan Mermin 2 1) International Association of Providers of AIDS Care
CALLING ABROAD PRICES FOR EE SMALL BUSINESS PLANS
 CALLING ABROAD PRICES FOR EE SMALL BUSINESS PLANS More information about out-of-bundle charges for our small business customers calling internationally from the UK using a small business price plan Page
Annual prevalence estimates of cannabis use in the late 1990s
 Cocaine abuse in most east European countries, by contrast, is still far less widespread and less of a problem. A majority of countries in eastern Europe either did not report on cocaine at all, or they
Seizures of ATS (excluding ecstasy ), 2010
, 2010") Seizures of ATS (excluding ecstasy ), 2010 (countries and territories reporting seizures* of more than 10 kg) 9 5.1 8.7 12.9 Ghana Armenia 0.7 9.9 1 2.1 Syrian Arab Republic Korea (Republic of) Iraq Islamic
Seizures of ATS (excluding ecstasy ), 2010 (countries and territories reporting seizures* of more than 10 kg) 9 5.1 8.7 12.9 Ghana Armenia 0.7 9.9 1 2.1 Syrian Arab Republic Korea (Republic of) Iraq Islamic
World Health organization/ International Society of Hypertension (WH0/ISH) risk prediction charts
 risk prediction charts") World Health organization/ International Society of Hypertension (WH0/ISH) risk prediction charts (charts in colour) (These charts will be updated in 2014) 2 1. Introduction 2. Instructions on how to use
World Health organization/ International Society of Hypertension (WH0/ISH) risk prediction charts (charts in colour) (These charts will be updated in 2014) 2 1. Introduction 2. Instructions on how to use
Main developments in past 24 hours
 ECDC DAILY UPDATE Pandemic (H1N1) 2009 Update 02 October 2009, 09:00 hours CEST Main developments in past 24 hours Weekly Influenza Surveillance Overview to be published today; Media highlights and Eurosurveillance
ADMINISTRATIVE AND FINANCIAL MATTERS. Note by the Executive Secretary * CONTENTS. Explanatory notes Tables. 1. Core budget
 UNITED NATIONS Distr. GENERAL 13 October 1997 ENGLISH ONLY SUBSIDIARY BODY FOR IMPLEMENTATION Seventh session Bonn, 20-29 October 1997 Item 9 of the provisional agenda ADMINISTRATIVE AND FINANCIAL MATTERS
FRAMEWORK CONVENTION ALLIANCE BUILDING SUPPORT FOR TOBACCO CONTROL. Smoke-free. International Status Report
 FRAMEWORK CONVENTION ALLIANCE BUILDING SUPPORT FOR TOBACCO CONTROL Smoke-free Environments International Status Report As December, 00 Smoke-free environments are a vital part combating the global tobacco
Tobacco: World Markets and Trade
 United States Department of Agriculture Foreign Agricultural Service Circular Series FT -09-05 Sep. 2005 List of Tables Tobacco: World Markets and Trade Table 2 U.S. Tobacco Trade: 2004-2005 Table 3 Unmanufactured
Maternal Deaths Disproportionately High in Developing Countries
 EMBARGOED until Monday, 20 October, 6am GMT HQ/2003/24 20 October 2003 CF/DOC/PR/2003-82 Maternal Deaths Disproportionately High in Developing Countries African women are 175 times more likely to die in
Terms and Conditions. VISA Global Customer Assistance Services
 Terms and Conditions VISA Global Customer Assistance Services Visa Global Customer Assistance Services (VGCAS) 1 The Visa Global Customer Assistance Services are co-ordinated by the Global Assistance Centre
Eligibility List 2018
 The Global Fund s 2017-2022 strategy and allocation-based approach enables strategic investment to accelerate the end of HIV/AIDS, tuberculosis and malaria and build resilient and sustainable systems for
Hearing loss in persons 65 years and older based on WHO global estimates on prevalence of hearing loss
 Hearing loss in persons 65 years and older based on WHO global estimates on prevalence of hearing loss Mortality and Burden of Diseases and Prevention of Blindness and Deafness WHO, 2012 In 2012, WHO released
Copyright 2011 Joint United Nations Programme on HIV/AIDS (UNAIDS) All rights reserved
 All rights reserved") UNAIDS DATA TABLES 2011 Copyright 2011 Joint United Nations Programme on HIV/AIDS (UNAIDS) All rights reserved UNAIDS / JC2225E The designations employed and the presentation of the material in this publication
UNAIDS DATA TABLES 2011 Copyright 2011 Joint United Nations Programme on HIV/AIDS (UNAIDS) All rights reserved UNAIDS / JC2225E The designations employed and the presentation of the material in this publication
The Single Convention on Narcotic Drugs- Implementation in Six Countries: Albania, Bangladesh, India, Kyrgyzstan, Sri Lanka, Ukraine
 The Single Convention on Narcotic Drugs- Implementation in Six Countries: Albania, Bangladesh, India, Kyrgyzstan, Sri Lanka, Ukraine A MONOGRAPH PREPARED FOR: International Pain Policy Fellowship Training
ANNEX 3: Country progress indicators
 : progress indicators 541 : COUNTRY PROGRESS INDICATORS 2006 REPORT ON THE GLOBAL AIDS EPIDEMIC Annex 3 : COUNTRY PROGRESS INDICATORS As of March 2006, 115 countries had reported indicators on progress
Analysis of Immunization Financing Indicators from the WHO-UNICEF Joint Reporting Form (JRF),
,") Analysis of Immunization Financing Indicators from the WHO-UNICEF Joint Reporting Form (JRF), 2008-2010 Claudio Politi and Oumar Sagna Department of Immunization Vaccines and Biologicals, World Health
Analysis of Immunization Financing Indicators from the WHO-UNICEF Joint Reporting Form (JRF), 2008-2010 Claudio Politi and Oumar Sagna Department of Immunization Vaccines and Biologicals, World Health
Supplementary appendix
 Supplementary appendix This appendix formed part of the original submission and has been peer reviewed. We post it as supplied by the authors. Supplement to: Liyanage T, Ninomiya T, Jha V, et al. Worldwide
GLOBAL RepORt UNAIDS RepoRt on the global AIDS epidemic
 GLOBAL Report UNAIDS Report on the global AIDS epidemic 2012 Copyright 2012 Joint United Nations Programme on HIV/AIDS (UNAIDS) All rights reserved The designations employed and the presentation of the
ICM: Trade-offs in the fight against HIV/AIDS
 ICM: Trade-offs in the fight against HIV/AIDS 1 As the HIV/AIDS pandemic enters its 25 th year, both the number of infections and number of deaths due to the disease continue to rise. Despite an enormous
WHO report highlights violence against women as a global health problem of epidemic proportions
 News release WHO/16 20 June 2013 EMBARGO: PLEASE DO NOT DISTRIBUTE OR PUBLISH BEFORE THURSDAY 20 JUNE 2013 AT 15H00 GENEVA TIME, 14H00 LONDON TIME, 13H00 GMT, AND 09H00 EST WHO report highlights violence
WELLNESS COACHING. Wellness & Personal Fitness Solution Providers
 WELLNESS COACHING Wellness & Personal Fitness Solution Providers Introducing Ourselves... We are Personal Wellness Coaches 2 We help people look and feel better by: - Educating on proper nutrition (80%)
Country Length Discount Travel Period Anguilla All 20% off 08/24/11 12/15/11 Antigua All 20% off 08/24/11 12/15/11 Argentina All 20% off 08/24/11
 Country Length Discount Travel Period Anguilla All 20% off 08/24/11 12/15/11 Antigua All 20% off 08/24/11 12/15/11 Argentina All 20% off 08/24/11 12/15/11 Aruba All 20% off 08/24/11 12/15/11 Australia
AGaRT The Advisory Group on increasing access to Radiotherapy Technology in low and middle income countries
 AGaRT The Advisory Group on increasing access to Radiotherapy Technology in low and middle income countries Together against Cancer The Advisory Group on Increasing Access to Radiotherapy To address the
TOBACCO USE PREVALENCE APPENDIX II: The following definitions are used in Table 2.1 and Table 2.3:
 APPENDIX II: TOBACCO USE PREVALENCE Tables 2.1 to 2.4 show country-reported data on tobacco use prevalence among adults and youth, as well as countryreported data on smokeless tobacco use prevalence among
STAT/SOC/CSSS 221 Statistical Concepts and Methods for the Social Sciences. Introduction to Mulitple Regression
 STAT/SOC/CSSS 1 Statistical Concepts and Methods for the Social Sciences Introduction to Mulitple Regression Christopher Adolph Department of Political Science and Center for Statistics and the Social
CND UNGASS FOLLOW UP
 CND UNGASS FOLLOW UP INCB follow-up activities on Chapter 2. Operational recommendations on ensuring the availability of and access to controlled substances exclusively for medical and scientific purposes,
Annex 2 A. Regional profile: West Africa
 Annex 2 A. Regional profile: West Africa 355 million people at risk for malaria in 215 297 million at high risk A. Parasite prevalence, 215 Funding for malaria increased from US$ 233 million to US$ 262
Global EHS Resource Center
 Global EHS Resource Center Understand environmental and workplace safety requirements that affect your global operations. 800.372.1033 bna.com/gelw Global EHS Resource Center This comprehensive research
WHO Global Status Report on Alcohol 2004
 ! Drinking patterns The consumption of alcoholic beverages can be studied from a number of viewpoints, ranging from the viewpoint of an economist to that of a cultural anthropologist. When viewed from
Undetectable = Untransmittable. Mariah Wilberg Communications Specialist
 Undetectable = Untransmittable Mariah Wilberg Communications Specialist Undetectable=Untransmittable PLWH who get and stay undetectable have effectively no risk of transmitting HIV to their sex partners
we are daisy Daisy Conferencing Max Bridge charges* International charges* International toll-free access levy
 Daisy Conferencing Max Daisy Conferencing offers three tailored solutions to meet your business requirements. Create simple audio calls on demand with Reservationless Conferencing, audio-visual web conferences
Articles. Funding Bill & Melinda Gates Foundation.
 Global, regional, and national burden of traumatic brain injury and spinal cord injury, : a systematic analysis for the Global Burden of Disease Study 2016 GBD 2016 Traumatic Brain Injury and Spinal Cord
World Health Organization Department of Communicable Disease Surveillance and Response
 WHO/CDS/CSR/ISR/2000.1 WHO Report on Global Surveillance of Epidemic-prone Infectious Diseases World Health Organization Department of Communicable Disease Surveillance and Response This document has been
EMBARGOED UNTIL 22 JUNE PM CEST (GMT+2)
") FACT SHEET ON STATISTICS AND TRENDS IN ILLICIT DRUGS Global estimates of drug use All illicit drug use Problem drug use** Annual prevalence (%)* 5.3 (3.3-7.3) 0.6 (0.3-0.9) Number of users (millions)*
FACT SHEET ON STATISTICS AND TRENDS IN ILLICIT DRUGS Global estimates of drug use All illicit drug use Problem drug use** Annual prevalence (%)* 5.3 (3.3-7.3) 0.6 (0.3-0.9) Number of users (millions)*
BCG. and your baby. Immunisation. Protecting babies against TB. the safest way to protect your child
 BCG and your baby Protecting babies against TB Immunisation the safest way to protect your child This leaflet is about the BCG (Bacillus Calmette-Guerin) vaccination that is being offered to protect your
WELLNESS COACHING. Wellness & Personal Fitness Solution Providers NZ & Australia
 WELLNESS COACHING Wellness & Personal Fitness Solution Providers NZ & Australia Introducing Ourselves... We are Personal Wellness Coaches 2 We help people look and feel better by: - Educating on proper
WORLD COUNCIL OF CREDIT UNIONS 2017 STATISTICAL REPORT
 WORLD COUNCIL OF CREDIT UNIONS 2017 STATISTICAL REPORT THE GLOBAL NET WORK OF CREDIT UNIONS AND FINANCIAL COOPERATIVES MEMBERSHIP AT A GLANCE World Council builds, champions, defends and grows a global
Why Invest in Nutrition?
 Why Invest in Nutrition? Meera Shekar Human Development Network World Bank 2006 Three key Issues Why reducing malnutrition is essential to poverty reduction? Is malnutrition a BIG problem? How can we improve
1. Consent for Treatment This form must be completed in order to receive healthcare services in the campus clinic.
 HEALTH & WELLNESS SERVICES INSTRUCTIONS FOR COMPLETING THE REQUIRED MEDICAL FORMS FOR: U.S. CITIZENS 18 YEARS OF AGE OR OLDER AT THE TIME THE FORMS ARE COMPLETED. THIS REQUIREMENT MUST BE COMPLETED WHETHER:
Tipping the dependency
 BREAKING NEWS Meeting the investment challenge Tipping the dependency balance Domestic investments exceed international investments total reaching US$ 8.6 billion. 40 countries fund more than 70% of their
Calls from home residential tariffs
 These price lists include call charges at the old VAT rate of 17.5%. From 1st December, all of your calls will be billed at the lower VAT rate of 15%, and we ll update these lists to the new rates as soon
The IB Diploma Programme Statistical Bulletin. November 2015 Examination Session. Education for a better world
 The IB Diploma Programme Statistical Bulletin November 2015 Examination Session Education for a better world TheIBDiplomaProgrammeStatisticalBuletin,November2015ExaminationSession. InternationalBaccalaureate
Copyright 2010 Joint United Nations Programme on HIV/AIDS (UNAIDS) All rights reserved
 All rights reserved") OVERVIEW: UNAIDS REPORT ON THE GLOBAL AIDS EPIDEMIC 2010 Copyright 2010 Joint United Nations Programme on HIV/AIDS (UNAIDS) All rights reserved The designations employed and the presentation of the material
OVERVIEW: UNAIDS REPORT ON THE GLOBAL AIDS EPIDEMIC 2010 Copyright 2010 Joint United Nations Programme on HIV/AIDS (UNAIDS) All rights reserved The designations employed and the presentation of the material
STATISTICS AND ANALYSIS ON SUPPLY OF AND TRAFFICKING IN NARCOTIC DRUGS AND PSYCHOTROPIC SUBSTANCES 1996
 STATISTICS AND ANALYSIS ON SUPPLY OF AND TRAFFICKING IN NARCOTIC DRUGS AND PSYCHOTROPIC SUBSTANCES 1996 The United Nations International Drug Control Programme wishes to express its appreciation for responses
ESPEN Congress Geneva 2014 FOOD: THE FACTOR RESHAPING THE SIZE OF THE PLANET
 ESPEN Congress Geneva 2014 FOOD: THE FACTOR RESHAPING THE SIZE OF THE PLANET Buy 2 and take 3: are we benefitting from cheaper food? P. Marques-Vidal (CH) Pedro Marques-Vidal Department of Internal Medicine
Country-wise and Item-wise Exports of Animal By Products Value Rs. Lakh Quantity in '000 Unit: Kgs Source: MoC Export Import Data Bank
 Country-wise and Item-wise Exports of Animal By Products Value Rs. Lakh Quantity in '000 Unit: Kgs Source: MoC Export Import Data Bank Country CAPEXIL Description HS Code Value 2010-2011 Quantity 2010-2011
Alcohol-related harm in Europe and the WHO policy response
 Alcohol-related harm in Europe and the WHO policy response Lars Moller Programme Manager World Health Organization Regional Office for Europe Date of presentation NCD global monitoring framework: alcohol-related
Outcomes of the Global Consultation Interim diagnostic algorithms and Operational considerations
 Outcomes of the Global Consultation Interim diagnostic algorithms and Operational considerations Briefing on Xpert MTB/RIF. Geneva, 21 February, 2011 Fuad Mirzayev TB Laboratory Strengthening and Diagnostics
#1 #2 OR Immunity verified by immune titer (please attach report) * No titer needed if proof of two doses of Varicella provided
 * No titer needed if proof of two doses of Varicella provided") Student Information: Date of Birth: There are two ways to provide us with your immunization information. 1) Students can have their healthcare provider fill out and sign the form below. A healthcare provider
Student Information: Date of Birth: There are two ways to provide us with your immunization information. 1) Students can have their healthcare provider fill out and sign the form below. A healthcare provider
Fellowships in nuclear science and technology: Applying the knowledge
 Fellowships in nuclear science and technology: Applying the knowledge Nearly 1200 scientists, engineers, and specialists receive training each year under IAEA-supported fellowships and scientific visits
Challenges and Opportunities to Optimizing the HIV Care Continuum Can We Test and Treat Enough People to Make a Seismic Difference by 2030?
 Challenges and Opportunities to Optimizing the HIV Care Continuum Can We Test and Treat Enough People to Make a Seismic Difference by 2030? Reuben Granich, MD, MPH Strategic and Scientific Advisor International
This portion to be completed by the student Return by July 1 Please use ballpoint pen
 This portion to be completed by the student Return by July 1 Please use ballpoint pen Start term: Fall Exploration Spring Summer Year: Class year: Freshman Sophomore Junior Senior Transfer Full name: Preferred:
Global and regional burden of first-ever ischaemic and haemorrhagic stroke during : findings from the Global Burden of Disease Study 2010
 Global and regional burden of first-ever ischaemic and haemorrhagic stroke during 1990 2010: findings from the Global Burden of Disease Study 2010 Rita V Krishnamurthi, Valery L Feigin, Mohammad H Forouzanfar,
FACTS AND FIGURES 2015 OUR VILLAGE
 FACTS AND FIGURES 2015 OUR VILLAGE FOREWORD WHAT WE DO OUR WORK IN 2015 SOS Children s Villages communities provide a range of services in care, education, health and emergency response, depending on local
Malnutrition prevalences by country and year, from survey data and interpolated for reference years (1990, 1995, 2000)
") Recent trends in malnutrition in developing regions 109 Annex 1 Malnutrition prevalences by country and year, from survey data and interpolated for reference years (1990, 1995, ) The tables in this Annex
Recent trends in malnutrition in developing regions 109 Annex 1 Malnutrition prevalences by country and year, from survey data and interpolated for reference years (1990, 1995, ) The tables in this Annex
Stakeholders consultation on strengthened cooperation against vaccine preventable diseases
 Stakeholders consultation on strengthened cooperation against vaccine preventable diseases Fields marked with * are mandatory. General Context This questionnaire is a working document prepared by the European
Certificate of Immunization
 Certificate of Immunization Required of all students (Page 1 of 5) QUESTIONS? 440-775-8180 or student.health@oberlin.edu (e-mail preferred) RETURN TO: Oberlin College Student Health Services 247 W. Lorain
The worldwide societal costs of dementia: Estimates for 2009
 Alzheimer s & Dementia 6 (2010) 98 103 The worldwide societal costs of dementia: Estimates for 2009 Anders Wimo a, *, Bengt Winblad a, Linus Jönsson b a KI-Alzheimer s Disease Research Center, Department
Various interventions for controlling sexually transmitted infections have proven effective, including the syndromic
 levels, as understaffing is a chronic issue in all the countries that are scaling up male circumcision. Current achievements notwithstanding, it is necessary to reinforce and strengthen national political
Donor Support for Contraceptives and Condoms for STI/HIV Prevention
 Donor Support for Contraceptives and Condoms for STI/HIV Prevention 2001 Donor Support for Contraceptives and Condoms for STI/HIV Prevention 2001 Table of Contents List of Abbreviations and Acronyms List
Epidemiology of non medical use of prescription drugs. Kamran Niaz, Survey and Statistics Section, Policy Analysis and Research Branch
 Epidemiology of non medical use of prescription drugs Kamran Niaz, Survey and Statistics Section, Policy Analysis and Research Branch Monitoring of the drug use situation: Annual reports questionnaire
NON-STANDARD PRICE GUIDE FOR EE SMALL BUSINESS More information about out-of-bundle charges for our small business customers
 NON-STANDARD PRICE GUIDE FOR EE SMALL BUSINESS More information about out-of-bundle charges for our small business customers B2BLegal1204 Non-Standard Price Guide for EE Small Business EXT Document v2.8
ACCESS 7. TOWARDS UNIVERSAL ACCESS: THE WAY FORWARD
 ACCESS 7. TOWARDS UNIVERSAL ACCESS: THE WAY FORWARD The year 2008 witnessed sustained progress in expanding access to HIV prevention, treatment and care services in low- and middle-income countries. With
Decline in Human Fertility:
 T E C H N I C A L R E P O R T Decline in Human Fertility: 1950 2007 SEPTEMBER 2010 This report was prepared by University Research Co., LLC (URC) for review by the United States Agency for International
STUDENT HEALTH SERVICES NEW STUDENT QUESTIONNAIRE
 STUDENT HEALTH SERVICES NEW STUDENT QUESTIONNAIRE UC Hastings Student Health Services (SHS) is committed to providing you the best possible medical care, so we need to know about your medical history and
UNAIDS 2017 REFERENCE UNAIDS DATA 2017
 UNAIDS 2017 REFERENCE UNAIDS DATA 2017 Copyright: 2017 Joint United Nations Programme on HIV/AIDS (UNAIDS) All rights reserved. The designations employed and the presentation of the material in this publication
Appendix F. The Test-Curriculum Matching Analysis Science TIMSS 2011 INTERNATIONAL RESULTS IN SCIENCE APPENDIX F 479
 Appendix F The Test-Curriculum Matching Analysis Science TIMSS 2011 INTERNATIONAL RESULTS IN SCIENCE APPENDIX F 479 TIMSS went to great lengths to ensure that comparisons of student achievement across
Recommended composition of influenza virus vaccines for use in the 2007 influenza season
 Recommended composition of influenza virus vaccines for use in the 2007 influenza season September 2006 This recommendation relates to the composition of vaccines for the forthcoming winter in the southern
UNAIDS 2017 REFERENCE UNAIDS DATA 2017
 UNAIDS 2017 REFERENCE UNAIDS DATA 2017 Copyright: 2017 Joint United Nations Programme on HIV/AIDS (UNAIDS) All rights reserved. The designations employed and the presentation of the material in this publication
Recommended composition of influenza virus vaccines for use in the 2009 southern hemisphere influenza season
 Recommended composition of influenza virus vaccines for use in the 2009 southern hemisphere influenza season The World Health Organization (WHO) convenes technical meetings 1 in February and September
UNAIDS 2017 REFERENCE UNAIDS DATA 2017
 UNAIDS 2017 REFERENCE UNAIDS DATA 2017 Copyright: 2017 Joint United Nations Programme on HIV/AIDS (UNAIDS) All rights reserved. The designations employed and the presentation of the material in this publication
CIGARETTE PACKAGE HEALTH WARNINGS
 OCTOBER 2012 CIGARETTE PACKAGE HEALTH WARNINGS INTERNATIONAL STATUS REPORT THIRD EDITION LARGER, PICTURE HEALTH WARNINGS: THE GROWING WORLDWIDE TREND This report Cigarette Package Health Warnings: International
Epidemiological Estimates for Haemoglobin Disorders: WHO South East Asian Region by Country
 Epidemiological Estimates for Haemoglobin Disorders: WHO South East Asian Region by Comprising the following charts and tables: Chart 1: Population Chart 2: Annual births Chart 3: Crude birth rate and
Global Fund ARV Fact Sheet 1 st June, 2009
 Global Fund ARV Fact Sheet 1 st June, 2009 This fact sheet outlines the principles and approach in determining the number of people on antiretroviral drugs (ARVs) for HIV/AIDS treatment, with a breakdown
4.3 Data sources for monitoring global trends in tobacco use behaviours
 4.3 Data sources for monitoring global trends in tobacco use behaviours Introduction The purpose of this section is to describe the data collection efforts for global surveillance on tobacco use in youth
Supplementary Online Content
 Supplementary Online Content Troeger C, Khalil IA, Rao PC, et al. Rotavirus Vaccination and the Global Burden of Rotavirus Diarrhea Among Children Younger Than 5 Years. JAMA Pediatr. Published online August
EU Market Situation for Poultry. Committee for the Common Organisation of the Agricultural Markets 20 April 2017
 EU Market Situation for Poultry Committee for the Common Organisation of the Agricultural Markets 2 April 217 -9.% -11.% -5.% -.1% -.7% -2.2% 3.% 1.7% 1.2%.8%.6%.%.%.% 7.9% 7.% 6.4% 6.2% 6.% 5.5% 5.3%
CIGARETTE PACKAGE HEALTH WARNINGS
 SEPTEMBER 2014 CIGARETTE PACKAGE HEALTH WARNINGS INTERNATIONAL STATUS REPORT FOURTH EDITION LARGER, PICTURE HEALTH WARNINGS: THE GROWING WORLDWIDE TREND This report Cigarette Package Health Warnings: International
FORMS MUST BE COMPLETED PRIOR TO THE START OF YOUR FIRST SEMESTER
 HEALTH & WELLNESS SERVICES INSTRUCTIONS FOR COMPLETING THE REQUIRED MEDICAL FORMS FOR: U.S. CITIZENS WHO ARE NOT 18 YEARS OF AGE AT THE TIME THE FORMS ARE COMPLETED. THIS REQUIREMENT MUST BE COMPLETED
World Pre-trial / Remand Imprisonment List
 Inter Centre for Prison Studies World Pre-trial / Remand Imprisonment List (Pre-trial detainees and other prisoners in all five continents) Roy Walmsley Introduction The World Remand Imprisonment List
The Test-Curriculum Matching Analysis: Science
 Appendix C The Test-Curriculum Matching Analysis: Science TIMSS went to great lengths to ensure that comparisons of student achievement across countries would be as fair and equitable as possible. The
Developed for the Global Initiative for Asthma
 TM Matthew Masoli Denise Fabian Shaun Holt Richard Beasley Medical Research Institute of New Zealand Wellington, New Zealand University of Southampton Southampton, United Kingdom Developed for the Global
HIV and Harm Reduction in Prisons
 HIV and Harm Reduction in Prisons School of Public Health and Community Medicine Professor Kate Dolan Program of International Research and Training National Drug and Alcohol Research Centre UNSW, Sydney,
Global Fund Mid-2013 Results
 Global Fund Mid-2013 Results This fact sheet outlines some of the common questions and answers regarding results reported by Global Fund-supported programs, including the principles and approach in determining
Global Fund Results Fact Sheet Mid-2011
 Global Fund Results Fact Sheet Mid-2011 This fact sheet outlines some of the common questions and answers regarding results reported by Global Fund-supported programs, including the principles and approach
Appendix F: Test-Curriculum Matching Analysis
 Appendix F: Test-Curriculum Matching Analysis TIMSS went to great lengths to ensure that comparisons of student achievement across countries would be as fair and equitable as possible. The TIMSS 2015 Assessment
DEMOGRAPHIC CHANGES IN DEVELOPED AND DEVELOPING COUNTRIES
 Clemson University TigerPrints All Theses Theses 8-2013 DEMOGRAPHIC CHANGES IN DEVELOPED AND DEVELOPING COUNTRIES Sarah Sax Clemson University, sarahsax9@gmail.com Follow this and additional works at: