Mathematics Lessons K-4
|
|
|
- Asher Chase
- 5 years ago
- Views:
Transcription
1 Mathematics Lessons K-4
2 Investigate! Are You Label Able? Standards References Math GLEs: Grade 3: 8, 13, 43 Grade 4: 13, 14, 36 HEALTH Benchmarks 1-E-2 2-E-1 2-E-2 4-E-4 Materials 1. Assortment of Nutrition Facts Labels 2. 4 calculators 3. Paper and pencils 4. Colored pencils or markers 5. 1 shallow box (9x12) labeled Learning Tools Activity Overview Participants will examine Nutrition Facts Labels and use information to make more informed food choices that contribute to a healthy diet. Key Concepts Food labels contain Nutrition Facts such as serving size, servings per container, calories and nutrients like proteins, fats and carbohydrates. Many foods come packaged with more than one serving. Daily Values (DV) on Nutrition Labels are use to make smart choices. Fat cholesterol and sodium levels should be limited in a healthy diet. (5% or less is low.) We should make sure our bodies get enough nutrients such as fiber, vitamins, calcium and iron. (20% or more is high.) Procedure Preparation: Print the Key Concepts, Lab Instructions, and Sample Nutrition Facts Labels on heavy cardstock and place at the Explore Station. Copy one student activity sheet for each family. Set up all materials needed at the station. Note: Students in grades K-2 should complete # 1-5 only and use a calculator. 1. Review the sample label for Macaroni and Cheese on the display board. 2. Locate the Serving Size and Servings per Container in section Check the number of calories per serving in section Calculate the total number of calories in the entire box. 5. Calculate the number of calories that you would consume if you only ate ½ of a serving. 6. DV provides families with a way to compare food products. 7. Look at section 3 of the sample label. Fat, cholesterol and sodium need to be limited. Is the % DV is more than 20? If the answer is yes, this food item is not a healthy choice. 8. Look at section 4. We need to make sure that we get enough fiber, calcium, iron and vitamins. Is the % Daily Value greater than 20? If the answer is yes, this food item is considered nutrient-rich. 9. Locate the Nutrition Facts Label from one item of the display of foods. Graph at the bottom of your student activity sheet. 10. Read and discuss your Key Concepts! 11. Do you think that the food item you chose limits fat, cholesterol and sodium? (If the % DV is 5 or less, the answer is yes.) 12. Does the food item you completed provide enough nutrients? (If the % DV is 20 or greater, the answer is yes.) 13. Be sure to write what you have learned and stamp your Passport to Good Health! Closure/Evaluation After completing the activity, families read the information found under Key Concepts and discuss the importance of understanding a Nutrition Facts Label. Elementary Activity Plan
3 Investigate! Are You Label Able? LAB INSTRUCTIONS Note: Students in grades K-2 should complete #1-5 only and use a calculator. 1. Review the sample Nutrition Facts Label for Macaroni and Cheese on the display board. 2. Locate the Serving Size and Servings per Container in section Check the number of calories per serving in section Calculate the total number of calories in the entire box. (You may use a calculator, paper and pencil or mental math.) 5. Record your answer in part 1 of the student activity sheet. Discuss your strategy with your partner. 6. Calculate the number of calories that you would consume if you only ate ½ of a serving. Record your answer in part 2 of the student activity sheet. Be sure that you show your work and explain your strategy. 7. Look at section 3 of the sample label. Fat, cholesterol and sodium need to be limited. Is the % Daily Value is more than 20? If the answer is yes, this food item is not a healthy choice. 8. Look at section 4. We need to make sure that we get enough fiber, calcium, iron and vitamins. Is the % Daily Value greater than 20? If the answer is yes, this food item is considered nutrient rich. 9. Choose 1 food item and locate the Nutrition Facts Label. Using the information given, complete the graph at the bottom of your student activity sheet. 10. Do you think that the food item you chose limits fat, cholesterol and sodium? (If the % Daily Value is 5 or less, the answer is yes.) 11. Does the food item you completed provide enough nutrients? (If the % Daily Value is 20 or greater, the answer is yes.) Read and discuss your Key Concepts! Were you surprised to find the amount of information found on the Nutrition Facts Label? How will you use what you learned to improve your overall diet? Write what you have learned and stamp your Passport to Good Health! Elementary Lab Instructions
4 Investigate! Are You Label Able? Student Activity Sheet Part 1: The entire box of Macaroni and Cheese would contain calories. Part 2: If I only eat 1/2 of a serving, I would consume calories. Part 3: Graph the Nutrition Facts from one food item. Fat Cholesterol Nutrient Sodium Fiber Vitamin A Vitamin C Calcium Iron Percent Daily Value Elementary Student Activity Sheet


5 Investigate! Are You Label Able? 1. Start here. 2. Check calories. 3. Limit fat, cholesterol, and sodium. 4. Get enough of dietary fiber, vitamins, and minerals. 6. Quick Guide to % DV 5% or less is low 20% or more is high 5. Footnotes Elementary Sample Label
6 Investigate! Are You Label Able? Food labels contain Nutrition Facts such as serving size, servings per container, calories and nutrients like proteins, fats and carbohydrates. The first thing to consider is the serving size. Many foods come packaged with more than one serving. Therefore, if you intend to eat the whole thing, multiply the number of servings in the package by the calories to determine just how much you are consuming. Fat, cholesterol and sodium should be limited in a healthy diet. (5% or less is low.) We should make sure our bodies get enough nutrients such as fiber, vitamins and minerals. (20% or more is high.) The % Daily Values (% DV) are based on the Daily Value recommendations for key nutrients, but only for a 2000 calorie diet. You, like most people, may not know how many calories you consume in a day, but you can still use the %DV as a frame of reference. The % DV helps determine if a serving of food is high or low in a nutrient. The percentages are calculated for you and are all put on a scale for the day (0-100% DV). This allows you to tell high (more than 20%) from low (less than 5%) and know which nutrients contribute a lot, or a little, to your daily recommended allowance. Elementary Key Concepts
7 Investigate! Calorie Count Standards References Math GLEs: Grade 3: 8, 17, 47 Grade 4: 14, 15, 44 HEALTH Benchmarks 1-E-2 2-E-1 2-E-2 3-E-1 4-E-4 Materials 1. Assortment of food items with nutrition facts labels such as: Biscuits Chocolate bar Green beans Nuts Pepperoni pizza 2. 4 calculators 3. Paper and pencils 4. 4 jump ropes 4. 4 pedometers with calorie count mode 5. 4 timers or stopwatches 6. 1 shallow box (9x12) labeled Learning Tools Activity Overview Participants will use a pedometer to determine the length of time it takes to burn calories while engaged in physical activity. Key Concepts A calorie is a measure of energy. Excess calories are stored in our bodies as fat and we gain weight. Weight gain can lead to obesity, which is linked to a number of health problems. Physical activity burns calories, leaving less to be stored as unwanted fat. Procedure Preparation: Print the Key Concepts and Lab Instructions on heavy cardstock and place at the Explore Station. Copy one student activity sheet for each family. Set up all materials needed at the station. 1. Choose a food item from the station. 2. Locate the Serving Size and Servings Per Container. 3. Check the number of calories per serving. 4. Choose from the following activities: jog in place, jumping jacks, jump rope, or sit. 5. Using the pedometers and timers provided, begin and continue the activity for 2 minutes. Be sure your pedometer is set on the calorie count mode. 6. Record your information on the Student Activity Sheet. 7. Did you burn the calories in 1 serving of your food item? If not, calculate the length of time it would take to burn the total calories based on the count for 2 minutes. (Hint: You may want to make an input/output table.) 8. Record your answer on the Student Activity Sheet. Be sure to show your work and discuss your strategy with your partner. 9. Read and discuss your Key Concepts! 10. Were you surprised at how difficult it is to burn the calories in just one serving of food? 11. Be sure to write what you have learned and stamp your Passport to Good Health! Closure/Evaluation After completing the activity, families read the information found under Key Concepts and discuss the importance monitoring caloric intake and physical activity. Elementary Activity Plan
8 Investigate! Calorie Count LAB INSTRUCTIONS 1. Choose a food item from the station. 2. Locate the Serving Size and Servings Per Container. 3. Check the number of calories per serving. 4. Choose from the following activities: jog in place, jumping jacks, jump rope, or sit. 5. Using the pedometers and timers provided, begin your activity and continue to exercise for 2 minutes. Be sure your pedometer is set on the calorie count mode. 6. Record your information on the Student Activity Sheet. 7. Did you burn the calories in 1 serving of your food item? If not, calculate the length of time it would take to burn the total calories based on the count for 2 minutes. (Hint: You may want to make an input/output table.) 8. Record your answer on the Student Activity Sheet. Be sure to show your work and discuss your strategy with your partner. Read and discuss your Key Concepts! Were you surprised at how difficult it was to burn the calories in just one serving of food? If we choose to consume extra calories, how much physical activity needs to be done to burn them? Be sure to write what you have learned and stamp your Passport to Good Health! Elementary Lab Instructions
9 Investigate! Calorie Count Student Activity Sheet Food Item: Calories per serving: Activity: Calorie Value for 2 min.: Calculate the length of time it would take to burn the total number of calories in 1 serving of your food item. Show your work and explain your strategy using words, numbers or pictures. Elementary Student Activity
10 Investigate! Calorie Count A calorie is a measure of energy, the capacity to do work. Our bodies need energy for growth, maintenance and physical activity. The number of calories you need depends on your height and weight as well as your age, gender and physical activity. Comparing calories used for various levels of physical activity is important in maintaining one s weight. Younger adults require more calories per pound than older adults. Active people require more calories that inactive people. Excess calories are stored in our bodies as fat and we gain weight. Weight gain can lead to obesity, which is linked to a number of health problems. Physical activity burns calories, leaving less to be stored as unwanted fat. Our bodies burn calories even when we are sleeping and sitting about 1 per minute. Walking 1 mile at a fast pace burns about 100 calories. Jogging burns 3 times more calories than walking. If we choose to consume more calories than our bodies need, we need to increase our physical activity. Elementary Key Concepts
11 Investigate! The Colors of Health Standards References Math GLEs Pre-K: 1, 2, 7 K: 1, 2, 11, 12, 13 Grade 1: 1, 15, 18, 19, 32 Grade 2: 32 Grade 3: 5, 8, 15, 16, 39 Grade 4: 39, 40 HEALTH Benchmarks 1-E-2 3-E-1 4-E-4 5-E-3 6-E-3 Materials 1. The Very Hungry Caterpillar by Eric Carle 2. 1 box labeled Learning Tools 3. Assortment of fruits and vegetables from the 5 color groups 4. 4 calculators 5. Placemat or work mat counters s charts laminated 8. Paper and pencils Activity Overview Participants will read The Very Hungry Caterpillar by Eric Carle and develop a list of various combinations of fruits and vegetables to meet the daily requirements based on the USDA MyPyramid. Key Concepts The USDA recommends eating five to nine servings per day of fruits and vegetables. Persons needing fewer calories would need to eat five servings and persons needing more calories would need to eat nine servings. Eating fruits and vegetables from each color of the color spectrum each day is a good guide. Strategies for combining servings include making an organized list and completing a tree diagram. Procedure Preparation: Print the Key Concepts and The Colors of Health on heavy cardstock and place at the Explore Station. Set up all materials needed at the station. Copies of the student activity sheet should be available. 1. Read The Very Hungry Caterpillar by Eric Carle. Discuss the foods that the caterpillar ate in the entire week. 2. Look at the fruits and vegetables in the bowls in front of you. Select two fruits and three vegetables that you would like to eat on any given day and make sure that each item is a different color! 3. Place them on the orange work mat. (Your mat will look like a rainbow!) 4. Count the total number of items. Do you have 5 fruits and vegetables altogether? 5. Calculate the number of servings of fruits and vegetables that you would consume in one week if you eat five servings each day. 6. Place the fruits and vegetables back in the bowls. 7. Look at the lists of fruits and vegetables grouped by color. 8. List combinations of two servings of fruit and 3 servings of vegetables on the student activity sheet for each day of the week. Each day must be a different combination and you must have each color represented. 9. Congratulations! You have planned your 5 A Day the Color Way for an entire week. 10. Revisit the Eric Carle book, The Very Hungry Caterpillar. Did the caterpillar get his 5 a day? 11. Read the challenge question on your activity sheet and find the solution. 12. Read and discuss your Key Concepts! What did you learn about improving your health through proper nutrition? 13. Be sure to write what you have learned and stamp your Passport to Good Health! Closure/Evaluation After completing the activity, families read the information found under Key Concepts and discuss how important proper nutrition is to the body. Refer families to a fruit and vegetable tasting display if available. Elementary Activity Plan
12 Investigate! The Colors of Health LAB INSTRUCTIONS 1. Read The Very Hungry Caterpillar by Eric Carle. Discuss the foods that the caterpillar ate in the entire week. Which foods do you think were healthy choices? Which were unhealthy choices and why? 2. Look at the fruits and vegetables in the bowls in front of you. Select 2 fruits and 3 vegetables that you would like to eat on any given day, and make sure that each item is a different color! 3. Place them on the orange work mat. (Your mat will look like a rainbow!) 4. Count the total number of items. Do you have 5 fruits and vegetables altogether? 5. Calculate the number of servings of fruits and vegetables that you would consume in one week if you eat 5 servings each day. Use mental math or any tools from the Learning Tools box and share your strategy with your partner. 6. Place the fruits and vegetables back in the bowls. 7. Look at the lists of fruits and vegetables grouped by color. 8. List combinations of 2 servings of fruit and 3 servings of vegetables on the student activity sheet for each day of the week. Each day must be a different combination and you must have each color represented. 9. Congratulations! You have planned your 5 A Day the Color Way for an entire week. 10. Revisit the Eric Carle book, The Very Hungry Caterpillar. Did the caterpillar get his 5 a day? 11. Read the challenge question on your activity sheet and find the solution. (Hint: You may want to make an organized list or a tree diagram.) Read and discuss your Key Concepts What did you learn about improving your health through proper nutrition? Be sure to write what you have learned and stamp your Passport to Good Health! Elementary Lab Instructions
13 Investigate! The Colors of Health Student Activity Sheet MONDAY TUESDAY WEDNESDAY THURSDAY FRIDAY SATURDAY SUNDAY Challenge your brain! List all the different combinations that you can make using the following fruits and vegetables. You must meet the 5 a day requirements of 2 fruits and 3 vegetables! Remember to show your work and explain your thinking. You may use the back of this sheet. (Hint: You may need to make an organized list or a tree diagram.) Red apples and Plums Strawberries and Blueberries Broccoli, White Corn and Carrots Green Beans, Turnips and Sweet Potatoes Asparagus, Potatoes and Yellow Squash Student Activity Sheet
14 Investigate! The Colors of Health RED Red fruits and vegetables contain phytochemicals. Specific phytomchemicals in the red group that are being studied for their health-promoting properties include lycopene and anthocyanins. Include a variety of RED fruits and vegetables in your low-fat diet to help maintain: A healthy heart Memory function A lower risk of some cancers Urinary tract health Include RED fruits and vegetables in your diet such as: Red apples Blood oranges Cherries Cranberries Red grapes Pink/Red grapefruit Red pears Pomegranates Raspberries Strawberries Watermelon Beets Red peppers Radishes Radicchio Red onions Red potatoes Rhubarb Tomatoes Elementary Chart
15 Investigate! The Colors of Health YELLOW/ORANGE Yellow and orange fruits and vegetables contain varying amounts of antioxidants such as vitamin C as well as carotenoids and bioflavonoids, two classes of phytochemicals that scientists are studying for their health-promoting potential. Including YELLOW/ORANGE in your low-fat diet helps maintain: A healthy heart Vision health A healthy immune system A lower risk of some cancers Choose Yellow/Orange fruits and vegetables like: Yellow apples Persimmons Pineapples Tangerines Yellow watermelon Yellow beets Butternut squash Carrots Yellow peppers Yellow potatoes Pumpkin Rutabagas Yellow summer squash Yellow winter squash Sweet potatoes Yellow pears Apricots Cantaloupe Yellow figs Grapefruit Golden kiwifruit Lemon Mangoes Nectarines Oranges Papayas Peaches Yellow tomatoes Sweet corn Elementary Chart
16 Investigate! The Colors of Health WHITE White, tan, and brown fruits and vegetables contain varying amounts of phytochemicals of interest to scientists. These include allicin, found in the garlic and onion family. The mineral selenium, found in mushrooms, is also the subject of research. Including WHITE in your low-fat diet helps maintain: Heart health Cholesterol levels that are already healthy A lower risk of some cancers Get all the health benefits of white by including foods such as: Bananas Brown pears Dates White nectarines White peaches Cauliflower Garlic Ginger Jerusalem artickoke Mushrooms Onions Parsnips Potatoes (white fleshed) Shallots Turnips White Corn Elementary Chart
17 Investigate! The Colors of Health GREEN Green vegetables contain varying amounts of phytochemicals such as lutein and indoles, which interest researchers because of their potential antioxidant, health-promoting benefits. Include GREEN in your low-fat diet to maintain: A lower risk of some cancers Vision health Strong bones and teeth Go green every day with fruits and vegetables like these: Avocados Chayote squash Cucumbers Endive Leafy greens Leeks Lettuce Green onion Okra Peas Green pepper Snow Peas Sugar snap peas Spinach Chinese cabbage Green beans Watercress Zucchini Green apples Green grapes Honeydew Kiwifruit Limes Green pears Artichokes Arugula Asparagus Broccoflower Broccoli Brussels sprouts Green cabbage Celery Elementary Chart
18 Investigate! The Colors of Health BLUE/PURPLE Blue/purple fruits and vegetables contain varying amounts of health-promoting phytochemicals such as anthocyanins and phenolics, currently being studied for their antioxidant and antiaging benefits. Include BLUE/PURPLE in your lowfat diet to help maintain: A lower risk of some cancers Urinary tract health Memory function Healthy aging Get blue/purple every day with foods such as: Blackberries Purple asparagus Purple cabbage Purple carrots Eggplant Purple Belgian endive Purple peppers Blueberries Black currants Dried plums Elderberries Purple figs Purple grapes Plums Raisins Elementary Chart
19 Investigate! The Colors of Health The USDA recommends 5-9 servings per day of fruits and vegetables. The recommendation for children 2-6 years and women is 5 servings 2 fruits and 3 vegetables. (Based on 1600 calories) The recommendation for older children, teen girls, active women and most men is 7 servings 3 fruits and 4 vegetables. (Based on 2200 calories) Teen boys and active men who typically need about 2800 calories should have 9 servings daily. Experts agree that it is essential to sample the complete color spectrum every day to receive the full benefits from the fruits and vegetables that we choose to eat. Many different combinations of fruits and vegetables can be formed to provide variety while meeting the guidelines set by the USDA. Making an organized list and completing a tree diagram are two ways to find different combinations. Many of the phytochemicals and other compounds that make fruits and vegetables good for us also give them their color. Blue/purple fruits and vegetables help maintain urinary tract health, memory function and healthy aging. Include green in your low-fat diet to improve vision health and create strong bones and teeth. White, tan and brown fruits and vegetables help keep us heart healthy and maintain cholesterol levels that are already healthy. Yellow and orange fruits and vegetables help maintain a healthy heart, a healthy immune system and vision health. Red fruits and vegetables help to maintain a healthy heart, memory function and urinary tract health. Fruits and vegetables from the entire color spectrum are believed to lower our risk of certain types of cancer. Elementary Key Concepts
20 Investigate! Feeling the Beat Standards References Math GLEs Grade 2: 1, 2 Grade 3: 1, 2, 8, 11, 13 Grade 4: 1, 2, 13, 14 HEALTH Benchmarks 1-E-2 3-E-1 3-E-2 5-E-6 Materials 1. 4 stopwatches 2. 1 box labeled Learning Tools 3. Base Ten Blocks (starter set) 4. 4 calculators s charts laminated s charts laminated 7. Paper and pencils 8. Student Activity Sheet 9. Heart Rate Chart Activity Overview Participants calculate heart rates at rest and target heart rates following physical activity. Key Concepts Heart rate or pulse is the number of times your heart per minute. Heart rate increases with exercise. A normal resting heart rate for children ages 1-10 is per minute. Children over 10, adults, and well-trained athletes should have lower resting heart rates Heart rate and maximum Heart Rate (MHR) can be predicted through mathematical operations. Your target heart rate when exercising is 60 to 80% of your MHR. Procedure Preparation: Print the Key Concepts and Heart Rate Chart on heavy cardstock and place at the Explore Station. Print a student activity sheet for each family. Note: Kindergarten and first grade students should complete only steps 1, 2, 3, 6, and 7 and no activity sheet. 1. You are going to find your resting heart rate or how many times your heart in one minute. 2. Locate your carotid artery on your neck just below your jawbone. Use your index finger. This is your pulse. 3. Count the number of times you feel the beat while your partner times you for six seconds using the stopwatch provided. (Kindergarten and first grade students should be timed for 60 seconds.) 4. Calculate how many times your heart would beat in 60 seconds or 1 minute. 5. You found your resting heart rate! Now it s your partner s turn. Repeat steps Calculate your heart rate following one minute of physical activity. Time your partner for one minute doing jumping jacks or running in place. 7. Repeat steps 3 and 4. How did exercise affect your heart rate? Record your heart rate after exercise on your activity sheet Part B and discuss your results with your partner. Don t forget to give your partner a turn! 8. Predict your Maximum Heart Rate (MHR) by subtracting your age from 220 using the Base Ten Blocks or any tools from the Learning Tools box. Record your MHR on your activity sheet Part C. 9. Your target heart rate is the rate that you should maintain when exercising to receive maximum health benefits. The target zone is between 60% and 80% of your MHR. 10. Look at the Heart Rate Chart for your age. Was your estimation reasonable? 11. Compare your target heart rate with your partner s. 12. Read and discuss your Key Concepts! 13. Write what you have learned and stamp your Passport to Good Health! Closure/Evaluation After completing the activity, families read the information found under Key Learnings and discuss how important exercise is to the body. Elementary Activity Plan
21 Investigate! Feeling the Beat LAB INSTRUCTIONS Note: Kindergarten and first grade students should complete only steps 1, 2, 3, 6, and 7 and do not complete the activity sheet. 1. You are going to find your resting heart rate or how many times your heart in one minute. 2. Locate your carotid artery on your neck just below your jawbone. Use your index finger. This is your pulse. 3. Count the number of times you feel the beat while your partner times you for 6 seconds using the stopwatch provided. (Kindergarten and first grade students should be timed for 60 seconds.) 4. Calculate how many times your heart would beat in 60 seconds or 1 minute. You may use any of the items found in the Learning Tools box or mental math. Discuss your strategy with your partner. Do you see a pattern? 5. Congratulations! You found your resting heart rate! Record your findings on the activity sheet entitled Feel the Beat. Now it s your partner s turn. Repeat steps Now you are going to calculate your heart rate following 1 minute of physical activity. Time your partner for 1 minute doing jumping jacks. 7. Repeat steps 3 and 4. How did exercise affect your heart rate? Record your heart rate after exercise on your activity sheet and discuss your results with your partner. Don t forget to give your partner a turn! 8. Now you are going to predict your Maximum Heart Rate (MHR) by subtracting your age from 220 using the Base Ten Blocks or any tools from the Learning Tools box. Record your MHR on your activity sheet. 9. Your Target Heart Rate is the rate you should maintain when exercising to receive maximum health benefits. The target zone is between 60% and 80% of your MHR. Can you give an estimation of your target? Would it be more or less than one half of your MHR? Explain your thinking to your partner. 10. Look at the Target Heart rate chart for your age. Was your estimation reasonable? 11. Compare your target heart rate with your partner s. What do you notice about one s heart rate as we age? Write your findings on your activity sheet. Read and discuss your Key Concepts! What did you learn about keeping your body healthy through physical activity? Be sure to write what you have learned and stamp your Passport to Good Health! Elementary Lab Instructions
22 Investigate! Feeling the Beat Student Activity Sheet Part A: I counted in 6 seconds; therefore, my heart would beat times in 60 seconds. My resting heart rate is. This is how I solved the problem: Part B: I counted in 6 seconds; therefore, my heart would beat in 60 seconds. My heart rate after exercising is. This is how I solved the problem: Part C: Maximum Heart Rate (MHR) Challenge your brain! If your resting heart rate is 80, how many times would your heart beat in: a) 5 minutes? b) 10 minutes? d) 1 hour? Show your work and explain your thinking! Elementary Student Activity Sheet
23 Investigate! Feeling the Beat Heart Rate Chart Age 5 yrs. 6 yrs. 7 yrs. 8 yrs. 9 yrs. 10 yrs. Maximum heart rate % target rate % target rate % target rate Age 25 yrs. 30 yrs. 35 yrs. 40 yrs. 45 yrs. 50 yrs. Maximum heart rate % target rate % target rate % target rate Elementary Chart
24 Investigate! Feeling the Beat Heart rate or pulse is the number of times your heart per minute. Heart rate increases with exercise. A normal resting heart rate for children ages 1-10 is per minute. Children over 10 and adults should have a resting heart rate between 60 and 100 per minute. A well-trained athlete could have a resting heart rate as low as 40 per minute. Maximum Heart Rate (MHR) can be predicted by subtracting your age from 220. *Note: There is a wide variation in maximum heart rate among individuals. MHR can vary per minute. Heart rate can be calculated by counting the number of times your heart in 6 seconds and multiplying that number by 10. This will give the number of in 60 seconds or 1 minute. It is recommended that when exercising, you work between 60% and 80% of your MHR. This is known as your target heart rate. If your heart rate is above 80% of your target, you are working too hard. Recommendations state that children engage in some type of physical activity for a minimum of 60 minutes per day. Adults should engage in at least 30 minutes of moderate-intensity physical activity most days of the week. The lower your resting heart rate, the slower your heart is beating, which means that your heart does not have to work so hard and it will probably last longer! Regular exercise has many health benefits. These include weight control, decreased blood pressure, stronger muscles, stress relief and feeling good about oneself. Elementary Key Concepts
25 Investigate! Go Fish! Standards References Math GLEs: Pre-K: 1, 2 K: 1, 2, 12 Grade 1: 33 HEALTH Benchmarks 1-E-2 2-E-2 3-E-1 3-E-2 4-E-4 Materials 1. One deck of Food Cards per Group--laminated and cut. Activity Overview Participants will explore the 5 a Day The Color Way plan by playing the popular card game Go Fish. Key Concepts According to the USDA, eating a low-fat diet that includes five to nine daily servings of fruits and vegetables is a key to developing a healthy lifestyle. Grouping fruits and vegetables by color serves as a reminder to eat a variety each day that provides necessary nutrients needed to stay healthy. Procedure Preparation: Print the Key Concepts, Lab Instructions, and Food Cards on heavy cardstock and place at the Explore Station. Set up all materials needed at the station. 1. You are going to play the popular card game Go Fish with pictures of fruits and vegetables on the face of the cards. 2. Shuffle the cards. Deal each player 5 cards. Place the remaining cards in the deck face down. 3. The object of the game is to make as many pairs of fruits and books of three vegetables as you can. (Each card must be a different color fruit or vegetable!) 4. For example, let s say you are dealt the following hand: okra, broccoli, carrots, blueberries and cherries. You may want to ask your partner for a white vegetable such as potatoes. (Okra and broccoli cannot be used in the same book since they are the same color. You need another color vegetable such as white to go with one of the green vegetables and the carrots. You already have a pair of fruits-1 blue and 1 red.) 5. If your partner has a white vegetable, he or she must give it to you and you put down your pairs and or books. If your partner does not have the card that you ask for, he or she says Go Fish and you draw one card from the deck. 6. If the card that you need is drawn, put down your book and take another turn. 7. If the card you requested is not drawn, it is your partner s turn. 8. The game is over when as many cards as possible are in pairs or books. 9. Read and discuss your Key Concepts! Be sure to write what you have learned and stamp your Passport to Good Health! Closure/Evaluation After completing the activity, families read the information found under Key Concepts and discuss what they learned about the 5 A Day Plan. Elementary Activity Plan
26 Investigate! Go Fish! LAB INSTRUCTIONS 1. You are going to play the popular card game Go Fish with pictures of fruits and vegetables on the face of the cards. 2. Shuffle the cards. Deal each player 5 cards. Place the remaining cards in the deck face down. 3. The object of the game is to make as many pairs of fruits and books of three vegetables as you can. (Each card must be a different color fruit or vegetable!) 4. For example, let s say you are dealt the following hand: okra, broccoli, carrots, blueberries and cherries. You may want to ask your partner for a white vegetable such as potatoes. (You already have a pair of fruits-1 blue and 1 red.) 5. If your partner has a white vegetable, he or she must give it to you and you put down your pairs and or books. If your partner does not have the card that you ask for, he or she says Go Fish and you draw one card from the deck. 6. If the card that you need is drawn, put down your book and take another turn. 7. If the card you requested is not drawn, it is your partner s turn. 8. The game is over when as many cards as possible are in pairs or books. Read and discuss your Key Concepts! What did you learn about the importance of fruits and vegetables in our diets? Do you think you eat enough fruits and vegetables? Be sure to write what you have learned and stamp your Passport to Good Health! Elementary Lab Instructions


27 Investigate! Go Fish! Artichoke Asparagus Avocado Banana Beets Bell Pepper Blueberries Broccoli Brussels Sprouts Elementary Card Game


28 Investigate! Go Fish! Cabbage Cantaloupe Carrots Cauliflower Celery Cherries Corn Cranberries Eggplant Elementary Card Game


29 Investigate! Go Fish! Kiwi Lemon Lettuce Lime Mango Mushroom Nectarine Okra Orange Elementary Card Game


30 Investigate! Go Fish! Garlic Ginger Grapefruit Granny Smith Green Grapes Green Onions Apple Papaya Peach Pear Elementary Card Game


31 Investigate! Go Fish! Peas Pineapple Plum Pomegranate Potato Pumpkin Purple Cabbage Purple Grapes Radish Elementary Card Game


32 Investigate! Go Fish! Raspberries Red Apple Yellow Pepper Red Pear Strawberries White Onions Tomato Turnip Watermelon Elementary Card Game


33 Investigate! Go Fish! Yellow Squash Zucchini Green Beans Elementary Card Game
34 Investigate! Go Fish! According to the USDA, eating a low-fat diet that includes five to nine daily servings of fruits and vegetables is the key to developing a healthy lifestyle. Grouping fruits and vegetables by color serves as a reminder to eat a variety each day that provides necessary nutrients needed to stay healthy. Fewer than 15 percent of elementary students eat the recommended 5 or more servings of fruits and vegetables every day. The average fruit and vegetables intake among 6-11 year olds is only 3.5 servings a day. One quarter of all vegetables eaten by elementary students are French fries. Colorful fruits and vegetables provide a wide range of the vitamins, minerals, fiber and phytochemicals our bodies use to stay healthy and energetic. They also help us maintain a healthy weight, protect us against the effects of aging and reduce the risk of cancer, heart disease, high blood pressure and other chronic diseases. To learn more about the 5 A Day The Color Way plan, visit Elementary Key Concepts
35 Standards References Math GLEs Grade 3: 6, 7, 8, 13, 15, 16, 25, 28, 39, 43 Grade 4: 13, 14, 19, 21, 22, 24 HEALTH Benchmarks 1-E-2 1-E-3 2-E-2 3-E-1 4-E-4 5-E-6 6-E-3 Materials 1. Small, Medium and Large popcorn containers 2. Small, Medium and Large drink cups 3. Assortment of movie packs of candy 4. 4 calculators 5. 4 one-cup measuring cups 6. Large bowl cups popped popcorn 8. Paper and Pencils Investigate! Going to the Movies: The Calorie Cost Activity Overview Participants will estimate and measure popcorn and examine nutrition facts labels on Movie Packs of popular candy and soda to determine the calorie cost of one trip to the theatre. Key Concepts Containers of popcorn purchased at a movie theatre can contain as many calories as needed for the entire day. We tend to purchase the large sizes of refreshments when watching a movie because they are the best buy; however, the number of extra calories is more than what is suggested in MyPyramid. The discretionary, or extra, calorie allowance in the USDA MyPyramid is the remaining amount of calories after nutrient-dense forms of foods in each food group are selected. Estimating quantities is an essential skill when food items are not packaged and labeled. Daily caloric intake should be compared with recommended intake and adjusted accordingly. Procedure Preparation: Print the Key Concepts on heavy cardstock and place at the Explore Station. Set up all materials needed at the station. Clearly label all containers. 1. Estimate the number of 1-cup servings in the largest container of popcorn. 2. Empty the popcorn into the bowl and measure the exact number of cups. 3. Compare your estimation to the exact measure. 4. Calculate the number of calories that you would consume if you ate all of the popcorn based on the information provided in the lab instructions. 5. Compare the number of calories in the popcorn to a 2000-calorie a day plan. 6. Calculate your calorie consumption if you shared the popcorn with a friend. What if you divided the popcorn with 3 friends? Would this be a combining situation or a separating situation? 7. Locate the Nutrition Facts Label on the back of on box of candy that you might buy at the movies. 8. Record the calories per serving. How many servings are in the box? How many calories would you consume if you ate the whole box? 9. Calculate your calorie consumption if you shared the candy with a friend. What if you shared the candy with 3 friends? Record your answer. 10. What size soda you do you usually order? 11. Calculate the number of calories in your soda based on the information provided in the lab instructions. 12. Add up the total calorie cost for your trip to the movies. 13. Read and discuss your Key Concepts! What did you learn about extra calories when compared to a trip to the movies? 14. Write down what you have learned and stamp your Passport to Good Health! Closure/Evaluation After completing the activity, families read the information found under Key Concepts and discuss the ways to decrease the calorie cost of going to the movies. Elementary Activity Plan
36 Investigate! Going to the Movies: The Calorie Cost LAB INSTRUCTIONS 1. Look at the largest container of popcorn and estimate the number of 1-cup servings it contains. 2. Empty the popcorn into the bowl and measure the exact number of cups. 3. Compare your estimation to the exact measure. Did you estimate more or less? How much more? How much less? 4. Calculate the number of calories that you would consume if you ate all of the popcorn based on the following information: 1 cup contains approximately 68 calories with added butter and approximately 40 calories without added butter. You may use the calculator or pencil and paper. Use your estimation skills (rounding) so that you will know if your answer is reasonable or not! 5. Record and organize your answer on a blank sheet of paper. 6. Compare the number of calories in the popcorn to a 2000-calorie a day plan. Discuss your findings with your partner. 7. Calculate your calorie consumption if you shared the popcorn with a friend. What if you divided the popcorn with 3 friends? Would this be a combining situation or a separating situation? Record your findings. 8. Choose 1 box of candy that you might buy at the movie. 9. Locate the Nutrition Facts Label on the back of the box. 10. Record the calories per serving. Now look at the number of servings per box. How many calories would you consume if you ate the whole box? Discuss your findings with your partner. Record your answer. 11. Calculate your calorie intake if you shared the candy with a friend. What if you shared the candy with 3 friends? Record your answer. 12. You are probably thirsty by now! What about a soda? 13. Decide which size you would order. (The largest is usually the best buy.) 14. Calculate the number of calories in your soda based on the following information: 24 oz. contains 320 calories, 48 oz. contains 640 calories and the 64 oz. a whopping 850 calories. Record your answer. 15. Now find the total calorie cost for your trip to the movies. You may use the figures based on one individual consuming all of the food items or the number of calories consumed if you shared. Record your findings and discuss the cost with your partner. Read and discuss your Key Concepts! What did you learn about discretionary calories? Do you need to make healthier choices at when going to the movies? Be sure to write what you have learned and stamp your Passport to Good Health! Elementary Lab Instructions
37 Investigate! Going to the Movies: The Calorie Cost While popcorn is considered a nutritious snack, consuming large quantities such as those sold at a movie theatre can cause one s calorie count to go through the roof! According to USA Today, a large tub of buttered popcorn while proving to be the most economical contains 1640 calories and is approximately 15 servings. The oversized candy boxes contain between 2 and 6 servings each and are loaded with empty calories. We tend to purchase the large soft drink because it is the best buy, but a 48 oz. soft drink has about 640 calories and the 64 oz. about 850 calories. The discretionary, or extra, calorie allowance in the USDA MyPyramid refers to the remaining daily amount of calories in each calorie level after nutrient-dense forms of foods in each food group are selected. This extra calorie allowance is based on an individual s caloric needs based on age, gender, and activity level and ranges from 170 to 410 calories. Children 7-9 years of age with a calorie level of 1400 have a discretionary calorie allowance of 170. This is less that the number of calories in a 24 oz. soda! Children 7-9 years old with a calorie level of 1600 have a discretionary calorie allowance of 132. A 35-year-old female who needs to consume 2000 calories per day has a discretionary calorie allowance of 267. A 35-year-old male whose calorie level is 2600 is allowed 410 discretionary, or extra, calories. A trip to the movies can be very costly in terms of calories! Elementary Key Concepts
38 Investigate! It s All in a Day s Work Standards References Math GLEs: Grade 2: 8, 12, 32 Grade 3: 8, 11, 15, 16, 43, 47 Grade 4: 14 HEALTH Benchmarks 1-E-2 1-E-3 2-E-2 3-E-1 3-E-2 4-E-4 Materials 1. 4 calculators 2. Pencils 3. Student activity sheet Activity Overview Participants will explore calorie values for everyday activities. Key Concepts A calorie as the amount of energy required to raise the temperature of 1 gram of water by 1 degree Celsius. In nutrition, we work in kilocalories, but we refer to them as Calories with a capital C. The calories that we need for maintenance and growth come from the foods that we eat. We use calories when engaged in various activities, including sitting and resting. The more physically active we are, the more calories we need. Procedure Preparation: Print the Key Concepts, Lab Instructions and Activity Chart on heavy cardstock and place at the Explore Station. Copy one student activity sheet for each family. Set up all materials needed at the station. 1. Review the Activity Chart on the display board. 2. Pretend that it is Saturday and that you are playing, resting and doing your chores. Include everyday activities such as dressing and walking on your list. 3. Make a list of activities from the chart that you might be doing and record the calorie value for every 10 minutes on the Student Activity sheet provided. 4. Use the student activity sheet to record the calories needed every 10 minutes of the activities you plan to do. Calculate the calories needed for the length of time that you are engaged in that activity. For example, if it takes you 30 minutes to mow the lawn, you would need to multiply 34 calories times 3, because there are 3 tens in Total the calories needed for your entire pretend day. 6. Were you surprised to learn how many calories your body needs? 7. What do you think would happen if your body did not have the calories that it needs? (We lose weight.) What would happen when you took in more calories than we use? (We gain weight.) 8. Read and discuss your Key Concepts! 9. Be sure to write what you have learned and stamp your Passport to Good Health! Closure/Evaluation After completing the activity, families read the information found under Key Concepts and discuss the importance of maintaining recommended calorie levels. Elementary Activity Plan
39 Investigate! It s All in a Day s Work LAB INSTRUCTIONS 1. Review the Activity Chart on the display board. 2. Pretend that it is Saturday and that you are playing, resting and doing your chores. Include everyday activities such as dressing and walking on your list. 3. Use the student activity sheet to record the calories needed every 10 minutes of the activities you plan to do. 4. Calculate the calories needed for the length of time that you are engaged in the activity for example, if it takes you 30 minutes to mow the lawn, you would need to multiply 46 times 3, because there are 3 tens in Total the calories needed for your entire pretend day. 6. Were you surprised to learn how many calories your body needs? 7. What do you think would happen if your body did not have the calories that it needs? (We lose weight.) What would happen when you took in more calories than we use? (We gain weight.) Read and discuss your Key Concepts! Did you know that your body needed so many calories just to do everyday activities and chores? What do you think would happen if your body doesn t have the calories that it needs? Be sure to write what you have learned and stamp your Passport to Good Health! Elementary Lab Instructions
40 Investigate! It s All in a Day s Work Student Activity Sheet Activity Calorie Value for Total Calorie 10 Minutes Value Grand Total: Elementary Student Activity
41 Investigate! It s All in a Day s Work Activity Chart Activity Calories used every 10 minutes for a 100 pound person Bathing, sitting 5 Biking, leisurely 71 Cleaning, such as dusting, taking out trash, washing dishes. Dressing and undressing 10 Frisbee 20 Gardening 30 Hopscotch 41 Housework, such as sweeping floors 23 Jumping rope 91 Making Beds 10 Mowing grass 46 Playing the piano 15 Sitting 5 Soccer 61 Walking the dog Source: USDA MyPryamid Tracker Elementary Calorie Chart
42 Investigate! It s All in a Day s Work A calorie is the amount of energy required to raise the temperature of 1 gram of water by 1 degree Celsius. In nutrition, we work in kilocalories, but we refer to them as Calories with a capital C. The calories that we need for maintenance and growth come from the foods that we eat. We use calories when engaged in various activities, including sitting and resting. The more physically active we are, the more calories we need. According to the USDA MyPyramid, 5 and 6 year old children need approximately 1400 calories each day. Children ages 7-9 need approximately 1600 calories each day. The calorie needs for older children and adults range from , depending on age, gender and physical activity. Elementary Key Concepts
43 Investigate! Line Them Up Standards References Math GLEs Kindergarten: 3 Grade 1: 32 Grade 2: 5, 26, 30, 32 Grade 3: 2, 5, 7, 8, 13, 17, 27, 43, 47 Grade 4: 10, 13, 14 HEALTH Benchmarks 1-E-2 2-E-1 2-E-2 4-E-4 Materials 1. Food Cards (laminated) 2. Answer key (bound and laminated) 3. Container of shortening counters 5. 1 tsp. measuring spoon 6. Small paper plates 7. 4 calculators 8. 4 hundreds charts laminated 9. Paper and pencils shallow box (9x12) labeled Learning Tools Activity Overview Participants will identify the fat content of foods in restaurants by playing a game entitled Line Em Up. Key Concepts Four grams of fat is equal to approximately one teaspoon of shortening. Our bodies need some fats. However, if a large proportion of our diet consists of fatty foods, we risk becoming overweight and having a number of health problems such as heart attack, stroke and certain cancers. Comparing the amounts of fats found in the foods we consume will help us make healthier choices when eating out. Calculating the number of teaspoons of fat that is the equivalent of total fat grams for certain foods is important in making healthy choices. Procedure Preparation: Print and post the Key Concepts and Lab Instructions. Print and cut apart the Food Cards. Set up all materials needed at the Explore station including the Learning Tools box. The food display, Compare the Fat in These Snacks, described in the Appendix would enhance this activity. Part 1 Have participants arrange the food cards in the order of fat content. 1. Look at the Food Cards provided. 2. Discuss the amount of fats that you think may be found in each food item. 3. Choose 5 cards. Work with your partner and arrange the cards in order from least to greatest based on your predications. 4. Check your answer using the answer key provided. 5. Rearrange the cards if necessary. Part 2 Calculate the number of teaspoons of fat in various foods. 1. Choose one food item from the Food Cards. 2. Calculate the number of teaspoons of shortening that would be equivalent to the fat content of the food item. (Each teaspoon of shortening is equal to 4 grams of fat.) Use any of the items from the Learning Tools box as needed. 3. Place the shortening on the plate provided. This is the amount of fat that you are consuming when you eat that particular food item. 4. Have your partner guess which food item you chose based on the amount of shortening on the plate. Part 3 1. Read and discuss your Key Concepts! Were you surprised at the amounts of fat found in any of the foods? How will what you learned today influence your choices next time you are at a restaurant? Can you continue to enjoy your favorite foods but decrease the amount of fat in your diet? 2. Be sure to write what you have learned and stamp your Passport to Good Health! Closure/Evaluation After completing the activity, families read the information found under Key Learnings and discuss the importance of limiting fat consumption. Elementary Activity Plan
44 Investigate! Line Them Up LAB INSTRUCTIONS Part 1 Arrange the food cards in the order of fat content. 1. Look at the Food Cards provided. 2. Discuss the amount of fats that you think may be found in each food item. 3. Choose 5 cards. Work with your partner and arrange the cards in order from least to greatest based on your predications. 4. Check your answer using the answer key provided. 5. Rearrange the cards if necessary. Part 2 Calculate the number of teaspoons of fat. 1. Choose one food item from the Food Cards. 2. Calculate the number of teaspoons of shortening that would be equivalent to the fat content of the food item. (Each teaspoon of shortening is equal to 4 grams of fat.) You may use any of the items found in the Learning Tools box or mental math. 3. Place the shortening on the plate provided. This is the amount of fat that you are consuming when you eat that particular food item. 4. Have your partner guess which food item you chose based on the amount of shortening on the plate. 5. Place the shortening back in its container. You may discard the plate. Thank you for cleaning up your area! Read and discuss your Key Concepts! Were you surprised at the amounts of fat found in any of the foods? How will what you learned today influence your choices next time you are at a restaurant? Be sure to write what you have learned and stamp your Passport to Good Health! Elementary Lab Instructions
45 Investigate! Line Them Up Grilled Chicken Sandwich Roast Beef Sandwich (plain) Chili Con Carne (1 cup) Cheese Pizza (2 slices) Hamburger (regular-plain) Bean Burrito French Fries (small order) Cheeseburger (plain) Looking at Nutrition Through Core Content Elementary Activity Cards
46 Investigate! Line Them Up Fish Filet Sandwich (cheese and tarter sauce) Breaded Chicken Filet Sandwich (with mayo) Pepperoni Pizza (2 slices) Cheeseburger (large with the works) Chicken Nuggets (6) Fried Chicken (breast and wing) Taco (2 small) Looking at Nutrition Through Core Content Elementary Activity Cards
47 Investigate! Line Them Up FOOD FAT GRAMS Grilled chicken sandwich 4 Chili con carne, 1 cup 7 Hamburger, regular, plain 9 French fries, small order 10 Roast beef sandwich, plain 11 Pizza, cheese, 2 slices of 12-inch pizza 11 Burrito with beans 12 Cheeseburger, regular, plain 14 Fish fillet sandwich, with cheese & tartar sauce 16 Pizza, pepperoni, 2 slices of 12-inch pizza 17 Chicken nuggets, 6 18 Taco, 2 small 22 Fried chicken, breast and wing 28 Breaded chicken fillet sandwich with mayo 30 Cheeseburger, large, with the "works" 30 Elementary Answer Key
48 Investigate! Line Them Up Four grams of fat is equal to approximately one teaspoon of shortening. Our bodies need some fats, but if a large proportion of our diet consists of fatty foods, we risk becoming overweight and having a number of health problems such as heart attack, stroke and certain cancers. Comparing the amounts of fats found in the foods we consume will help us make healthier choices when eating out. Calculating the number of teaspoons of fat that is the equivalent of total fat grams for certain foods that may be ordered is also important in making healthy choices. Choose regular sandwiches instead of doubles, and plain types instead of those with lots of extras, such as cheese, bacon and special sauces. Grilled or broiled sandwiches are lower in fat than fried sandwiches. Pizza toppings can add a lot of fat. Choose plain cheese pizza or pizza made with vegetable toppings. These kinds of pizza are lower in fat than pizza made with sausage, pepperoni or other meat toppings. Foods eaten at a restaurant can be part of a healthy diet if you make the right choices. Elementary Key Concepts
49 Standards References Math GLEs Grade K: 11, 15 Grade 1: 6, 24 Grade 2: 2, 11, 14, 17 Grade 3: 3, 17, 21, 25, 28 Grade 4: 6, 9, 22, 24, 27 HEALTH Benchmarks 1-E-2 1-E-3 3-E-1 4-E-4 Materials 1. Paper plates and bowls 2. 2 spring scales sets measuring cups 4. 3 serving spoons 5. 2 Tongs 6. Rolls, one dozen 7. Deli turkey, sliced, 1 lb. 8. Canned corn 9. Canned green beans 10. Green salad 11. Paper towels 12. Tray for meat and bread 13. Fraction Pieces (not labeled) 14. Garbage bag or trash can Investigate! Portions vs. Servings: One Size Does NOT Fit All Activity Overview Participants will compare portions to the recommended serving sizes as outlined in the new Food Pyramid developed by the USDA based on age, gender and physical activity. Key Concepts MyPyramid is a customized plan based on one s age, gender and physical activity. Each individual s plan includes the number of servings recommended from each of the 5 food groups. Recommended servings are generally much smaller than the portions that we often pile on our dinner plate! One serving varies according to the food type and preparation. Measuring portions ensures that the amount of food consumer will not exceed the recommended serving sizes. When it is not convenient to measure servings, use the body benchmarks to estimate the quantity. Procedure Preparation: Post the Key Concepts and Single Servings Charts at the Explore Station. Arrange the foods in bowls with serving spoons like family-style meal service. Make 1 copy of the Student activity sheet, Portions vs. Servings. 1. Look at the food items and select 1 salad, 1 entrée, 2 vegetables and bread. 2. Using the salad bowls and paper plates, place the portions that you would normally eat on your plate as if you were at a buffet or at home. 3. Estimate the amount of each of your selections using cups for the salad and vegetables and ounces for the meat and bread. 4. Record your estimations on the student activity sheet Part A. 5. Review the Single Servings page and note the recommended serving sizes that correspond with your meal choices. 6. Using the measuring cups and the spring scale, measure the same foods chosen for your meal and place the recommended servings on another plate. 7. Compare the portions that you dished up to the servings that you measured. Which are larger? Discuss your findings with your partner. 8. Look at the Fraction Pieces in the basket. If the black rectangle represents 1 whole cup, what color would be equivalent to ½ c.? ¼ c.? Which is larger ½ c. or ¼ c.? How many ½ c. would it take to equal 3 whole c.? Record your findings on the student activity sheet Part B. 9. Calculate the amount of each food item that you would need to prepare for a family of 5 based on the recommended serving size and record your answers on the student activity sheet Part C. 10. Read and discuss your Key Concept! Write what you have learned and stamp your Passport to Good Health! Closure/Evaluation After completing the activity, families read the information found under Key Concepts and discuss the difference between a portion and the recommended serving size of grains, meats and vegetables. Looking at Health through Core Content Elementary Activity Plan
50 Investigate! Portions vs. Servings: One Size Does NOT Fit All LAB INSTRUCTIONS 1. Look at the food items and select 1 salad, 1 entrée, 2 vegetables and bread. 2. Using the salad bowls and paper plates, place the portions that you would normally eat on your plate as if you were at a buffet or at home. 3. Estimate the amount of each of your selections using cups for the salad and vegetables and ounces for the meat and bread. 4. Record your estimations on the student activity sheet Part A. 5. Put your meal aside for a moment. 6. Review the Single Servings posted. Locate the recommended serving size that corresponds with your meal choices. 7. Using the measuring cups and the spring scale, measure the same foods chosen for your meal and place the recommended servings on another plate. 8. Compare the portions that you dished up to the servings that you measured. Which are larger? Discuss your findings with your family. 9. Place all food items back in the appropriate containers. Discard your used paper plates. 10. Look at the Fraction Pieces in the basket. If the black rectangle represents 1 whole cup, what color would be equivalent to ½ cup? ¼ cup? Which is larger ½ cup or ¼ cup? How many ½ cup(s) would it take to equal 3 whole cups? Record your findings on the student activity sheet Part B. 11. Calculate the amount of each food item that you would need to prepare for a family of five based on the recommended serving size and record your answers on the student activity sheet Part C. Read and discuss your Key Concepts! What did you learn about serving sizes? Do you need to decrease the size of your portions at mealtime? Be sure to write what you have learned and stamp your Passport to Good Health! Elementary Lab Instructions
51 Investigate! Portions vs. Servings Single Servings Fruit Group (Choose fresh, frozen, or canned fruit packed in water or unsweetened juice) ½ cup fruit ¼ cup dried fruit ¾ cup 100% fruit juice 1 medium whole fresh fruit Vegetable Group (Choose fresh, frozen, or canned) 1 cup raw leafy green vegetables ½ cup cut-up raw, canned or cooked vegetables Meat and Beans (Choose lean meat, fish, or poultry with the skin removed) ½ cup cooked dry, canned or frozen beans 1-3 ounces of meat 1 egg 1 Tbsp. peanut butter Grains (Make half your grain servings whole grains) 1 slice bread ½ hamburger bun ½ cup cooked rice, pasta, or cooked cereal Elementary Serving Sizes
52 Part A: Estimation Investigate! Portions vs. Servings Student Activity Sheet 1. Salad cup(s) 2. Meat ounces 3. Vegetables: cup(s) cup(s) 4. Bread ounce(s) Part B: Equivalents 1. Which is greater-1/2 cup or ¼ cup? 2. How many1/2 cups = 1 cup? 3. How many ¼ cups = 1 cup? 4. How many ½ cups = 2 cups? 5. How many ½ cups = 3 cups? 6. About how much is a handful of corn? Part C: Calculations In order to feed a family of 5, I would need to prepare the following: cups of salad ounces of meat cups of vegetables ounces of bread Elementary Student Activity Sheet
53 Investigate! Portions vs. Servings: One Size Does NOT Fit All In 2005, the USDA introduced MyPyramid, a new pyramid that provides a customized plan based on one s age, gender and physical activity. o Children ages 5-6 who engage in minutes of physical activity need 3 servings of fruits, 3 servings of vegetables, 5 ounces or the equivalent of grains, 4 ounces or the equivalent of lean meat and beans, 2 cups of milk, and no more than 17grams of oils each day. (Based on 1400 calories) o Children ages 7-9 need the following: 3 servings of fruits, 4 servings of vegetables, 5 ounces or the equivalent of grains, 5 ounces or the equivalent of lean meat and beans, 3 cups of milk, and no more than 22 grams of oils each day. (Based on 1600 calories) o A 35-year-old female should consume 4 servings of fruits, 5 servings of vegetables, 6 ounces or the equivalent of grains, 5.5 ounces or the equivalent of lean meat and beans, 3 cups of milk, and no more than 27 grams of oils each day. (Based on 2000 calories) o A 35-year-old male who engages in minutes of physical activity needs 4 servings of fruits, 7 servings of vegetables, 9 ounces or the equivalent of grains, 6.5 ounces or the equivalent of lean meat and beans, 3 cups of milk, and no more than 34 grams of oils each day. (Based on 2600 calories) Recommended servings are generally much smaller than the portions that we often pile on our dinner plates! Measuring portions ensures that the amounts you are consuming do not exceed the recommended serving size. One serving includes the following: 1 cup leafy green vegetables, ½ cup canned or cooked vegetables, fruit, or beans, ¼ cup dried fruit, ¾ cup fruit juice, 3 ounces of meat, 1 slice bread, ½ hamburger bun, ½ cup cooked rice, pasta, or cooked cereal, and 1 egg counts as 1 ounce of meat. When it isn t convenient to measure your servings, use the following body benchmarks to estimate the quantity: o 1 cup of cereal is about the size of a fist o 1 ounce of cheese is about the size of your thumb o 3 ounces cooked meat is about the size of the palm of your hand o ½ cup cooked rice or pasta will fit in your hand o 1 teaspoon butter is the size of a fingertip o 1 ounce of nuts is one handful Elementary Key Concepts
54 Investigate! A Spoonful of Sugar Standards References Math GLEs Grade 3: 8, 13, 15, 17, 25, 28, 39, 43 Grade 4: 13, 14, 15, 21, 22, 36 HEALTH Benchmarks 1-E-2 2-E-1 2-E-2 4-E-4 Materials 1. One 1 lb. bag of sugar 2. Covered container for sugar 3. 1 simple balance scale centimeter cubes 5. 1 tsp. measuring spoon 6. One 1-cup containers labeled Estimation and Exact Measure 7. 4 calculators 8. 4 hundreds charts laminated counters 10. Paper and pencils shallow box (9x12) labeled Learning Tools 12. Copies of data chart-a Spoonful of Sugar 13. Assortment of popular snack food items such as soda, instant fruit-flavored beverage, 100% fruit juice candy bars, pop-tarts, and granola bars 14. Tray for food items Activity Overview Participants will construct a visual designed to create an awareness of high levels of refined, added sugar found in popular snack food items and sodas. Key Concepts Most Americans consume too much sugar, which leads to health problems such as obesity and tooth decay. Sugar or sucrose is defined as a simple carbohydrate derived from sugar cane and sugar beets. Other sugars on the market include fructose, high fructose corn syrup, glucose, lactose and maltose. A can of cola contains 10 teaspoons of sugar. One teaspoon of sugar weighs 4 grams and contains 16 calories or 4 calories per gram. Popular snack items contain large amounts of sugar and have very little nutritional value. Students should be able to use a variety of strategies to solve math problems Procedure Preparation: Print the Lab Instructions and Key Concepts on heavy cardstock and place at the Explore Station. Set up all materials needed at the station. Make copies of the student activity sheet. Make sure all containers are clearly labeled as to their contents. Use the Learning Tools box to organize your materials. 1. Measure exactly 10 level teaspoons of sugar using the measuring spoon and place it in the container labeled Exact Measure. This is the amount of sugar found in one 12-ounce can of cola. Each teaspoon of sugar is equal to 4 grams and contains 16 calories. 2. Calculate the grams of sugar that are equivalent to 10 teaspoons of sugar. 3. Check your answer by placing the 10 teaspoons of sugar in one side of the balance and the cm cubes in the other side of the balance. 4. Choose the snack items from the tray that you might eat on a given day and locate the Nutrition Facts Food Label on each item. 5. Using the data chart on your activity sheet, list the amount of sugar in grams found in each of your choices. 6. You know that 4 grams is equal to 1 teaspoon of sugar. What strategy would you use to measure the amount of sugar in teaspoons found in your snack choices? 7. Do you consume more or less than the amount of sugar that you estimated in step 6? How much more? How much less? 8. Read and discuss your Key Concepts! What did you learn about your sugar intake? Do you need to make healthier choices when purchasing snack items? 9. Write what you have learned and stamp your Passport to Good Health! Closure/Evaluation After completing the activity, families read the information found under Key Concepts and discuss the importance of limiting sugar consumption. Elementary Activity Plan
55 Investigate! A Spoonful of Sugar LAB INSTRUCTIONS 1. Measure exactly 10 level teaspoons of sugar using the measuring spoon and place it in the container labeled Exact Measure. This is the amount of sugar found in one 12-ounce can of cola as well as most sodas. Each teaspoon of sugar is equal to 4 grams. 2. Calculate the number of grams that would be equivalent to 10 teaspoons of sugar. You may use any of the items in the Learning Tools box or mental math. Count the number of centimeter cubes that you calculated would equal 10 teaspoons of sugar. (Each cm cube weighs exactly 1 gram.) 3. Check your answer by placing the 10 teaspoons of sugar and the cm cubes in the trays on the balance scale in the appropriate trays. Does the scale balance? If so, your answer is correct! 4. Think about your estimation of how many teaspoons of sugar that you think you consume each day and make necessary adjustments. 5. Choose the snack items from the tray that you might eat on a given day and locate the Nutrition Facts Food Label on each item. 6. Using the data chart on your activity sheet, list the amount of sugar in grams found in each of your choices. 7. You know that 4 grams is equal to 1 teaspoon of sugar. What strategy would you use to measure the amount of sugar in teaspoons found in your snack choices? Show your thinking using words, numbers or pictures. Use the back of your activity sheet and record your results in the appropriate column on your data chart. 8. Do you consume more or less than the amount of sugar that you estimated in step 4? How much more? How much less? 9. Place the sugar and the cm cubes back in their original containers. Thank you for cleaning up your area! Read and discuss your Key Concepts! What did you learn about your sugar intake? Do you need to make healthier choices when purchasing snack items? Be sure to write what you have learned and stamp your Passport to Good Health! Elementary Lab Instructions
56 Investigate! A Spoonful of Sugar Student Activity Sheet Snack Food Sugars in Grams Teaspoons of Sugar Challenge your brain! You know that one can of soda contains 40g of sugar. How many grams would there be in: a) 5 cans? b) 10 cans? c) 100 cans? Don t forget to show your work and explain your thinking! Elementary Student Activity Sheet
57 Investigate! A Spoonful of Sugar Health experts agree that most Americans eat too much sugar, which leads to many health problems, including obesity and tooth decay. Sugar, or sucrose, is defined as a simple carbohydrate derived from sugarcane and sugar beets. Other sugars on the market include fructose, glucose, lactose, maltose, and high fructose corn syrup. MyPyramid and other dietary guidelines suggest drinking beverages and choosing snacks with little added sugar or sweeteners. Popular snack food items contain large amounts of sugar and have very little nutritional value. Sugar can be found on the Nutrition Facts food label under Total Carbohydrate. Keep in mind that the sugars listed here include naturally occurring sugars, like those in fruit or milk, as well as those added to a food or drink. You can find the specific types of sugars (listed above) in the list of ingredients. The USDA recommends that discretionary calories not exceed 130 per day for children ages 7-9. The average can of soda contains 10 teaspoons of sugar and 160 calories. One teaspoon weighs 4 grams and contains 16 calories or 4 calories per gram. There are many ways to reduce the amount of sugar in your daily diet. Always read the nutrition facts label and the ingredient list and avoid purchasing food with high sugar content. Another option is to replace high sugar snack foods with fresh fruit, which contain only natural sugar. Elementary Key Concepts
58 Investigate! Time to Move! Standards References Math GLEs: Grade 1: 15, 18, 21 Grade 2: 5, 8, 9, 12, 16 Grade 3: 11, 17, 24 Grade 4: 23 HEALTH Benchmarks 1-E-2 1-E-3 2-E-2 3-E-1 3-E-2 4-E-4 5-E-6 Materials 1. 4 calculators 2. 4 student clocks 3. Pencils and paper 4. 4 Hundred s Charts 5. Learning Tools box Activity Overview Participants will create a Weekly Activity Chart, which meets the daily recommendations for physical activity according to the U.S. Dietary Guidelines. Key Concepts The U.S. Dietary Guidelines recommends that children participate in at least 60 minutes of moderate-intensity physical activity most days of the week, preferably daily. The recommendation for adults is at least 30 minutes of moderateintensity activities 5 or more days per week or vigorous-intensity activities 3 or more days per week for 20 or more minutes per session. Regular exercise has many health benefits including weight control, decreased blood pressure, stronger bones and muscles, stress relief and feeling good about oneself. Procedure Preparation: Print the Key Concepts, Lab Instructions, Activity Lists and Weekly Activity Chart on heavy cardstock and place at the Explore Station. Copy one student activity sheet for each family. Set up all materials needed at the station. 1. Review the Weekly Activity Chart on the display board. 2. Calculate the total number of minutes of physical activity for each day and record the totals in Part A of the student activity sheet provided. 3. Are the totals at least 60 minutes per day? (You need at least 1 hour of physical activity per day.) If your answer is no, how many more minutes are needed to have a minimum of 60 minutes per day? Record your answers on the activity sheet. 4. List the days of the week from Part A where the number of minutes is equal to or greater than 1 hour. 5. Write the time spent using hours and minutes. 6. Look at the Activity Lists for students and adults. 7. Think about activities that interest you and ones that you may like to try. 8. Create your own Weekly Activity Chart at home! 9. Read and discuss your Key Concepts! 10. Be sure to write what you have learned and stamp your Passport to Good Health! Closure/Evaluation After completing the activity, families read the information found under Key Concepts and discuss the importance of making physical activity part of a family s daily routine. Elementary Activity Plan
59 Investigate! Time to Move! LAB INSTRUCTIONS 1. Review the Weekly Activity Chart on the display board. 2. Calculate the total number of minutes of physical activity for each day and record the totals in Part A of the student activity sheet provided. 3. Are the totals at least 60 minutes per day? (You need at least 1 hour of physical activity per day.) If your answer is no, how many more minutes are needed to have a minimum of 60 minutes per day? Record your answers on the activity sheet. 4. List the days of the week from Part A where the number of minutes was equal to or greater than 1 hour. 5. Write the time spent using hours and minutes. 6. Look at the Activity Lists for students and adults. 7. Think about activities that interest you and ones that you may like to try. 8. Create your own Weekly Activity Chart at home! Go to Read and discuss your Key Concepts! Do you think that you participate in at least 60 minutes of physical activity each day? What are some activities that you would like to try in order to increase your daily activity? Be sure to write what you have learned and stamp your Passport to Good Health! Elementary Lab Instructions
60 Investigate! Time to Move! Adult Activity List Moderate Activity Walking for pleasure Walking the dog Hiking Roller Skating - leisurely pace Bicycling General home exercises Aerobic dancing Yoga Golf Softball Basketball-shooting baskets Coaching sports Playing Frisbee Swimming-recreational Gardening and yard work Mowing the lawn Actively playing with children Home repair-light Vigorous Activity Jogging or running Roller skating-brisk pace Bicycling more than 10 mph Aerobic dancing-high impact Calisthenics Jumping rope Jumping jacks Football game Basketball game Soccer Kickball Swimming-steady laps Heavy gardening and yard work Home repair or construction Elementary Activity List
61 Investigate! Time to Move! Student Activity List Baseball Basketball Bicycling Cheerleading Dance Team Football Frisbee Golf Hiking Inline Skating Jump Rope Kickball Push-Ups Sit-Ups Soccer Softball Swimming Tetherball Track and Field Walking the dog Participating in P.E. class Participating in recess Elementary Activity List
62 Investigate! Time to Move! Student Activity Sheet Part A: Day of the Week Total Minutes of Physical Activity Done Sunday Number of Minutes Needed to Total 1 Hour, if Less than 60 Minutes Monday Tuesday Wednesday Thursday Friday Saturday Part B: List the days of the week from Part A where the number of minutes was equal to or greater than 60. Write the time using hours and minutes. 1. hours min. 2. hours min. 3. hours min. To create your own Weekly Activity Chart online, visit Elementary Activity Sheet
63 Investigate! Time to Move! Weekly Activity Chart Sample Day of the Week Sunday Monday Tuesday Wednesday Thursday Friday Saturday Total Minutes of Physical Activity Done Baseball: 30 minutes Bicycling: 30 minutes Sit ups: 15 minutes Walking the dog: 15 minutes Walking the dog: 15 minutes Recess: 15 minutes PE class: 30 minutes PE class: 30 minutes Walking the dog: 15 minutes PE class: 30 minutes Walking the dog: 15 minutes Bicycling: 15 minutes Baseball: 30 minutes Walking the dog: 15 minutes Recess: 15 minutes Walking the dog: 15 minutes Bicycling: 15 minutes Baseball: 45 minutes Mowing the lawn: 30 minutes Number of Minutes Needed to Total 1 Hour, if Less than 60 Minutes 15 minutes 15 minutes 30 minutes Elementary Activity Chart
64 Investigate! Time to Move! According to the U.S. Dietary Guidelines, physical activity done at a moderate-intensity level is a healthy habit. Regular exercise has many health benefits including weight control, decreased blood pressure, stronger bones and muscles, stress relief and feeling good about oneself. Children should participate in at least 60 minutes of moderateintensity physical activity most days of the week, preferably daily. The recommendation for adults is at least 30 minutes of moderateintensity physical activity 5 or more days per week or vigorousintensity physical activity 3 or more days per week for 20 or more minutes per session. It is important to choose activities that interest you. Start out slowly and gradually build to higher levels in order to prevent injury. LIMIT THE TIME YOU WATCH TELEVISION OR PLAY VIDEO GAMES! Parents play an important role in shaping their children s attitudes toward physical activity. Set an example by being active yourself. Provide opportunities for your children to be active such as team or individual sports, skating, bicycling or just free time play. Create your own weekly activity chart at home. Go to It s time to MOVE! Elementary Key Concepts
65 Investigate! Where Do I Belong? Standards References Math GLEs: Pre-K: 1, 5 K: 1, 2, 8, 9, 10, 11 Grade 1: 1, 10, 15, 18, 33 Grade 2: 5, 8 Grade 3: 40 HEALTH Benchmarks 1-E-2 3-E-1 3-E-2 4-E-4 5-E-6 Materials 1. Venn Diagram- two enlarged to at least 11 by 17 inches and laminated 2. 2 sets of Food Cardscut and laminated Activity Overview Participants will categorize familiar foods and construct a Venn Diagram based on the food group to which the foods belong. Key Concepts All foods can be categorized into 5 basic groups: o Grains, o Vegetables, o Fruits, o Milk, and o Meat and Beans. Some prepared foods may belong to more than one group. Our bodies need foods from all 5 groups in order to stay healthy. Sorting familiar foods by food groups helps us stay within the recommended daily allowance as set forth by the USDA. Procedure Preparation: Print the Key Concepts, Lab Instructions, MyPyramid posters, Answer Key and Food Cards on heavy cardstock and place at the Explore Station. Enlarge and laminate two Venn Diagrams. Copy one Venn Diagram template for each family to take home. Set up all materials needed at the station. 1. Review the MyPyramid poster on the display board. 2. Look at the food cards provided. 3. To which food group do you think each food item would belong? 4. Do you think that some of the foods might belong to more than one food group? 5. Using the Venn Diagram, place each food card in the category where you feel it belongs. Discuss your ideas with your adult partner. 6. Check your answers using the answer key. 7. How many foods belonged in the section for only Grains? How many foods belonged in the section for only Meat and Beans? 8. How many foods belonged in both food groups? 9. Count the total number of foods that belonged to the grain group. Now find the total number of foods that belonged under meat and beans heading. Discuss you answers with your partner. 10. Create your own Venn Diagram at home with the blank template provided. 11. Read and discuss your Key Concepts! 12. Be sure to write what you have learned and stamp your Passport to Good Health! Closure/Evaluation After completing the activity, families read the information found under Key Concepts and discuss what they learned about the 5 food groups. Elementary Activity Plan
66 Investigate! Where Do I Belong? LAB INSTRUCTIONS 1. Review the MyPyramid poster on the display board. 2. Look at the food cards provided. 3. To which food group do you think each food item would belong? 4. Do you think that some of the foods might belong to more than one food group? 5. Using the Venn Diagram, place each food card in the category where you feel it belongs. Discuss your ideas with your adult partner. 6. Check your answers using the answer key. 7. How many foods belonged in the section for only Grains? How many foods belonged in the section for only Meat and Beans? 8. How many foods belonged in both food groups? 9. Count the total number of foods that belonged to the grain group. Now find the total number of foods that belonged under meat and beans heading. Discuss you answers with your partner. 10. Create your own Venn Diagram at home with the blank template provided. Read and discuss your Key Concepts! Can a food belong to more than two groups? Does a pepperoni pizza contain more than two food groups? To which food groups does a hamburger with a patty, bun, lettuce, and tomato belong? Be sure to write what you have learned and stamp your Passport to Good Health! Elementary Lab Instructions
67 Investigate! Where Do I Belong? Venn Diagram Template Elementary Venn Diagram Template

68 Investigate! Where Do I Belong? MyPyramid Elementary MyPryamid


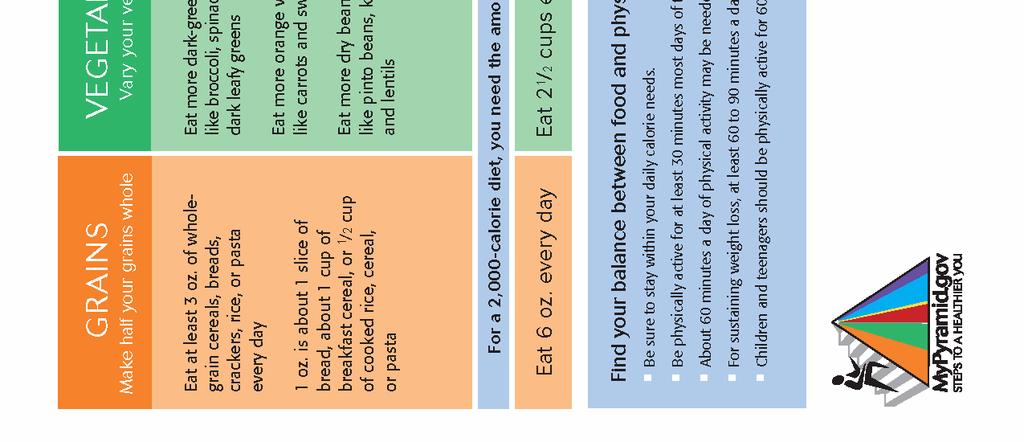
69 Investigate! Where Do I Belong? MyPyramid Elementary MyPyramid
70 MyPyramid.gov GRAINS VEGETABLES FRUITS MILK MEAT & BEANS

71 ÿ ÿ ÿ ÿ ÿ ÿ ÿ ÿ ÿ ÿ ÿ ÿ ÿ ÿ ÿ ÿ ÿ ÿ ÿ ÿ ÿ ÿ ÿ ÿ ÿ ÿ ÿ ÿ ÿ ÿ ÿ ÿ ÿ ÿ ÿ ÿ ÿ ÿ ÿ ÿ ÿ ÿ ÿ ÿ ÿ ÿ ÿ ÿ ÿ ÿ ÿ ÿ ÿ ÿ ÿ ÿ ÿ ÿ ÿ ÿ ÿ ÿ ÿ ÿ ÿ ÿ ÿ ÿ ÿ ÿ ÿ ÿ ÿ ÿ ÿ ÿ ÿ ÿ ÿ ÿ ÿ ÿ ÿ ÿ ÿ ÿ ÿ ÿ ÿ ÿ ÿ ÿ ÿ ÿ ÿ ÿ ÿ ÿ ÿ ÿ ÿ ÿ ÿ ÿ ÿ ÿ ÿ ÿ ÿ ÿ ÿ ÿ ÿ ÿ ÿ ÿ ÿ ÿ ÿ ÿ ÿ ÿ ÿ ÿ ÿ ÿ ÿ ÿ ÿ ÿ ÿ ÿ ÿ ÿ ÿ ÿ ÿ ÿ ÿ ÿ ÿ ÿ ÿ ÿ ÿ ÿ ÿ ÿ ÿ ÿ ÿ ÿ ÿ ÿ ÿ ÿ ÿ ÿ ÿ ÿ ÿ ÿ ÿ ÿ ÿ ÿ ÿ ÿ ÿ ÿ ÿ ÿ ÿ ÿ ÿ ÿ ÿ ÿ ÿ ÿ ÿ ÿ ÿ ÿ ÿ ÿ ÿ ÿ ÿ ÿ ÿ ÿ ÿ ÿ ÿ ÿ ÿ ÿ ÿ ÿ ÿ ÿ ÿ ÿ ÿ ÿ ÿ ÿ ÿ ÿ ÿ ÿ ÿ ÿ ÿ ÿ ÿ ÿ ÿ ÿ ÿ ÿ ÿ ÿ ÿ ÿ ÿ ÿ ÿ ÿ ÿ ÿ ÿ ÿ ÿ ÿ ÿ ÿ ÿ ÿ ÿ ÿ ÿ ÿ ÿ ÿ ÿ ÿ ÿ ÿ ÿ ÿ ÿ ÿ ÿ ÿ ÿ ÿ ÿ ÿ ÿ ÿ ÿ ÿ ÿ ÿ ÿ ÿ ÿ ÿ ÿ ÿ ÿ ÿ ÿ ÿ ÿ ÿ ÿ ÿ ÿ ÿ ÿ ÿ ÿ ÿ ÿ ÿ ÿ ÿ ÿ ÿ ÿ ÿ ÿ ÿ ÿ ÿ ÿ ÿ ÿ ÿ ÿ ÿ ÿ ÿ ÿ ÿ ÿ ÿ ÿ ÿ ÿ ÿ ÿ ÿ ÿ ÿ ÿ ÿ ÿÿÿ ÿ ÿ ÿ ÿ ÿ ÿ ÿ ÿ ÿ ÿ ÿ ÿ ÿ ÿ ÿ ÿ ÿ ÿ ÿ ÿ ÿ ÿ ÿ ÿ ÿ ÿ ÿ ÿ ÿ ÿÿ ÿÿÿ ÿ ÿ ÿ ÿ ÿ ÿ ÿ ÿ ÿ ÿ ÿ ÿ ÿ ÿ ÿ ÿ ÿ ÿ ÿ ÿ ÿ ÿ
LESSON 3 E AT A RAINBOW OF SNACKS
 E AT A R A I N B O W O F S N A C K S LESSON 3 E AT A RAINBOW OF SNACKS Objectives for the lesson: 1. Compare the nutrient content and cost of vegetables and fruits as snacks to conventional snack foods.
Activity #4: Healthy Food Festival!
 Activity #4: Healthy Food Festival! Activity Overview In this activity, students apply their new learning to create fun ways to eat the rainbow during the week. Students are encouraged to consider the
Ohio SNAP-Ed Adult & Teen Programs Color Your Diet with Vegetables & Fruits
 Page 1 Ohio SNAP-Ed Adult & Teen Programs Color Your Diet with Vegetables & Fruits Task Topic: Task Title: Teaching Message(s): Resources: Vegetables & Fruits Color Your Diet with Vegetables & Fruits Eat
BUILD A HEALTHY EATING STYLE
 TASTE THE RAINBOW! BUILD A HEALTHY EATING STYLE Focus on healthy food and beverage choices of all five food groups including fruits, vegetables, grains, and proteins. Building a healthy diet can help you
Becoming A Healthier You!!
 Eating right and staying active will enhance your quality of life Learning For The University of Georgia Cooperative Contact your local office at Becoming A Healthier You!! hoices you make today determine
2.7 Additional Activity: Kindergarten to Grade 8 Paint Your Plate! Challenge
 2.7 Additional Activity: Kindergarten to Grade 8 What is the? A challenge that encourages teachers, students and their families to eat the daily amount of vegetables and fruit as recommended by Canada
LAWS, STANDARDS & REGULATIONS
 Appendixes APPENDIX 1: LAWS, STANDARDS & REGULATIONS The United States enjoys one of the safest food supplies in the world. The laws and regulations required to achieve that safe food supply are lengthy
you feel when you eat, you ll naturally find a macronutrient balance that your body needs to live a SuperLife.
 Color -- or the hue of a food - is a reliable indicator of high-nutrient, high polyphenol, and high antioxidant content. We need to get some of every shade: blue, green, orange, pink, purple, red, yellow,
Suggested layouts: outer board measures 23 tall x 35 wide cork part measures 21 tall x 33 wide. What are phytonutrients. 3 x 10. What do they do?
 Suggested layouts: outer board measures 23 tall x 35 wide cork part measures 21 tall x 33 wide Title page -- phytonutrients What are phytonutrients Where can I find phytonutrients? What s in the color?
DON T LET PORTION SIZES CAUSE YOU TO FUMBLE
 LESSON 12 ELEMENTARY SCHOOL LESSON DON T LET PORTION SIZES CAUSE YOU TO FUMBLE OBJECTIVES: 1. What is happening to our portion sizes? 2. What is a portion? What is a serving size? Using your hand to measure
A FULL SPECTRUM OF NUTRIENTS
 A FULL SPECTRUM OF NUTRIENTS All of us remember being told by our parents Eat your Vegetables. They re good for you. Fruits and vegetables are good for our Budgies too. Each color group has its own nutritional
Client will make 2 specific goals to decrease her potassium intake. Client will make 1 specific goal to decrease her fluid retention.
 Title: Renal Diet Target Audience: Renal Dialysis Patients LESSON PLAN Name: Heidi Washburn Terminal Objective Client will be able to plan an appropriate renal dialysis diet for him/herself. Domain Cognitive
EADERS. National Fresh Fruit and Vegetable Month. PreK 6 th A FREE RESOURCE PACK FROM EDUCATIONCITY. Topical Teaching Resources.
 EADERS A FREE RESOURCE PACK FROM EDUCATIONCITY National Fresh Fruit and Vegetable Month PreK 6 th Topical Teaching Resources Grade Range Free school resources by EducationCity. This may be reproduced for
Project Health Food and Activity Changes
 Project Health Food and Activity Changes Please write down the healthy changes to your food and activity habits you intend to make each session. These should be small and do-able changes that you re committed
EASY WAYS TO EAT MORE FRUITS AND VEGETABLES AS PART OF A HEALTHY DIET.
 This is a text-only 508 accessible version for the visually impaired. For a full-color brochure, see: www.fruitsandveggiesmatter.gov/downloads/aa_womens_brochure.pdf Page 1- Left column (back cover) EASY
The Daniel Fast "Fasting For Health And Healing"
 The Daniel Fast "Fasting For Health And Healing" Starting Monday January 3, 2011 at Midnight Ending Sunday January 23, 2011 at 11:59 pm This information was primarily taken from the book "Fasting For Spiritual
TO KEEP YOUR HEALTH ON TRACK, FRUITS AND VEGGIES YOU SHOULDN'T LACK
 TO KEEP YOUR HEALTH ON TRACK, FRUITS AND VEGGIES YOU SHOULDN'T LACK Our health is nothing but a clear reflection of our food habits. If we consume healthy food & follow a wellbalanced diet, we will definitely
Potassium and Your CKD Diet
 A TO Z HEALTH GUIDE Potassium and Your CKD Diet What is potassium and why is it important to you? Potassium is a mineral found in many of the foods you eat. It plays a role in keeping your heartbeat regular
WELCOME. The Basics. Remember, consistency is key
 WELCOME C ongratulations! You ve taken the first step on your way to a new and improved body, and we are excited to be a part of your journey. We encourage you to read through this WeightLogix Weight Loss
The Eat a Rainbow 2015 Chatham County Fruit and Vegetable Challenge Packet
 Please join us in this year s Eat a Rainbow Week Challenge September 20 th -26 th! The Eat a Rainbow 2015 Chatham County Fruit and Vegetable Challenge Packet Are YOU ready to take on the Challenge? Brought
Eat the Rainbow. Adapted from: LifeLab Feeling Fine with Fresh Food from The Growing Classroom
 Eat the Rainbow Adapted from: LifeLab Feeling Fine with Fresh Food from The Growing Classroom Overview: Students will go on a garden scavenger hunt to locate fruits and vegetables of every color of the
Building Healthy Meals with WIC Foods: Fruits & Veggies
 Building Healthy Meals with WIC Foods: Fruits & Veggies Who: Why: Parents and caregivers of children participants Nevada WIC parents and caregivers want meal and snack ideas using WIC foods. This class
My Diabetic Meal Plan during Pregnancy
 My Diabetic Meal Plan during Pregnancy When you have diabetes and are pregnant, you need to eat small meals and s throughout the day to help control your blood sugar. This also helps you get in enough
The Fresh Fruit and Vegetable Program Nutrition Curriculum
 The Fresh Fruit and Vegetable Program Nutrition Curriculum 1 st Grade This material was funded by USDA's Supplemental Nutrition Assistance Program SNAP. The Supplemental Nutrition Assistance Program (SNAP)
Department of Nutrition, University of California, Davis; University of California Agriculture and Natural Resources
 Labels Food The United States Food and Drug Administration requires most packaged foods and beverages to have a Nutrition Facts label to help consumers make informed choices about the foods they eat. Serving
GREEN YELLOW RED PURPLE WHITE
 GREEN YELLOW RED PURPLE WHITE Broccoli, green cabbage, spinach, romaine lettuce, green peas, kiwi fruit, swiss chard Avoid cancer of the prostate and colon (large intestine) Develop and maintain healthy
Fact Sheet. Color Me Healthy: Enjoying Fruits and Vegetables
 Color Me Healthy: Enjoying Fruits and Vegetables Mary L. Meck Higgins, PhD, RD, LD, CDE Kansas State University Agricultural Experiment Station and Cooperative Extension Service Who would have guessed
Grade 3 Lesson 4. Lesson plan. 19 Discovery Vitality. Lesson theme Fuelling up for your best performance Grade 3. Duration 30 minutes Date/week
 Lesson 4 Lesson plan Lesson theme Fuelling up for your best performance Duration 30 minutes Date/week Context Making healthier food choices Benefits of leading a healthier lifestyle. Linking with previous
Lesson 5 Keeping It Going!
 Welcome Aloha and welcome back to the fifth lesson of the PILI Lifestyle Program. Lesson 5 1 Let us begin with a review of last week s lesson. What did we talk about last time? We learned that healthy
Nutrition Know-How. North Valley Internal Medicine
 Nutrition Know-How North Valley Internal Medicine This health information is being provided for general educational purposes only. Your health care provider is the single best source of information regarding
Name one nutrient found in vegetables.
 Name one nutrient found in vegetables. Vitamins, fiber, water, minerals, carbohydrates In which season do fruits and vegetables grow? Spring, summer, or fall True or False: Grapes are a fruit. True Name
Eating Healthier: Six Simple Steps
 Eating Healthier: Six Simple Steps Most of us are interested in learning how to eat a healthier diet. As a coach, you can support your client by making simple suggestions as well as giving her resources
Lesson 6. MyPlate. Estimated Class Time Part A Q & A: 20 minutes Total Time: 20 minutes. Part B Poster Activity: 20 minutes Total Time: 20 minutes
 Lesson 6 MyPlate Objectives Students will: recognize the importance of energy balance and moderation identify the food groups and other features of MyPlate, as well as foods within each group* create posters
Cheat Sheet: Eating Out
 Cheat Sheet: Eating Out The 7 Golden Rules for Eating Delicious Foods at Restaurants Without Falling Off The Wagon If you're tired of not being able to eat out without breaking your diet... or... you're
March s Healthy Habits Campaign Message is: Understanding the rainbow of fruits and vegetables that help keep us healthy!
 Teacher: School: March s Healthy Habits Campaign Message is: Understanding the rainbow of fruits and vegetables that help keep us healthy! Healthy eating habits are an important component of lifelong health.
Nutrition Essentials Improving your PKU diet through balanced nutrition
 Nutrition Essentials Improving your PKU diet through balanced nutrition Sharon L Ernst, MPH, RD, CSP, FAND Associate Professor Chief Metabolic Dietitian Division of Medical Genetics Department of Pediatrics
Lesson 1: Getting the Most Nutrition From Your Food. Lesson Highlights. Getting Started: Objective
 Lesson 1: Getting the Most Nutrition From Your Food Lesson Highlights Objective Students will: Review the content of MyPyramid for Kids, identifying food groups and important nutrition messages relating
Fruit & Vegetable Health Index
 Fruit & Vegetable Health Index The most dramatic and simplest way to positively affect your health may be to increase your dietary intake of vegetables and fruits. However, simply consuming these foods
Presented by Mary Saucier Choate, M.S., R.D., L.D. Hanover and Lebanon, NH, Co-op Food Stores
 Presented by Mary Saucier Choate, M.S., R.D., L.D. Hanover and Lebanon, NH, Co-op Food Stores Shopping Smart for Your Healthy Heart By the end of this presentation you will know: Heart Smart eating secrets
TRACKS Lesson Plan. Vegetables Go for the Green! Grades 5 8 Girls Club
 Vegetables Go for the Green! Grades 5 8 Girls Club TRACKS Lesson Plan I. Nutrition Education Goal & Objective: Goal 1: Students will comprehend concepts consistent with USDA guidance related to eating
VENN DIAGRAM. November Appendix
 VENN DIAGRAM Thanksgiving Today First Thanksgiving NOVEMBER Soybean Information Sheet Soy products come from the soybean, a legume native to northern China. The United States is now the world s largest
Protein Carbs. / Healthy Fats Veggie Fruit
 Protein Carbs. / Healthy Fats Veggie Fruit 6 oz. steak 12 oz. Yogurt 1 cup of Kale 1 Banana 4 oz. Peanut Butter ½ Ham Sandwich 1 cup Peas 1 Orange 2 Eggs ½ Turkey Sandwich 1 cup Carrots 1 Apple Cliff Bar
7 Day Detox Jump Start Plan
 7 Day Detox Jump Start Plan 7 DAY DETOX NUTRION PROGRAM Unlike most detoxes that starve you, or only have you drink liquid meals for weeks, We have developed a 1200 calorie detox fat flush plan that will
Following Dietary Guidelines
 LESSON 26 Following Dietary Guidelines Before You Read List some things you know and would like to know about recommended diet choices. What You ll Learn the different food groups in MyPyramid the Dietary
HIGH POTASSIUM AND TAKING VELTASSA
 A QUICK GUIDE TO HIGH POTASSIUM AND TAKING VELTASSA Keep potassium levels unde r con trol in the V EL TASSA Z * In a clinical study, up to 95% of people taking VELTASSA reduced their potassium levels and
FINAL EXAM. Review Food Guide Material and Compose/Complete Nutrition Assignment. Orange Green Red Yellow Blue Purple
 NUTRITION ASSIGNMENT-11 th Grade Physical Education FINAL EXAM Review Food Guide Material and Compose/Complete Nutrition Assignment Dietary Guidelines (The Food Guide Pyramid) Orange Green Red Yellow Blue
FUN WITH FIBER DENVER URBAN GARDENS SCHOOL GARDEN AND NUTRITION CURRICULUM 1
 Denver Urban Gardens School Garden and Nutrition Curriculum Fun with Fiber Lesson Goals Students will learn about fiber and why they need it. Objectives Students will discuss and read about fiber, analyze
Student Book. Grains: 5 10 ounces a day (at least half whole grains) Self-Check
 Self-Check") ETR Associates Middle School I read and followed directions. My work is neat and complete. This is my best work. HealthSmart Actions Lesson at a Glance Student Book The HealthSmart Actions student book
ETR Associates Middle School I read and followed directions. My work is neat and complete. This is my best work. HealthSmart Actions Lesson at a Glance Student Book The HealthSmart Actions student book
TRACKS Lesson Plan. Choosing healthy beverages Rethink Your Drink Grade 5 8 Boys Club
 TRACKS Lesson Plan Choosing healthy beverages Rethink Your Drink Grade 5 8 Boys Club I. Nutrition Education Goal & Objective: Goal 1: Students will comprehend concepts consistent with USDA guidance related
TRACKS Lesson Plan. Snacks Snack Attack Grades 5 8 Boys Club
 TRACKS Lesson Plan Snacks Snack Attack Grades 5 8 Boys Club I. Nutrition Education Goal & Objective: Goal 1: Students will comprehend concepts consistent with USDA guidance related to eating and physical
FRESH AIR FASTING GOD S WAY
 FRESH AIR FASTING GOD S WAY WHAT IS FASTING? Fasting is giving up food or another source of personal gratification for a determined period of time in order to focus on God. Fasting allows us to take our
CHAPTER 4 Nutrition 51
 AP TE R CH 4 Nutrition 51 Learning About Nutrition Nutrition Nutrition is how the body uses food to stay healthy. Good nutrition means that the body gets enough of the foods it needs to stay healthy. Poor
New Food Labeling: Restaurants and Grocery. Becky Schilling Editor-in-Chief Food Management / Supermarket
 New Food Labeling: Restaurants and Grocery Becky Schilling Editor-in-Chief Food Management / Supermarket News @bschilling_fm Nutrition Facts Label: Background Passed May 2016; compliance July 2018 Some
Extreme Wellness! 6 WEEKS OF OF TRANSFORMATIONAL WELLNESS
 OF Blood Sugar Balancing Blood sugar regulates many of your body s hormones. When blood sugar Blood sugar gets regulates out of balance, many of insulin your body s levels go hormones. up, which When drives
3 THREE FUEL UP VS. FILL UP. LESSON. Explain how a balanced diet (eating a variety of foods from all food groups) fuels the body.
 fuels the body.") LESSON 3 THREE Explain how a balanced diet (eating a variety of foods from all food groups) fuels the body. Distinguish between nutrient-dense and empty-calorie foods and identify examples of each. www.eatsmart.org
LESSON 3 THREE Explain how a balanced diet (eating a variety of foods from all food groups) fuels the body. Distinguish between nutrient-dense and empty-calorie foods and identify examples of each. www.eatsmart.org
TRACKS Lesson Plan. Caregiver Workshop - Deciphering the Nutrition Facts Label Audience: Caregivers
 TRACKS Lesson Plan Caregiver Workshop - Deciphering the Nutrition Facts Label Audience: Caregivers I. Nutrition Education Objectives: Goal 1: Students will comprehend concepts consistent with USDA guidance
Are You Eating Enough to Lose Weight?
 TM Are You Eating Enough to Lose Weight? The Full Plate Diet Slim Down, Look Great, Be Healthy! Full Plate Diet Weight Loss Program Stuart A. Seale, M.D. Teresa Sherard, M.D. Diana Fleming, Ph.D., LDN
TRACKS Lesson Plan. Snacks Snack Attack Grades 5 8 Girls Club
 TRACKS Lesson Plan Snacks Snack Attack Grades 5 8 Girls Club I. Nutrition Education Goal & Objective: Goal 1: Students will comprehend concepts consistent with USDA guidance related to eating and physical
CHFFF Lesson 1 What are some examples of sweetened drinks? CHFFF Lesson 1 Why are 100% fruit juice and flavored milk the only slow drinks?
 CHFFF Lesson 1 What are some examples of sweetened drinks? CHFFF Lesson 1 Why are 100% fruit juice and flavored milk the only slow drinks? CHFFF Lesson 1 What are some concerns about diet drinks? CHFFF
Lesson 8 Wrapping It Up!
 Lesson 8 Lesson 8 Welcome! What did we talk about last time? Aloha and welcome to lesson 8, the final lesson, of the PILI Lifestyle Program. Before we get started with today s lesson, let us begin with
Part 1: Cronometer Food Diary. Date. Add Food. Part 2: Cronometer Nutrition Report
 This assignment has 3 parts: 1) Food Diary: Cronometer (https://cronometer.com) is a free diet analysis tool. You will record your food & beverage intake for 3-5 days. Entering your exercise is optional.
3/9/2011. I. Main nutritional requirements. WARM-UP (GRAB A SHEET ON YOUR WAY IN) TERMS STUDENT LEARNING OBJECTIVES OBJECTIVE 1
 TERMS STUDENT LEARNING OBJECTIVES OBJECTIVE 1") (GRAB A SHEET ON YOUR WAY IN) What 7 things make up your favorite salad? (if you don t like salad pick 7 things anyway) What food group do each of them fall under? (the food groups are Grains, Vegetables,
(GRAB A SHEET ON YOUR WAY IN) What 7 things make up your favorite salad? (if you don t like salad pick 7 things anyway) What food group do each of them fall under? (the food groups are Grains, Vegetables,
Unit 2: Health and Nutrition
 OBJECTIVES Unit 2: Health and Nutrition Students will create and solve word problems related to health and nutrition. Students will recognize everyday math applications related to nutritional content of
Rethink Your Drink Core Presentation Teens / Adults ( years)
") Rethink Your Drink Core Presentation Teens / Adults (13 65+ years) Session Overview Class participants will examine what beverages they are drinking. They will learn how to make healthier beverage choices
Rethink Your Drink Core Presentation Teens / Adults (13 65+ years) Session Overview Class participants will examine what beverages they are drinking. They will learn how to make healthier beverage choices
Compare your serving size to figure out the number of carbs you are eating. Total carbs per serving (in grams) are listed on the label.
 are listed on the label.") What is a Diabetes Meal Plan? A diabetes meal plan tells you how much and what kinds of food and drinks you can choose and how much to have at meals and snacks. For most people with diabetes, a healthy,
What is a Diabetes Meal Plan? A diabetes meal plan tells you how much and what kinds of food and drinks you can choose and how much to have at meals and snacks. For most people with diabetes, a healthy,
by KERRY ALISON WEKELO
 tivities for Kids c A e l b Eata by KERRY ALISON WEKELO Copyright 2015 by Kerry Alison Wekelo All rights reserved. No part of this book may be reproduced, copied, stored or transmitted in any form or by
Health Reality Check. Do you know what you re eating?
 Health Reality Check Do you know what you re eating? Hitting Close To Home Cardiovascular Disease: 2200 Americans die from Coronary Heart Disease every day 12 Only a small percent of cardiovascular disease
Soccer in Schools Grade 4
 Soccer in Schools Grade 4 Soccer in Schools Curriculum Four-Week Session Table of Contents Session One Soccer: Dribbling and Agility Nutrition: MyPyramid Session Two Soccer: Ball Control and Turning Nutrition:
Fiber In Your Diet. Provided by Hemorrhoid Centers of America Version Fiber
 In Your Diet The lack of dietary fiber and fluids is a contributing factor to the development of hemorrhoids and anal fissures. We recommend consuming 25-35 grams of fiber and drinking 7 glasses of fluids
Session 21 Leader Guide: Heart Health
 Session 21 Leader Guide: Heart Health Objectives In this session, the participants will: Identify the leading cause of death in American adults. Define heart disease. Learn the risk factors for heart disease.
Eating Behaviors. Maintaining a Healthy Weight
 CHAPTER 11 Managing Weight and Eating Behaviors LESSON 1 Maintaining a Healthy Weight Before You Read Write down some steps that you can take to manage your weight in a healthful way. BIG Idea Maintaining
Food is Medicine. Session #: T29. Objectives 4/6/2015. Anne L. Hague, PhD, MS, RDN, LD, RDH, CLT
 Food is Medicine Session #: T29 Anne L. Hague, PhD, MS, RDN, LD, RDH, CLT anne@riteforyouwellness.com Rite For You Nutrition Center 171 Green Meadows Drive South Lewis Center, Ohio 43035 614-985-6569 Objectives
ORAC Values. Antioxidant measurement units
 ORAC Values ORAC (Oxygen Radical Absorption Capacity) is a standardised test that was adopted by the U.S. Department of Agriculture to measure the Total Antioxidant Potency of foods and nutritional supplements.
Making Meals Matter. Tips to feed 6-12 year olds. Healthy eating for your school-age child
 Making Meals Matter Tips to feed 6-12 year olds Healthy eating for your school-age child Your child learns healthy eating from you. Your elementary- school child needs you to guide them and to model healthy
Lesson Two Nutrients and the Body
 Lesson Two Nutrients and the Body Objectives After participating in this lesson, students will Be able to identify key nutrients the body needs and describe their function and importance. Understand that
Food Pyramid The only diet guideline?
 Food and Nutritional Science Society SS HKUSU Newsletter Issue 4 (September, 2012) By Ho Wai Kin Philip Food Pyramid The only diet guideline? The good old Food Pyramid is definitely not a new term to many,
Nutrition Know-How. 7. Choose nonfat dairy such as skim milk, nonfat yogurt, and nonfat cheese.
 Make Healthier Choices Swapping whole-grain or nonfat foods for processed or full-fat foods is often all it takes to give your diet a health boost. Here are a few tips for making healthful food choices:
The Fruit and Vegetable Marathon Challenge
 A Cafeteria to Classroom Challenge The Fruit and Vegetable Marathon Challenge The Challenge Do you have the superpower in you? Make it a schoolwide classwide or individual challenge to see who can eat
Starter Kit for Overcoming Weight Loss Resistance
 Starter Kit for Overcoming Weight Loss Resistance courtesy of 2 Fit Docs YouTube Channel A weight loss resistant body burns sugar rather than fat for energy. By avoiding sugar and starchy foods and increasing
Nutrition And You. An Orange a Day
 Nutrition And You Anatomy of The Healthy Eating Pyramid Healthy Eating Pyramid s 9 Food Groups An Orange a Day Anatomy of the Healthy Eating Pyramid. Activity is represented as the foundation of this pyramid.
Name of your local UC CalFresh educator: Phone number:
 Dear Student, Hello! We are the University of California CalFresh Program (UC CalFresh). Our program teaches young people about healthy eating and physical activity habits. Our goal is to help students
FDA/CFSAN: Guidance on How to Understand a...e the Nutrition Facts Panel on Food Labels
 U.S. Food and Drug Administration Center for Food Safety and Applied Nutrition June 2000 Guidance on How to Understand and Use the Nutrition Facts Panel on Food Labels People look at food labels for different
TRACKS Extension Lesson
 TRACKS Extension Lesson Understanding that Fast Food is High in Fat The Scoop on Fast Food Grades 9-12 I. Nutrition Education Goal & Objective: Goal 1: Students will comprehend concepts consistent with
Low FODMAP Diet. OK, but what are FODMAPs and who should avoid them?
 Low FODMAP Diet FODMAP? What does that stand for? Fermentable Oligosaccharides (oligo few, saccharide sugar ) Disaccharides ( two sugars ) Monosaccharides ( one sugar ) And Polyols (these are sugar alcohols)
UNIT 2: VITAMINS & MINERALS & THE COLOURS OF THE RAINBOW INTRODUCTION TO SPECIFIC VITAMINS AND MINERALS TOPIC 2: CHOOSING BRIGHTLY COLOURED FOODS
 UNIT 2: VITAMINS & MINERALS & THE COLOURS OF THE RAINBOW TOPIC 1: INTRODUCTION TO SPECIFIC VITAMINS AND MINERALS TOPIC 2: CHOOSING BRIGHTLY COLOURED FOODS TOPIC 3: NUTRITIONAL GOAL SETTING GRADES 6-7 UNIT
Fabulous Phytochemicals
 Investigating Your Health: Fabulous Phytochemicals Name: Objective: Investigate vegetables by keeping a log of how many you eat in a week and learn about ways you can add vegetables to your diet. The phytochemical
 www.mydiabeticdiet.eu The Keto diet has exploded in popularity as an effective way of losing weight, balancing blood sugar and reducing insulin resistance for type 2 diabetics In fact, many people have
MyPlate. Lesson. By Carone Fitness. MyPlate
 Lesson By Carone Fitness Nutrition is the study of how the health of your body is influenced by the foods you eat. The foods that you consume provide your body with energy, build and maintain organs and
Junk food Up to 1 portion a day or in moderation. * fruit, vegetables and carbohydrate-rich foods should be the main part of you diet.
 * The top of the pyramid is less important but still should be taken into consideration to get a balance diet right. Healthy fats 1-2 portions a day Junk food Up to 1 portion a day or in moderation * fruit,
Birth to 18 months: Opportunities for Interaction: Standards/ Learning Outcomes: Content Area: Nutrition Poems and Songs:
 Content Area: Nutrition Poems and Songs: Lesson 8: Foods That Grow Book of the Day: Sign About Meal Time by Anthony Lewis The Vegetables We Eat by Gail Gibbons Vocabulary Words of the Day: more, vine,
TRACKS Lesson Plan. MyPlate and Energy Balance MyPlate Power Special Needs Students Any Grade
 TRACKS Lesson Plan MyPlate and Energy Balance MyPlate Power Special Needs Students Any Grade I. Nutrition Education Objective: Goal 1: Students will comprehend concepts consistent with USDA guidance related
SERVING SIZE PART 1. Summary
 ACTIVITY 6 Summary SERVING SIZE PART 1 1. Students begin this lesson with a brief discussion of calories. 2. Next the teacher introduces the term serving size and demonstrates measuring four different
American University Of Beirut Medical Center Dietary Department DIET FOR LACTATION
 American University Of Beirut Medical Center Dietary Department Breast Feeding, your best choice WHY? DIET FOR LACTATION Breast milk Is nutritious: it provides your baby with a nutritionally complete feed
History of the. Food Guide Systems
 History of the Food Guide Systems 1940 A guide to good eating, the basic 7 Focus on nutritional adequacy, specific servings from each food group 1956-1970 Food For Fitness: Daily Food Guide Basic 4 1979
Sections are bigger at the bottom and narrower at the top to show that even within a food group, some foods should be eaten more often than others.
 Percent of a Number SUGGESTED LEARNING STRATEGIES: Summarize/ Paraphrase/Retell, Think Aloud, Guess and Check The U.S. Department of Agriculture found from much research that two big factors exercising
Group Session 3. Physical Fitness instructor or video
 Group Session 3 at a Glance Key Behavioral Strategies Participant Behavioral Strategies Process Objectives & Session Content Handouts Other Materials Suggested Partnerships Topics/Agenda (2 hours) Calorie
1 ONE MY FUEL UP PLATE. LESSON
 MY FUEL UP PLATE LESSON 1 ONE Explain how physical activity impacts nutritional needs. Identify appropriate number of servings for each food group and recommended caloric intake based on a personal needs
General Food Choices- YOU ARE WHAT YOU EAT!
 General Food Choices- YOU ARE WHAT YOU EAT! Currently the best guidelines for food portion and balanced meals follow the my plate diagram. Athletes burn way more calories than people may think and the
My Plate Healthy Eating 1
 My Plate Healthy Eating 1 Learn more about healthy eating! Go to www.choosemyplate.gov Finding out how many calories YOU need for a day is a first step in managing your weight. Exercise is the key to any