A preliminary report of the food demand and intrahousehold dietary survey of the smallholder pig value chain projects in Uganda
|
|
|
- Britney Heath
- 6 years ago
- Views:
Transcription


1 A preliminary report of the food demand and intrahousehold dietary survey of the smallholder pig value chain projects in Uganda Margaret Kabahenda October 2015

2 2015 International Livestock Research Institute (ILRI) This publication is copyrighted by the International Livestock Research Institute (ILRI). It is licensed for use under the Creative Commons Attribution-Noncommercial-Share Alike 3.0 Unported License. To view this license, visit Unless otherwise noted, you are free to copy, duplicate, or reproduce, and distribute, display, or transmit any part of this publication or portions thereof without permission, and to make translations, adaptations, or other derivative works under the following conditions: ATTRIBUTION. The work must be attributed, but not in any way that suggests endorsement by ILRI or the author(s) NON-COMMERCIAL. This work may not be used for commercial purposes. SHARE ALIKE. If this work is altered, transformed, or built upon, the resulting work must be distributed only under the same or similar license to this one. NOTICE: For any reuse or distribution, the license terms of this work must be made clear to others. Any of the above conditions can be waived if permission is obtained from the copyright holder. Nothing in this license impairs or restricts the author s moral rights. Fair dealing and other rights are in no way affected by the above. The parts used must not misrepresent the meaning of the publication. ILRI would appreciate being sent a copy of any materials in which text, photos etc. have been used.
3 Contents ACRONYMS AND ABBREVIATIONS... 1 EXECUTIVE SUMMARY... 2 INTRODUCTION SOCIO-DEMOGRAPHIC CHARACTERISTICS OF SURVEY PARTICIPANTS INCOME GENERATION AND HOUSEHOLD ASSET OWNERSHIP HOUSEHOLD FOOD SECURITY AND COPING STRATEGIES HOUSEHOLD FOOD ACQUISITION AND CONSUMPTION PATTERNS PATTERNS IN ACQUISITION AND CONSUMPTION OF PORK PRODUCTS DIETARY INTAKE AND NUTRITIONAL STATUS OF HOUSEHOLD MEMBERS GENERAL DISCUSSION AND RECOMMENDATIONS REFERENCES
4 Acronyms and abbreviations A4NH Agriculture for Nutrition and Health ASFs Animal source foods BCG Bacille de Calmette et Guérin (vaccine against tuberculosis) BMI Body Mass Index CFSVA Comprehensive Food Security and Vulnerability Analysis CGIAR Consultative Group for International Agriculture Research CI Confidence interval CSI Coping Strategies Index DPT Diphtheria, pertussis and tetanus DPT-hepB Diphtheria, pertussis, tetanus, hepatitis B CRP L &F CGIAR Research Program: Livestock and Fish FAO The United Nations Food and Agriculture Organisation FGD Focus group discussion GPS Global positioning system HAZ Height-for-age Z-score HDDS Household Dietary Diversity Score HFIAS Household Food Insecurity Access Scale ILRI International Livestock Research Institute MUAC Mid-upper arm circumference SAM Severe acute malnutrition STRIDES STRIDES for Family Health, a USAID funded project UBOS Uganda Bureau of Standards UDHS Uganda Demographics and Health Survey VEDCO Volunteer Efforts for Development Concerns WAZ Weight-for-age Z-score WHZ Weight-for-height Z-score WHO World Health Organisation 1
5 Executive summary Background to the More Pork on Uganda project The International Livestock Research Institute (ILRI), in collaboration with research and development partners and with financial support from IrishAid, has been implementing a 4-year research-for-development project entitled MorePORK by and for the poor: Catalysing emerging smallholder pig value chains in Uganda for Food Security and Poverty Reduction, which is henceforth referred to as the MorePORK project. This intervention is designed to improve food and nutritional security for poor households, improve the livelihoods for value chain actors, and better the performance of smallholder pig value chain systems in selected areas in Uganda. Project goals The expected outcomes from this intervention trial are: (i) (ii) (iii) (iv) Increased capacity of smallholder pig producers to generate more income through innovations that improve productivity and enhance access to inputs, services and output markets. Increased resilience of smallholder pig enterprises and fewer risks associated with pig diseases, through innovations that enhance swine health. Improved access to safe and nutritious pork products for a better quality diet through innovations that increase quantity and quality of pork supplied locally. Improved adherence to more diverse and nutritious diets among smallholder pigproducing households which will consequently lead to better nutrition for all household members. 2
6 Survey objectives and methodology The need to link agricultural production to human health is increasingly being recognized as a key factor in food and nutrition interventions. In recognition of the fact that food production and consumption patterns are associated with undernutrition, the prevalence of water-borne and food-borne diseases (including zoonotic diseases), and the increased risk for obesity and related diseases (WHO, 2012); this survey was designed to characterize household food acquisition and utilization patterns in order to ensure that the MorePORK Project interventions address the specific needs of the targeted populations. The key components of this survey included: (i). (ii). (iii). (iv). Assessment of household socio-economic status with a focus on access to and use of productive assets especially in livestock production; Assessment of demand, availability, actual access to and control over food by household members so as to determine the adequacy of food to household members (household food and nutrition security); Assessment of food consumption patterns and the dietary intake of household members (children, men and women) in order to determine intra-household food distribution patterns and to identify the gaps in dietary intake; and Anthropometric assessment of children, men and women to determine which household members were at higher nutrition risk. Geographical Coverage and Targeted Population This survey targeted both pork producers and consumers 1 in four out of the five MorePORK project sites (districts), namely: Masaka, Kamuli, Lira and Hoima districts. Mukono District was excluded from the survey because it is almost similar to Masaka in terms of food availabilities and level of urbanization 2. Within each district, the intervention areas are classified into major value-chain domain types, namely: Rural-to-rural (pork produced and bulk consumed within rural area), Rural-to-urban (pork produced and the bulk sold external to the site in urban areas), and Urban-to-urban (pork produced and sold in urban and peri-urban areas). These criteria were used to stratify the overall sample for the survey in order to ensure sufficient numbers of observations within each district and value-chain domain, and for comparisons of urban versus non-urban (mostly poor) producers and consumers. Survey and Sampling Design This was a cross-sectional survey and was divided into two parts: (i) the Socio-demographic component (which dealt with collection of household level information on socio-economic variables, livestock ownership, and food demand and dietary diversity); and (ii) the Nutrition component (which focused specifically on intra-household dietary intake and nutritional status of men, women and children). Hence, data analysis will therefore be conducted at both household and individual level (thus two levels of sampling units). The Nutrition survey component was designed to cover a sub-sample of 50% of the 606 households that were engaged in the Socio-demographic survey component but was implemented only in 286 households that had children aged 6-59 months and were available for interview. For each household engaged in the Nutrition survey, the female primary caregiver (preferably the mother of the selected child) and one male (in most cases the household head) were also assessed. 1 The consumers included pig keepers, livestock keepers that were non-pig keepers, those that engage in crop cultivation only, and those not involved in any agricultural production (such as households in urban areas. 2 Both Masaka and Mukono districts are also part of the CRP Livestock and Fish research areas. 3
7 Characteristics of survey participants Error! Reference source not found. below shows the income generating activities in which the surveyed households were engaged. Crop farming was a source of income for the majority (76%) of the households and the other common sources of income were self-employed (35%), piggery enterprises (23%), poultry (18%), cattle enterprises (15%) and remittances (13%). Crop farming was the common income generating activity in all four survey areas but Kamuli (95%) had the highest proportion of households that benefited from crop farming. Based on self rankings by household heads or other significant adults About a half (49%) indicated that crop farming was their first income generating activity and this was followed by self-employed off-farm (21%), piggery and casual labour (ranked by 6% of households each), and remittances (6%)., it seems like a larger proportion of households from Kamuli (66%) depend on crop farming while households in Masaka have more diversified livelihood activities. Figure 1 shows that households that earned higher incomes were those which were renting out property (mostly rooms), engaged in cattle enterprises, those with salaried household members, engaged in bodaboda business, and those that have some members self-employed in non-farm activities. - 1,000,000 2,000,000 3,000,000 4,000,000 5,000,000 Property rent [18] Cattle enterprisev[53] Salaried employment [33] Bodaboda [12] Self-employment-off farm [149] Casual labor [47] Crop farming [340] Poultry enterprise [76] Remittances [42] Capture fishing [1] Aquaculture [1] Charcoal burning [8] Other sources [4] 3,039,100 2,414,200 1,903,300 1,640, , , , , , , ,750 1,530,000 3,997,200 Figure 1: Mean income generated from activity Intra-household ownership of non-land assets In general, a large proportion of the households surveyed had limited resources but based on the modified CASHPOR House Index (1), only 13.5% of the households surveyed were classified as poor. Table 17 provides an overview of the key household asset ownership indicators. The mean total household asset index was 18.7±91.8; some households had none of the proxy assets while the highest asset score was (Skewness = 21.3; Kutorsis = 503.1). This survey documents gross gender disparities in ownership of transport assets and moderate disparities in ownership of domestic and livestock assets. 4
8 Table 1: Household ownership of non-land assets Survey area Domestic Transport Livestock Total HHAI Gender asset disparity Total HHAI Gender asset disparity Total HHAI District Hoima 1.9 ± ± ± Kamuli 1.8 ± ± ± Lira 1.8 ± ± ± Masaka 2.3 ± ± ± VC domain Rural-rural 1.8 ± ± ± Rural-urban 1.9 ± ± ± Urbanurban 2.5 ± ± ± Total 2.0 ± ± ± Gender asset disparity HHAI means Household Asset Index; this is the sum of asset indices for assets owned by men, by women, and owned jointly. The results of this survey suggest that livestock contributes about 58.1% (95% CI = ) to the total household non-land assets and 57.8% (95% CI = ) to the non-land assets owned by women; however, livestock owned by women contributed only 19.2% to the total household asset base. As observed in ownership of domestic assets, men owned more livestock than women. The mean ratio of female to male owned livestock was 0.52:1 (95% CI = ). Gender disparity in livestock ownership was highest in Lira (0.21:1), moderate in Masaka (0.43:1), and lowest in Kamuli (0.78:1) and Hoima (0.77:1). Figure 2 below shows details of types of livestock owned. Based on the low level of livestock ownership, it can be concluded that interventions to improve livestock ownership by both men and women are likely to improve the total household asset base. Ownership of Livestock Limited livestock production has been cited as one of the factors influencing the limited access to and dietary intake of animal source foods. The UN Food and Agriculture Organisation data indicate that livestock production has been steadily increasing in Uganda over the last decade (2) 3. In this study, 468 out of the 606 households (77%) surveyed reported that they own livestock. The proportions of households that owned livestock were 80% from Hoima, 78% from Kamuli, 73% from Lira, and 78% from Masaka district survey areas. 3 World Bank (2015) Livestock production index. URL Accessed June
9 Poultry Pigs Goat Cattle Sheep Rabbits Hoima (n=120) Kamuli (n=120) Lira (n=112) Masaka (n=116) Total (n=468) Figure 2: Proportions of households owning different types of livestock As shown in Figure 1 above, poultry was the most commonly owned livestock and was owned by 74% of the households surveyed and this was followed by pigs (52%), goats (45%) and cattle (39%). Sheep and rabbits were owned by very few households. The highest proportion of households that kept poultry (78%), goats (48%), and cattle (43%) were in rural areas; however, a significantly higher proportion of urban households (66%) kept pigs. The over-arching goal of the MorePORK project, and indeed the CRP3.7 project component in Uganda, is to improve food and nutrition security through improved incomes among pig farmers and through direct use of pig products. Intra-household ownership of pigs Overall the number of pigs owned was lower than expected. The largest proportion of pigs reported were in Masaka (37%; mean owned = 1.9±1.6); followed by Hoima (30%; mean owned = 1.8±1.6) and Kamuli (20%; mean owned = 1.8±1.5); while Lira had the least (14%; mean owned = 1.7±1.0). Figure 27 below shows the intra-household ownership of pigs by breed. Unlike other livestock, ownership of pigs was neither dominated by males nor by females. The practice of keeping pigs for non-household members was commonly reported in Kamuli and Lira; there were hardly any pigs which were kept for non-household members in Masaka. 6
10 %Households Hoima [n=120] Kamuli [n =78] Lira [n=57] Masaka [n = 139] Local [168] Improved [53] Local [73] Improved [74] Local [79] Improved [23] Local [144] Improved [127] Kept for others Jointly Females Males Breed and number of pigs owned Figure 3: Intra-household ownership of pigs by breed Based on the total pig population, sows constituted about a quarter of the pig population (26%). Given the high litter size for pigs, the proportion of piglets (21%) and growers or finishers (14%) were lower than expected. This could be attributed to low fertility among sows or high mortality among piglets and finishers. Contribution of piggery to household incomes Pigs enterprises (mainly piggery farming) were reported as the major source of income during the 12 months preceding the survey by 23% (137) of households surveyed; and among these 137 households 26% ranked piggery as their number one source of income, 42% ranked it second, while 23% ranked it third. The household ranking of pig enterprises is likely to be related to the other activities a household is engaged in and the total returns on investments in piggery. In general, pig prices varied by pig type and survey area (see Table 16 below). Based on the prices of weaners and piglets, it seems like households in Lira and Masaka benefited from higher prices for their animals. 7
11 Table 2: Mean farm-gate prices for pigs by type and survey area during 12 months preceding the survey Type of pig sold Mean prices of pigs (UGX) Boars Sows Hoima Kamuli Lira Masaka Total 118,750± 43, , ,400 [69,800] 172,300 [58,700] Gilts 111,600.. Weaners/Piglets 24,300 Growers/finishers 50,000 Average price 121,925 [33,800] 207,400 [35,300] 244,200 [27,000] 142,200 [64,500] 159,100 [36,300] 145,000 [28,300] 22,500 [10,600] 53,300 40, ,350 [18,900] 110, ,900 [83,900] 199,600 [31,100] 154,200 [47,800] 140,200 [16,300] 157,100 [55,900] 192,900 [55,100] 133,900 [27,800] 32,500 [14,700] 118,600 [48,200] 151,900 [49,700] Values are means and numbers in brackets are standard deviations. Missing SD indicate only one household sold pigs of specified type. Based on focus group discussions, it was noted that farmers often sell pigs to earn quick income to meet pressing financial needs such as payment of school fees. Contribution of piggery to animal source food access Of the 606 participants included in the survey, 63% (380) indicated that pork was utilized in their households. Pork consumption was reported among 79% (119) households in Hoima, 46% (70) from Kamuli, 54% (82) from Lira, and 73% (109) of respondents from Masaka. In general, fresh pork muscle products were more commonly consumed than organ meats and processed pork products. The meats reported by the majority of respondents were fried or stewed pork (96%), roasted or smoked pork (52%), stewed pig legs (28%) and fried or roasted liver (23%). Sausages were the most commonly consumed processed pork product but were reported by only 31 (8%) of the 380 households that use pork. More details on consumption of pork products are given in Table 23 below. 8
12 Pork products consumed Muscle meats: Table 3: Proportion of households consuming different pork products Survey district Hoima (n=119) Kamuli (n=70) Lira (n=82) Masaka (n=109) Fried or stewed pork Roasted pork (muchomo) Cartilagous products: Feet (Mulokonyi) Ears Snout/mouth 26, Organ meats: Liver Heart Tongue Kidneys Spleen Tripe (intestines) Processed products: Sausages Chipolatas (weaner sausages) Bacon Ham Salami Other products Blood Total (n=380) As shown above, processed pork products (chipolatas, bacon, ham, and salami), blood, and tripe (chitlings) were the least consumed pork products. Pig blood was reported by 16 households while pig tripe was reported by only 1 household. There were many reasons given by participants for their inability to consume the different pork products. As shown in Figure 4 below, the main reason for not consuming fried, stewed and roasted pork was general dislike. Roasted pork (muchomo) was disliked by a third of the pork consuming households while 41% could not afford to include muchomo in their diets. Undesirable smell and taste were not reported by many households; however, this calls for value addition to improve acceptability of fresh pork products. 9
13 Processed Fresh Do not like Do not know product Not available Income Cultural/ traditional beliefs Safety Taste/smell Others 0% 20% 40% 60% 80% 100% Fried/stewed pork [15] Roasted pork [192] Sausages [348] Bacon [375] Chipolatas [374] Ham [377] Salami [378] Figure 4: Reasons for not consuming fresh muscle meats and processed pork products Conversely, the processed pork products were not consumed because these products were not known to the majority of potential consumers. For example, about two thirds (63%) of the households did not consume sausages because they did not know them; 13 % were not able to access sausages because they are not available in their areas, 10% were limited by income, and only 12% disliked sausages. This indicates that there is a potential large market for processed products but there is need to improve awareness of the different pork products. Unlike muscle meats and processed products, it seems the cartilaginous products (feet, ears, and snout) and the organ meats (heart, liver, spleen and tripe) were generally considered inferior and thus were less consumed (see Figure 5 below). Do not like Do not know product Not available Income Cultural/ traditional beliefs Safety Taste/smell Others 0% 20% 40% 60% 80% 100% Snout [342] Ears [310] Feet [310] Tounge [320] Spleen[336] Kidneys [321] Heart [318] Liver [292] Tripe [378] Blood [372] Figure 5: Reasons for not consuming %Households cartilagous that gave and organ meats 10
14 Despite the reasons for not consuming different pork products, there is high potential for promoting the less preferred pork products into more appealing and nutritious processed products. Given the limited use of electricity and limited ownership of refrigerators at household level, it may also be important to investigate the use of more shelf-stable pork products that can be kept at room temperature. This will not only improve the access to safe pork products, but will also ensure more stability of the supply of pork products and consequently widen the market of both pigs and the processed products. Household food insecurity and coping strategies In this survey, household food security was assessed using the Household Food Insecurity Access Scale (HFIAS) and the Coping Strategy Index (CSI). A half (52%) of the 606 households surveyed had worried that their households would not have enough to eat; about two thirds (65%) reported that some household members were not accessing food of sufficient quality; 44% reported consuming reduced portions of food; 36% had fewer meals than usual; 14% had gone to sleep without eating; while 3% had experienced at least one episode whereby they had gone through the day and night with nothing to eat in the 30 days preceding the survey. Based on the Household Food Insecurity Access Scale, 75% of the households were food insecurity. The number of households reporting insufficient food intake was significantly higher in Lira where 62.8% reported episodes of reduced food portions; 61% reported reduced number of meals; 32% had no food of any kind in the household; while 23%reported experiencing episodes of going to sleep hungry. Most households mainly coped with limited food access by consuming less preferred foods (88%), buying food on credit (54%), reducing the portions of food served at every meal (48%), using seed reserved for next season (44%), borrowing food from friends and relatives (41%), and reducing the number of meals that are prepared in a day (40%). Extreme practices such as sending out household members to beg and going through a whole day and night without food were not resorted to by a significant proportion of households surveyed, which indicates that the level of food insecurity is not very high. Figure 6 below summarizes the overall ordering on importance of the coping strategies. All the time Pretty often Once in a while Hardly at all Never Consume less preferred Buy food on credit Reduce portions Use seed stock Borrow food Reduce meals Gather/hunt/use immature Ration money Restrict adult intake HH members beg Eat elsewhere Skip days Feed working members Figure 6: Summary of food insecurity coping strategies by order of importance 11
15 Respondents reported that when food is not enough young children (<5 years) are often served first (40%), 27% reported that they apportion food equally among household members, while 17% serve the male household head first. A significantly larger proportion of households in rural areas (26%) were more likely to serve the male head of household first while larger proportions in semi-urban and urban areas (41% and 49% respectively) were more likely to serve younger children first. Household food selection practices Meal planning is a key determinant of a household s food security, diet adequacy and the nutrition status of the household members. This report provides detailed information on consumption of foods from all food groups. Below is a summary of intake of staple foods, relishes, and fruits and vegetables. Staple foods The main staple foods which were frequently consumed by households in the 7 days preceding the survey were sweetpotatoes (81%), maize (69%), cassava (59%), matooke (52%), rice (39%), and millet (14%). The majority of households produced their own staple foods; however, staple food acquisition patterns were significantly linked to place of residence. The proportion of households that produced their own staple foods was highest in rural areas (94%), slightly reduced in three quarters (78%) in semi-urban areas; and was lowest (49%) in urban areas. For all value-chain domains, only 1% of the households surveyed relied on food gifts and handouts from relatives and friends. Protein source foods Unlike staple foods, most households purchased the relishes or sauces used to complement the staples. Although it was a growing season for beans, the majority of households (50%) reported using beans more frequently and this was followed by beef (33%), Mukene (29%), fresh beans (28%) and groundnuts (26%). In general, the reported frequency of use for plant-source proteins (beans, peas, and nuts) about 3-4 times in a week while the overall mean consumption of animal-source protein (meats, fish, poultry, and eggs) was about once in a month. It is important to note that there seem to be major disparities in consumption of animal source foods (ASFs) whereby a few households are consuming ASF but on a more frequent basis. A total 33% of the households surveyed reported consumption of meats during the 7-day period preceding the survey and the mean frequency of consumption among these households were 2 days in the week for beef and pork and once in a week for chicken and goat meat. Milk was the most commonly consumed ASF and was reported by 52% of households with a consumption frequency of 4 times in a week. Overall, with the exception of milk, the results of this survey show that there are no statistically significant differences in the frequency of use of animal source foods across gender groups and survey areas. Fruits and vegetables In Uganda, fruits are often consumed as snacks while vegetables are often used as a side dish or relish. This survey documented limited intake of fruits and vegetables. About 80% of the households surveyed reported consuming at least one vegetable within the 7 days preceding the survey. Onions (73%) and tomatoes (60%) were the most commonly used vegetables but were mainly used in small amounts as spices in seasoning soups, sauces, and stews. Hence, amaranth was the most commonly used vegetable but was used by only 35% of the households surveyed; 28% had used fresh beans (mean frequency = 4 days); and only 18% 12
16 Hoima Kamuli Lira Masaka Total Hoima Kamuli Lira Masaka Total Hoima Kamuli Lira Masaka Total Hoima Kamuli Lira Masaka Total had consumed cabbages. The other vegetables which were reported included pumpkin leaves, cowpea leaves, eggplants, and mushrooms. Fruit consumption was also very low. Only about a third of the households reported consumption of fruit within the last 7 days preceding the survey. About one fifth (19%) of the households had consumed oranges or tangerines for an average of 5 days in the week preceding the survey; 9% had dessert bananas (mean frequency = 3.4 days); and only 8% had used passion fruit (mean frequency of use = 3 days). Other fruits consumed included pineapples, apples, guavas, lemons, pawpaws (papaya), and avocado, and jack fruit (which is commonly called Fene in Uganda). Gaps in dietary intake In line with the CRP 3.7 target of enabling poor women, children and other vulnerable groups to increase their consumption of animal source foods; this survey provides desegregated data on food consumption among children, women, and men. The results of this survey indicate that the dietary patterns of the majority of households are poor. Like other developing contexts, the diets were high in carbohydrate-rich staple roots and starchy vegetables (sweetpotatoes, cassava, and matooke), low in whole grains (main grains were maize meal and rice), low in good quality protein sources, and low in fruits and vegetables. These patterns explain the reported high intake of carbohydrate and limited intake of protein and fat observed among men, women, and children. Low Adequate High 100% 80% 60% % 20% 0% Carbohydrate Fiber Protein Fat Figure 7: Proportion of children within a given level of total carbohydrate, fibre, protein, and fat intake As shown in Figure above, two thirds (66%) of the children assessed consumed higher than the recommended amounts of carbohydrate (> 75% of total calories); 70% had excessive fibre intake (mean= 179% ± 125% of the recommended amount of 5 g plus age in years) while more than a half (58%) consumed less protein (<15% calories from protein), and two thirds (68%) had undesirably low fat intake (<15% of total calorie intake). Similar patterns were also observed among men and women. Hence, there is need to improve dietary intake among all household members. The poor dietary patterns observed are likely to explain the high levels of undernutrition among children and men. 13
17 Nutritional and health status of household members Based on BMI categorization, the prevalence of both undernutrition (low weight for height) and overweight and obesity varied among men, women and children. Higher proportions of women were overweight or obese whereas higher proportions of children and men were underweight. Table 24 below provides details on prevalence of undernutrition and overnutrition among men, women, and children. Overall, the prevalence of undernutrition was 22.2% among children, 15.4% among men, and 1.5% among women. A higher proportion of children were severely undernourished (10.7% versus 0.4% women and 1.1% men) while a higher proportion of men were moderately undernourished (8.9% compared with 4.1% women and 6.3% children). A significantly higher proportion of women were overweight (25.4% versus 8.9% men and 9.3% children) and more women were obese than men (6.6% versus 1.7% for men). More details are provided in the report. Conclusions and recommendations Given the observed food consumption patterns, there is need to sensitize the public about the importance of including foods from all food groups into their diets. A special focus needs to be placed on increasing the frequency of consumption of animal source foods among all household members. The need for animal source foods is amplified by the limited intakes of dietary protein and fat which was documented in all the surveyed areas. In general, limited intake of both protein and fat suggests that the diets are likely to be limited in multiple micronutrients (discussed separately). The high incidence of underweight among both adults and children in areas with reported high incidences of food insecurity (coupled with the high carbohydrate diets that were documented in this survey) suggests a need to improve access to nutrient dense foods. Animal source foods will go a long way to improve both inadequacies in protein, fat, and caloric intake and simultaneously reduce the risk for multiple micronutrient deficiencies. In order to sustainable improve the nutrition of all household members through the promotion of pork products and other animal source foods, it is recommended that stakeholders should: (i). (ii). (iii). (iv). (v). (vi). Improve livestock production to improve access to ASFs and reduce gender disparities in household asset ownership Improve access to pork products and other animal source foods Monitor of the quality of pork products and other animal source foods being accessed by consumers Engage in appropriate nutrition communications to boost intake of pork products and other ASFs Engage in nutrition communications to improve the population s understanding of diet adequacy and nutrient requirements, and Engage in more research to improve understanding of food use and dietary patterns in Uganda. 14
18 Survey area District: Table 4: Nutritional status of household members based on body mass index (BMI) Proportion of household members with BMI within specified category % Severely undernourished (BMI <16 ) Men Wome Children* [2] n [1] [29] %Moderately undernourished (BMI = ) Men Women Children [16] [10] * [17] %Healthy (BMI= ) Overweight (BMI= ) Obese (BM1 30) Men [142] Hoima NA Kamuli NA Lira NA Masaka NA VC domain: Rural NA Peri-urban NA Urban NA Total NA Pregnant women were excluded from anthropometric assessments. Women [152] Children * [199] Men [16] Women [61] *Children are categorized by BMI-for-age z score: <-3 =severe;-3 2 SD = moderate; -2-3 = health; 3-5 = at risk for overweight. Children * [25] Me n [3] Women [16] Children xv
19 Introduction A balanced diet is considered to be one that is constituted of foods from all food groups so as to ensure that the population has adequate amounts of key nutrients (carbohydrates, proteins, vitamins, minerals, water, and fats) to attain and maintain acceptable levels of growth and development. In many developing countries, diets are characterized by high intake of carbohydrate-rich foods with little amounts or poor quality sources of protein, fat and micronutrients (vitamins and minerals) and thus these populations are often at risk for protein and energy deficiencies and multiple micronutrient deficiencies. Animal-source foods are needed in the diets to provide essential nutrients such as protein, essential fatty acids, minerals, and vitamins so as to reduce the risk for undernutrition; however the consumption of ASF has remained lower than recommended in developing countries despite earlier projections based on the global nutrition transition (3). The access to and consumption of animal source foods is expected to be limited in low income countries like Uganda but as the population experiences increases in incomes and urbanization, the consumption of animal-source foods also often increases(4-6). Based on analyses of food consumption trends by the UN Food and Agriculture Organisation (FAO), the production and consumption of ASFs is expected to increase between 2000 and 2030 by hundred folds; and these increases are expected to result from increased consumption (amounts and frequency) and by increases in the population (5). However, it is not clear if increases in both per capita production and consumption of ASF will result in adequacy of ASFs in less resource households in developing countries. The most current Comprehensive Food Security and Vulnerability Analysis in Uganda(7) documents low frequency of consumption of ASFs whereby meats and fish were consumed for an average of 2 days in a week while milk was consumed for an average of 4 days in a week(7). This is a major improvement from the 2009 CFSVA where consumption of meat and fish was for an average to 1.3 days while milk was consumed only 2.1 days in a week among households with the acceptable food consumption scores (8). The consumption of ASFs is still low given the recommended daily consumption of two servings of foods from the meat, fish, poultry and eggs group and two daily servings of dairy products(9). To contribute to mitigating the imbalances in ASF access, interventions such as the Smallholder Pig Value Chain Development project in Uganda are designed to improve production and consumption of pork products among limited resource households. The links between ASF production and nutrition security at household level are not as direct as observed at population level. In general, livestock production is expected to contribute to improved household food security via improved access to ASFs and improved disposable incomes. A recent investigation of the links between livestock production and consumption of ASFs in rural Uganda indicates that chicken and cattle production are likely to improve chicken and dairy product consumption while production of cattle, sheep, and goats does not often result in direct consumption of meats(10). Surprisingly, ownership of large animals (which are mostly comprised of cattle) was positively associated with an increased risk for underweight and this was related to the complexity of linkages between livestock production and consumption (10). Hence, as recommended by World Health Organisation, it is important to monitor the links between agricultural production, dietary patterns and the population s health status(11), in order to gauge the contributions of ASF production to household food and nutrition security. 16
20 Background to the More Pork project The International Livestock Research Institute (ILRI), in collaboration with research and development partners and with financial support from the IrishAid Project, has been implementing a 3-year research-for-development intervention trial entitled More pork by and for the poor: Catalysing emerging smallholder pig value chains in Uganda for Food Security and Poverty Reduction, which is henceforth referred to as the MorePORK project. This intervention is designed to improve food and nutritional security for poor households, improve the livelihoods for value chain actors, and better the performance of smallholder pig value chain systems in selected areas in Uganda. Project goals The expected outcomes from this intervention trial are: (v) (vi) (vii) (viii) Project activities Increased capacity of smallholder pig producers to generate more income through innovations that improve productivity and enhance access to inputs, services and output markets. Increased resilience of smallholder pig enterprises and fewer risks associated with pig diseases, through innovations that enhance swine health. Improved access to safe and nutritious pork products for a better quality diet through innovations that increase quantity and quality of pork supplied locally. Improved adherence to more diverse and nutritious diets among smallholder pigproducing households which will consequently lead to better nutrition for all household members. As noted above, the overarching goal of the MorePORK project is to improve the resilience and capacity of smallholder pig value chain actors to increase production of good quality and affordable pork products so as to improve accessibility and consumption of pork among poor consumers. Hence, the aforementioned project s aims are to be achieved through successful implementation of the following activities in collaboration with research and development partners: 1. Developing, testing and evaluating best-bet options on improved pig husbandry and manure management practices, swine health, management of pig breeding, and improved pig diets. These activities were designed to strengthen the pig value chain through improved productivity and environmentally sustainable practices at the farm level. 2. Developing, testing and evaluating best-bet options on sustainable organisational marketing mechanisms and waste management practices in order to strengthen the pig value chain through improved pork safety and better access to inputs, services and output markets. 3. Developing, testing and evaluating best-bet options to increase utilisation of edible pig parts and increase consumer awareness about benefits of consumption of animal source foods. 4. Informing policy to recognize and appropriately promote the role of pro-poor pig value chains in Uganda. At the time of this survey, many of these activities had already been implemented in Kamuli and Masaka districts and the intervention was being rolled out to study sites in Hoima and Lira districts. 17
21 Project areas The selection of CRP L&F sites (districts and then sub-counties within these districts) was carried out using a defined and documented process. Districts were selected based on hard (GIS) and soft (partner defined) criteria used for identification of smallholder producers and consumers of the targeted commodities. The selection of sub-counties for CRP L&F (and hence for More PORK) was random within the targeted district, ensuring at least one representative sub-county per value-chain domain; however, all sub-counties selected in Kamuli district were in the rural-to-rural value chain domain because the district is predominantly rural (see Table 1). Objectives of the survey The need to link agricultural production to human health is increasingly being recognized as a key factor in food and nutrition interventions. In recognition of the fact that food production and consumption patterns are associated with undernutrition, the prevalence of water-borne and foodborne diseases (including zoonotic diseases), and the increased risk for obesity and related diseases (11); this survey was designed to characterize household food acquisition and utilization patterns in order to ensure that the smallholder pig project (MorePORK Project) interventions address the specific needs of the targeted populations. Main Objectives This food demand and intra-household dietary survey relates to Objective 3, Output 3.2 of the project; which is; to conduct gendered assessment of the role of pork and other animal source foods in human diets and determination of the associated preferences and consumer knowledge of the benefits of dietary diversity and of animal source foods promoted in Uganda (Activity & 3.2.2). As a part of the evaluation activities, this survey was designed to determine the effectiveness of the MorePORK project in achieving the nutrition and food security targets in Kamuli and Masaka district intervention sites and to obtain baseline data onto which to benchmark the project outcomes in new sites in Hoima and Lira districts. Survey Components Since the overall objective of this survey was to assess households food demand and nutritional security with a special focus on intra-household resource and food allocation, the main components of the survey included: (v). (vi). (vii). (viii). Assessment of household socio-economic status with a focus on access to and use of productive assets especially in livestock production. Assessment of demand, availability, actual access to and control over food by household members so as to determine the adequacy of food to household members (household food and nutrition security). Assessment of food consumption patterns and the dietary intake of household members (children, men and women) in order to determine intra-household food distribution patterns. Anthropometric assessment of children, men and women to determine which household members were at higher nutrition risk. The survey tool was adapted from toolkits developed by research teams on the CGIAR Research Program (CRP) Agriculture for Nutrition and Health (A4NH), CRP Livestock & Fish (L&F) and the ILRI / University of Edinburgh / Royal Veterinary College research collaboration. 18
22 Geographical Coverage and Targeted Population This survey targeted both pork producers and consumers. The consumers included pig keepers, livestock keepers that were non-pig keepers, those that engage in crop cultivation only, and those not involved in any agricultural production (such as households in urban areas). The survey covered four out of five of the MorePORK project sites (districts), namely: Masaka, Kamuli, Lira and Hoima districts. Mukono district was excluded from the survey because it is almost similar to Masaka in terms of food availabilities and level of urbanization 4. Within each district, the intervention areas are classified into major value-chain domain types, namely: Rural-to-rural (pork produced and bulk consumed within rural area), Rural-to-urban (pork produced and the bulk sold external to the site in urban areas), and Urban-to-urban (pork produced and sold in urban and peri-urban areas). Table 5: Food demand and intra-household dietary survey sites in Uganda Site Value-chain domains present in Site Masaka District Areas of all three domains: R2R, R2U, U2U Kamuli District Predominantly Rural-to-Rural (R2R) Lira District Areas of all three domains: R2R, R2U, U2U Hoima District Areas of all three domains: R2R, R2U, U2U R2R refers to Rural-to-rural; R2U refers to Rural-to-urban; U2U refers to Urban-to-urban These criteria were used to stratify the overall sample for the survey in order to ensure sufficient numbers of observations within each district and value-chain domain, and for comparisons of urban versus non-urban (mostly poor) producers and consumers. Survey and Sampling Design The survey was divided into two parts: (i) the Socio-demographic component (Sections A F of questionnaire) which dealt with collection of household level information on socio-economic variables, livestock ownership, and food demand and dietary diversity); and (ii) the Nutrition component (Sections G N of questionnaire) which focused specifically on intra-household dietary intake and nutritional status of men, women and children. Hence, data analysis will therefore be conducted at both household and individual level (thus two levels of sampling units). Data for the Socio-demographic survey component were collected from all households selected for the survey (see Table 2 for summary) while data for the Nutrition survey component were collected from approximately 50% of the households covered by the Socio-demographic survey - and that had at least one child between 6-59 months of age. Households included in the survey were randomly selected from household lists which constituted censuses of the targeted sub-counties. When the selected household refused or was unavailable for assessment, an alternate household was selected randomly from the list. The household dietary diversity score (HDDS) was the key response variable used to estimate the required sample size for the Socio-demographic survey component, which is also the main component of the survey. Based on HDDS, a sample of 24 households were required from each village to complete the Socio-demographic survey component but 25 households were surveyed. Hence, a total of 150 households (25 households from 6 villages) were targeted from each district. 4 Both Masaka and Mukono districts are also part of the CRP Livestock and Fish research areas. 19
23 Selection of participants for the nutrition survey The Nutrition survey component was designed to cover a sub-sample of 50% (300 households) of the 600 households that were expected for the socio-demographic survey. Only households with children 6-59 months were selected and for each selected household, the female primary caregiver (preferably the mother of the selected child) and one male (in most cases the household head) were also included in the nutrition survey. Assessment of children (6-59 months) The child s primary caregiver, who was in most cases its mother was interviewed about her child s health status and dietary intake. For cases where the mother was unavailable and was not the person that had fed the child in the preceding 24 hours, another adult in the same household who had fed the child the previous day was interviewed. Where more than one female was responsible for feeding the child, the dominant female (mostly the spouse to household head) was interviewed. The interactive 24-hour recall methodology (12) was employed to guide the caregiver in recalling the eating occasions and types of foods and beverages served to the child of 6-59 months during the 24-hours preceding the survey. Models of actual foods, standardized replicas, and measuring utensils were used to estimate amounts of food served to the child and amounts left on the plate. The children s nutritional status was also estimated from assessment of weight-for-height, weightfor-age, mid-upper arm circumference-for-age, and head circumference-for-age. Assessment of women (14-49 years) The primary targets for this assessment were the mothers of the children assessed. Women s dietary intakes were assessed as explained above and their health information was also taken. Women s heights and weights were also measured to estimate nutritional status using the body mass index (BMI) and MUAC was measured to estimate current nutritional status. Assessment of men (16-49 years) This component targeted the male household head or the key male adult responsible for providing food to the household. This was to allow assessment of male meal patterns within and outside the household. For all men included in the survey, heights and weights were taken to estimate nutritional status using the body mass index (BMI) and MUAC to estimate current nutritional status. Where the male head of household was unavailable for measurement or was older than 49 years, any male adult (within years) was assessed. In choosing the alternate male adult, males that contribute to household resources were prioritized. Focus group discussions At least one focus group discussion was conducted in each value chain domain and two focus groups were conducted in Kamuli. A total of 11 focus groups were conducted. The focus groups mainly comprised men and women from the villages included in the survey. FGD participants were selected by the village health teams in collaboration with the local council leaders. Since FGD participants were selected randomly, they included both non-survey participants and participants. The focus groups were designed to generate data that could not be collected in the survey. Such data included a calendar of food production activities and activities related to food access. FGD were for instance used to corroborate data on food availability. The results of the survey are discussed in the sections that follow. 20
24 Socio-demographic characteristics of survey participants A total of 606 households were engaged in the socio-demographic survey component; notably 150 households from Hoima, 153 from Kamuli, 153 from Lira, and 150 from Masaka district. Table 6: Structure of survey participants by district and value-chain domain District Value-chain domain Sub-county/ Ward Total households surveyed Hoima (n=150) Urban-urban Busiisi Rural-urban Kitoba Rural-rural Kiziranfumbi Kamuli (n=153) Rural-rural Namwendwa Rural-rural Butansi Rural-rural Bugulumbya Lira (n=153) Urban-urban Adyel Rural-urban Adekokwok Rural-rural Barr Masaka (n=150) Urban-urban Katwe Butego Rural-urban Kabonera Rural-rural Kyanamukaka Total households surveyed Households included in nutrition survey The number of households included in the Nutrition survey was lower than expected because some survey areas did not have enough households with children within the targeted age bracket of 6 to 59 months. There were also situations whereby some households underwent the sociodemographic survey component and were enlisted for the dietary survey but some children were sick or the child and mother were away on the day of the nutrition survey. Characteristics of Survey Participants A statistically significant large number of households included in this survey (77.7%) were headed by males and 72.4% of household heads were married (see Table 3 below). The respondents were also majorly the heads of the households (60.9%), spouses of the household heads (31.5%) or older children of household heads (4.1%). Ethnicity Cultural and traditional practices play a major role in determining the dietary patterns of individuals. The ethnicities of household heads were mainly Baganda (93%) in Masaka, Basoga (98%) in Kamuli, Langi (99%) in Lira, and Banyoro (77%) in Hoima. Table 1 provides details of the ethnicity of heads of households included in this survey. Others ethnicities included Omukebu, Nyarwanda, Lugbara, Madi, Mufumbira, Mugungu, Japadola, and Acholi. The spouses of household heads were mainly comprised of 59.3% Baganda, 79.7% Basoga, 81% Langi, and 54% Banyoro in Masaka, Kamuli, Lira and Hoima, respectively. In general, Hoima had the most ethnically diverse study population while Lira had the least diverse population (see Table 3). Religious background The religious background also influences the food patterns of society. Religious restrictions particularly have a major influence on consumption of animal-source foods. The majority of 21
25 participants in this study were Catholics (46.7%) and Protestants (36.0%) and these proportions are comparable to the national proportions reported in the Uganda Demographics and Health Survey (13). Masaka has a significantly higher proportion of Catholics (78%) while Lira has a slightly higher number of Protestants (52.9%). Hoima also reported more diverse religious backgrounds. Other religious backgrounds reported in Hoima included Bisaka (2.7%) and Faith of Unity (2%). Education background Similar to the national education statistics, the majority of heads of the surveyed households had completed primary school (54.8%), 25.3% had completed secondary level, while only 9.9% had attained tertiary or university education. Hoima had a slightly higher number of household head that had completed primary (63.5%) and the lowest number that had attained post-secondary education (3.5%). Lira had a significantly higher number of household heads that had completed post-secondary education (17.1%) and a larger proportion that completed secondary school (30%). 22
26 Table 7: Characteristics of survey participants Characteristics n District (%) Total (%) Masaka (n=150) Kamuli (n=153) Lira (n=153) Hoima (n=150) (N=606) Sex of HH Head Male Female Marital status of HH head Married (monogamous) Married (polygamous) Widow / widower Divorced/separated Single parent/unmarried Declined to answer Ethnicity of HH Head (Spouse) Baganda Basoga Banyoro Langi Acholi Alur Banyankole Bakiga Other Religion of HH head Muslim SDA Catholic Protestant Pentecostal Traditional Could not specify Highest education attained by HH Head None Pre-nursery/Nursery Primary school Secondary school Post-secondary Could not specify Highest education attained by Spouse None Pre/nursery Primary Secondary Post-secondary Could not specify The education levels of the spouses of the household heads also followed similar patterns as that of household heads. Overall, 15.5% of the spouses did not receive any formal education, 56.6% completed primary level, 21.7% completed secondary level, and only 4.3% had attained postsecondary education. Kamuli (18.6%) and Lira (19.5%) had the highest number of spouses with no formal education while Masaka (29.8%) and Lira (25.6%) had the highest number of spouses that had attained secondary education. 23
27 Household membership The number of people in the household and their life-stages determine the food needs, and indeed the food and nutrition security situation, at the household level. In this survey, respondents were asked to report the ages and gender of all household members. Table 8 provides a summary of the membership of the households surveyed. Survey area (n) Household size Table 8: Composition of households surveyed Median age of household members (years) Hoima (150) Median [Min-Max] HH heads Spouses Children 5 years Children <5 years n 5 [1 11] 143 Median age [Min- Max] n 40 [16-85] 101 Median age [Min- Max] n 31 [16-85] 222 Median age [Min- Max] n 12 [5 62] 87 Median age [Min-Max] 2.5 [ ] Kamuli (153) 5 [1 13] [19 80] [18-80] [5 59] [ ] Lira (153) 5 [1 12] [21-86] [15-70] [5 59] [ ] Masaka (150) Total (606) 5 [1 14] [1 14] [20-85] [16 86] [15-80] [15-85] [5 60] [5 62] 369 Overall, the ages of the household heads ranged from 16 to 86 years (median = 43 years); while the spouses were slightly younger with ages ranging from 15 to 85 years (median = 32 years). The ages of children who were still living in the households surveyed ranged from 1 week (0.02 years) to 62 years. Survey areas in Lira district had a slightly a large number of older children (median =14) and had more adult children living with their parents than in the other survey districts [ ] 2.58 [ ] Ownership and quality of housing The quality of housing is often associated with the health status of the household members whereas ownership of houses is related to the amount of disposable income which can be spent on other goods and services including food and healthcare. Hence, those that own the houses that they live in are expected to have more disposable income that can be used to purchase food and access healthcare than those that are renting houses. Overall, most of the respondents (88.3%) lived in their own houses and there were no significant differences in house ownership across the four survey districts and across the marketing valuechain domains. Masaka had a slightly higher proportion of respondents that lived in rented houses (16%) and those that had received houses as gifts from relatives (5.3%). Figure 8 below gives more details on household ownership. 24
28 %Households Hoima Kamuli Lira Masaka Total Owned by family Rented Given free by relative Owned or rented by employer Other Figure 8: House ownership across the four district survey areas Overall, only 7.6% (n=46) of the surveyed households were renting their places of residence. Masaka and Lira had the highest proportions of respondents that were living in rented homes. The largest proportions of those renting were also from urban areas and this was followed by periurban (10%) and lowest among rural households (5.4%). 25
29 Table 9 below shows the sizes of houses and monthly charges for rented houses. The mean housing quality score was 13.6; which indicates acceptable (average) housing. 26
30 Table 9: Quality and cost of housing District Housing characteristic Masaka Total Hoima Kamuli Lira Mean Housing quality score * Median number of rooms in house (N=606) 4 [1-10] 4 [1=11] 2 [1-8] 4 [1-11] 3[1-11] Median number of rooms in rented houses (n=46) 2 [1-3] 2 [2-4] 2 [1-3] 2 [1-4] 2 [1-4] Median monthly rental fee (UGX) Minimum Maximum Household poverty level based on housing index: Very poor - %[n]. [0]. [0] 0.7% [1] 1.3% 0.5 [3] Poor - %[n] 11.3 [17] 4.6 [7] 33.3 [51] Not poor - %[n] 88.7 [133] 95.4 [146] 66.0 [101] 2.7 [4] 13.0 [79] 96.0 [144] 86.5 [524] *Kamuli and Masaka had significantly larger proportions of better quality housing than households in Hoima and Lira. Overall, about a fifth of the households surveyed had poor housing (see Figure 2 below). Most houses were small with a median of 3 rooms (including living room and dining room) but the majority of houses had permanent structures that were built with brick walls (64%) and iron sheet roofs (85%). Figure 2 below shows that Lira and Hoima had the highest proportions of households with poor housing. Very poor housing Poor housing Average housing Good housing %Households Hoima [150] Kamuli [153] Lira [153] Masaka [150] Total [606] Figure 9: Quality of housing for survey participants Lira had the highest proportion of households with a single room (40%), 44% were made of mud and pole walls, 66% had grass thatched roofs, and 59% had bare earth floors. Masaka (83.3%) and Kamuli (79.9%) had the highest proportions of houses with brick walls; and Masaka also had the largest proportion of households with cemented floors. 27
.")
 and")
31 Access to and use of water resources Access to adequate amounts of safe water is crucial because water is important both in agricultural production and for better hygiene and sanitation. Both the quality and quantity of water accessible to the household determines the household members health status (14-16). As shown in Figure 10 below, the main water sources across the four districts were borehole (48%) followed by harvested rain water (46%), and wells (34%). Use water source % Households using and paying for water Pay for Figure 3: Proportion of households using and paying for water from source Types of water sources used Tap or piped water (21%) and spring water (23%) were accessed by only about a fifth of the survey households while river and stream water was only used by 5%. However, there were significant differences in access to the different water sources across the four districts. A significantly large proportion of the households in Kamuli (94%) and Lira (63%) had access to boreholes while boreholes were used by only 13% of the households in Hoima. Harvested rain water was used by about half of the participants in Masaka, Kamuli, and Hoima but least used in Lira. Almost all households that reported using tap or piped water and most of those using boreholes paid a monthly fee for the service. On average, the fee or payment was Ug. Shs (Median = 1000) for borehole 5, Shs (Median = 16000) for tap or piped water; and Shs (Median = 1000) for well water. Based on focus group discussions, the payments for 5 Most households paid an annual fee for borehole maintenance. Some only contributed when the borehole need repairs. Those paying higher amounts were in most cases buying the water from someone that collects it from the boreholes. 28
32 well and borehole water were mainly maintenance charges which were often levied at the time of maintenance or when the borehole broke down, respectively. None of the surveyed households paid for river or stream water and harvested rain water. Well and spring water were paid for mostly by households in Hoima and Masaka and these were mostly households in peri-urban areas. It is likely that these households were paying someone to collect water for them. Table 10: Estimated time taken to collect water from different sources Time (minutes) it takes to collect water from source Water source Masaka (n=150) Kamuli (n=153) Lira (n = 153) Hoima (n=150) Total (N=606) Borehole 9 [1-50] 15 [1-90] 10 [1-60] 20 [0.5 45] 10 [.5-90] Well 19 [1 60] 15 [3-60] 10 [2-60] 10 [1-40] 15 [1-60] River/stream 30 [5-45] 12 [5-60] 10 [2-30] 20 [5-30] 20 [2-60] Tap/piped 1.5 [0-35] 5 [1-45] 1 [0-10] 10 [3-20] 2 [0-45] Harvested rain water 1 [0-5] 1 [0-5]. 0 [0-10] 0 [0-10] Spring 10 [2-60]. 20 [2-40] 15 [1-60] 15 [1-60] Note: Values are medians. Numbers in brackets are minimums to maximum minutes taken to reach water source. On average, the streams and rivers were the farthest water sources (Median time = 20 minutes) and this may explain the limited use of these water sources. Kamuli had limited water-source options and thus boreholes were the farthest but more commonly used water source. For all survey areas, water was mostly collected by children and women (see Error! Reference source not found. below). In general, a higher proportion of males were collecting water in households that were using stream or river water and this may be explained by the long distances to these sources (see Table 10). 70 Children Women Men Hired labourers 60 %Households Hoima [33] Kamuli [255] Lira [183] Masaka [46] Hoima [92] Kamuli [40] Lira [104] Masaka [107] Hoima [11] Kamuli [3] Lira [20] Masaka [17] Hoima [17] Kamuli [34] Lira [103] Masaka [92] Borehole Well River/Stream Tap/piped water Figure 11: Who collects water from source Based on the proportions of households using boreholes, wells, and spring water and the time taken to collect water from these sources, the health status of the surveyed population (especially in Kamuli and Hoima) can be categorized as of high concern (14). This calls for interventions to improve water access in the survey areas. 29
33 Cooking fuel and cooking technologies used Access to fuel for cooking and the efficiency of cooking technologies are a key determinant of household food security. In general, households with limited access to cooking fuel often cope by reducing the number of meals or end up undercooking some foods and such coping strategies result in food insecurity (17). Hence, the access and pattern of utilization of fuel for cooking and the quality of cooking technologies (especially energy-saving technologies) are critical to household food and nutrition security. In this survey, firewood was the most commonly used fuel among rural (91%) and semi-rural (87%) households while charcoal was the primary cooking fuel for 54% of urban households. Kamuli (95%) and Hoima (94%) had the highest proportion of households using firewood as the primary fuel for cooking while Masaka (79%) and Lira (62%) had lower proportions. About a third (37%) of the remaining households in Lira and 19% in Masaka reported using charcoal. Charcoal was also used by 54% of households in urban areas. Paraffin was used for cooking by only one household in Kamuli while biogas and electricity were also considered major fuel sources to only one household for each in Masaka. The only other reported source of fuel for cooking was natural gas (sold in cylinders). Two respondents (0.7%) reported that they do not cook and thus do not use any of the cooking fuel sources % Hoima 94 6 Kamuli 95 4 Lira Masaka Total Firewood Charcoal Kerosene Electricity Biogas Other Figure 12: Proportion of households majorly using fuel source for cooking As expected, the cooking technologies were related to the fuel source majorly used for cooking. The traditional three-stone stove was the major cooking technology in all the four survey districts. A significantly large proportion of households in Lira used improved charcoal stoves (34%) and improved firewood stoves (20%). Masaka had the largest proportion of households (12%) using the traditional metal charcoal stoves (sigiri). 30
34 % Households Hoima (n=150) Kamuli (n=153) Lira (n=153) Masaka (n=150) Total (n=606) Traditional 3-stone stove Improved firewood stove Electric plate Improved charcoal stove Traditional metal stove (sigiri) Other Figure 13: Proportion of households using cooking technology The limited use of improve cooking technologies such as improved firewood, improved charcoal stove, and electric plate suggests a possible risk to food insecurity because households that rely on less efficient cooking technologies tend to have few meals or improperly cooked food (17, 18). Types of Fuel Used for Lighting Access to fuel for lighting determines the individual households sleep-wake cycles; and this consequently determines eating occasions and engagement in productive activities. Overall, kerosene or paraffin lamps and gas lanterns were the sources of fuel for lighting for three quarters of the households surveyed. Electricity was only used by only 14% of the total households surveyed and none of the households in Hoima reported using electricity but Hoima had the highest proportion of households that were using solar for lighting (see Figure 7) Hoima (n=150) Kamuli (n=153) Lira (n=153) Masaka (n=150) Total Electricity (UMEME) Kerosene or gas lantern Solar Rechargeable light Firewood Electricity (generator) Other Figure 14: Major sources of energy used for lighting 31
35 Battery-operated torches (0.7%) were also another important lighting energy source especially in Lira plus battery operated lamps (0.7%), and candles (0.2%). There were significant differences in the sources of fuel for lighting across the value-chain domains. Electricity was used by 22% of urban households, 18% in peri-urban, and by only 10% in rural areas. The pattern of solar usage was almost similar to electricity whereby solar was used by 16% in urban households, 5% in peri-urban households, and 10% of rural households. Conclusion The education levels, livelihood options, household headship, housing quality, patterns in access and use of cooking and lighting technologies, and access to water are not different from what is reported in national surveys such as the Uganda Demographics Health Survey (7, 13). These findings suggest the need for interventions to ensure safe access to adequate and more efficient cooking technologies, safe and adequate water, and to improve the livelihoods of the household members. 32
36 Income generation and household asset ownership ERROR! REFERENCE SOURCE NOT FOUND. below shows the income generating activities in which the surveyed households were engaged. Crop farming was a source of income for the majority (76%) of the households and the other common sources of income were self-employed (35%), piggery enterprises (23%), poultry (18%), cattle enterprises (15%) and remittances (13%). Crop farming was the common income generating activity in all four survey areas but Kamuli (95%) had the highest proportion of households that benefited from crop farming. Hoima Kamuli Lira Masaka Total Figure 15: Household major income sources during last 12 months Other important activities (in order of highly mentioned) were self-employment (33%), piggery (22%), and casual labour (17%) for Hoima; self-employed (36%), poultry (25%) and cattle (21%) for Kamuli households; self-employed (28%), poultry (24%), and cattle (20%) for Lira households; and self-employed (42%), piggery (35%), and remittances (18%) for Masaka households. Household ranking of income generating activities Households were asked to rank activities they were engaged in based on their perceptions of whether the activity is the household s major source of income. About a half (49%) indicated that crop farming was their first income generating activity and this was followed by self-employed offfarm (21%), piggery and casual labour (ranked by 6% of households each), and remittances (6%). Based on these rankings, it seems like a larger proportion of households from Kamuli (66%) depend on crop farming while households in Masaka have more diversified livelihood activities. 33
37 0% 10% 20% 30% 40% 50% 60% 70% 80% 90% 100% Hoima Kamuli Lira Masaka Total Piggery [36] Crop farming [297] Cattle [13] Poultry [11] Salaried employment [32] Self employed off-farm [125] Casual labour [36] Bodaboda [7] Remittances [34] Property rental [7] Figure 16: Proportion of households ranking activity as important As shown in Error! Reference source not found. above, crop farming was ranked as the major income source for the majority of households; however, it did not generate much income (Mean = UGX ; Min = 1,000, Max = 10 million). Figure 1 shows that households that earned higher incomes in the last one year were those which were renting out property (mostly rooms), engaged in cattle enterprises, those with salaried household members, engaged in bodaboda business, and those that have some members self-employed in non-farm activities. - 2,000,000 4,000,000 6,000,000 Property rent [18] Cattle enterprisev[53] Salaried employment [33] Bodaboda [12] Self-employment-off farm [149] Casual labor [47] Crop farming [340] Poultry enterprise [76] Remittances [42] Capture fishing [1] Aquaculture [1] Charcoal burning [8] Other sources [4] 3,997,200 3,039,100 2,414,200 1,903,300 1,640, , , , , , , ,750 1,530,000 Figure 17: Mean income generated from activity in last 12 months Management of the household income Overall, regardless of the source of income, men controlled much of the household earnings. For an average of 32.4% households, the husband managed the household earnings and the wife received money from him when she is in need of cash but the wife managed the money and husband received money from her when in need of cash in only about 6% of the households. The other common income management strategies were joint ownership and joint management of income which was reported in an average of 23.3% of the households and in an average of 18.1% of household heads were single and thus decided on how their income was spent. 34
38 Table 11: Intra-household control of income based on its source Income source How income is managed by household members (%) All money is shared. Do not distinguish husband from wife money. Some money is regarded as one s own and some as joint money. What we earn individually belongs to each of us. The husband manages the money, and the wife receives money from him when she is in need of cash. The wife manages the money and the husband receives money from her, when he is in need of cash The husband manages some of the housekeeping money, the wife manages the rest of the money. The wife manages some of the housekeeping money, the husband manages the rest of the money. Single person all income managed by him / her Pigs [135] Crops [453] Cattle enterprises [89] Poultry [109] salaried [56] Self employed off-farm [206] Casual labour [72] Bodaboda [14] Charcoal burning [8] Remittances [75] Aquaculture [1] Property rental [26] Capture fishery [1] Other sources [5] Mean proportions Some other arrangement (specify) 35
39 Ownership of domestic assets Household ownership of domestic and productive assets is often a good indicator of household socio-economic status and productivity, respectively; and women s ownership or co-sharing of ownership is a good indicator of women empowerment. Respondents were read a list of key assets and requested to identify the assets owned in their households and these domestic assets were later categorized by function, notably: food processing and preservation (cooker/gas stove and refrigerator), communication (radio, mobile telephone, and television), general welfare (sofa set and sewing machine), and fuel source (generator, biogas, and solar panel). A total of 73 households (12%) reported that they did not have any of these domestic assets (see Figure 11). 100 Men Women Joint %Households that own Food processing and preservation Figure 18: Intra-household ownership of domestic assets In this study refrigerators and cookers or gas stoves were used as indicators of modern food processing and preservation technologies. In general, ownership of these assets was very minimal. Only a total of eight households (1%) owned a cooker and a gas stove; seven of these (87%) were in Masaka and only one was reported in Lira. Refrigerators were only reported in 30 households (5%) and the majority of these were also inmasaka (63%) and Lira (27%). Both refrigerators (63%) and cookers or gas stoves (87%) were majorly reported by households in urban areas and these items were mostly jointly owned by household members and by women. Communication tools and equipment Communications tools and equipment facilitate the population s access to information. Since this survey is designed to guide interventions on pig production and utilization of pork products, it was important to assess the target population s access to communication tools and equipment. 36
40 It was determined that almost three quarters of the households surveyed had radios (sum = 506) and mobile phones (sum = 733; mean 1.7). Unlike other assets, rural households owned the largest proportions of mobile phones (45%) and radios (48%). Television sets were majorly owned by urban household (56%) and the majority of televisions were owned by respondents in Masaka. Fuel source items These were items generally used to generate electricity at household level, namely generators, biogas, and solar panels. Biogas was reported by only two households in Kamuli. Generators were also very few (only 7) and were mostly used in Masaka (50%) and Hoima (25%). Solar panels were used by 11% (n=66) of the surveyed households and the majority of these were in Hoima (43%) and were mainly owned in rural households (48%). Like other fixtures, solar panels were mostly owned by men (38%) or jointly (48%). In general households in Lira and those in peri-urban areas owned the least of the fuel-source assets. Table 12: Intra-household ownership of domestic assets Survey area Owned Total owned Gender asset By Men By Women Jointly disparity Hoima 1.5 ± ± ± ± Kamuli 1.4 ± ± ± ± Lira 1.1 ± ± ± ± Masaka 1.2 ± ± ± ± VC domain Rural-rural 1.4 ± ± ± ± Rural-urban 1.2 ± ± ± ± Urban-urban 1.2 ± ± ± ± Total 1.3 ± ± ± ± Overall, there were significant differences in ownership of domestic assets across the districts and value chain domain. Masaka had the highest number of assets compared to Kamuli (p = 0.23) and Lira (p = 0.20; however, men in Hoima owned significantly more domestic assets than those in Masaka (p = 0.23) and Lira (p = 0.13). For all study areas, men owned more household assets than women. The least disparity in ownership of domestic assets was reported in Kamuli (mean gender disparity = 0.77± 2.1) and among rural households (mean = 0.67 ± 2.9). Ownership of farm assets Ownership of farm assets is linked to the productivity of household members. Since a large proportion of the Ugandan population practices subsistence agriculture with hardly any mechanization, respondents were asked to report on their household s ownership of hoes, wheelbarrows, axes, spades or shoves, pangas or machetes, ox-ploughs, sprayer pumps (big), and fishing nets. Hoes were the major farm asset used by almost all rural households. A total of 1902 hoes were owned by 579 households (Median = 3). Error! Reference source not found. below shows the age and ownership of the hoes owned by households in the four survey areas. 37 Figure 19: Intra-household ownership of domestic assets
41 Owned by Men Hoima Kamuli Lira Masaka Owned by Owned Jointly 0 <3 3-7 >7 yrs <3 3-7 >7 yrs <3 3-7 >7 yrs Figure 20: Intra-household ownership of hoes across survey areas As shown above, men had newer hoes while women owned older hoes in Hoima, Kamuli, and Masaka. Lira had more jointly owned hoes. Similar patterns were observed in intra-household ownership of pangas and axes. Ownership of transport assets Estimated age of hoes Household ownership of transport assets is linked to mobility of household members and more access to markets and services. Households included in this survey were asked to report on ownership of salon cars, trucks, motorcycles, bicycles, and boats by any of the household members. Overall, 69% of the households surveyed owned some form of transport asset (Median = 1; Min =0; Max =4). Bicycles were the most common form of transport asset owned (Sum = 413) followed by motorcycles (Sum = 108), salon cars (Sum = 20) and trucks (Sum = 8). None of the households owned any boats. Masaka had the highest proportion of households (35%) without any form of transport asset while Kamuli had the highest proportion (72%). In general, households in peri-urban areas were more likely to own a form of transport asset. Details on intra-household ownership of transport assets are given in 38
42 Table 13Error! Reference source not found. below. 39
43 Table 13: Intra-household ownership of transport assets Survey area Owned Total owned Gender asset By Men By Women Jointly disparity Hoima 9.6 ± 16.7 [0 86.4] 0.8 ± 4.2 [0 48] 1.2 ± 6.5 [0 48] 11.5 ± 17.4 [0 86.4] Kamuli 7.5 ± 18.8 [0 160] 0.7 ± 4.2 [0-48] 1.2 ± 4.3 [0-48] 9.3 ± 19.0 [0 160] Lira 8.7 ± 30.4 [0 320] 1.6 ± 8.0 [0 80] 1.3 ± 6.3 [0 80] 11.7 ± 32.0 [0 320] Masaka 15.7 ± 39.3 [ ] VC domain 2.5 ± 15.7 [0 128] 3.6 ± 19.6 [0 160] 21.8 ± 44.3 [0 240] Rural-rural 8.4 ± 24.3 [0 240] 0.5 ± 3.2 [0 48] 1.1 ± 5.5 [0 76.8] 10.0 ± 24.5 [0-240] Rural-urban 8.3 ± 17.7 [0 128] 1.4 ± 6.8 [0-80] 1.8 ± 8.3 [0 80] 11.5 ± 19.6 [0-128] Urban-urban 15.6 ±38.6 [0 320] 2.9 ± 15.8 [0 128] 3.1 ± 18.0 [ 0 160] 21.6 ± 43.5 [0 320] Total 10.3 ± 27.8 [0 320] [0 128] 1.8 ± 10.9 [0 160] 13.5 ± 30.3 [0 320] The median index for male owned transport assets was 3 in Hoima and 0 for all other districts As shown in
44 Table 13 above, men owned the highest proportion of all transport assets. The mean gender disparity in ownership of transport assets was very low (mean = ± 0.198). The least gender disparity in transport asset ownership was reported in Lira households (mean = ± 0.329) and the peri-urban areas (mean = ± 0.308). Land ownership and usage In a country whereby more than 80% of its population relies on subsistence agricultural production (mostly crops), land is the major livelihood asset. The results of this survey show that 97% of the households surveyed owned at least one parcel of land. The number of parcels of land owned ranged from 0 to 7 parcels (median = 1). About half of the households (49%) owned one parcel of land; 28% owned 2 parcels; 12% owned 3 parcels, and it was only the remaining 7% that owned 4-8 parcels. Only 3% (5 in Hoima, 9 in Masaka and 9 in Lira) of the surveyed households did not own land. 41
45 Table 14: Land ownership and usage among survey participants 42
46 Table 14 below provides details on ownership and usage of land across the four survey districts. 43
47 Number of parcels Table 14: Land ownership and usage among survey participants Proportion of households that owned or cultivated specified parcels Hoima Kamuli Lira Masaka Total (n=150) (n=153) (n=153) (n=150) (n=606) Owned Used Owned Used Owned Used Owned Used Owned Used None Note: Used refers to parcels of land that were cultivated in the last season (March-May 2014). These include those owned by household, rented, and borrowed parcels. As shown in 44
48 Table 14, about half of households in Lira owned two parcels and more (Median = 2; Min= 0- Max =8); but Lira also had the largest proportion of unutilized parcels (41%). Land utilization patterns For smallholder subsistence producers, the amount of land used is expected to determine the types and amounts of agricultural production and is a determinant of dietary diversity and food security. In general, households that do not engage in production are at risk of food insecurity. A total of 5% respondents had not cultivated any land in the previous season (March- May), 10% had rented some parcels for cultivation while 70% had utilized all the parcels they own while 20% had not utilized all the parcels owned. A significantly large proportion of households in Lira (16%) reported that they had not cultivated any land in the last season. In addition, the proportion of households that owned two (2) parcels or more was larger than the proportion of households that cultivated two parcels or more in the last season indicating that more parcels were not cultivated in the last season. Overall, there was a significant difference in the number of land parcels which were utilized in the last season. A significantly large proportion of households in Kamuli cultivated more land than they owned which means that these households rented or borrowed some land parcels for cultivation in the last season (March-May 2014). Type of land ownership Although the interactions between land ownership and food security are complex (19), land access (often influenced by the type of land tenure system) influences the agricultural activities carried out on a piece of land and this in turn influences the types of food available to the household especially in those contexts where a large proportion of the population are subsisting on their crop production. In a context where household members feel food secure when they have cultivated perennial crops (20), households that rent or borrow land are not likely to achieve food security because they are often not allowed to cultivate perennial crops such as bananas and cassava. In this survey, only 8% of the households surveyed had title deeds for the land they owned while about a half of the household (49%) were the owners of their land but had no title deeds; about a quarter (23%) were using customary land or land owned by the clan and 7% were renting the land they were using. 45
49 Title deed Owned but not titled Squarter on puplic land Rented in Kibanja owner on kingdom land Hoima Kamuli Lira Kibanja owner on mailo land 23 Masaka Communal Custorary (clan owned) Could not tell Others 2 Figure 21: Types of land tenure systems across survey areas The largest proportions of households with title deeds were in Lira and Masaka while Hoima and Kamuli had higher proportions of untitled land. Kamuli also had a higher proportion of households renting land (18%); Masaka had higher proportions of Kibanja holders on Buganda Kingdom land (15%) and on mailo land (23% ), while Lira had a higher proportion of households that were utilizing customary or clan owned land (45%). The other types of ownership specified were contract tree planting for government (1%), some households were acting as caretakers for relatives, and some were given the land by relatives or friends but were not considering the land as their own. Primary activities on land owned In general, crop production was reported as the primary use of the land parcels owned by three quarters of the households surveyed (75%) and the second important land use was for homestead (20%). However, it was noted through observations that many households practiced mixed farming on the same plot of land they used as homestead. 46
50 Hoima Kamuli Lira Masaka Figure 22: Primary land use activities For example, households were keeping animals by zero grazing around the home and using the rest of the land for crop production and other activities. Fodder production (0.5%), pasture (1%), and tree planting (1%) were not allotted many parcels of land. Other land uses mentioned (2%) included construction of rental premise and renting out land to others for cultivation. Ownership of Livestock The UN Food and Agriculture Organisation (FAO) data indicate that livestock production has been steadily increasing in Uganda over the last decade (2) 6. In this study, 468 out of the 606 households (77%) surveyed reported that they own livestock. The proportions of households that owned livestock were 80% from Hoima, 78% from Kamuli, 73% from Lira, and 78% from Masaka district survey areas. 6 World Bank (2015) Livestock production index. URL Accessed June
51 Table 15: Intra-household ownership of livestock assets Survey area Owned Total owned Gender asset By Men By Women Jointly For others disparity Hoima 6.2 ± ± ± ± Kamuli 7.1 ± ± ± ± ± Lira 7.6 ± ± ± ± ± Masaka 3.9 ± ± ± ± ± VC domain Rural-rural 7.5 ± ± ± ± ± Rural-urban 7.4 ± ± ± ± ± Urban-urban 40.5 ± ± ± ± Total 15.7 ± ± ± ± ± Due to the two large livestock farms, Masaka had a significantly higher mean livestock ownership index; however, the median livestock asset index was 8 (95% CI: 4, 16) in Hoima, 11 (95% CI: 4, 22) in Kamuli, 20 (95% CI: 8, 32) in Lira, and 8 (95% CI: 4, 17.2) in Masaka. It is important to note that, when compared to ownership of domestic and farm assets, there was less gender disparity in livestock asset ownership (mean total = 0.52). Figure 23 below shows the types of livestock owned across the four survey areas districts) Poultry Pigs Goat Cattle Sheep Rabbits Hoima (n=120) Kamuli (n=120) Lira (n=112) Masaka (n=116) Total (n=468) Figure 23: Proportions of households owning different types of livestock Poultry, which was owned by 74% of the households surveyed, was the most commonly owned livestock and this was followed by pigs (52%), goats (45%) and cattle (39%). Error! Reference source not found. below shows that the highest proportions of households kept poultry (78%), goats (48%), and cattle (43%) were in rural areas; however, a significantly higher proportion of urban households (66%) kept pigs. Rabbits and sheep were kept by very few households. 48
52 Local [694] Improved [32] Local [1051] Improved [7] Local [704] Improved [8] Local [411] Improved [2790] Rural-rural (n=273) Rural-urban (n=122) Urban-urban (n=74) %Households Rabbit Sheep Cattle Goat Pig Poultry Poultry Figure 24: Livestock ownership across major pig marketing value-chain domains Hoima district had a greater proportion of households (83%) that owned poultry; however, Masaka had the highest poultry stock (sum = 3201). The high poultry population in Masaka is attributed to a single farmer who owned 2000 birds. The median number of birds owned in Masaka were 4 (min = 1; Max = 2000); in Hoima the median was 5 birds (Min = 1; Max = 30); Kamuli had a median of 7 birds (Min = 1; Max = 156); and Lira had the highest number of birds per household with a median of 8 (Min = 1; Max = 36). In general, Figure 25 below shows that local breeds constituted one half of the total poultry population in the four survey areas; however when the single commercial farmer with 2000 improved birds is excluded, local breeds constitute more than three quarters (77%) of the poultry owned by surveyed households Males Females Joint Kept for others Hoima Kamuli [n=93] Lira [n = Masaka [n=91] Figure 25: Intra-household ownership of poultry across the four survey areas 49
53 At household level, it seems that ownership of local poultry breeds was more evenly distributed among males and females; however males dominated the ownership of improved breeds in Kamuli and Masaka. In Hoima, a large proportion of improved breeds (94%) were owned jointly by males and females in the household while in Lira all the 8 improved birds were owned by women. Pigs Overall the number of pigs owned was lower than expected. The largest proportion of pigs reported were in Masaka (37%; mean = 1.9±1.6); followed by Hoima (30%; mean = 1.8±1.6) and Kamuli (20%; mean = 1.8±1.5); while Lira had the least (14%; mean = 1.7±1.0) Local Improved Hoima Kamuli Lira Masaka Figure 26: Total number of pigs owned by breed 50
54 Intra-household ownership of pigs Figure 27 below shows the intra-household ownership of pigs by breed. Unlike other livestock, ownership of pigs was neither dominated by males nor by females. The practice of keeping pigs for non-household members was commonly reported in Kamuli and Lira; there were hardly any pigs kept for non-household members in Masaka Hoima [n=120] Kamuli [n =78] Lira [n=57] Masaka [n = 139] %Households Local [168] Improved [53] Local [73] Improved [74] Local [79] Improved [23] Local [144] Improved [127] Kept for others Jointly Females Males Breed and number of pigs owned Types of pigs owned Figure 27: Intra-household ownership of pigs by breed As shown in Error! Reference source not found. below, there were no significant differences in the types of pigs owned across the four survey areas. In general, sows constituted about a quarter of the pig population (26%). Given the higher litter size for pigs, the proportion of piglets (21%) and growers or finishers (14%) were lower than expected. This could be attributed to low fertility among sows or high mortality among piglets and finishers. 51
55 % Owned Males Females Jointly Kept for others 100 Hoima (n= 120) Kamuli (n= 78) Lira (n= 57) Masaka (n= 139) Pig types and number owned Figure 28: Intra-household ownership of pigs by type Piggery as source of income Based on focus group discussions, the majority of pig keepers own pigs as an income generating activity and often sell off pigs to cover larger household regular expenses such as school fees. None of the households reported producing pigs for own consumption. Hence, the contribution of piggery to animal-source food (ASF) consumption is likely to accrue from the use of income from pigs to purchase other ASFs. Pigs enterprises (mainly piggery farming) were reported as the major source of income by 137 households (23%) as one of the major sources of income during the 12 months preceding the survey. Pigs were ranked as the major source of income by 26% of the 137 households that were engaging in pig keeping as an income generating activity while 42% and 23% ranked it second and third income source, respectively. 52
56 %Households that ranked Hoima Kamuli Lira Masaka Total st 2nd 3rd 4th 5th 6th 1 Ranking of pig enterprise Figure 29: Proportion of households ranking pig enterises as major source of income As shown in Error! Reference source not found. above pig enterprises were ranked most favourably in Lira, Masaka, and Hoima. Respondents in Kamuli ranked crop production and cattle keeping as their major income generating activities. Seasonality in pig sales In general, pig prices varied by pig type and survey area (seetable 16 below). Based on the prices of weaners and piglets, it seems like households in Lira and Masaka benefited from higher prices for their animals. Table 16: Mean farm-gate prices for pigs by type and survey area during 12 months preceding the survey Type of pig sold Mean prices of pigs (UGX) Hoima Kamuli Lira Masaka Total Boars 118,750± 43, , ,400 ± 35, ,200 ± 64, ,100 ± 55,900 Sows 207,400 ± 69, ,300 [58,700] 244,200 ± 27, ,100 ± 36, ,900 ± 55,100 Gilts 111, ,000 ± 28, ,900 ± 27,800 Weaners/Piglets 24,300 22,500 ± 10,600 53,300 40,000 32,500 ± 14,700 Growers/finishers 50, ,350 ± 18, , ,200 ± 47, ,600 ± 48,200 Average price 121,925 ± 33, ,900 ± 83, ,600 ± 31, ,200 ± 16, ,900 ± 49,700 Values are means ± standard deviations. Missing SD indicate only one household sold pigs of specified type. 53
57 Mean price per pig (UGX) As noted from focus group discussions, farmers often sell pigs to earn quick income to meet pressing financial needs such as payment of school fees. Hence, the prices are also influenced by the season. As shown in Figure 23 below, there were some variations in the pattern of pig sales across the four survey districts during the four quarters of the year. The number of pigs sold seems to have remained at about the same level throughout the year only in Masaka and this may explain the stability in prices shown in Figure below. Figure 23: Variations in Pig prices in past 12 months Respondents in Hoima sold about the same number of pigs in the first three quarters (January September) but sold very few pigs around October-December. Hence the number of pigs sold was not related to changes in price. Respondents in Kamuli reported selling about the same number of pigs in the first two quarters (January June) and sold few numbers around July-September and almost no pigs in the last quarter of October to December. Hence, for Kamuli, the increase in the price of pigs around July-September seems to be related to the limited availability of pigs. In Lira, more pigs were sold around January March and around July-September which coincides with children returning to school. In general, more pigs were sold in the first quarter (January to March), which coincides with the time when most households are raising money to pay for school fees. Less pig sales are observed in October to December because this is the time when consumers are saving money for the end of year holidays (see Figure 24 below). This could also be attributed to the fact that most Christians do not consume pork over the Christmas holidays. 54

, followed by Kamuli (50.")

58 Cattle Cow milk is the major source of animal-source protein and major weaning food for most of the households in Uganda while beef is the major meat consumed around the country. In this survey, only 39.5% (185) of the 606 households surveyed owned cattle. Lira had the highest proportion of households that kept cattle (54.5%), followed by Kamuli (50.8%), Masaka (39.7%) and Hoima had the least cattle-keeping households (14.2%). However, Masaka had the highest number of heads of cattle owned. Masaka Kamuli Lira Hoima Figure 31: Number of pigs sold in past 12 months 55
59 Local [59] Improved [41] Local [94] Improved [69] Local [252] Improved [0] Local [592] Improved [107] Kept for others Jointly Females Males Kamuli Hoima Masaka Figure 32: Intra-household cattle ownership by breed across the four survey areas As shown in Figure 32 above, the majority of households owned local cattle breeds. Improved breeds (exotic or cross breeds) constituted only 17.9% of the total 1214 heads of cattle owned by the 606 households surveyed. About half of both the improved cattle breeds (49.3%) were owned by households in Masaka. In general, Kamuli had more households with local cows but Masaka had more cattle heads because of two households that had ranches of 200 and 250 heads. Intra-household ownership of cattle Lira The largest proportions of cattle were owned by males in all the surveyed areas. Females owned slightly large proportions of local cattle breeds in Hoima (41%) and Kamuli (39%). In Masaka, males dominated the ownership of local cows (93%) but the largest proportion of improved breeds (82%) were jointly owned by males and females. In general, cows constituted the majority of cattle owned in all districts and the majority of cattle were owned by males. Immature bulls and heifers (hitherto referred to as immature) were majorly owned in Masaka. 56
60 % HH members that own cattle type Males Females Joint Kept for others Figure 33: Intra-household cattle ownership by type across the four survey areas Hoima Kamuli Lira Masaka From Figure 33 above, intra-household ownership of cattle was not based on breed of cattle. However, Kamuli had more female-owned cattle; Masaka had the most male-owned cattle; while Lira reported more jointly owned cattle. Ownership of fish ponds Fish farming is currently promoted in many communities to improve access to animal-source foods; however, only seven (1.2%) of the households surveyed owned a fish pond. The fish ponds were evenly distributed across the survey areas (two ponds each reported in Kamuli, Lira, and Masaka and one pond reported in Hoima), which indicates that fish farming was not a major activity in the survey areas. This may also explain the complete lack of ownership of boats among the survey households. Summation of Household Asset Ownership In general, a large proportion of the household surveyed had limited resources but based on the modified CASHPOR House Index (1), only 13.5% of the households surveyed were classified as poor. Table 17 provides an overview of the key household asset ownership indicators. The mean total household asset index was 18.7±91.8; some households had none of the proxy assets while the highest asset score was (Skewness = 21.3; Kutorsis = 503.1). Although the total number of animals owned seems low, the results of this survey suggest that livestock contributes about 58% (95% CI = ) to the total household non-land assets and 57.8% (95% CI = ) to the non-land assets owned by women. Overall, men owned more livestock than women; hence, livestock owned by women contributed only about 19.2% to the total household asset base. Gender disparity in livestock ownership was highest in Lira (0.21:1), moderate in Masaka (0.43:1), and lowest in Kamuli (0.78:1) and Hoima (0.77:1). The mean ratio of female to male owned livestock was 0.52:1. Hence, interventions to improve livestock ownership by both men and women are likely to improve the total household asset base. 57
61 Table 17: Summary of key household asset ownership indicators Key Indicator District Pig value-chain domain Hoima Kamuli Lira Masaka Ruralrural Rural- Urban Urbanurban Total ownership [2.0, [2.0, [2.0, [2.0, [2.0, [2.0, [2.0, 13.2] Median Household Asset index 12.8] 15.8] 24.0] 13.0] 15.4] 16.6] Median Household Livestock asset [4.0, [4.0, [8.0, [4.0, [4.0, 22.0] [4.0, [4.0, 26.2] index 16.0] 22.0] 32.0] 17.2] 20.0] % 60.40% 69.40% 52.70% 59.60% 55.00% 53.40% Mean livestock contribution to total household asset base [95%CI] [ ] [ ] [ ] [ ] [ ] [ ] [ ] 58.0% Women s ownership of assets: Median household asset index for women [0, 2.0] [0, 3.0] [0, 2.4] [0, 3.0] [0, 3.0] [0, 2.9] [0, 3.0] % 24.8% 23.0% 31.0% 23.3% 31.9% 29.1% 27.1% Contribution of women s assets to household asset [95%CI] [ ] [ ] [ ] [ ] [ ] [ ] [ ] [ ] Gender disparity in ownership of HH assets Median women s livestock asset index [0, 5.0] [0, 10.0] [0, 4.0] [0, 4.0] [0, 6.0] [0, 5.0] [0, 4.0] % 62.9% 51.7% 61.6% 60.8% 52.3% 57.9% Mean livestock contribution to women's asset base [95%CI] [ ] [ ] [ ] [ ] ( ) ( ] [ ] 57.80% Gender livestock asset disparity [95%CI] [ ] [ ] [ ] [ ] [ ] [ ] [ ] 0.52 Values in brackets are 25 th and 75 th percentiles. 58
62 Household Food Security and Coping Strategies Household food security was examined by assessing household food access, strategies employed by households in coping with food insecurity, and seasonal food availability at community level. Household Food Access Access to food is a major determinant of household food security. In this survey, household food access was assessed using the Household Food Insecurity Access Scale (HFIAS). This scale quantifies the level of food insecurity based on 3 major domains, namely: anxiety and uncertainty about the household food supply, insufficient quality of food, and insufficient food intake and its physical consequences. The results from this assessment are shown below: Anxiety and uncertainty about the household food supply About a half (52.5%) of the 606 households surveyed had worried that their households would not have enough to eat. The proportion of households reporting anxiety about food access was highest in Lira (65.4%) and lowest in Hoima (43.1%). Insufficient quality of food In this survey, about two thirds of the households (65%) reported that at least one household member was unable to eat the kinds of foods they preferred while 62% of the surveyed household reported that at least one household member had eaten food that they really did not want to eat because of lack of resources to obtain other types of food. This indicates that some household members were not accessing food of sufficient quality, thus were food insecure. This can partly be explained by the fact that the survey was conducted in a period of food shortages. For example, in Kamuli almost all households were eating potatoes at the time of the survey and most participants in focus group discussions indicated that they would have preferred to eat posho (maize meal). In Masaka, the majority of people preferred matooke (the traditional staple) but focus group participants indicated that most households were now consuming posho and most had gotten accustomed to consuming posho since they know that they can no longer produce enough bananas. In general, the preferred foods were available in shops but could not be accessed due to relatively high prices. As was noted by focus group participants in Kamuli, Posho [maize meal] costs only Shs.600 per Kg during the harvest season. It feels unreasonable [for them] to buy posho at Shs.1200 in shops or even as high as Shs.1500 in the village. Insufficient quality also includes a component of food variety. In this survey, 60% of the households reported that they had eaten a limited variety of foods due to lack of resources. This indicates that household members were more likely to have insufficient nutrient intake (had nutrition insecurity). Insufficient food intake and its physical consequences The main component of food security is the requirement that individuals have enough to eat at all times to meet their energy and nutrient needs. Insufficient food intake often indicates severe food insecurity. A total of 44% of households surveyed reported consuming reduced portions of food; 36% had fewer meals than usual; 14% had gone to sleep without eating; while 3% had experienced at least one episode whereby they had gone through the day and night with nothing to eat in the 30 days preceding the survey. The number of households reporting insufficient food intake in the 30 days preceding the survey was significantly higher in Lira where 62.8% reported episodes of 59
63 reduced food portions; 61% reported reduced number of meals; 32% had no food of any kind in the household; while 23%reported experiencing episodes of going to sleep hungry. Participants in Hoima reported the least occurrences of food insufficiency in the 30 days preceding the survey. Only one third of the participants from Hoima (33%) had experienced reduced meal portions; 21% had fewer meals than usual; 13% reported lacking food of any kind; 7% had gone to sleep hungry while 0.7% had gone through the day and night without eating due to lack of resources. These statistics indicate that all survey areas had some level of food insecurity. Table 18 below exhibits the level of food insecurity. Table 18: Proportion of households reporting limited food access in past 30 days Experiences of food insecurity District (%) Total Hoima n=150 Kamuli n=153 Lira n=153 Masaka n=150 (%) 1. Anxiety and uncertainty about household food supply: 1. Had worried that they would not have enough to eat Insufficient quality of food: 2. Ate less preferred foods Had limited variety Did not eat what wanted because of limited resources Insufficient food intake and its physical consequences: 5. Had eaten a smaller meal because there was not enough food 6. Had eaten fewer meals in a day because there was not enough food 7. Had times when no food of any kind was available in household because of a lack of resources to get food. 8. Had gone to sleep at night hungry because there was not enough food. 9. Had gone a whole day and night without eating anything because there was no food. Average HFIAS scores Based on the HFIAS scores above, there was a significant difference in the proportions of households reporting limited food access across the four districts (χ 2 = 25.15; p = ). Lira had the highest food insecurity score of 4.52 while Masaka and Hoima had lower HFIAS scores of 3.06 and 3.07, respectively. Frequency of Food Insecurity Experiences Based on HFIAS, the mean incidence of food insecurity was 6 days in the past 30 days preceding the survey. The frequency of occurrence of limited food access is shown in 60
64 able 19 below. There were no significant differences in the occurrence of food insecurity (access) across the four districts; however, Lira reported slightly more incidences of food insecurity while Hoima households reported the least frequency. able 19: Level and frequency-of-occurrence of food insecurity based on Household Food Insecurity Access Scale (HFIAS) District (%) HFIAS Score Hoima (n = 150) Kamuli (n=153) Lira (n = 153) Masaka (n = 150) Mean HFIAS scores Frequency of food insecurity: Median [Minim Max] 5 [0 20] 5 [0 25] 7 [0 27] 4.5 [0 20] Mean score ± Std.Dev 5.35 ± ± ± ± 5.53 Strategies Employed by Households to Cope with Food Insecurity Despite the level of food security experienced, the food and nutrition security of individuals in the household is determined by how household members cope with the food insecurity. In this survey, a total of 75.1% reported not having enough food to eat in the past 30 days; and the most commonly used strategy to cope with food shortages are highlighted in 61
65 Table 20 below. 62
66 Coping strategy Table 20: Summary of Household Food Insecurity Coping Patterns How frequently households relied on strategy* (% (n)) All the time (Every day) % (n) Pretty often (3-6 / Wk) % (n) Once in a while (1-2 / Wk) % (n) Hardly at all (<1 / Wk) % (n) Never % (n) Consume less preferred foods 11.2 (51) 25.1 (114) 37.4 (170) 14.1 (64) 12.3 (56) Borrow food 0.7 (3) 10.3 (47) 18.7 (85) 11.9 (54) 58.5 (266) Buy food on credit 0.9 (4) 12.7 (58) 28.1(128) 14.7 (67) 43.5 (198) Gather, hunt or harvest immature crops (33) 13 (59) 9.5 (43) 70.3 (320) Use seed stock 0.9 (4) 10.3 (47) 17.8 (81) 17.4 (79) 53.6 (244) Eat elsewhere (15) 1.5 (7) 4.0 (18) 91.2 (415) Send HH members to beg for food 0.4 (2) 3.3 (15) 2.4 (11) 4.4 (20) 89.5 (407) Reduce portions 0.9 (4) 14.7 (67) 18.7 (86) 14.1 (64) 51.6 (238) Restrict adult intake.. 4 (18) 6.8 (31) 7.5 (34) 81.8 (372) Feed working members 0.2 (1) 0.9 (4) 1.1 (5) 3.5 (16) 94.3 (429) Ration money 1.3 (6) 7.9 (36) 5.3 (24) 8.8 (40) 76.7 (349) Reduce number of meals 0.9 (4) 11 (50) 13.4 (61) 15.2 (69) 59.6 (271) Skip days 0.2 (1) 1.8 (8) 1.5 (7) 4.8 (22) 91.6 (417) In general, most households mainly coped with limited food access by consuming less preferred foods, reducing the portions of food served at every meal, buying food on credit, and reducing the number of meals that are prepared in a day. Since, there were significant variations in the strategies employed by participants across the survey areas, more data on coping strategies is presented for each district below. Food insecurity coping strategies in Hoima The largest proportion of participants in Hoima district coped with food insecurity by consuming less preferred and less expensive foods (84%). This was followed by purchasing food on credit (49%), consuming seed stock held for the next season (46%), and reducing portion size at meal times (37%). The chart below shows how frequently the various coping strategies were employed by households in Hoima to improve their access to food. 63

67 Consume less preferred Borrow food Buy food on credit Gather/hunt/use immature Use seed stock Eat elsewhere HH members beg Reduce portions Restrict adult intake Feed working members Ration money Reduce meals Skip days All the time Pretty often Once in a while Hardly at all Never % Households Figure 34: Proportions of households that relied on specified coping strategies in Hoima Food insecurity coping strategies in Kamuli Strategies for coping with limited food availability and access employed in Kamuli were similar to Hoima. The majority of participants (81%) most frequently resort to consuming less preferred and less expensive foods in order to cope with food shortages. Based on focus group discussions, the less preferred foods which were commonly consumed in Kamuli during times of food shortage were cassava meal and yams. Consume less preferred Borrow food Buy food on credit Gather/hunt/use immature Use seed stock Eat elsewhere HH members beg Reduce portions Restrict adult intake Feed working members Ration money Reduce meals Skip days All the time Pretty often Once in a while Hardly at all Never Figure 35: Proportions of households that relied on specified coping strategies in Kamuli As shown in Figure 35 above, other important strategies which were resorted to in order of highly reported are purchasing food on credit (58%), using seed stocks for food (47%), reducing the number of meals (46%), and reducing the portion of foods served to individuals (43%). 64
68 Food insecurity coping strategies in Lira Compared to other survey areas, participants in Lira reported resorting to a combination of varied strategies to cope with food insecurity. The majority of participants in Lira also relied most frequently on consuming less preferred and less expensive foods. Consume less preferred 25 Borrow food 18 Buy food on credit 17 Gather/hunt/use immature 16 Use seed stock 15 Eat elsewhere HH members beg Reduce portions 22 Restrict adult intake 5 11 Feed working members 13 5 Ration money 9 3 Reduce meals 14 Skip days All the time Pretty often Once in a while Hardly at all Never Figure 36: Proportions of households that relied on specified coping strategies in Hoima Unlike in other survey areas, more household in Lira reported coping with food shortages by borrowing food or relying on help from relatives and friends (62%) and by gathering, hunting or harvesting immature crops (57%). Food insecurity coping strategies in Masaka Relying on less preferred foods was also a major coping strategy in Masaka. Other major coping strategies included reducing the amounts of food served to individuals (59%), buying food on credit (49%), reducing the number of meals (46%), and using seed stock for food. Consume less preferred Borrow food Buy food on credit Gather/hunt/use immature Use seed stock Eat elsewhere HH members beg Reduce portions Restrict adult intake Feed working members Ration money Reduce meals Skip days All the time Pretty often Once in a while Hardly at all Never Figure 30: Proportions of households that relied on specified coping strategies in Masaka 65
69 Overall, most households coped with food insecurity (limited access) by relying on less preferred and less expensive foods. Extreme practices such as sending out household members to beg and going through a whole day and night without food were not resorted to by a significant proportion of households surveyed, which indicates that the level of food insecurity is not very high. Error! Reference source not found. below summarizes the overall ordering on importance of the coping strategies. All the time Pretty often Once in a while Hardly at all Never Consume less preferred 11 Buy food on credit 28 Reduce portions 19 Use seed stock 18 Borrow food 19 Reduce meals 13 Gather/hunt/use immature 13 Ration money Restrict adult intake HH members beg Eat elsewhere Skip days 22 5 Feed working members Figure 37: Summary of food insecurity coping strategies by order of importance Intra-household Food Distribution Patterns As shown in Error! Reference source not found. above, the majority of households did not opt to serve only working members in the household during times of food shortages. In all survey areas, attempts were made to secure more food for all household members. Households coped by restricting the number of meals and reducing the portions of food served to individuals before resorting to restricting the intake of adults. Value chain domain Table 21: Intra-household food distribution patterns during food shortages Who is served first when food is not enough? Younge r childre n (<5 yrs) Portion served equally Male head of HH Older Children & adolescents (6-18 yrs) Female head of HH Pregna nt women Other membe rs of HH Older adults (> 65 yrs) Rural Peri-urban Urban Total Could not specif y 66
70 As shown in Table 21 above, most respondents reported that when food was not enough young children (<5 years) were often served first (40%), 27% reported that they apportioned food equally among household members, while 17% served the male household head first ; there were significant differences in food distribution patterns of households in the three different value-chain domains. A significantly larger proportion of households in rural areas (26%) were more likely to serve the male head of household first while large proportions of child-caregivers in semi-urban and urban areas (41% and 49% respectively) were more likely to serve younger children first. 67
71 Household Food Acquisition and Consumption Patterns For healthy individuals, an adequate diet is basically one that is comprised of adequate amounts of grains, cereals, and carbohydrate-rich roots and tubers; protein-rich pulses and nuts plus animal-source foods; fruits and vegetables; and sufficient amounts of fats, oils and sweets (9, 11, 21). Nutrient adequacy (nutrition security) is attained when individuals adhere to diets that have adequate amounts of food from across and within these individual food groups. Table 22 shows the types of foods which were consumed by the households surveyed in the seven days preceding the survey. Table 22: Mean number of days households selected foods from specified food group Food group Mean frequency of consumption (days in a week) Hoima Kamuli Lira Masaka Total Grains Tubers and starchy vegetables Pulses, nuts and seeds Meats and poultry Fish Eggs Milk Fruits Vegetables Fats and oils Sweets Miscellaneous Note: All numbers are standardized means. The mean frequencies of food groups consumption indicate that most food groups are not included in the diets daily as recommended (9, 11, 21). These patterns do not support adequate intake of both macronutrients (carbohydrates, protein and fat) and micronutrients (vitamins and


 grains and cereals and (ii) roots, tubers and starchy")
 and this was followed by millet (22%) and sweetpotatoes (18%).")
72 minerals). More details of the selection frequency of individual foods which were included in each food group are shown in Table 35Table 22 in the appendices. Staple food acquisition and consumption patterns The quality of staple foods consumed is a major determinant of household food security and nutrition status. Staple foods are categorized into two major food groups, namely: (i) grains and cereals and (ii) roots, tubers and starchy vegetables. In this survey, the foods considered as the major staple foods varied across the four districts. Cassava was reported by the majority of households in Hoima (42%) and this was followed by millet (22%) and sweetpotatoes (18%). In Kamuli half of the households (50%) reported maize and almost the remaining half (46%) reported sweetpotatoes as their major staple food. Cassava (61%), sweetpotatoes (20%) and maize (15%) were reported as the major staples by most households in Lira while Bananas (31%), maize (31%), and sweetpotatoes (25%) were reported as major staples in Masaka. Hoima Kamuli Lira Masaka
73 The general recommendation is to have a variety of whole grains and cereals and fresh or minimally processed roots, tubers, and starchy vegetables. Based on the staple foods reported above, Hoima households seemed to adhere to a variety of staple foods while Kamuli households had the least diversity in their staple food consumption patterns. Error! Reference source not found. below shows the staple food consumption patterns in the 7 days preceding the survey. Grains and cereals In general, grains are rich in many nutrients and contain fibre and phytochemicals such as phytates that are also beneficial to human health. Whole grains such as millet and sorghum are also important food security crops in Uganda. Of late, there has also been increased production and consumption of rice and wheat products. Overall, the households surveyed reported a lower consumption of grains than was expected. Maize meal Maize meal (commonly referred to as posho in Uganda) was the most commonly consumed grain. More than two thirds (69%) of the households surveyed reported consumption of posho within the last 7 days preceding the survey while only 39% had consumed rice, 14% had used millet and 0.03 % consumed sorghum. The consumption of maize meal was highest in Lira (90%) and lowest in Hoima (51%). Millet and sorghum Although millet is considered an important staple food in northern and western Uganda, in this survey millet was consumed by only about a third of the households in Hoima (29%) and only 5% households in Lira consumed millet in the 7 days preceding the survey. On average millet was consumed 4 days in a week in Hoima which indicates that millet is an important staple food in Hoima. Sorghum is also considered an important staple food in northern, eastern, and southwestern Uganda and is often mixed with millet; but in this survey sorghum was only consumed by two (2) households (0.3%). Wheat and wheat products Figure 38: Major staple foods across survey areas The commonly consumed wheat products in Uganda are pasta, breads, chapatti, mandazi, doughnuts, cakes, and scones. Wheat and wheat products were not as widely consumed as expected. Only a total of 14% of the households surveyed used wheat products; and the majority of wheat consumers were from Masaka survey areas.
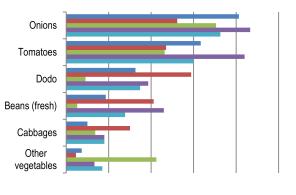
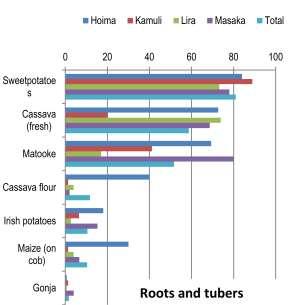
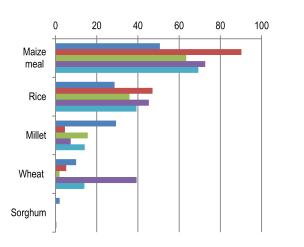
74 Animal-source foods Grains and cereals
75 Roots, tubers and starchy vegetables. Sweetpotatoes, cassava, matooke (vegetable bananas), and yams were the most commonly consumed staples in the roots, tubers, and starchy vegetable food group. Sweetpotatoes Sweetpotatoes were the most widely consumed staple food. On average, 81% of the households consumed sweetpotatoes within the last 7 days preceding the survey. The mean frequency of consumption was 4 days in a week (see Table 34: Household ownership of productive, domestic, and transport assets Type of asset Domestic assets Households with asset (n) Proportion owned by household member (% [n]) Men Women Joint <3yrs 3-7yrs >7yrs <3yrs 3-7yrs >7yrs <3yrs 3-7yrs >7yrs Cooker/ Gas Stove [1] [1] 25.0 [2] 12.5 [1] [3] 8 Refrigerator [2] 6.5 [2] 9.7 [3] 3.2 [1] 19.4 [6] 16.1 [5] 12.9 [4] 6.5 [2] 19.4 [6] 31 Radio [124] 17.8 [90] 8.3 [42] 10.3 [52] 6.1 [31] 3.4 [17] 14 [71] 10.1 [51] 5.5 [28] 506 Television [9] 10.8 [10] 11.8 [11] 9.7 [9] 6.5 [6] 7.5 [7] 11.8 [11] 14.0 [13] 18.3 [17] 93 Mobile phone [201] 19.1 [140] 9.0 [66] 26.5 [194] 11.9 [87] 4.5 [33] 0.95 [7] 0.3 [2] 0.4 [3] 733 Sofa set [19] 10.2 [19] 6.4 [12] 5.3 [10] 7.0 [13] 5.9 [11] 12.8 [24] 17.6 [33] 24.6 [46] 187 Sewing Machine [2] [8] 12.7 [7] 10.9 [6] 21.8 [12] 16.4 [9] 7.3 [4] 12.7 [7] 55 Generator [1] 14.3 [1] [3] 14.3 [1] 14.3 [1] 7 Biogas [1].. 1 Solar panel [17] 10.6 [7] 1.5 [1] 7.6 [5] 3.0 [2] 3.0 [2] 28.8 [19] 16.7[11] 3.0 [2] 66 Transport assets Salon car [5] ] ]. 2 [10] 2 [10.0] 2 [10.0] 0 2 [10.0] 20 Truck [3] 2 [25.0] 3 [37.5] Motorcycle [34] 36 [33.3] 18 [16.7] 4 [3.7] 2 [1.9] 6 [5.6] 4 [3.7] 2 [1.9] 2 [1.9] 108 Bicycle [53] ] 93[22.5] 11 [2.7] 28 [6.8] 39 [9.4] 22 [5.3] 35[8.5] 44 [10.7] 413 Boat Farm assets Hoes (17.4] 198 [10.4] 76 [4.0] 243 [12.8] 155 [8.1] 68 [3.6] 330 [17.4] 400 [21.0] 101 [5.3] 1902 Wheelbarrows [16.0] 15 [16.0] 11 [11.7] 1 [1.1] 11 [11.7] 8 [8.5] 8 [8.5] 16 [17.0] 9 [9.6] 94 Axe [9.8] 52 [14.1] 55 [14.9] 15 [4.1] 31 [8.4] 43 [11.7] 26 [7.1] 53 [14.1] 57 [15.5] 368 Spades/shovel [22.5] 26 [13.6] 17 [8.9] 6 [3.1] 6 [3.1] 2 [1.0] 38 [19.9] 42 [22.0] 11 [5.8] 191 Total assets owned
76 Pangas/machetes [26.3] 49 [9.0] 35 [6.4] 47 [8.7] 34 [6.3] 22 [4.1] 87 [16.0] 92 [16.9] 34 [6.3] 543 Ox-Ploughs 34 5 [14.3] 7 [20.0] 4 [11.4] 0 1 [2.9] 1 [2.9] 4 [11.4] 7 [20.0] 6 [17.1] 35 Sprayer pump [big] [21.1] 16 [14.7] 9 [8.3] 9 [12.6] 6 [5.5] 2 [1.8] 20 [18.3] 14 [12.8] 10 [9.2] 109 Fishing nets 7 3 [37.5] 1 [12.5] 2 [25] 0 2 [25.0]
77 Table 35). Kamuli (89%) had the highest number of households that reported using sweetpotatoes and Hoima (78%) had the least households that used sweetpotatoes. Based on findings from focus group discussions (FGDs), sweetpotatoes have replaced matooke as the staple food in Masaka while in Kamuli sweetpotatoes are often the major staple during the planting season for maize. Cassava Fresh cassava roots were also reported by 59% of the households surveyed. Cassava was reported by many households in Lira (74%) and Hoima (73%); however, in Kamuli cassava was not widely cultivated and was only consumed by 20% of the households in the 7 days preceding the survey. Mean weekly consumption of cassava was 3.4, 2, 3.4, and 3 days in Hoima, Kamuli, Lira, and Masaka respectively. Based on focus group discussions (FGDs), fresh cassava roots and cassava meal are considered famine foods and are consumed only when people have no other option in Kamuli. In Masaka, cassava was also considered a famine food but focus group participants indicated that it was a major staple that cushions them during food shortages (it is a famine crop). In Masaka FGDs, cassava was grouped with other less preferred foods such as pumpkins and yams (bukopa); however, participants indicated that yams (bukopa) were replacing cassava as the major food security crop (commonly used in September through October and February through April) because cassava production was dwindling due to the blight and other diseases. Cassava is important in Hoima and Lira because it is often mixed in millet and sorghum to make stiff millet or stiff sorghum porridge (bread). Matooke The vegetable or cooking banana type (locally called matooke) is a major staple especially in central, southern and western Uganda. In this survey, matooke was consumed by 80% of the participants in Masaka, 69% in Hoima, 41% in Kamuli but by only 17% of households in Lira in the 7 days preceding the survey. On average, bananas were consumed about 3 days in a week (mean = 2.8) and households in Masaka used matooke more frequently (mean = 3.4). Based on focus group discussions, matooke is still the most preferred staple in Masaka; however, matooke now is very expensive because most households now purchase bananas from trucks coming from the western region. Fresh maize-on-the-cob Fresh maize (mature but still green) is also often cooked or roasted on the cob and used as snack (maize-on-the-cob). Maize-on-the cob was used by 10% of the households and the majority of these were in Kamuli and Lira. The average frequency of use of maize-on-the cob was about 5 and 6 days in a week in Kamuli and Lira, respectively. Fresh maize on the cob was hardly reported in Hoima and Masaka because this was a planting season for maize in these areas. Staple food acquisition patterns On average, most households (78%) produced their own staple foods or purchased staple foods using income generated by household members. Very few people relied on remittances, food gifts, and handouts. Error! Reference source not found. below shows the major sources of staple foods.

78 Own production Hoima Purchases - using household own income Kamuli Purchases using remittances Lira Gifts and handouts Masaka Could not specify Figure 40: Proportions of households deriving major staple from specified source Staple food acquisition patterns were significantly linked to place of residence (χ 2 = 69.18, p =.000) whereby the proportion of households that produced their own staple foods was highest in rural areas (94%), slightly reduced in three quarters (78%) in semi-urban areas; and was lowest (49%) in urban areas. The majority of the remaining households reported that they purchase their major staples. For all value-chain domains, only 1% of the households surveyed relied on food gifts and handouts from relatives and friends. Acquisition and consumption of protein-source foods In Uganda, staple foods are major carbohydrate-rich foods and thus are often complemented with a protein-rich food in form of a sauce or relish. The two major categorizations of protein-rich foods are (i) the plant-source foods (which comprise pulses, nuts and seeds) and (ii) the animal source foods (which comprisemeats and poultry; fish; milk; and eggs). The consumption patterns of these foods in shown in Error! Reference source not found. above. In general, the consumption of these foods is lower than consumption of staple foods because access to the protein-rich food is often limited because they are often purchased. Pulses, nuts and seeds Pulses and oil seeds are a major component of the diets of people in Uganda because these foods are often used to make a relish to complement the staple foods. Due to limited use of ASFs, these plant-source protein-rich foods are important in assuring nutrition security. Beans are generally the most commonly consumed pulse in Uganda followed by groundnuts. However, the consumption of pulses, nuts, and seeds was lower than expected. Beans Only a half of the households surveyed (50%) reported consuming dry beans in the 7 days preceding the survey. In general proportion of households that reported bean consumption was high in Lira (79%) and Hoima (72%) and lowest in Kamuli (21%). On average beans were consumed in an average of 5 days in Hoima, 4 days in Kamuli and Lira, and for 3 days in Masaka during the 7 days preceding this survey.
79 Nuts Groundnuts are the main nuts consumed in Uganda. In this survey, 26% of the households reported using groundnut sauce in the 7 days preceding the survey. The proportion of households that consumed groundnut sauce was highest in Masaka (47%) and lowest in Lira (5%). In general, November-December is the planting season for groundnuts and this may explain the limited consumption in Lira (which is a major groundnut producing area). On average, groundnut sauce was consumed in 2 days of the week preceding the survey in all survey areas. Peas Field peas, pigeon peas, and cowpeas are the main types of peas consumed in Uganda. Peas were consumed by only 10% of the households surveyed. Almost one third (31%) of the households in Lira consumed peas during the week preceding the survey and their reported frequency of consumption was 3 days in a week. Only 9% of households in Hoima reported pea consumption with a mean frequency of use of 2 days in the week. There were no reports of pea consumption in Kamuli and Masaka. Oil seeds Simsim (also called sesame) is the major oil seed consumed in Uganda. Overall, a total of 6% of households surveyed reported consumption of simsim. Lira (16%), which is the major producer of simsim, had the highest proportion of households that reported consuming simsim and the mean consumption was 3 days in a week. Consumption of simsim in Hoima was only 4% but these households used simsim for an average of 6 days per week. Only 3% in Kamuli and none of the households in Masaka consumed simsim. Animal-source foods The general dietary recommendation on use of animal-source foods is for healthy individuals to include 2-3 servings of meats (which includes eggs and fish) and 2-4 servings of dairy products (which includes milk, cheese, and yoghurt) in the diet; however, the use of ASFs is often limited in resource constrained households. There were slight variations in consumption of animal source foods across the four districts. In general, the consumption of animal source foods was low. The animal source foods that were consumed by large proportions of the surveyed households were beef, milk, and fish (especially mukene). The proportions of households that consumed ASFs are shown in Error! Reference source not found. above while Error! Reference source not found. and 59 provides details about consumption frequency among household members. Meats Beef was the most commonly consumed ASF and was reported by one third of the households (33%). More households in Hoima (44%) reported using beef while Kamuli had the least households that used beef (23%). Pork was the second commonly consumed meat and was consumed by 15% of the households surveyed. Unlike beef, more households in Masaka (21%) consumed pork but Kamuli (5%) also had the lowest number of households that reported using pork in the 7 days preceding the survey. Goat and sheep meats were consumed by only 3% of households surveyed; and the majority of these consumers were in Lira (6%). For households that reported consuming meats during the 7-day period preceding the survey, the mean frequency of consumption was 2 days in the week for beef and pork, and 1 day for chicken and goat meat. Only 3 households
80 reported using other meats which were mainly comprised of wild animal meat; however, these households used these meats 5 days in the week in Hoima and daily for the household in Kamuli. Fish Participants were asked to report on their consumption of large fish such as tilapia or Nile perch (dried or smoked and fresh) but silver fish (mukene) was singled out in its own category because it is not often reported as fish. Mukene (29%) was the most highly consumed fish product and was mainly reported by households in Kamuli (54%) and least used in Lira (12%). Fresh fish was consumed by 11% while smoked or dried fish was reported by 11% of the households surveyed. More households in Masaka reported the use of fresh fish (25%) and dried or smoked fish (17%), Lira had the least households that reported using both fresh (6%) and dried or smoked (1%) fish. As shown in Error! Reference source not found. above, fish was one of the most frequently consumed ASFs. Most households consumed small dried fish (mostly mukene) at least once in a week and a few households used it on a daily basis. Poultry Chicken is the most commonly consumed poultry product in Uganda; however, in this survey participants were asked to report on whether they consumed chicken or other poultry products such as duck meat and turkey. This survey documented very limited consumption of poultry products. Only 41 (7%) of the 606 households surveyed reported consumption of chicken in the week preceding the survey. Lira (9%) reported the highest chicken consumption while Kamuli (4%) reported the least consumption. Most households consumed chicken about once in a month to once in three months (see Error! Reference source not found. and Figure 59). An investigation by Higenyi and colleagues (22) also reported limited frequency of consumption of poultry products in eastern Uganda. Chicken was also the most frequently consumed poultry product with an average consumption frequency of one to two times in a month (22). Eggs Chicken eggs are the most commonly available type of eggs on the Ugandan market and one of the cheapest ASF; however, consumption of eggs was very low among the survey participants. Only 12% of the households reported consuming eggs in the 7 days preceding the survey and the majority were from Masaka (21%). Although households in Lira reported ownership of the highest number of birds per household (median = 7 birds); only 3.3% of the households in Lira consumed eggs. Dairy products Milk is the most commonly available and frequently consumed dairy product in Uganda; however, only 32% of the households reported using milk in the 7 days preceding this survey. The proportion of households that reported consumption of milk was highest in Kamuli (44%) and these households used milk for an average of 5 days in the week preceding the survey. Milk was consumed by 42% of the households in Masaka for an average of 5 days in a week, 30% in Hoima for an average of 3 days, and 10% in Lira for an average of 6 days in the week. The high frequency of milk consumption in Lira is most likely related to the high smallholder ownership of local cattle.
81 Fruits and vegetables consumption patterns In Uganda, vegetables are often used as relish and side dishes while fruits are major snack foods; hence fruits and vegetables are a major component of the diets. Vegetables About 80% of the households surveyed reported consuming at least one vegetable within the 7 days preceding the survey. The most commonly consumed vegetables were tomatoes, onions, dodo, and fresh beans. Tomatoes and onions The vegetables that were widely consumed were onions (73%) and tomatoes (60%); however, both tomatoes and onions are commonly used as spices in Uganda and are not often consumed in adequate amounts to be qualified as servings of vegetables. The mean frequency of use of tomatoes and onions was 6 days for each. Amaranth leaves (dodo) Both green amaranth (dodo) and purple amaranth (also called buga or dodo) are commonly consumed in Uganda. A total of 35% of the households surveyed reported consumption of amaranth leaves with a mean frequency of use of 3 days in the week preceding the survey. The highest proportion of households that reported consumption of dodo were in Kamuli (59%) while Lira had the lowest proportion (9%). Beans (fresh) Fresh bean at different levels of maturity are often used as a relish in Uganda. In this survey 28% of the households had used fresh beans in the week preceding the survey (mean frequency = 4 days). Beans were consumed by a large proportion of participants in Masaka (46%) and used by very few households in Lira (5%). Based on focus group discussions, in Lira it is not a common practice to consume fresh beans because most people believe that this is wasting of the beans. Hence, even though many households had fresh beans that were ripening in the field at the time of the survey, many were not consuming these beans because they were waiting for the beans to dry first. Cabbage The green cabbage is the most widely available vegetable in Uganda; however only 18% of the surveyed households consumed cabbages in the week preceding the survey. The largest proportion of households that consumed cabbages were in Kamuli (30%; mean frequency of use = 3 days) and Hoima had the lowest proportion (10%; mean frequency of use = 3 days). Other vegetables The other vegetables which were widely consumed included pumpkin leaves, cowpea leaves, eggplants, and mushrooms. The largest proportion of households that reported consumption of these vegetables were in Lira (42%) and these households mostly consumed cowpea leaves. Pumpkin leaves were mostly reported in Hoima while eggplants were reported in Masaka and Lira.
82 Fruit consumption In general, fruit consumption was very low. Only about a third of the households reported consumption of fruit within the last 7 days preceding the survey. The variety of fruits was also limited. Oranges, tangerine, bananas, passion fruit, and papaya were the most widely consumed fruits. Citrus fruits About one fifth (19%) of the households had consumed citrus fruit for an average of 5 days in the week preceding the survey. Citrus fruit was most widely consumed in Lira (38%) and Kamuli (29%) and least consumed by respondents in Hoima (3%). In general, oranges were the most frequently used citrus fruit in Lira while households in Kamuli consumed both oranges and tangarines. Dessert bananas Dessert bananas commonly used in Uganda are apple bananas and bogoya (mostly Cavendish and Gros micheal). Overall, only 9% households reported consumption of dessert bananas (mean frequency = 3.4 days) in the week preceding the survey. Dessert bananas were majorly consumed by respondents from Hoima (13%; mean frequency = 4 days) and Masaka (15%; mean frequency = 4 days). The limited consumption of bananas could also be attributed to limited availability (were off season). Passion fruit Passion fruit is often one of the commonly used fruit for juice in Uganda. In this survey, only 8% of the surveyed households had used passion fruit in the week preceding the survey (mean frequency of use = 3 days). A larger proportion of households that consumed passion fruit were in Masaka (21%; mean frequency = 3 days). Mangoes Mangoes were out of season at the time of the survey and thus were reported by only one household in Masaka. Other fruits Other fruits consumed included pineapples, apples, guavas, lemons, pawpaws (papaya), and avocado, and jack fruit (which is commonly called Fene in Uganda). The mean frequency of use of these fruits was 2 days in Hoima, Kamuli, and Masaka and 7 days (daily) in Lira. Beverages and alcoholic drinks In general beverages improve food security by improving fluid and caloric intake. Respondents in this survey were asked to report on their use of tea, coffee, sodas, and beer or other alcoholic drinks.. Figure 41 below shows the pattern of beverage consumption and detail on frequency of consumption are provided in the appendices.
 and Masaka (83%) had the highest number of households that had used tea while Lira (52%) had the lowest tea consuming households.")
83 Beverages Fats, oils & sweets Tea Tea was the most widely consumed beverage. A total of 74% of the households reported using tea for an average of 6 days in the week preceding the survey. Hoima (85%) and Masaka (83%) had the highest number of households that had used tea while Lira (52%) had the lowest tea consuming households. One household reported using roasted soybean powder as a substitute for tea leaves. Coffee Figure 41: Consumption of beverages, fats, oils, and sweetners Coffee consumption was much lower than expected. A total of only 22 households (4%) reported using coffee. Masaka (7%) had the highest proportion of households that reported consuming coffee and on average these households used coffee daily. Alcoholic drinks Due to the high energy value and being a risk factor for chronic diseases, alcohol consumption is considered a risky health behavior; individuals are advised to limit consumption of alcohol. Alcohol consumption was reported in only 25 (4%) of the households surveyed and the mean frequency of alcohol use was 3 days in the week preceding the survey. The proportion of households using alcohol were lowest in Lira and Kamuli; but Kamuli reported the highest frequency of use (Mean freq = 5.5 days) while Masaka had the highest proportion of alcohol consumption (8%) but the lowest frequency of use (mean = 2.2 days). Carbonated drinks (soda) Frequent consumption of carbonated beverages (mostly sodas) is associated with an increased risk of overweight and obesity; and thus frequent use of sodas is considered a risky behavior. In this survey only 7% of the households reported consumption of sodas. Masaka (14%) and Hoima (9%) had the largest proportion of households that used sodas. The mean frequency of consumption was 2 days for all three survey areas and 1 day in Kamuli.
84 Consumption of Fats, Oils, and Sweets Fats, oils, and sweets make a big contribution to total dietary intake because they are a condensed form of energy. These foods are very important in meeting energy needs especially when food quantity is limited. However, too much consumption of fats, oils and sweets can be dangerous because these food components increase the risk of chronic diseases such as heart disease, diabetes mellitus and cancers. Cooking oil There are many types of cooking oils available on the market but the most commonly available are composed of a mixture of refined palm oil, soybean oil, and sunflower oil. The recommendation is to limit the use of oil since it is associated with increased risk of overweight and obesity and chronic disease as outline above. In this survey, cooking oil was consumed by an average of 74% and the most of these consumers were from Lira (84%; mean freq = 5.7 days in a week) and Hoima (82%; mean freq = 5.6 days in a week). Some households also reported the use of lards such as Kimbo, Tamu, and Cowboy brands. Butter and margarine In Uganda butter and margarine are often used as spread on bread. In this survey, 3% of the households reported using butter or margarine; and many of these households were from Masaka (5%) and Hoima (6%) survey areas. None of the households in Kamuli and Lira reported use of butter or margarine. Sugar A total of 73% of the households surveyed reported consumption of sugar for an average of 6 days in the week preceding the survey. The number of households that consumed sugar was higher in Masaka (89) and Kamuli (79%) and lower in Hoima (56%) and Kamuli (68%). Discussion and recommendations In line with the CRP3.7 target of enabling poor women, children and other vulnerable groups to increase their consumption of animal source foods; this survey was designed to provide desegregated data on food consumption among children, women, men, and older adults in order to identify gaps in food access and use. The results of this survey show that the dietary patterns of the majority of households are poor. Like other developing contexts, the diets were high in carbohydrate-rich staple roots and starchy vegetables (sweetpotatoes, cassava, and matooke), low in whole grains (main grains were maize meal and rice), low in good quality protein sources, and low in fruits and vegetables. Despite the fact that the survey was conducted in the planting season for beans and groundnuts, plant source proteins (dry beans and groundnut sauce) were consumed by more households than ASFs. The reported frequency of consumption of all ASFs was also very low among all household members (including men). In general, many households consumed ASF about once in a month. This is way below the recommendation of at least two servings of meat, fish, poultry, and eggs food group. Overall, with the exception of milk, the results of this survey show that there are no statistically significant differences in the frequency of use of animal source foods among across gender groups and survey areas. Milk consumption was higher among children.
85 Given the observed food consumption patterns, there is need to sensitize the public about the importance of including foods from all food groups into their diets. A special focus needs to be placed on increasing the frequency of consumption of animal source foods among all household members. Inclusion of animal source foods will fill the gaps in fat consumption as it also contributes to reducing the gaps in good quality protein (of high biological value) and essential micronutrients which are often lacking in diets of the majority of people in Uganda.
86 Patterns in acquisition and consumption of pork products Since this survey partly focused on improving knowledge of pork consumption patterns, detailed data was collected on access and use of different pork products. Of the 606 participants included in the survey, 63% (380) indicated that pork was utilized in their households. Pork consumption was reported among 79% (119) households in Hoima, 46% (70) from Kamuli, 54% (82) from Lira, and 73% (109) of respondents from Masaka. Table 23 below shows the proportions of households which reported utilizing the different pork products. Table 23: Proportion of households consuming different pork products Survey district Pork products consumed Hoima (n=119) Kamuli (n=70) Lira (n=82) Masaka (n=109) Total (n=380) Muscle meats: Fried or stewed pork Roasted pork (muchomo) Cartilagous products: Feet (Mulokonyi) Ears Snout/mouth 26, Organ meats: Liver Heart Tongue Kidneys Spleen Tripe (intestines) Processed products: Sausages Chipolatas (weaner sausages) Bacon Ham Salami Other products Blood In general, fresh pork muscle products were more commonly consumed than organ meats and processed pork products such as sausages. The muscle meats reported by the majority of respondents were fried or stewed pork (96%), roasted or smoked pork (52%), stewed pig legs (28%) and fried or roasted liver (23%).
87 Muscle meats Fried or stewed pork In Uganda, pork is commonly fried with tomatoes and onions to make a snack (muchomo) in food vending places such as bars, pork joints, and on streets. At household level this type of muchomo is also the most common; however, some people add small amounts of water to the fried pork to make stew. Hence, it is not surprising that fried and stewed pork were the most commonly consumed pork products. Factors that limit consumption of fried or stewed pork Overall, fried or stewed pork was not consumed in only 15 out of the 380 (5%) households that consume pork products. The main reason for not consuming fried or stewed pork was just nonspecific dislike among the majority of the households. Other reasons were undesirable smell and undesirable taste. Only one household reported lack of availability as a reason for not consuming fried or stewed pork while another reported lacking knowledge of how to prepare the pork. Intra-household consumption of fried or stewed pork All household members seem to have access to fried and stewed pork; however, men and children, plus the non-lactating and non-breastfeeding women were more reported. None of the households reported consumption of stewed or fried pork products among pregnant women in Lira and Masaka %Household members using Children Men Pregnant women Lactating mothers NPNL women Hoima [86] Kamuli [27] Lira [25] Masaka [49] Total [187] Figure 42: Intra-household use of fried or stewed pork Major sources of fried or stewed pork Overall, the major source of pork which was or was to be used to make fried or stewed pork was the butcheries (83.3%). The remaining households majorly obtain fried or stewed pork from neighbourhood slaughters (5.8%), roadside vendors (5.5%), pork joints or restaurants (3.3%) and only 2.2% sources from own slaughters. Details on the acquisition patterns of unprocessed pork products across the four survey areas are shown in Error! Reference source not found. below.
88 Own slaughter Neighborhood slaughters Butchery Roadside vendors Pork joint/restaurant Supermarket Roasted pork (N=188) Fried pork (N=365) Legs (N=106) Ears (N=69) Snout (N=36) %Households Figure 43: Major sources of processed pork products Roasted pork Despite the general belief that most pork consumers use muchomo (roasted pork), about a half of the households surveyed reported not consuming roasted pork. Factors that limit consumption of roasted pork Figure 44 provides an overview of the factors that limit the surveyed households consumption of pork. In general, there were different reasons given across the four districts for not consuming various pork products; however, income and general dislike were the main reasons given by households as major reason why they do not eat roasted pork. Of the 192 participants that reported not consuming roasted pork (commonly known as muchomo in Uganda), 41% were limited by income, 33% dislike pork; 8% indicated that it was not available, while the 5% attributed their inability to consume roasted pork to their concerns about the safety of the meat. As shown in Figure 44 below, there were some differences in the limitations to roasted pork consumption across the survey areas. Notably, the main reason for not eating pork in Hoima (47%) and Kamuli was the mere dislike for the product; while income was reported to prohibit consumption of roasted pork in Lira (46%) and Masaka (53%). Hence, there is need for behavior change interventions to increase acceptability of pork in Hoima and Kamuli while merely increasing production and accessibility of pork may improve consumption in Masaka and Lira.


89 Figure 44: Reasons for not consuming roasted pork Kamuli
90 % Consume pork Other reasons given for not consuming roasted pork included: - Not having enough time to prepare it (roast pork) - Households buy little roasted pork or the amount bought is never enough for the family, hence household members decide to forego buying the product. - Roasted pork meat is believed to contain more fat - The product is expensive - It is often not fully prepared - Smoking (meaning roasting) drains out the fat, which makes the meat dry. The perception of lack of time to prepare roasted pork may be stemming from the concern for pork safety and not having access to roasters that can save both fuel and time. Intra-household consumption of roasted pork In the majority of households surveyed, roasted pork products were consumed by all household members; however, larger proportions of men were reported to consume pork products in Hoima, Masaka, and Lira. It is only in Kamuli where a slightly larger proportion of non-pregnant and nonlactating women were reported to consume roasted pork. Children Men Pregnant women Lactating mothers NPNL women Hoima [86] Kamuli [27] Lira [25] Masaka [49] Total [187] Figure 45: Proportion of households where men, women, and children consume roasted pork Major sources of roasted pork Overall, 74% of the 187 households that consume roasted pork purchased it from butcheries, 16% from pork joints or restaurants, 5% from roadside vendors. Very few households accessed roasted pork from own slaughters (2%) and neighbourhood slaughters (2%). Only 0.5% of the total households surveyed purchased roasted pork from supermarkets. Lira households reported accessing roasted pork from a variety of sources. Most households in Lira (40%) obtained roasted pork from pork joints or restaurants and only 20% of the households reported sourcing roasted pork from butcheries. The remaining households majorly obtained roasted pork from roadside vendors (20%), neighbourhood slaughters (12%), and from own slaughters (8%).
91 Cartilaginous pork products In general there is a preference for cartilaginous meat products in Uganda because these meats are believed to improve the health of bones and joints. The commonly consumed cartilaginous meat products in Uganda include pig ears, snout, and legs. Pig legs (Emulokony) About a quarter of the survey participants reported that at least one of their household members eats pig legs, which are also commonly known as Emulokony in Uganda. The consumption of pig legs was highest in Hoima (48%) and lowest in Kamuli (6%). Factors that limited consumption of pig legs Figure 40 below provides factors that influenced the use of pig legs among survey participants. The main reason for not consuming pig legs was general dislike for the product (64%), limited income (12%), and undesirable smell (6%). Other, 3.3 Cultural / traditional beliefs, 1.6 2% Hoima Income 3% 7% 5% 3% 2% Cultural/traditional beliefs Safety Taste 74% Smell Do not like
92 Does not know the product, 1.5 Not available, 6.1 Income, 13.6 Cultural/beliefs, 1.5 Safety, 1.5 Taste, 9.1 Smell, 4.5 Do not like, 62.1 Does not know the product, 4.7 Not available, 1.6 Other, 1.6 Income, 12.5 Cultural/tra ditional beliefs, 6.2 Taste, 1.6 Smell, 7.8 Do not like, 64.1 Does not know the product 3.7 Not available 2.4 Other 2.4 Income 15.9 Cultural/tra ditional beliefs 2.4 Safety 2.4 Taste 4.9 Do not like 57.3 Smell 8.5 Figure 40: Reasons for not consuming pig legs (mulokonyi)
93 Among the 109 households that reported consuming pig legs, the majority (n=57) were from Hoima; and most of these households (67%) consumed pig legs on a monthly basis. Masaka had the highest proportion of participants that consume pig legs more frequently. Notably, about a third of the households in Masaka (37%) reported consuming pig legs at least once in a week while 33% use legs monthly (see Figure. Respondents from Kamuli also consumed pig legs less frequently (39% use product on monthly basis). In general, the consumption patterns for pig legs (emulokony) are similar to the pattern of consumption of other pork muscle products. Major sources of pig legs (emulokony) A total of 80% of the households that consumed pig legs sourced them from the butcheries. Other important sources were the neighbourhood slaughters (9%), roadside vendors (6%), pork joints or restaurants (3%), and only 2% relied on the household s own slaughters. The only survey area that had a varied pig leg acquisition patterns was Lira where only 28% of households that consume pig legs obtained them from butcheries. The majority (50%) of households in Lira obtained pig legs from neighbourhood slaughters and the remainder got them from roadside vendors (11%), pork joints or restaurants (5.6%), and from the households own slaughters (6%). Pig ears Generally animal ears are considered trash meat in Uganda and thus are often sold or used as animal food. Pig ears are an exception because they are a delicacy among those that mostly consume pork muchomo as a snack. In this study pig ears were consumed by only 18% of the people that consume pork. Hoima had the highest proportion (33%) of households that reported consumption of pig ears. Factors that limited consumption of pig ears The majority of participants (75%) were not consuming pig ears because they dislike this product and this was followed limited income (6%), taste preferences (5%) and by concerns about the safety of the ear products (3%). Only 3% of the 380 households that consume pork products reported that pig ears were not available to them. Figure 41 below shows the different reasons given for not consuming pig ears. Do not like Safety Taste Smell Income Cultural/ traditional beliefs Hoima (79) Kamuli (67) Lira (75) Masaka (89) Total (310) Figure 41: Reasons for not consuming pig ears
94 Intra-household use of pig ears There are differences in intra-household pig ear consumption patterns across the four survey areas; however, the majority of households that consume ears reported that ears were mostly consumed by children and men. It is only in Hoima where some participants reported that all household members consumed pig ears. Frequency of consumption of pig ears Although Hoima reported more people consuming pig ears, the frequency of pig ear consumption was very low. In Hoima consumption was on a monthly basis for 59% of respondents and only 13% consumed them weekly. Masaka had fewer households using pig ears but had a higher frequency of consumption. A total of 8 (40%) of the pork consumers in Masaka consumed pig ears at least once in a week. Major sources of pig ears A total of 91% of the households that consume pig ears obtained them from butcheries. Other major sources of pig ears for survey participants were neighbourhood slaughters (4%), own household slaughters (3%), and roadside vendors (1%). Lira had a significantly higher proportion of households that obtained pig ears from neighbourhood butcheries (14%) and own household slaughters (14%). Snout The snout is often preferred because of its crunchy texture. In this study only 10% (n=37) households reported that they consume pig snouts. The majority of these households obtained the snouts from the butcheries (97%) and the few remaining households (3%) obtained snouts when a pig was slaughtered in the household. Blood Bovine blood is used in the food industry as a natural colour enhancer, binding agent, emulsifier, and a fat replacer(23). Bovine blood can also be used to improve the nutrient density of commonly used foods so as to combat micronutrient deficiencies (23-25). Although many cultural groups in Uganda bleed live cattle and consume the blood, the blood obtained from animals during slaughter is often considered as a trash by-product and hence is often sold for animal feed. In this survey, the use of pig blood for human consumption was reported by only six (6) households in Hoima and all reported sourcing the blood from the butcheries. There were no differences in usage of blood across gender groups. Figure 42 below shows the reasons for not consuming blood.
95 100% 90% 80% 70% 60% 50% 40% 30% 20% 10% 0% Hoima [111] Kamuli [70] Lira [82] 7 Masaka [109] Total [372] Religious affiliation Income Other Not available Smell Taste Safety Does not know the product Cultural/traditional beliefs Do not like Figure 42: Reasons for not consuming pig blood General dislike for blood was the major reason for low consumption of blood. Unlike for other products, cultural or traditional beliefs were also a major deterrent for blood consumption in 17% of the households. About 5% of the households were not aware that blood can be consumed, another 5% were concerned about its safety, and 5% had religious beliefs that were against blood use. Overall, beliefs accounted for 22% of the households inability to use blood for human consumption, which suggests that these people are less likely to include pig blood in the diets. However, blood can be used to make novel food products such as salami which should be more appealing to consumers and would add value to the product. Acquisition and Consumption of Organ Meats In general, organ meats are considered trash meats in developed countries but these meats constitute a cheap source of animal protein for the majority of low income populations. Organ meats are often promoted as a major source of nutrients; however, improper handling and processing of organ meats can pose a great risk of acquiring helminthes infection and other diseases. Because of these safety concerns, organ meats of some animals such as pork are not as highly consumed as the muscle meats. Pig tripe Pig tripe or intestines are also commonly called chitterlings, chittlins, or chitlins and are a common soul food consumed in southern United States and Europe. In Uganda, there is very limited use of pig intestines due to concerns for safety. Hence these intestines are often buried or used as dog food. In this survey, tripe use was reported by only one 7 household in Lira district and this was obtained when the household slaughters its own pigs. The main reasons for not including pig tripe in the surveyed households diets were general dislike (53%), due to cultural or traditional beliefs (21%), undesirable smell (13%), and not knowing how to use tripe (4%). Only 3% of the households 7 Note: There were anecdotal reports of a respondent that consumes tripe in* Kamuli but this was not reflected in the data.
96 were concerned about the safety of tripe. Hence, production of more desirable processed products from tripe can improve its use. Pig liver In general, beef and goat liver are among the most popular meats in Uganda; and these are prime products sold at higher prices. Pig liver was also the most consumed pig organ meat in this survey. A total of 87 out of the 380 households (23%) reported that they consume pork liver; and liver was reported to be consumed by all household members. Intra-household consumption of pig liver Pig liver consumption patterns seem to follow the pattern of consumption of other muscle meats. Overall, pig liver seems to be consumed by all household members. Children Men Pregnant women Lactating women NPNL women Others Hoima [40] Kamuli [8] Lira [8] Masaka [31] Total [87] Figure 43: Intra-household consumption of pig liver As shown in the diagram above, pig liver was mostly consumed by people categorized in the other category; who include older adults and/or a combination of household members (all). Men and children also seem to dominate liver consumption in Hoima, Lira, and Masaka; while children were the major pig liver consumers in Kamuli. Major source of liver Butcheries constituted the major source of pig liver. Households in Lira also reported roadside vendors, neighbourhood slaughter, and own household slaughters as the major source of pig liver (see Figure 44 below).
97 Own slaughter Neighborhood slaughters Butchery Roadside vendors Pork joint/restaurant Supermarket Abbatoir Liver Heart Spleen Kidney Figure 44: Proportion of households obtaining pig organ meats from specified sources Heart, Kidney, and Spleen In general, Hoima and Masaka reported the highest consumption of pig organ meats. The liver, heart, and kidney meats were mostly purchased from butcheries while the spleen was mostly obtained from neighbourhood pig slaughter houses. Roadside vendors were also a major source of organ meats while hardly any organ meats were acquired from the supermarkets. Factors limiting consumption of organ meats The majority of households that did not consume pig heart, kidney, and spleen indicated that they just did not like these products. A few households were limited by income and concerns over safety. Figure 45 below shows households justifications for not consuming kidney meat; however, it should be noted that about similar reasons were given for not consuming heart and spleen. 100% 90% 80% 70% 60% 50% 40% 30% 20% 10% 0% % Repondents Hoima [85] Kamuli [65] 86 3 Lira [76] Masaka [95] Total [321] Other Not available Does not know the product Do not like Smell Taste Safety Cultural/traditional beliefs Income Figure 45: Reasons for not consuming pig kidney meat
98 A total of 62% pork consumers did not consume heart meats because they disliked it and only 3% were worried about the product safety. About two thirds (68%) also had a general dislike for the spleen. In general, organ meats were considered inferior and thus were not consumed by households surveyed. Small proportions of households were not aware than these organ meats can be consumed by humans. Processed pork products Sausages In general, the consumption of sausages was very low among the survey participants. Only 31 (8%) of the 380 households that use pork reported consuming sausages. Factors limiting sausage consumption In general, about two thirds (63%) of the households did not consume sausages because they did not know them; 13 % were not able to access sausages because they are not available in their areas and only 10% were limited by income. Overall, only about 12% of the survey participants reported dislike for sausages, notably: 11% reported that they merely dislike sausages; 1% disliked their taste, and 0.3% were worried about the safety of sausages. Details on reasons given in the different survey areas are summarized in Figure 46 below. 100% 80% Income Taste Does not know the product 7 20 Safety Do not like Not available % 40% 20% 0% % Respondents Hoima [105] Kamuli [69] Lira [75] Masaka [99] Total [348] Figure 46: Reasons for not consuming sausages Intra-household consumption of pork sausages Figure 4747 shows the consumption of sausages in the households across gender groups and by life stage (among women). In general, sausages were used by men, women, and children in the majority of households - the only difference across survey areas were the proportions of household members. In Masaka, women, men, and children seem to have equal access to sausages. In Hoima and Lira, slightly higher proportions of men were consuming the sausages and women constituted the lowest proportions of sausage consumers.
99 Children Men Lactating women NPNL women % Households Hoima [13] Lira [7] Masaka [10] Total [31] Major sources of pork sausages Figure 4747: Intra-household use of sausages Overall, 61% of the sausage consumers obtained their supplies from supermarkets, 19% from pork joints or restaurants, 13% from butcheries, and the other sources included roadside vendors and abattoirs. Chipolatas Out of the 380 households that consume pork products, only a total of 5 households (0.2%) reported ever consuming chipolatas. Three of these households were in Hoima, one was in Lira and one in Masaka. In general, the frequency of consumption of chipolatas amongst these 5 households was also very low (consumed less than once in a month) and these households majorly obtained chipolatas from the supermarkets; and were all from peri-urban and urban areas. Factors limiting consumption of chipolatas The majority of households (85%) reported not knowing chipolatas as the main reason why they did not consume the product; 5% indicated that the product was not available to them, and 4% were limited by income. Only 5% did not like chipolatas. At the survey site (district) level, the other highly cited limiting factors specific were income among 10% of the households in Hoima and limited availability among 14% in Kamuli, and 12% of the households in Lira had a general dislike for chipolatas.figure 48 below shows details of factors that influenced the non-consumption of chipolatas in the four survey areas.
100 Does not know the product Not available Do not like Income Taste Cultural/ traditional beliefs 100% 90% 80% 70% 60% 50% 40% 30% 20% 10% 0% %Respondents Safety Hoima [ Kamuli Lira Masaka Total 5 Figure 48: Household's reasons for not consuming chipolatas All households that reported using chipolatas were in peri-urban and urban areas. Bacon Bacon was reported by only 4 out of the 380 households that consume pork. These households were in Hoima and Masaka. Two of the households were in rural areas, one in peri-urban and the fourth in urban setting. All households obtained bacon from supermarkets. 100% 80% 60% 40% 20% 0% %Respondents Hoima [117] Kamuli [70] Lira [79] Masaka [109] Total [375] Does not know the product Not available Do not like Smell Taste Safety Cultural/traditional beliefs Income Salami Figure 49: Reasons for not consuming bacon Salami was reported by only two out of the 380 households that consume pork products; and these households reported that they had obtained the salami from the supermarkets. The majority of households (86%) did not use salami because they do not know the product, 5% could not access salami, while 5% do not like it. This shows that there is a potential market for salami
101 100% 80% Other Not available 60% 40% 20% 0% %Respondents 86 Hoima [117] 81 Kamuli [70] 77 Lira [82] 92 Masaka [109] 86 Total [378] Do not like Smell Safety Income Does not know the product Ham Figure 50: Reasons for not consuming salami Ham was reported by only one household from Hoima municipality. The ham had been obtained from the supermarket and was consumed by a pregnant woman. As shown in Figure 51 below, the majority of the households (86%) did not know what ham is and hence could not consume it. The other reasons for not consuming ham were lack of availability (5%), general dislike (5%) and limited income (3%) among households that knew what ham is. 100% Not available 80% 60% 40% Does not know the product Do not like Smell Safety 20% Income 0% 1 Hoima [117] 3 Kamuli [70] Lira [82] 5 Masaka [108] Total [377] Figure 51: Reasons for not consuming ham Overall, the consumption of processed pork products was very low. The main reason why processed pork products were not consumed was that potential consumers were not knowledgeable of or had not yet been introduced to the product.
102 Conclusions and recommendations In general, the consumption of pork products was lower than expected; however, it is important to note that the consumption of other animal source foods was also generally low. On average most households consumed pork products on a monthly basis, and this pattern was also observed for beef (which is the most commonly consumed meat). The pattern in pork consumption was also not very different across the value-chain domains, which indicates that limited pork consumption is a general problem in the survey areas. Hence, there is need for interventions to improve the inclusion of pork in household diets. Overall, unprocessed pork products (muscle meats, cartilaginous meats, and organ meats) were the most consumed pork products. Most survey participants were unfamiliar with processed products such as salami, chipolatas, bacon, and ham because these products are not available to them. The limited availability of these processed products reflects the low level of processing of pork in Uganda. The unprocessed pork products were mostly purchased from local butcheries and neighbourhood slaughters; and this also reflects the limited value addition to fresh pork products. Hence, there is need for interventions to improve accessibility to quality pork products. To ensure access to safe pork products, there is also need to popularize the sale and purchase of unprocessed pork products from supermarkets or mobile vendors that can maintain the cold chain. This is especially important to the consumers that are worried about the safety of pork. Overall, the consumption of processed pork products was very limited. The most commonly consumed processed pork product was sausages; however, only five (5) households reported consumption of sausages. Ham, salami, bacon, and chipolatas were all not known among most of the surveyed households. There is need to improve awareness of these products and improving their availability through local supermarkets or local suppliers that can maintain the cold chain. However, there is also need to characterize consumer preferences for processed pork products in Uganda. There is need to identify the types of processed pork products consumers want; the textures and flavours that are desired; and consumers perceptions about the safety of the different pork products. Given the limited use of electricity and limited ownership of refrigerators at household level (refer to Section 0), it may also be important to investigate the use of more shelf stable pork products that can be kept at room temperature. This will not only improve the access to safe pork products, but will also ensure more stability of the supply of pork products and consequently widen the market of both pigs and the processed products. Although the proportion of households that did not consume the different pork products due to concerns for safety were low, it is important to investigate these concerns in order to develop appropriate interventions or communication to address them. Due to the reported high incidence of disease in pig production systems, and documentation of incidence of some of these diseases in Uganda (26), there is need for communication of potential food-borne diseases (plus possible zoonotic diseases) which are associated with pork production systems. This is not only an important public health intervention but also a strategy to improve consumers confidence about the safety of pork products.
103 Dietary intake and nutritional status of household members The over-arching goal of the MorePORK project, and indeed the CRP3.7 project, is to improve food and nutrition security through improved incomes among pig farmers and through direct use of pig products. Hence, this survey was designed to provide baseline data on the nutritional status of the households prioritized for the pig value-chain study. This chapter provides a summary of the nutritional status of men, women and children onto which this project s outcomes will be benchmarked. Characteristics of the nutrition survey participants The nutrition survey component targeted households with children less than five years of age. Since the main objective of the survey was to assess intra-household food use patterns, only households with children that were eligible to be fed on solid foods (children 6-59 months) were included in this survey. The survey was designed to obtain anthropometric and dietary data from triads of child, the primary female child-caregiver, and the adult male in the household; hence, the nutrition component of this survey covered 286 children (6-59 months), 276 women 8, and 191 men. The results of the assessments are detailed below. Overview of the nutritional status of household members Based on BMI categorization, the prevalence of both undernutrition (low weight for height) and overweight and obesity varied among men, women and children. Higher proportions of women were overweight or obese whereas higher proportions of children and men were underweight. Table 24 below provides details on prevalence of undernutrition and overnutrition among men, women, and children. Overall, the prevalence of undernutrition was 17% among children, 10% among men, and 4.6% among women. A higher proportion of children were severely undernourished (10.7% versus 0.4% women and 1.1% men) while a higher proportion of men were moderately undernourished (8.9% compared with 4.1% women and 6.3% children). A significantly higher proportion of women were overweight (25.4% versus 8.9% men and 9.3% children) and more women were obese than men (6.6% versus 1.7% for men). 8 Note that in collecting child data we interviewed primary child-caregivers [men (16-65 years) and women (14-65 years)] for the targeted children; however, anthropometric measures and dietary data for men and women was collected from women years and men years, respectively.
104 Survey area District: Table 24: Nutritional status of household members based on body mass index (BMI) Proportion of household members with BMI within specified category % Severely undernourished (BMI <16 ) Men Wome Children* [2] n [1] [29] %Moderately undernourished (BMI = ) Men Women Children [16] [10] * [17] %Healthy (BMI= ) Overweight (BMI= ) Obese (BM1 30) Men [142] Hoima NA Kamuli NA Lira NA Masaka NA VC domain: Rural NA Peri-urban NA Urban NA Total NA Pregnant women were excluded from anthropometric assessments. Women [152] Children * [199] Men [16] Women [61] *Children are categorized by BMI-for-age z score: <-3 =severe;-3 2 SD = moderate; -2-3 = health; 3-5 = at risk for overweight. Children * [25] Me n [3] Women [16] Children
105 Dietary intake and nutritional status of men years old A total of 202 men of years of age were interviewed but only 169 who were between years of age (mean = 33.2 ± 7.5 years) at the time of the survey were included in dietary and anthropometric assessments. The majority of men (80.2%) were the heads of households and where the household head could not be assessed other adult males such as older children and siblings of household heads were assessed. For women-headed households, any adult male that resides in home and was within 16 to 19 years of age was assessed. Nutritional status of men The majority of males (79.3%) had BMI within normal range of kg/m 2. The mean BMI for men was 21.7 kg/m 2 (SD = 4.6); however it was slightly higher for men in Hoima survey sites (Mean = 22.2 ± 4.3) and those in peri-urban areas (Mean = 22.2 ± 4.8); but there were no statistically significant differences across the survey sites. Details on men s nutritional status are provided in Table 24 and Table 25. Dietary intake among men Dietary intake is reported for a total of 176 men that completed the interactive 24-hour recall. Overall, the diets of men had limited levels of protein and fat and high amounts of dietary fibre. Total caloric intake The average total caloric intake among men in urban areas was 529 kcals higher than for men in rural areas (p = 0.009). There were also significant differences in the total caloric intake among men across the survey districts. On average men in Hoima consumed 800 kcals more than men in Kamuli (p = 0.000), 561 kcals than those in Lira (p = 0.014), and 736 kcals more than men in Masaka (p = 0.001). Similar to the pattern observed in women s dietary intake, the inclusion of ASFs did not significantly influence total caloric intake but determined the proportion of calories protein, carbohydrate, and fat. The mean proportion of calories from ASFs among men that consumed ASFs was 15.0% (95%CI: %) and there were no significant differences among men across the survey districts and value-chain domains.
106 Characteristics of respondents Mean age (years) ±SD [Min-Max] Position in household Household head 135 n Table 25: General characteristics and nutritional status of men included in the survey ±12.2 [19-77] Proportion (%) of men included in survey Hoima Kamuli Lira [42] Masaka [60] [58] [42] 37.8 ± ± ±9.2 [18-72] 7 [18-75] [18-59] Rural [117] 36.1±10. 8 [18-72] Periurban [42] 38.3±12.9 [18-77] Urban [43] 37.2±11.7 [18-70] 76.0 [38] 89.6 [43] 6.0. [21] 91.7 [33] 83.7 [82] 72.2 [26] 77.1 [27] Spouse of HH head Older child of HH head Other Lifestyle factors Smokes cigarettes or tobacco Tested for HIV HIV positive HIV negative Unsure Anthropometric status Mean age of men assessed (years) ±SD [Min-Max] ±7.6 [19-49] 33.6 ±7.7 [18-49] 32.1±7.6 [18-46] Mean BMI ±SD ± ± ± 2.7 Men >49 years of age were not included in anthropometric assessment. 35.9± ±7.2 [18-46] [18-49] 21.5 ± ± 3.3 Total [202] 36.9±11. 4 [18-77] 79.9 [135] 34.4± ± ±7.5 [18-49] [18-47] [18-49] 22.2 ± ± ±4.6
107 Protein intake The average protein intake among men was 48 g per day; and men that consumed ASFs had a significantly higher protein intake than men that did not include ASFs in their diets (Mean = 62.8 g versus 40.4 per day). The mean proportion of calories from protein was also significantly higher among men that consumed ASFs (Mean =13.3% ± 5.0%; 95%CI = % versus Mean = 8.5 ± 2.3; 95%CI = %). Protein intake was significantly higher among men in urban areas than those in rural areas (F (2, 173) = 3.97; p =.021). Men in Hoima also had a significantly higher protein intake with an average difference of 18.2 g more protein than men in Kamuli (p = 0.10), 19.1 g more than those in Lira (p = 0.021), and 21.8 g more than men in Masaka (p = 0.004). Fat intake In general, fat intake was low among men across the four survey districts. The average contribution of calories from fats to total caloric intake was 10.5 ± 11.9% among men; which is within the lower end of the recommended <30% of total calories. The proportion of calories from fat was significantly higher among men that consumed ASFs (Mean = 16.6 ± 13.8; 95%CI = %) than men that did not consume ASFs (Mean = 7.4 ± 9.4; 95% CI = %). Total carbohydrate intake The mean contribution of carbohydrate to total caloric intake among men was Mean = 79.3 ± 14.1% (95% CI = %); which was slightly higher than the recommended proportion of 65-75% total calories from carbohydrate for adults (21). Table 22 below provides details on carbohydrate intake across the survey areas. There were no statistically significant differences in carbohydrate intake among both men across the survey districts and the value-chain domains. Dietary Fibre Based on the WHO daily recommendation of g of fibre daily, only 17% of the 176 men that were assessed met the recommendation; 43.2% had lower levels than recommended while 39.8% had excessive levels. Men in Hoima (Mean = g; 95%CI = g) had significantly higher fibre intake while those in Masaka had the lowest dietary fibre intake (Mean = ; 95%CI = g). The mean fibre intakes per 1000 kcals were 21.8 g in Hoima, 20.7 g in Kamuli, 19.0 g in Lira, and 15.7 g in Masaka; which are all slightly higher than the recommended 14 g per 1000 kcals.
108 Dietary characteristic Mean number of eating occasions: (Mean±SD) [27 th, 75 th percentile] Mean total calories, kcals (Mean±SD) [27 th, 75 th percentile] Table 26: Mean caloric intake and gaps in intake of carbohydrate, protein, and fat among men N District Value-chain domain Total Hoima [49] ± 0.9 [3, 4] ± 879 a [1749, 2346] Kamuli [54] 3.6 ± 1.1 [3, 4] 1625 ± 876 b [963, 2160] Lira [35] Masaka [38] Rural-rural [97] 3.4 ± 1.3 [3, 4.2] 1865 ± 904 b [1150, 2232] 3.5 ± 0.9 [3, 4] 1689 ± 766 b [1077, 2238] 3.4 ± 1.1 [3, 4] 1739 ± 865 [994, 2310] Rural-urban [40] 3.4 ± 0.8 [3, 4] 1973 ± 939 [1152, 2575] Urban-urban [39] 3.7 ± 1.2 [3, 5] 2268 ±1043 [1354, 3085] (Mean ± SD) 3.5 ± ± 942 Mean % calories from: Carbohydrate ± ± ± ± ± ± ± ± 14.1 Protein ± ± ± ± ± ± ± ± 4.1 Lipids ± ± ± ± ± ± ± ± 11.9 Dietary fibre: Mean dietary fibre intake(g/day) ± 29.7 a 34.4 ± ± ± ± ± ± ± 27.2 Mean fibre intake per 1000 kcals ± ± ± ± ± ± ± ± 8.9 Consumption of ASFs: Had consumed ASFs in past 24 hours Mean % calories from ASFs (%) ± ± ± ± ± ± ± ± 15.0
109 Dietary intake, health-seeking practices and nutritional status of women The health status of women is a good indicator of a population s health status; thus more data was collected from women than was collected from men. Dietary intake among women In general, women s diets were mainly characterized by high intake of total carbohydrate and fibre but were limited in dietary protein and fat. Details of women s dietary intake are provided in Table 27 below. Total caloric intake Women in Hoima had the highest caloric intake (Mean = 1959 ± 789 kcal) followed by women in Masaka (Mean = 1689 ± kcal), Kamuli (Mean= 1507 ± 733 kcal) and Lira (Mean= 1249 ± 605 kcal), respectively. Animal source foods contributed about 13% of the total caloric intake among women that reported consuming ASFs in the 24 hours preceding the survey. Protein intake The mean protein intake among women was 10.1%, which is slightly lower than the recommended 15-20% of total caloric intake. Women that consumed ASFs also had a significantly higher protein intake than women that did not report consumption of ASFs (Mean = 52.2 g versus 35.0 g per day); and this is partly attributed to the high quality of the protein from ASFs. On average, animal source foods contributed about 45% of the total protein intake among women that reported consuming ASFs in the 24 hours preceding the survey; however, consumption of ASFs did not significantly influence women s total caloric intake. Fat intake In general, fat intake was low among both women across the survey districts and the value-chain domains. The average proportion of calories from fat for women was 9.1 ± 8.2%, which is below the recommended <30% of total calories. Just as observed among men, the average contribution of fats to total caloric intake was also significantly higher among women that consumed ASFs (Mean = 12.8% versus 7.5%). Overall, women in Masaka and Lira had slightly higher fat intake while Hoima had the lowest intake (see Table 27); however, the differences were not statistically significant across districts and value chain domains. Total carbohydrate intake The mean contribution of carbohydrate to total caloric intake was generally high. Similar to men, the mean proportion of calories from carbohydrate was also higher for women (Mean = 80.8 ± 10.3%) than the recommended proportion of 65-75% of total calories (21). There were no statistically significant differences in carbohydrate intake among both men and women across the four survey areas and the value-chain domains. Dietary Fibre High intake of dietary fibre is encouraged to minimize the risk for chronic diseases; however, excessive intake of fibre is associated with increased risk for malnutrition especially among young
110 children and individuals who are less likely to meet their caloric needs. Only 30.8% of women met the WHO recommendation of g of fibre daily while 35.5% reported excessive fibre intakes. Hoima had a significantly higher proportion of women (56.8%) with excessive fibre intakes. The proportions of women with adequate fibre intake were 31.1% in Hoima, 28.4% in Kamuli, 28.6% in Lira, and 34.7% in Masaka. Further analyses based on caloric intake 9 also revealed that women in Hoima (Mean = 24.9 g/1000 kcal) and Lira (Mean = 25.1 g/1000 kcal) had significantly higher fibre intake (p = 0.000) than women in Kamuli (Mean = 21.4 g/1000 kcal) and Masaka (Mean = 17.2 g/1000 kcal). 9 Guided by the Dietary Guidelines for Americans recommendation of 14 g per 1000 kcals daily.
111 Mean Survey area number of eating occasions 3.4 ± 0.7 [3, Hoima 4] 3.8 ± 0.9 [3, Kamuli 4] Lira 3.3 ± 1.2 [3, 4] Masaka 3.8 ± 1.0 [3, 4] Value-chain domain 3.7 ± 0.9 [3, Rural-rural 4] 3.3 ± 1.1 [3, Rural-urban 4] 3.7 ± 1.0 [3, Urban-urban 4] Table 27: Gaps in dietary intake among women Mean total Mean % calories from: Consumed Mean calories (kcals) Carbohydrate Protein Lipids Mean dietary fibre intake (g/day) ASFs in past 24 hours (%) proportion of calories from ASFs (n=84) 1959 ± 789 a [1338, 2509] 82.6 ± ± ± ± ± ± 733 bc [937, 1936] 80.7 ± ± ± ± ± ± 605 c [846, 1590] 79.4 ± ± ± ± ± ± 842 b [1065, 2262] 80.1 ± ± ± ± ± ±802 [968, 1984] 81.3 ± ± ,6 ± ± ± ± 847 [1044, 1684] 82.0 ± ± ± ± ± ± 760 [1112, 2032] 78.4 ± ± ± ± ± 9.5 Total (Mean ± SD) 3.6 ± ± ± ± ± ± ± 12.5 Numbers are Mean ± SD. Numbers in brackets are values for populations in 25 th and 75 th percentiles
112 Health seeking practices among women In this survey, health seeking practices were characterized by testing for HIV, use of iron supplements, and seeking health services when sick. Of the 276 women assessed, 28% reported having been sick in the 24-hours preceding the survey. The major illnesses reported were fever (5.2%) and the other illnesses commonly reported were general body aches (such backaches, stomachaches, and headaches), joint pains, cough and flu, and general weakness. Of the 80 women that reported being ill, only 14 (17.5%) had sought treatment from a health-care provider which suggests poor health-seeking practices. Testing for HIV among women Overall 87.7% of women were tested for HIV and of those 6% who tested were sero-positive. The prevalence of HIV among women included in this study (6.0%) is not different from the national average; however, Hoima (8.7%) and Lira (8.6%) reported slightly higher incidences of HIV while Kamuli (1.7%) reported the lowest incidence. Details are provided in Table 28 below. Use of iron supplements Overall, 86.4% of the 286 women surveyed were sure that they had taken iron supplements during pregnancy, 7.3% (21) had not taken any supplements and the remaining women could not remember or were not sure that they had used iron supplements. A higher proportion of women in Hoima (94.7%) and those in peri-urban areas (91.2%) were more like to report using iron supplements during the last pregnancy. In general, the use of iron supplements was good during pregnancy but very low after delivery. Prevalence of night blindness among pregnant women The prevalence of night blindness among pregnant women is a strong indicator of vitamin A deficiency. In this survey, a total of 16.4% of women reported that they had experienced night blindness during their last pregnancy and the high prevalence of night blindness was in Hoima (24.0%) and Kamuli (21.1%). Women in rural areas also reported a higher prevalence of night blindness (20.8%) than women in urban and peri-urban areas.
113 Characteristic Table 28: Health status and health-seeking practices among women (14-49 years) n Survey area District Value-chain domain Hoima [72] Kamuli [70] Lira [65] Masaka [64] Rural [139] Peri-urban [66] Urban [72] Mean age of women (years ± SD) ± ± ± ± ± ± ± ±9.7 Life stage Pregnant Lactating/breastfeeding Pregnant and lactating Non-lactating/non-breastfeeding Has been breastfeeding for (months) [1-33] 11 [0.5-25] 14.5 [ [1-20] 11 [0.5-33] ] 11 [ [0.5-33] 23] 19] Mean duration of last breastfeeding ± ± ± ± ± ± ± ±5.9 (months) Health seeking practices: Tested for HIV HIV positive HIV negative Unsure Declined to answer Use of iron supplements Currently taking Took during last pregnancy Nutritional status: Experienced night blindness in last pregnancy Mean BMI for women ± ± ± ± ± ± ± ±3.9 Severely underweight (very low MUAC) Moderately underweight (low MUAC) Healthy (normal MUAC) BMI-for-age was computed for women <18 years. MUAC classified as very low if <16 cm; moderate if cm; and normal if 18.5 cm for women less than 18 years old. For women 18 years and older, very low MUAC = <19 cm and low MUAC (moderate malnutrition) if cm. Total
114 Dietary intake, nutrition and health status of young children The last two Uganda Demographic and Health Surveys all documented high prevalence of malnutrition (13, 27) and interventions are needed to improve nutrition status of groups more vulnerable to undernutrition. The data presented here contributes to understanding the nutrition situation in the country. The results of this survey show that the majority of the respondents who were considered as the primary child-caregivers 10 of child nutrition included in the survey were spouses to the household heads (67.3%) and older children (7.4%). Lira had a significant number of other relatives (26.9%) that reported on child s diet and health history (χ 2 = 43.55; p=.000). These relatives mostly comprised daughters-in-law to household head. Table 29: Characteristics of individuals interviewed about children s dietary intake and health status n Proportion (%) of child-caregivers with characteristic District Value chain domain Hoima Kamuli Lira Masaka Rural [75] [70] [65] [64] [139] Characteristics of childcaregivers Periurban [66] Urban [66] Sex of respondent Male Female Marital status Married (monogamous) Married (polygamous) Widow/widower Divorced or separated Single/unmarried Other Position in household Household head Spouse of HH head Parent to HH head Older child of HH head Household maid or other worker Daughter in-law Other Characteristics of children included in the survey A total of 286 children of 6 to 58 months of age (Mean = 29.1 ± 13.6 months) were included in the survey but two records were dropped due to poor quality of the data. The majority of children were born at term (91.9%) and from singleton deliveries (98.6%). More details about children are provided in Table 30 below. Total 10 Individuals that were taking care of the target child and were knowledgeable of the child s dietary intake and health history.
115 Table 30: Characteristics of children included in survey Survey area Characteristic n District Value-chain domain Total Hoima Kamuli Lira [67] Masaka Rural Peri-urban Urban [73] [284] [75] [70] [72] [143] [68] Mean age of children (months) ±14.0 [6-58] 27.2±12. 0 [8-55] 30.9±14. 3 [6-58] 28.0±13. 9 [7-58] 27.9±13. 4 [6-58] 32.4±13.6 [7-58] 28.3±13.6 [6-58] 29.1±13.6 [6-58] Age groups (%[n] ) 6-11 months [6] 8.6 [6] 6.0 [4] 15.3 [11] 10.5 [15] 7.4 [5] 9.6 [7] 9.5 [27] months [9] 15.7 [11] 17.9 [12] 15.3 [11] 15.4 [22] 11.8 [8] 17.8 [13] 15.1 [43] months [10] 17.1 [12] 13.4 [9] 11.1 [8] 17.5 [25] 7.4 [5] 12.3 [9] 13.7 [39] months [20] 35.7 [25] 23.9 [16] 25.0 [18] 27.3 [39] 32.4 [22] 24.7 [18] 27.8 [79] months [18] 12.9 [9] 20.9 [14] 22.2 [16] 16.8 [24] 22.1 [15] 24.7 [18] 20.1 [57] months [12] 10.0 [7] 17.9 [12] 11.1 [8] 12.6 [18] 19.1 [13] 11.0 [8] 13.7 [39] Proportion of children born premature (%) Proportion of children born from a multiple delivery (%) Mean age(months) when introduced to other liquids besides breastmilk ±1.7 [1-12] 4.0±1.9 [1-8] 5.0±1.4 [1-7] 4.9±2.5 [1-15] 4.5±2.0 [1-12] 4.9±1.8 [1-8] 5.1±2.0 [0-15] 4.8±2.0 [ ] Mean age (months) when introduced to solid foods ±2.6 [1-18] 6.2±2.0 [1-14] 6.24±1.4 [3-12] 7.1±2.4 [3-15] 6.6±2.3 [1-18] 6.7±2.2 [1-15] 6.5±2.0 [3-15] 6.6±2.2 [1-18] Mean age (months) when completely stopped breastfeeding ±5.6 [2-25] 15.9±6.0 [1-30] 20.2±6.4 [2-33] 15.4±6.0 [ ] 17.2±6.3 [1-33] 17.6±6.6 [ ] 16.5±5.7 [2-30] 17.1±6.2 [ ] Values are Mean±SD [Minimum - Maximum]
116 Infant and young child feeding practices WHO recommends that children should be exclusively breastfed for the first 6 months of life, then age appropriate complementary feeds (liquids and semi-solids) should be introduced but breastfeeding should continue (alongside complementary feeding) up to 24 months or as long as the mother and child are comfortable with breastfeeding. In this survey, feeding practices were assessed for 284 children whose caregivers were available for interview. Breastfeeding practices Overall, the data indicates that breastfeeding was widely practiced among the survey households. Of the 284 children, only 4 children (1.4%) were never breastfed and breastfeeding status could not be established for only two children (0.7%). A total of 81 children (28.5%) were breastfeeding at the time of the survey while the remaining 197 children (69.4%) had been breastfed at some point in their life. Initiation of breastfeeding World Health Organization recommends that newborns should be put on the breast immediately after birth to improve lactation performance and reduce the risk for maternal hemorrhages. In this survey, women were asked to report on when they started feeding their children. A total 63% of the respondents had met the target of initiating breastfeeding within one hour after birth; 32.1% had exceeded one hour but had initiated breastfeeding within the first day of birth while 3.7% had started breastfeeding during the baby s second day of life. Only one person could not remember when she started breastfeeding her child. Kamuli (84.2%) had the highest proportion of respondents that reported initiating breastfeeding within one hour after birth while Hoima (40.9%) had the lowest proportion. Besides improving bonding between mother and infant and the establishment of breastfeeding patterns, early initiation of breastfeeding is expected to ensure that infants are fed on the first milk or colostrum. Colostrum is essential in child nutrition because it is rich in immunoglobulins which protect infants from illnesses; however, there have been reports where local cultural beliefs discourage the use of this first milk. Hence, children are often fed on other products until the mother s milk matures after 3-4 days. In this survey respondents were asked to report on whether they fed the first milk or thick liquid (colostrum) to their children. A total of 94.4% reported feeding colostrum to their children, 1.8% had not, and 3.9% were not sure. Only five children were not fed on colostrum and three of these were from Hoima. This indicates that children are benefiting from immunoglobins in breastmilk. Exclusive breastfeeding WHO recommends that children should not be fed on any other liquid or solids besides breastmilk during their first 6 months of life. This practice of exclusively feeding infants on breast milk improves maternal production of breastmilk, improves the infants nutrient intake from breast milk, reduces risk for malnutrition as a result of providing infants with inappropriate complementary feeds, and ensures gut health by delaying introduction of inappropriate feeds. This survey covered children of 6 to 59 months of age and thus all children had started taking other liquids and all children had been introduced onto solid feeds with the exception of only one 7 month-old child.
117 0 d 1 d 1-2 w Introduced liquids Introduced solids Stopped breastfeeding % Caregivers reporting practice Ages of children when initiated onto or weaned from feeding regimen Figure 52: Breastfeeding and complementary feeding patterns Exclusive breastfeeding practices were investigated by asking caregivers to recall the child s age at the time it was introduced to other liquid feeds and/or solids. This study documents low levels of exclusive breastfeeding. Of the 284 children assessed, less than a half were introduced to other liquids or feeds besides breastmilk at or after 6 months as recommended. A total of 3.3% were introduced to other liquids during their first day of life; which also indicates the use of prelacteal feeds. Four children (1.1%) were introduced to other liquids within the first 2 weeks and 13.5%) at 3 months of age. Kamuli respondents reported introducing liquids at a significantly early age (Mean = 4.0 ±1.9 months; χ 2 = 88.15, p=0.005) than the other survey sites. There were no statistically significant differences in exclusive breastfeeding practices across the value chain domains. Duration of breastfeeding To confer the most benefits to both the child and mother, WHO recommends that all children breastfeed for 24 months or as long as it is comfortable to both the mother and child. Overall, the age at which children were completely weaned from breastfeeding varied from 1 week to 33 months (Mean = 17.2 ± 6 months). As shown in Figure 52 above, the proportions of children being weaned peaked at 12 months (11.2%), 18 months (15.8%), and at 24 months (18.4%). Kamuli had the highest proportion of children that were breastfed for a longer duration (Mean = 20.2±6 months) but there were no statistically significant differences across the survey areas. Adequacy of children s dietary intake In general, children s diets had adequate amounts of carbohydrate but were limited in protein and lipids. Figure 53Figure below shows the proportions of children that met their requirements for macronutrient intake.
118 Hoima Kamuli Lira Masaka Total Hoima Kamuli Lira Masaka Total Hoima Kamuli Lira Masaka Total Hoima Kamuli Lira Masaka Total Low Adequate High 100% 80% 60% % 20% 0% Carbohydrate Fiber Protein Fat Figure 53: Proportion of children within a given level of total carbohydrate, fibre, protein, and fat intake As shown in Figure 53 above, two thirds of the children assessed consumed excessive amounts carbohydrate (> 75% of total calories) and the number of children with the excess carbohydrate intake was highest in Kamuli (76%) and Hoima (73%) and lowest in Masaka (51%). The average fibre intake among children was 179% (SD=125%) of the recommended amounts (21). Compared to other survey areas, children from Hoima were also reported to consume excessive amounts of dietary fibre (Mean = 239%) and this can be partly explained by the high consumption of lessrefined roots, tubers and vegetables. Conversely, protein and fat intake were lower than recommended. More than a half of the children surveyed had lower than the recommended protein intake (obtained less than 15% of their calories from protein) and about two thirds (68%) had low fat intake (lower than 15% of calories from fat). These dietary patterns indicate that a large proportion of children in the surveyed areas are at risk of multiple micronutrient deficiencies. Access to and utilization of health interventions Health interventions such as immunization and micronutrient supplementation are designed to improve the nutrition of a population by reducing the impacts of disease. The access and utilization of these interventions also is a good indicator of the population s health seeking practices. In Uganda, vitamin A supplementation, de-worming, and vaccinations are common public health interventions that are provided free of charge through the government health centres. The proportions of children that utilized these services are summarized below. Vitamin A supplementation Overall, only 60.2% of the children had received vitamin A supplementation as recommended. Compared to other survey areas, Hoima (76.0%) had a statistically significant higher proportion of children that had received vitamin A supplementation in the 6 months preceding the survey (χ 2 = 15.50; p=0.017). Vitamin A supplementation also significantly varied across the value-chain domains (χ 2 = 13.68; p = 0.008). A larger proportion of children in urban areas (74.0%) had received
119 vitamin A supplements and this was followed by children in peri-urban households (61.8%), and rural households reported the lowest proportion (52.4%). De-worming De-worming is an intervention designed to reduce the risk of anemia among children 6 to 59 months of age. WHO recommends that children 6-59 months should be de-wormed every 6 months. In this survey, only half of the children (50.7%) had verifiable records of having been dewormed in the preceding 6 months, 28.2% had not been de-wormed, and de-worming status could not be established for 21.1% of children and. Hoima (76.0%) had the highest proportion of children that had been de-wormed in the 6 months preceding the survey; and was followed by Lira (62.7%) and Kamuli (51.4%), while Masaka had the lowest proportion (12.5%). In general, urban households (60.3%) reported a significantly larger proportion of children that had been de-wormed in the preceding 6 months than peri-urban (48.5%) and rural (46.9%) areas (χ 2 = 26.56; p=.000); however peri-urban areas also reported the largest proportion of children (35.3%) whose de-worming status could not be verified from the health cards. Child immunization status Immunization of children against common diseases is one of the key public health interventions to mitigate the vicious cycle of infections and undernutrition and to reduce child mortality. In this survey, caregivers were asked to report on their children s immunization history and where possible, the enumerators collected this information from the child s health card. As shown in Figure 54 below, 90.7% of children 12 months and older had received immunization against measles, 96.7% had received at least one DPT (diphtheria, pertussis and tetanus) dose; 96.7% had at least one dose of polio vaccine, and 98.7% had at least one dose for BCG Don't know No without card No with card Yes without card Yes with card m m 6-11 m m 6-11 m m 6-11 m m BCG DPT Polio Measles Figure 54: Proportion of children that received specified vaccine Besides low levels of measles vaccination, the immunization history of both infants (6-11 months group) and older children (12-59 months group) were high. Measles immunization levels were lower among children 6-11 months because it given to children 9 months of age and older.
120 Table 31 provides details about the children s immunization history. Table 31: Child immunisation history across the survey sites and pig value-chain domains Health intervention n Proportion of children that had utilized health intervention District Value-chain domain Hoima Kamuli Lira Masaka Rural Peri- [72] [70] [65] [64] [139] urban [66] Urban [66] Total [281] Vitamin A supplementation De-wormed Yes No Unknown Measles vaccination Yes with card Yes without card No with card No without card Unknown status DPT (with Hep B) Yes with card Yes without card No with card No without card Unknown status Polio (OPV) Yes with card Yes without card No with card No without card Unknown status BCG Yes with card Yes without card No with card No without card Unknown status HIV testing Tested for HIV Sero status Positive Negative Unsure Overall, 92.7% of the eligible children were reported to have received measles vaccination. However, only 57.5% had records of measles vaccination. There were no statistically significant differences in the proportions of children that had received measles vaccination across the four survey areas and across the value chain domains.
121 Testing for HIV Voluntary testing and counseling for HIV infection is now one of the public health interventions designed to reduce maternal transmission of HIV and improve appropriate care for HIV infected and exposed children. Although this is a free service which is currently offered by government supported health centres, only a third of the children (32.4%) had undergone HIV testing. A significantly large proportion of children were tested in urban areas (45.2%) and few children had been assessed in peri-urban (30.9) and rural (26.6%) areas (χ 2 =10.67; p=0.34). As shown in Table 31 above, Lira (41.8%) had the highest proportion of children tested for HIV while Kamuli had the lowest (21.4%) proportion (χ 2 = 15.2; p=0.019). Nutritional status of children Anthropometric data was collected from 286 children of 6 to 59 months of age to gauge the nutritional status of the survey population. Households included in the nutritional survey were randomly selected from 606 households that completed the socio-demographic survey with a target of reaching 50% of the households (300 children). However, since the number of children aged 6-59 months was lower than 50%, in most villages all households with the target children were included in the survey. Lira households had fewer children within the targeted age range of 6-59 months. Prevalence of stunting Low height-for-age or stunting is an indicator of chronic undernutrition. Based on the WHO reference population, a total of 33.9% were stunted. In general, there were no significant differences in the prevalence of stunting across the survey areas but Masaka (44.3%) had the highest proportion of stunted children while Hoima (25.0%) had the lowest. A slightly higher proportion of males were stunted (29.2% versus 21.5%) but the difference was not statistically significant. Overall, the incidence of stunting was highest among children in rural and peri-urban areas and also among older children (24-59 months old).
122 50 40 Severely stunted Moderately stunted % Stunted Total Child age groups (months) Figure 55: Proportion of children stunted based on age group As expected, the risk for stunting seems to increase with age. In this survey, low levels of both moderate and severe forms of stunting were documented among children 6-23 months. The incidence of moderate stunting level off after among children 12 to 47 months while the proportions of severely stunted children increased. This trend often indicates the chronic nature of undernutrition and the body s mechanism to adapt to the chronic limited dietary intake by restricting linear growth. Prevalence of underweight Underweight is characterized by low weight-for-age, low mid-upper arm circumference (MUAC), and low BMI-for-age. In general children with low weight-for-age and low MUAC are considered underweight. Although underweight may result from other causes, in a healthy population underweight often indicates undernourishment. Overall, a quarter of children (25.2%) were classified as underweight by low WAZ and only 3.6% by low MUAC. This indicates that underweight is not resulting from a current episode of severe food deprivation or illness (i.e. is not acute); but more likely medium-term limited dietary intake. Masaka (31.9% by WAZ and 3.6% by MUAC) had the largest proportion of underweight children while Hoima (21.3% by WAZ and 1.3% by MUAC) had the least proportion. Based on BMI-for-age, 3.2% of children were at risk of being overweight (BMI-for-age >5SD). Prevalence of wasting (low weight-for-height) Wasting or low weight-for-height is an indicator of current nutrition or health status. In absence of disease, wasting is often associated with deficits in current protein and energy intake. In this survey, a total of 7.9% of the children were severely wasted and 8.3% were moderately wasted. Wasting was more prevalent among children in rural areas and Lira had the highest proportion of wasted children (see Table 32) Management of severe acute malnutrition (SAM) Only three children (1.1%) out of the 284 assessed were reported to have been enrolled in a severe acute malnutrition (SAM) treatment program. The child in Hoima was enrolled in the Bwendero
123 Health Centre program while the two in Kamuli were being rehabilitated under the STRIDES and VEDCO SAM management programs. Overall, the incidence of wasting increased with age among children 6 to 23 months of age and decreased slightly with age from 24 to 59 months. The early increase in wasting is most likely related to changes in child s diet because this is the time when children are being weaned onto other liquids and solid foods. This can be explained by weaning patterns that are characterized by age inappropriate feeds which are mostly constituted of gruels made from local staples with very limited or no addition of good quality protein from animal source foods. Such dietary patterns are confirmed by the unbalanced intake of macronutrients reported above, whereby there is excessive intake of carbohydrates and fibre and limited intake of fat and protein. Inclusion of adequate amounts of ASFs is likely to reduce these gaps in macronutrient intake.
124 Characteristics of children included in survey n Table 32: Prevalence of malnutrition among children 6-59 months of age Proportion of children with low anthropometric measures (%[n]) Low weight-for-age (WAZ) Severely Moderately underweig underweig ht (<-3SD) ht (-3 to -2 SD) Low height-for age (HAZ) Moderatel Severely y Stunted stunted (<- (-3 to -2 3 SD) SD) Low weight-forheight (WHZ) Severel Moderatel y y wasted wasted (-3 to -2 (<-3 SD) SD) Low MUAC-for-age Severely Moderately underweig underweig ht (<-3SD) ht (-3 to -2 SD) Low head circumference-forage Severely Moderately microncephall microncephall ic (<-3 SD) ic (-3 to -2 SD) Child age group 6-11 months [1].0% 3.2 [1] 6.4 [2] [3] [2] months [2] 2.7 [1] 10.8 [4] 10.8 [4] 8.1 [3] [1] months [1] 10.0 [4] 12.5 [5] 10.0 [4] 10 [4] 12.5 [5] months [11] 18.8 [15] 30.3 [23] 10.5 [8] 10.1 [8] 6.3 [5] [2] 5.1 [4] 9.0 [7] months [14] 10.7 [6] 38.2 [21] 10.9 [6] 5.3 [3] 10.7 [6] 1.8 [1] 7.1 [4] 5.6 [3] 11.1 [6] months [13] 10.8 [4] 45.4 [15] 6.1 [2] 8.8 [3] 2.9 [1] [3] 5.4 [2] 16.2 [6] Sex of children [20] 14.6 [20] Male [38] 5.3 [7] [15] 8.9 [12] 0.7 [1] 4.4 [6] 6.8 [9] 7.6 [10] Female [20] 7.6 [11] 20.1 [28] 13.4 [19] 4.9 [7] 7.7 [12] [3] 1.4 [2] 6.9 [10] Survey area Hoima [9] 9.3 [7] 13.9 [10] 11.1 [8] 2.7 [2] 4.1 [3] [1] 5.6 [4] 8.5 [6] Kamuli [8] 13.2 [9] 28.1 [16] 7.8 [5] 7.5 [5] 9.0 [6] [2] 2.9 [2] 4.4 [3] Lira [9] 9.1 [6] 24.2 [18] 6.1 [4] 10.8 [7] 9.2 [6] [3] 7.6 [5] 7.6 [5] Masaka [14] 12.5 [9] 31.4 [22] 12.9 [9] 11.3 [8] 11.3 [8] 1.4 [1] 4.2 [3] [6] Value-chain domain Rural-rural [24] 10.1 [14] 26.0 [34} 6.9 [9] 7.2 [10] 9.4 [13] [5] 5.8 [8] 7.3 [10] Rural-urban [10] 7.2 [5] 26.1 [18] 8.7 [6] 6.1 [4] 7.6 [5] 1.4 [1] 4.3 [3] [6] Urban-urban [6] 16.4 [12] 19.4 [14] 15.3 [11] 11.0 [8] 6.8 [5] [1] 4.2 [3] 5.6 [4] Total [40] 11.0 [31] 24.3 [66] 9.6 [26] 7.9 [22] 8.3 [23] 0.4 [1] 3.2 [9] 4.0 [11] 7.2 [20] * A total of 9 records (3.2%) were flagged because of HAZ <-6 and 3 records were dropped due to WHZ <-5.
125 General discussion and recommendations In general, the dietary patterns observed in this survey characterize patterns which do not support adherence to nutritionally adequate diets. In general, there is limited production of animal source foods and these foods are mostly produced to generate income. The limited access to ASFs does not allow individual households to meet the daily recommendations of at least 2-4 servings of foods from meats, fish, poultry and eggs food group and 2-3 servings from the dairy foods group. These gaps in dietary intake of ASFs, which are the major source of good quality protein and micronutrients, may explain the limited intake of protein and fat especially among women and children plus the observed high prevalence of undernutrition documented among children and men. In this survey Hoima households reported consumption of a variety of foods, had more balanced diets that included a variety of ASFs, and this may explain the lower incidence of undernutrition observed in Hoima. Lira households, on the other hand, reported more food insecurity (Mean HFIAS = 4.5) and also had high incidence of undernutrition among children. The malnutrition situation in Lira could have even been worst if it was not for the reported frequent consumption of nuts and oil seeds (specifically groundnuts and simsim paste). Given these observations, it is important to promote production and consumption of ASFs in the study areas in order to improve the dietary intake and nutritional status of all household members. In line with the CRP3.7 target of enabling poor women, children and other vulnerable groups to increase their consumption of animal source foods; this survey provides desegregated data on animal-source food consumption patterns among children, women, men, and older adults. However, despite the popular beliefs that men consume more meats while children consume more milk, the results of this survey show no statistically significant differences in the frequency of use of animal source foods across the gender groups. In general, the patterns in the frequency of animal source foods indicate that fish products (especially small fish) are accessed daily or weekly; meats on a monthly basis, and poultry about once in three months. These consumption patterns need intervention to improve access and consumption of ASFs. Promoting production and consumption of pork products offers a lot of promise in improving food and livelihoods of people in the four targeted intervention areas (districts) since about half (52.2%) of the households were already engaged in pig production. A large proportion of participants also liked the piggery enterprise because of its higher returns to their investments and larger litter size; however, there is need for more concentrated efforts on popularization of pork and pork products among the targeted MorePORK project areas and also in urban areas (such as Kampala city) which are potential markets for the targeted pig production areas. This is very crucial since larger proportions of the surveyed households disliked most of the unprocessed pork products. Behavioral change interventions are needed to enable the targeted pork consumers to incorporate pork products in their diets regularly. In general, the results of this survey documented limited (almost no) access to processed pork products. This pattern in pork production and consumption explains why some respondents decried the unpredictable low prices as a disincentive in their piggery enterprises. There is need for more efforts to stimulate value addition in pork production and marketing value chains. Adding value to pork by processing it into shelf-stable and more acceptable products will improve ASF access by the large proportions of households that were not knowledgeable of the available pig products such as sausages, salami, and bacon. Shelf-stable products (mainly those that can be kept at room
126 temperature) are mainly important because the majority of households do not have access to electricity and refrigeration services. The need for animal source foods is amplified by the limited intakes of dietary protein and fat which was documented in all the surveyed areas. In general, limited intake of both protein and fat suggests that the diets are likely to be limited in multiple micronutrients (not discussed in this report). The high incidence of underweight among both adults and children in areas with reported high incidences of food insecurity (coupled with the high carbohydrate diets that were documented in this survey) suggests a need to improve access to nutrient dense foods. Animal source foods will go a long way to improve both inadequacies in protein, fat, and caloric intake and simultaneously reduce the risk for multiple micronutrient deficiencies. Hence, in order to sustainably improve the nutrition of all household members through the promotion of pork products and other animal source foods, it is recommended that stakeholders should: Improve livestock production to increase access to ASFs and reduce gender disparities in household asset ownership Based on the population of different types of animals kept at household level, it can be concluded that livestock production was generally low across all the survey areas. The limited allocation of land to growing pasture and fodder plus the lack of engagement in aquaculture also suggests that livestock production is not prioritized. This may explain the limited demand for animal source foods (ASFs) and the consequent limited intake of meats, fish, eggs, and dairy products. More interventions are needed to boost livestock production so as to address the gaps in ASF consumption. Although the activities of the MorePORK project are geared to improving pig production and pork utilization, there is need for concerted efforts to promote production of other small animals such as chicken, goats, and sheep and investments in fish farming. This is especially important in areas such as Lira where an appreciated number of land plots were reported to have been underutilized. Since there was less disparity in livestock ownership when compared to ownership of farm and other household assets, improving livestock production is also likely to reduce gender disparities in intra-household asset ownership. Improve access to pork products and other animal source foods Limited access, especially among rural households, is often considered as one of the main factors that limit utilization of animal-source foods. Just like other meat products, unprocessed pork products were mostly purchased from butcheries and neighbourhood slaughterers. It is only among households in Lira where unprocessed pig products are derived from varied sources. Supermarkets were only mentioned as the major source of roasted pork by only one household in Masaka. Hence, interventions to improve access to good quality unprocessed pig products should be focused at improving access of pork products at local butchery level and the neighbourhood slaughterers. Monitoring of the quality of pork products and other animal source foods being accessed by consumers Since the majority of households are accessing pork products from local butcheries and neighbourhood slaughterers, there is need for monitoring the quality and safety of pork products at local level. From the focus group discussions in Masaka and Kamuli, it was determined that ILRI in collaboration with district veterinary office and other stakeholders have supported the initiation of safe community slaughter slabs. There is need for these slaughter slabs to test all pigs for common
127 diseases of public health concern and take appropriate actions. These kinds of initiatives are necessary to improve the public s confidence in the quality and safety of pork products which will consequently improve peoples access to ASFs. However, these slaughter slabs need legal frameworks to be recognized in order not to compete with private butcheries. Engage in appropriate nutrition communications to boost intake of pork products and other ASFs Although ASFs are associated with high intake of saturated fat and the associated chronic diseases, results from this study indicate that fat intake is lower than the minimum required daily intake of 15% of total calories from fat; which is necessary to ensure adequate intake of essential fatty acids, facilitate absorption of fat soluble vitamins, and ensure adequate caloric intake. The large gaps in protein and fat intake coupled with excess intake of carbohydrate warrant interventions to include healthier food sources of protein and fat in the diets of both adults and children. Hence, the inclusion of pork products is necessary to boost consumption of ASFs so as to boost energy and nutrient intake. There is need for concerted efforts to promote integration of pork products and other ASFs in usual local diets. This calls for well-tailored social marketing and nutrition communications to ensure that intake of ASFs does not exceed the recommended intakes and put the population at risk for chronic diseases. Production and promotion of processed pork products is essential to improving consumption of pork especially among those that are turned-off by the unique flavour (smell) of pork. In order to produce processed products that are appealing to Ugandan consumers, there is need for more research to characterize consumer preferences for processed pork products in Uganda. This is important to identify the types of processed pork products consumers want; the textures and flavours that are desired; and consumers perceptions about the safety of the different pork products. Engage in nutrition communications to improve the population s understanding of diet adequacy and nutrient requirements Tackling undernutrition is increasingly becoming difficult globally due to the co-existence of both undernutrition and overnutrition. This survey documented slightly higher prevalence of undernutrition among men and children while a high prevalence of overweight was documented among women. Since increased consumption of ASFs is linked to increased risk for overweight and obesity and the associated chronic diseases (notably cardiovascular diseases, diabetes mellitus, some cancers, and hypertension), there is need to guide the population on appropriate strategies to incorporate ASFs in their diets. Interventions are needed to improve understanding of diet adequacy and individual nutrient requirements. Engage in more research to improve understanding of food use and dietary patterns in Uganda This study documents dietary patterns that are characterized by excess intake of carbohydrate and limited intake of protein and fat among all household members; which indicates imbalances in household dietary patterns. These patterns can be improved but there is need for more research to understand the seasonal variations in food preparation practices, diet planning, meal patterns, and intra-household food distribution patterns. This is important in order to provide appropriate dietary guidance to the population.
128
129 References 1. Njuki J, Poole J, Johnson N, et al. Gender, livestock and livelihood indicators. International Livestock Research Institute. ILRI Technical Brief, Livestock production index. [database on the Internet]2015 [cited June 25, 2015]. Available from: 3. Delgado CL. Rising consumption of meat and milk in developing countries has created a new food revolution. The Journal of nutrition. 2003;133(11 Suppl 2):3907s-10s. 4. FAO. The state of food and agriculture: Livestock in the balance FAO. Mapping supply and demand for animal-source foods to 2030, by T.P. Robinson & F. Pozzi.. Animal Production and Health Working Paper. No Speedy AW. Global Production and Consumption of Animal Source Foods. The Journal of nutrition. 2003;133(11):4048S-53S. 7. WFP & UBOS. Comphrehensive Food Security and Vulnerability Analysis: Uganda World Food Programme. Comphrehensive Food Security and Vulnerability Analysis: Uganda Nishida C, Uauy R, Kumanyika S, Shetty P. The Joint WHO/FAO Expert Consultation on diet, nutrition and the prevention of chronic diseases: process, product and policy implications. Public Health Nutrition. 2004;7(1A): doi: /phn Azarri C, Cross E, Haile B, Zezza A. Does livestock ownership affect animal source foods consumption and child nutrition status? Evidence from rural Uganda. World Bank Policy Research Working Paper # WHO. Health indicators of sustainable agriculture, food and nutrition security: World Health Organisation2012 May Expert Consultation Paper# WHO/HSE/PHE/ a. 12. Gibson RS, Ferguson EL. An interactive 24-hour recall for assessing the adequacy of iron and zinc intakes in developing countries. In: (CIAT) IFPRIIaICfTA, editor. HarvestPlus Technical Monograph #8. Washington DC: International Life Sciences Institute; UBOS & Macro-International. Uganda Demographics and Health Survey Available at: Howard G, Bartram J. Domestic water quantity, service, level and health2003 Contract No.: WHO/SDE/WSH/ Pinstrup-Andersen P. Food security: definition and measurement. Food Sec. 2009;1(1):5-7. doi: /s y 16. Viala E. Water for food, water for life a comprehensive assessment of water management in agriculture. Irrig Drainage Syst. 2008;22(1): doi: /s WFP. WFP handbook on safe access to firewood and alternative energy (SAFE) Available from: van Elsland SL, van der Hoeven M, Joshi S, Doak CM, Ponce MC. Pressure cooker ownership and food security in Aurangabad, India. Public Health Nutr. 2012;15(5): doi: /s
130 19. ECA. Land tenure systems and their impacts on food security and sustainable development in Africa. In: Africa ECo, editor. Adis Ababa, Ethiopia Turyahabwe N, Kakuru W, Tweheyo M, Tumusiime DM. Contribution of wetland resources to household food security in Uganda. Agriculture & Food Security. 2013;2(1): World Health Organisation (WHO). Population nutrient intake goals for preventing dietrelated chronic diseases. 22. Higenyi J, Kabasa D, Muyanja C. Social and quality attributes influencing consumption of native poultry in eastern Uganda. Animal and Veterinary Sciences. 2014;2(2): Ofori JA, Hsieh Y-HP. The use of blood and derived products as food additives. In: El- Samragy Y, editor. Food additive: InTech p Andago A, Imungi J, Mwangi A, Lamuka P, Nduati R. Development of a bovine blood enriched porridge flour for alleviation of anemia among young children in Kenya. Food Science and Quality Management. 2015; Kikafunda JK, Sserumaga P. Production and use of a shelf-stable bovine blood powder for food fortification as a food-based strategy to combat iron deficiency anemia in Sub-Saharan Africa. African Journal of Food Agriculture and Nutritional Development. 2005;5(1). Available at: Roesel K, Clausen P-H, Fries R, Baumann M, Noeckler K, Grace D, editors. More pork and less parasites: a farm to fork approach for assessment and management of pork meat associated diseases in Uganda. Parasitologisches Kolloquium; 2013; Freie Universitat, Berlin, Germany. 27. Uganda Bureau of Statistics & Macro-International, Inc.. Uganda Demographics and Health Survey UBOS -Kampala, Uganda & Macro_International Inc, Calverton, Maryland, USA, 2007.
131 Table 33: Household ownership of productive, domestic, and transport assets Type of asset Households Proportion owned by household member (% [n]) Total assets with asset (n) Men Women Joint owned <3yrs 3-7yrs >7yrs <3yrs 3-7yrs >7yrs <3yrs 3-7yrs >7yrs Domestic assets Cooker/ Gas Stove [1] [1] 25.0 [2] 12.5 [1] [3] 8 Refrigerator [2] 6.5 [2] 9.7 [3] 3.2 [1] 19.4 [6] 16.1 [5] 12.9 [4] 6.5 [2] 19.4 [6] 31 Radio [124] 17.8 [90] 8.3 [42] 10.3 [52] 6.1 [31] 3.4 [17] 14 [71] 10.1 [51] 5.5 [28] 506 Television [9] 10.8 [10] 11.8 [11] 9.7 [9] 6.5 [6] 7.5 [7] 11.8 [11] 14.0 [13] 18.3 [17] 93 Mobile phone [201] 19.1 [140] 9.0 [66] 26.5 [194] 11.9 [87] 4.5 [33] 0.95 [7] 0.3 [2] 0.4 [3] 733 Sofa set [19] 10.2 [19] 6.4 [12] 5.3 [10] 7.0 [13] 5.9 [11] 12.8 [24] 17.6 [33] 24.6 [46] 187 Sewing Machine [2] [8] 12.7 [7] 10.9 [6] 21.8 [12] 16.4 [9] 7.3 [4] 12.7 [7] 55 Generator [1] 14.3 [1] [3] 14.3 [1] 14.3 [1] 7 Biogas [1].. 1 Solar panel [17] 10.6 [7] 1.5 [1] 7.6 [5] 3.0 [2] 3.0 [2] 28.8 [19] 16.7[11] 3.0 [2] 66 Transport assets Salon car [5] ] ]. 2 [10] 2 [10.0] 2 [10.0] 0 2 [10.0] 20 Truck [3] 2 [25.0] 3 [37.5] Motorcycle [34] 36 [33.3] 18 [16.7] 4 [3.7] 2 [1.9] 6 [5.6] 4 [3.7] 2 [1.9] 2 [1.9] 108 Bicycle [53] ] 93[22.5] 11 [2.7] 28 [6.8] 39 [9.4] 22 [5.3] 35[8.5] 44 [10.7] 413 Boat Farm assets Hoes (17.4] 198 [10.4] 76 [4.0] 243 [12.8] 155 [8.1] 68 [3.6] 330 [17.4] 400 [21.0] 101 [5.3] 1902 Wheelbarrows [16.0] 15 [16.0] 11 [11.7] 1 [1.1] 11 [11.7] 8 [8.5] 8 [8.5] 16 [17.0] 9 [9.6] 94 Axe [9.8] 52 [14.1] 55 [14.9] 15 [4.1] 31 [8.4] 43 [11.7] 26 [7.1] 53 [14.1] 57 [15.5] 368 Spades/shovel [22.5] 26 [13.6] 17 [8.9] 6 [3.1] 6 [3.1] 2 [1.0] 38 [19.9] 42 [22.0] 11 [5.8] 191 Pangas/machetes [26.3] 49 [9.0] 35 [6.4] 47 [8.7] 34 [6.3] 22 [4.1] 87 [16.0] 92 [16.9] 34 [6.3] 543 Ox-ploughs 34 5 [14.3] 7 [20.0] 4 [11.4] 0 1 [2.9] 1 [2.9] 4 [11.4] 7 [20.0] 6 [17.1] 35 Sprayer pump [big] [21.1] 16 [14.7] 9 [8.3] 9 [12.6] 6 [5.5] 2 [1.8] 20 [18.3] 14 [12.8] 10 [9.2] 109 Fishing nets 7 3 [37.5] 1 [12.5] 2 [25] 0 2 [25.0]
132 Table 34: Household ownership of productive, domestic, and transport assets Type of asset Households with asset Proportion owned by household member (% [n]) Total assets (n) Men Women Joint owned <3yrs 3-7yrs >7yrs <3yrs 3-7yrs >7yrs <3yrs 3-7yrs >7yrs Domestic assets Cooker/ Gas Stove [1] [1] 25.0 [2] 12.5 [1] [3] 8 Refrigerator [2] 6.5 [2] 9.7 [3] 3.2 [1] 19.4 [6] 16.1 [5] 12.9 [4] 6.5 [2] 19.4 [6] 31 Radio [124] 17.8 [90] 8.3 [42] 10.3 [52] 6.1 [31] 3.4 [17] 14 [71] 10.1 [51] 5.5 [28] 506 Television [9] 10.8 [10] 11.8 [11] 9.7 [9] 6.5 [6] 7.5 [7] 11.8 [11] 14.0 [13] 18.3 [17] 93 Mobile phone [201] 19.1 [140] 9.0 [66] 26.5 [194] 11.9 [87] 4.5 [33] 0.95 [7] 0.3 [2] 0.4 [3] 733 Sofa set [19] 10.2 [19] 6.4 [12] 5.3 [10] 7.0 [13] 5.9 [11] 12.8 [24] 17.6 [33] 24.6 [46] 187 Sewing Machine [2] [8] 12.7 [7] 10.9 [6] 21.8 [12] 16.4 [9] 7.3 [4] 12.7 [7] 55 Generator [1] 14.3 [1] [3] 14.3 [1] 14.3 [1] 7 Biogas [1].. 1 Solar panel [17] 10.6 [7] 1.5 [1] 7.6 [5] 3.0 [2] 3.0 [2] 28.8 [19] 16.7[11] 3.0 [2] 66 Transport assets Salon car [5] ] ]. 2 [10] 2 [10.0] 2 [10.0] 0 2 [10.0] 20 Truck [3] 2 [25.0] 3 [37.5] Motorcycle [34] 36 [33.3] 18 [16.7] 4 [3.7] 2 [1.9] 6 [5.6] 4 [3.7] 2 [1.9] 2 [1.9] 108 Bicycle [53] ] 93[22.5] 11 [2.7] 28 [6.8] 39 [9.4] 22 [5.3] 35[8.5] 44 [10.7] 413 Boat Farm assets Hoes (17.4] 198 [10.4] 76 [4.0] 243 [12.8] 155 [8.1] 68 [3.6] 330 [17.4] 400 [21.0] 101 [5.3] 1902 Wheelbarrows [16.0] 15 [16.0] 11 [11.7] 1 [1.1] 11 [11.7] 8 [8.5] 8 [8.5] 16 [17.0] 9 [9.6] 94 Axe [9.8] 52 [14.1] 55 [14.9] 15 [4.1] 31 [8.4] 43 [11.7] 26 [7.1] 53 [14.1] 57 [15.5] 368 Spades/shovel [22.5] 26 [13.6] 17 [8.9] 6 [3.1] 6 [3.1] 2 [1.0] 38 [19.9] 42 [22.0] 11 [5.8] 191 Pangas/machetes [26.3] 49 [9.0] 35 [6.4] 47 [8.7] 34 [6.3] 22 [4.1] 87 [16.0] 92 [16.9] 34 [6.3] 543 Ox-Ploughs 34 5 [14.3] 7 [20.0] 4 [11.4] 0 1 [2.9] 1 [2.9] 4 [11.4] 7 [20.0] 6 [17.1] 35 Sprayer pump [big] [21.1] 16 [14.7] 9 [8.3] 9 [12.6] 6 [5.5] 2 [1.8] 20 [18.3] 14 [12.8] 10 [9.2] 109 Fishing nets 7 3 [37.5] 1 [12.5] 2 [25] 0 2 [25.0]
133 Foods selected Table 35: Frequency of selection of foods in each food group n Mean frequency of consumption of food item (days in a week) Hoima (n=150) Kamuli (n=153) Lira (n=153) Masaka (n=150) Total (N=606) Tubers and starchy vegetables Sweetpotatoes Cassava roots (fresh) Matooke Cassava meal (flour) Irish potatoes Maize on the cob Plantain (gonja) Grains Maizemeal (posho) Rice Millet Wheat and wheat products Sorghum Pulses, nuts and seeds Beans dry Groundnut sauce Peas Simsim Groundnuts in shell Groundnuts roasted Meat and poultry Beef Pork Chicken Goat meat Other meat Fish Mukene Fresh fish Dry/smoked fish Eggs Milk
134 Foods selected n Mean frequency of consumption of food item (days in a week) Hoima (n=150) Kamuli (n=153) Lira (n=153) Masaka (n=150) Total (N=606) Fats and oils Cooking oil Margarine/butter Fruits Passion fruits Dessert bananas Mangoes Oranges Other fruits Vegetables Onions Tomatoes Cabbages Dodo Other vegetables Beans (fresh) Sweets Sugar Miscellaneous Coffee tea Beer/alcohol soda


135 < 3yrs 3-7 yrs >7 yrs Figure 56: Household ownership of domestic assets


136 Daily weekly monthly Quarterly yearly never 100% 80% 60% 40% 20% 0% Children <2 years old Children 2-5 years old Children 5-18 years old Non-pregnant, non-lactating women (14-49 years) Red meat Organ meat Fish Insec Poultry Eggs Dai Figure 57: Frequency of consumption of ASFs among children and women


137 M e n W o m e n C h i l d r e n E l d e r l y Red meat Organ meat Fish Insects Poultry Eggs Dairy Figure 58: Frequency of consumption of ASFs among men, women, children, and elderly
MONITORING AND EVALUATING THE NUTRITION OUTCOMES OF INTERVENTIONS KEY CONCEPTS AND INDICATORS
 MONITORING AND EVALUATING THE NUTRITION OUTCOMES OF INTERVENTIONS KEY CONCEPTS AND INDICATORS WHAT TO MEASURE? Diet quality, food consumption Malnutrition Food Security: access to diverse, nutritious diets
MONITORING AND EVALUATING THE NUTRITION OUTCOMES OF INTERVENTIONS KEY CONCEPTS AND INDICATORS
 MONITORING AND EVALUATING THE NUTRITION OUTCOMES OF INTERVENTIONS KEY CONCEPTS AND INDICATORS Monitoring vs. Evaluation Monitoring Involves routine tracking of program performance (e.g. inputs and outputs)
Draft of the Rome Declaration on Nutrition
 Draft of the Rome Declaration on Nutrition 1. We, Ministers and Plenipotentiaries of the Members of the World Health Organization and the Food and Agriculture Organization of the United Nations, assembled
WFP Ethiopia Drought Emergency Household Food Security Bulletin #1
 WFP Ethiopia Drought Emergency Household Food Security Bulletin # BULLETIN # This bulletin presents the results of the first round of data collection to monitor the 206 food sector response to the ongoing
Tools for Monitoring Dietary Diversity & Frequency of Vitamin A intake
 Tools for Monitoring Dietary Diversity & Frequency of Vitamin A intake Temesgen F. Bocher, and Jan Low International Potato Center MLE-COP Meeting Kigali, 28 April 2016 OBJECTIVE Review the different DD
THE ROME ACCORD ICN2 zero draft political outcome document for 19 November 2014
 THE ROME ACCORD ICN2 zero draft political outcome document for 19 November 2014 We,..., assembled at the Second International Conference on Nutrition, on 19-21 November 2014, to address the multiple threats
Assessment of pediatric malnutrition and household food insecurity in Kisii and Nyamira, Kenya
 Assessment of pediatric malnutrition and household food insecurity in Kisii and Nyamira, Kenya Kevin Forey, MD-MBA Health Administration, Class of 2018 Blair Gifford, PhD Professor of Management and Health
Women s Empowerment in Agriculture Index (WEAI) 101 Workshop
 101 Workshop") Women s Empowerment in Agriculture Index (WEAI) 101 Workshop WELCOME U.S. GOVERNMENT PARTNERS INTRODUCTIONS Please share: Your name Your organization, title and/or role OBJECTIVES By the end of this session,
Women s Empowerment in Agriculture Index (WEAI) 101 Workshop WELCOME U.S. GOVERNMENT PARTNERS INTRODUCTIONS Please share: Your name Your organization, title and/or role OBJECTIVES By the end of this session,
Canada s Food Supply: A Preliminary Examination of Changes,
 Canada s Food Supply: A Preliminary Examination of Changes, 1992-2002 Canada's Food Guide to Healthy Eating, released in 1992, is a key nutrition education tool for Canadians aged four years and over.
DIETARY DIVERSITY SCORE IN SEVERE ACUTE MALNUTRITION PATIENTS AT KIMBE PROVINCIAL HOSPITAL. Dr Rachael Masta Diploma in Child Health, 2017
 DIETARY DIVERSITY SCORE IN SEVERE ACUTE MALNUTRITION PATIENTS AT KIMBE PROVINCIAL HOSPITAL Dr Rachael Masta Diploma in Child Health, 2017 INTRO Malnutrition is an ongoing problem being faced all over our
The State of Food and Agriculture 2013: Food systems for better nutrition Questions and Answers
 The State of Food and Agriculture 2013: Food systems for better nutrition Questions and Answers What is malnutrition? Malnutrition is an abnormal physiological condition caused by inadequate, unbalanced
Functions of Food. To provide us with energy and keep us active. For growth and repair of the. body. To stop us from feeling hungry.
 Functions of Food To provide us with energy and keep us active. For growth and repair of the body. To stop us from feeling hungry. To keep us healthy and fight diseases. Nutrients Macro/Micro Nutrient
HEALTHY DIETS THROUGH AGRICULTURE AND FOOD SYSTEMS
 HEALTHY DIETS THROUGH AGRICULTURE AND FOOD SYSTEMS Understanding the difference between diet, meals, snacks and foods Diet: this refers to everything you consume (food, drink and snacks). Diets in this
Food consumption and nutritional status of people living with HIV/AIDS (PLWHA): a case of Thika and Bungoma Districts, Kenya
: a case of Thika and Bungoma Districts, Kenya") Public Health Nutrition: 13(4), 475 479 doi:10.1017/s1368980009990826 Food consumption and nutritional status of people living with HIV/AIDS (PLWHA): a case of Thika and Bungoma Districts, Kenya Elizabeth
Public Health Nutrition: 13(4), 475 479 doi:10.1017/s1368980009990826 Food consumption and nutritional status of people living with HIV/AIDS (PLWHA): a case of Thika and Bungoma Districts, Kenya Elizabeth
The Whole Village Project. Summary of Mbushi, Iramba Ndogo, Sapa, and Makao in Meatu District
 The Whole Village Project Summary of Mbushi, Iramba Ndogo, Sapa, and Makao in Meatu District January 2011 INTRODUCTION The purpose of this report is to present district officials and local leaders with
Food Consumption Pattern and Dietary Diversity
 12Round I survey of CFPR phase II Food Consumption Pattern and Dietary Diversity Chowdhury SB Jalal, Nuzhat Choudhury and Munshi Suliman INTRODUCTION This chapter provides information about the quantities
From malnutrition to nutrition security
 From malnutrition to nutrition security Martin W. Bloem, MD, PhD Senior Nutrition Advisor/WFP Global Coordinator UNAIDS World Food Program Nurturing development: Improving human nutrition with animal-source
Healthy Eating. Eating healthily is about eating the right amount of food for your energy needs. Based on the eatwell plate, you should try to eat:
 Healthy Eating The eatwell plate shows the different types of food we need to eat and in what proportions to have a wellbalanced and healthy diet. It's a good idea to try to get this balance right every
The Whole Village Project
 The Whole Village Project Summary of Leguruki, Kingori, Malula Samaria, and Njoro in Arumeru District March 2011 1 Introduction Whole Village Project Arumeru District, March 2011 INTRODUCTION The purpose
HIGHLIGHTING NUTRITIONAL SECURITY: A KEY COMPONENT OF FOOD SECURITY. Delia B. Rodriguez-Amaya
 HIGHLIGHTING NUTRITIONAL SECURITY: A KEY COMPONENT OF FOOD SECURITY Delia B. Rodriguez-Amaya Food Security sufficient, safe and nutritious food for all The State of Food Insecurity in the World Food and
Uganda Fortification Assessment Coverage Tool: (FACT) Overview and Results Kampala, Uganda 23 May 2016
 Overview and Results Kampala, Uganda 23 May 2016") Uganda Fortification Assessment Coverage Tool: (FACT) Overview and Results Kampala, Uganda 23 May 2016 www.gainhealth.org Background 2 Background and Rationale High burden of malnutrition in Uganda National
Uganda Fortification Assessment Coverage Tool: (FACT) Overview and Results Kampala, Uganda 23 May 2016 www.gainhealth.org Background 2 Background and Rationale High burden of malnutrition in Uganda National
Sustainable Diets Healthy Eating, Healthy Planet
 HL23.1 REPORT FOR ACTION Sustainable Diets Healthy Eating, Healthy Planet Date: November 10, 2017 To: Board of Health From: Medical Officer of Health Wards: All SUMMARY This report highlights the features
Monitoring and Evaluation: what, why and how?
 BUILDING CAPACITIES FOR BETTER... Monitoring and Evaluation: what, why and how? Adapted from presentations by Jody Harris International Food policy Research Institute (IFPRI) Elliot Vhurumuku World Food
Mathare Sentinel Surveillance Report, April 2009
 Mathare Sentinel Surveillance Report, April 2009 SUMMARY OF KEY FINDINGS Compared to the January round of surveillance result, the GAM prevalence rate for Mathare in April, based on LQAS decision rule,
WFP and the Nutrition Decade
 WFP and the Nutrition Decade WFP s strategic plan focuses on ending hunger and contributing to a revitalized global partnership, key components to implement and achieve the Sustainable Development Goals
UGRC 145: FOOD AND NUTRITION IN EVERYDAY LIFE
 UGRC 145: FOOD AND NUTRITION IN EVERYDAY LIFE Session 6 FOOD RESOURCES Lecturer: PROF. MATILDA STEINER-ASIEDU, SBS, CBAS; University of Ghana, Email: tillysteiner@gmail.com College of Education School
Solomon Islands Food and Nutrition Security Profiles
 Key Indicators Solomon Islands Food and Nutrition Security Profiles Solomon Islands has experienced stagnation in percapita GDP and undernourishment in recent years. Dietary Energy Supply (DES) has continued
MILK, SUSTAINABILITY AND NUTRITION DAIRY FARMERS OF CANADA
 MILK, SUSTAINABILITY AND NUTRITION SHARING PERSPECTIVES How will I contribute to the conversation today? DFC s team of health professionals, train and engage with thousands of key food influencers each
TARINA District Fact Sheet on Dietary Diversity
 Introduction This fact sheet presents the status of dietary diversity for women and households in four districts of eastern India: Munger (Bihar), Maharajganj (Uttar Pradesh), Kandhamal and Kalahandi (Odisha).
Myanmar Food and Nutrition Security Profiles
 Key Indicators Myanmar Food and Nutrition Security Profiles Myanmar has experienced growth in Dietary Energy Supply (DES). Dietary quality remains poor, low on protein and vitamins and with high carbohydrates.
Myanmar - Food and Nutrition Security Profiles
 Key Indicators Myanmar - Food and Nutrition Security Profiles Myanmar has experienced growth in Dietary Energy Supply (DES). Dietary quality remains poor, low on protein and vitamins and with high carbohydrates.
Prospective study on nutrition transition in China
 Prospective study on nutrition transition in China Fengying Zhai, Huijun Wang, Shufa Du, Yuna He, Zhihong Wang, Keyou Ge, and Barry M Popkin The aim of the prospective study reported here was to examine
Developing Good Eating Habits in Children
 1 Developing Good Eating Habits in Children While children are young, they need to develop good eating habits that will last their lifetime. Mealtime is the ideal opportunity to set an example by creating
Integration and scaling up of the MDD- W module into the Household Budget Survey (HBS) in Tajikistan
 in Tajikistan") FAO-EU Joint Workshop to promote the workshop to promote the uptake and dissemination of the MDD-W Integration and scaling up of the MDD- W module into the Household Budget Survey (HBS) in Tajikistan Tajikistan
FAO-EU Joint Workshop to promote the workshop to promote the uptake and dissemination of the MDD-W Integration and scaling up of the MDD- W module into the Household Budget Survey (HBS) in Tajikistan Tajikistan
Integrating Gender and Nutrition into the Data Collection & Analysis Phase of International Livestock Research Projects
 Integrating Gender and Nutrition into the Data Collection & Analysis Phase of International Livestock Research Projects Dr. Kathleen Colverson Lead, Gender in Livestock Systems with assistance from: Lacey
Food and Nutrition at the Queen Victoria Market
 Food and Nutrition at the Queen Victoria Market Introduction to food and nutrition at the Queen Victoria Market On any full market day, shoppers can choose from 80 fruit and vegetable traders, 34 delicatessens,
Food Systems for Better Nutrition: opportunities in Latin America and the Caribbean
 Food Systems for Better Nutrition: opportunities in Latin America and the Caribbean A perspective and experiences from FAO Charlotte Dufour Nutrition Division FAO Economic and Social Department 2013 Food
What are your best tips for eating on a budget?
 What are your best tips for eating on a budget? 1. Eliminate packaged foods. 2. Eliminate prepared foods. 3. Eliminate brand name foods. 4. Eliminate imported foods. 5. Buy in season. 6. Buy locally to
Russian food consumption patterns during economic transition and its effects on the prevalence of chronic diseases
 Russian food consumption patterns during economic transition and its effects on the prevalence of chronic diseases C. Burggraf; T. Glauben; R. Teuber IAMO Forum 2014 25/Jun/2014 Overview 1 Motivation 2
The Whole Village Project. Summary of Engaruka, Migombani, Naitolia, and Selela in Monduli District
 The Whole Village Project Summary of Engaruka, Migombani, Naitolia, and Selela in Monduli District July 2010 1 INTRODUCTION The purpose of this report is to present district officials and local leaders
Public Health and Nutrition in Older Adults. Patricia P. Barry, MD, MPH Merck Institute of Aging & Health and George Washington University
 Public Health and Nutrition in Older Adults Patricia P. Barry, MD, MPH Merck Institute of Aging & Health and George Washington University Public Health and Nutrition in Older Adults n Overview of nutrition
Country Report: Sweden General Conclusions Basic Facts Health and Nutrition Health Related Initiatives Climate Change
 Country Report: Sweden General Conclusions Basic Facts Health and Nutrition Health Related Initiatives Climate Change General conclusion Health in Sweden has improved for many decades Many health problems
Learning Lab Data dive Mobile for Nutrition. mvam for Nutrition Part I revolutionizing collection of nutrition information
 Learning Lab Data dive Mobile for Nutrition mvam for Nutrition Part I revolutionizing collection of nutrition information Mobile Vulnerability Analysis and Mapping (mvam) PROJECT OVERVIEW Respondents are
Did You Know? Appropriate Guidelines When Planning Meals and Snacks
 Did You Know? The safest environmental art projects include watercolor paints, rather than oil-based. Also, you can make your own glue or modeling dough. The ingredients are more environmentally friendly,
Assessment of Intra-Household Nutritional Status in A Rural Nigerian Population
 212 International Conference on Nutrition and Food Sciences IPCBEE vol. 39 (212) (212) IACSIT Press, Singapore Assessment of Intra-Household Nutritional Status in A Rural Nigerian Population Helen Henry-Unaeze
AFGHANISTAN. Nutrition & Mortality SMART survey preliminary report. Nangarhar province, Afghanistan. Date: December 2014
 AFGHANISTAN Nutrition & Mortality SMART survey preliminary report Nangarhar province, Afghanistan Date: December 2014 Authors: Hassan Ali Ahmed, Dr Baidar Bakht Funded by: Action Contre la Faim ACF is
Implications of a Healthier U.S. Food Stamp Program
 Implications of a Healthier U.S. Food Stamp Program Julian M. Alston Department of Agricultural and Resource Economics University of California, Davis Presented at the International Health Economics Association
A Simple Method of Measuring Dietary Diversity at Population Level
 A Simple Method of Measuring Dietary Diversity at Population Level NP Steyn, D Labadarios, JH Nel Social science that makes a difference Date: Introduction Determining dietary diversity in RSA adults has
Nutrition Through the Stages of CKD Stage 4 June 2011
 Nutrition Through the Stages of CKD When you have chronic kidney disease, nutrition is an important part of your treatment plan. Your recommended diet may change over time if your kidney disease gets worse.
A Comparison of Food Consumption Pattern in Rural and Urban Areas of Bangladesh between 2005 and 2010
 A Comparison of Food Consumption Pattern in Rural and Urban Areas of Bangladesh between 2005 and 2010 Sadika S a, b*, Mohd Isa B b, Wan Abdul Manan WM b a Department of Rural Sociology, Bangladesh Agricultural
Guidelines for measuring DIETARY DIVERSITY
 AGN seminar 26.10.2011 Guidelines for measuring DIETARY DIVERSITY A simple tool for developing and evaluating food and nutrition security interventions Maylis Razes & Marie-Claude Dop Nutrition and Consumer
WFP Ethiopia Drought Emergency Household Food Security Monitoring Bulletin #2
 WFP Ethiopia Drought Emergency Household Food Security Monitoring Bulletin #2 BULLETIN #2 This bulletin presents the results of the second round of data collection to monitor the 216 Food Sector response
Nutrition-Sensitive Extension
 Nutrition-Sensitive Extension LECTURER GUIDE Nutrition-sensitive extension Pre-assessment After reading through the module overview and introduction, complete the following pre-assessment in order to
Be Healthy. Nutrition and Food Security
 Be Healthy Nutrition and Food Security Texas Health and Human Services HHS oversees the operation of the health and human services system. HHS has responsibility for strategic leadership, administrative
Household Dietary Diversity Score (HDDS) for Measurement of Household Food Access: Indicator Guide. Anne Swindale Paula Bilinsky.
 for Measurement of Household Food Access: Indicator Guide. Anne Swindale Paula Bilinsky.") Household Dietary Diversity Score (HDDS) for Measurement of Household Food Access: Indicator Guide Anne Swindale Paula Bilinsky March 2005 Food and Nutrition Technical Assistance Project (FANTA) Academy
Household Dietary Diversity Score (HDDS) for Measurement of Household Food Access: Indicator Guide Anne Swindale Paula Bilinsky March 2005 Food and Nutrition Technical Assistance Project (FANTA) Academy
Chapter 14. Hunger at Home and Abroad. Karen Schuster Florida Community College of Jacksonville. PowerPoint Lecture Slide Presentation created by
 Chapter 14 Hunger at Home and Abroad PowerPoint Lecture Slide Presentation created by Karen Schuster Florida Community College of Jacksonville Copyright 2008 Pearson Education, Inc., publishing as Pearson
Animal-source foods & Maternal and Child Nutrition
 Animal-source foods & Maternal and Child Nutrition in resource-limiting settings Paula Dominguez-Salas RVC, ILRI, LCIRAH & Julia de Bruyn University of Sydney Nutritional contributions of animal-source
Laos - Food and Nutrition Security Profiles
 Key Indicators Laos - Food and Nutrition Security Profiles In Lao PDR, GDP per capita has increased consistently during recent years, as has Dietary Energy Supply (DES) per person. Nevertheless, undernutrition
NATIONAL NUTRITION WEEK 2012: A Food Guide to Healthy Eating
 NATIONAL NUTRITION WEEK 2012: A Food Guide to Healthy Eating September 2012 INTRODUCTION This serves as a background document highlighting the key messages to be used throughout National Nutrition Week
Chapter 1: Food, Nutrition, and Health Test Bank
 Chapter 1: Food, Nutrition, and Health Test Bank MULTIPLE CHOICE 1. Promoting a health care service that improves diabetes management for the elderly in a community would assist in which of the following?
IANDA New Indicators of the Cost of Nutritious Diets
 IANDA New Indicators of the Cost of Nutritious Diets Collaborators: Joyce Kinabo & Fulgence Mishili Sokoine University of Agriculture (Tanzania) Anna Herforth, Columbia University (USA) William A. Masters,
Post-Nargis Periodic Review I
 Post-Nargis Periodic Review I 9 Section 2: Fi n d i n g s This section presents the findings of both the quantitative and qualitative research conducted for the first round of the Periodic Review. Information
Case study Cost of the cheapest adequate diet and households ability to afford it Lindi Rural District / Tanzania. Introduction
 Case study Cost of the cheapest adequate diet and households ability to afford it Lindi Rural District / Tanzania Introduction This paper presents a case study from Tanzania comparing the cost of the cheapest
Welcome & Introduction Yes No Comments and/or Changes
 Washington State Snap-Ed Curriculum Fidelity for Continuous Improvement Lesson Assessment Tool for Show Me Nutrition: Grade 5 Lesson 8: Go Lean with Protein Educator Self-Assessment Supervisor Assessment
Policy Brief. Connecting the dots between supplementary feeding and school gardens
 Policy Brief Connecting the dots between supplementary feeding and school gardens Introduction The Philippine National Nutrition Survey conducted by the Food and Nutrition Research Institute of the Department
Trends in food availability in MALTA the DAFNE V project
 Trends in food availability in MALTA the DAFNE V project Lucienne Pace 1, Etienne Caruana 2 and Nicola Camilleri 2 1 Health Promotion Department, Ministry of Health, Malta 2 National Statistical Office,
The Evolving Global Nutrition Situation: Why Forests and Trees Matter
 The Evolving Global Nutrition Situation: Why Forests and Trees Matter Bronwen Powell Pennsylvania State University, USA Areas of Changing Understanding: 1. Forests and Conservation vs. Food Production
Basic Nutrition. The Basics of Nutrition. The Six Basic Nutrients. calories. How it Works. How it works 10/5/16
 Basic Nutrition The Basics of Nutrition Nutrition: The study of how your body uses the food that you eat Nutrient: a chemical substance in food that helps maintain the body The Six Basic Nutrients Carbohydrates
DIETARY PRACTICES, MORBIDITY PATTERNS AND NUTRITIONAL STATUS OF LACTATING MOTHERS AMONG PASTORALIST COMMUNITIES IN ISIOLO COUNTY, KENYA
 DIETARY PRACTICES, MORBIDITY PATTERNS AND NUTRITIONAL STATUS OF LACTATING MOTHERS AMONG PASTORALIST COMMUNITIES IN ISIOLO COUNTY, KENYA KAHURO EVAH WAIRIMU (BSC FND) H60/CTYIPT/21270/2012 DEPARTMENT OF
Integrating Gender and Nutrition into the Design Phase of International Livestock Research Projects
 Integrating Gender and Nutrition into the Design Phase of International Livestock Research Projects Gender and Nutrition Webinar I May 30, 2018 Photo Credit Goes Here Who We Are: Gender And Nutrition Cross-Cutting
Food Choices. Food Choices. Food Choices. Food Choices. Food Choices. Introduction to Nutrition ALH 1000 Chapter 1 & 2
 Introduction to Nutrition ALH 1000 Chapter 1 & 2 An Overview Of Nutrition And Planning A Healthy Diet Instructor Bonnie Bennett-Campbell, RN MSN Food and Nutrition Play a Significant Role in Life An Individual
UNICEF/CDC/WHO Elderly Assessment in Government Controlled Areas of Donetsk and Luhansk oblasts and Non- Government controlled areas of Donetsk
 UNICEF/CDC/WHO Elderly Assessment in Government Controlled Areas of Donetsk and Luhansk oblasts and Non- Government controlled areas of Donetsk April 2016 Nutrition Sub-Cluster of the Health and Nutrition
WHY DO WE NEED FOOD? FOOD AND DIET
 WHY DO WE NEED FOOD? FOOD AND DIET Food gives us the energy required for chemical reaction to keep us alive Energy also required for many activities and to maintain body temperature Food also gives us
DRAFT 1. Cooking and Eating Together Messages 2. Make meals and memories together. It s a lesson they ll use for life.
 DRAFT 1 Lesson Title: Depression Cooking Grade Level: 9-12 Subject Area: Social Studies Setting: Garden and Classroom Instructional Time: 60 min. High School Content Expectations: USHG ERA 7 7.1.2 Causes
I know what I eat affects my health, so how do I ensure I m meeting all my nutritional needs? Improve your nutrition. Improve your life.
 YOUR GUIDE TO NUTRITION DURING I know what I eat affects my health, so how do I ensure I m meeting all my nutritional needs? Improve your nutrition. Improve your life. HEALING AT It s time to return home
Personal Touch Food Service will ensure all consumers have access to varied and nutritious foods consistent with promoting health and wellness.
 Nutrition Guidelines It is well accepted that consumer eating habits are greatly influenced by the types and quantities of foods made available to them. Personal Touch Food Service is committed to supporting
9.NPA.2 Create strategies to consume a variety of nutrient- dense foods and beverages and to consume less nutrient- dense foods in moderation.
 Essential Standard 9.NPA.2 Create strategies to consume a variety of nutrient- dense foods and beverages and to consume less nutrient- dense foods in moderation. Clarifying Objective 9.NPA.2.1 Plan vegetarian
4 Nutrient Intakes and Dietary Sources: Micronutrients
 Nutrient Intakes and Dietary Sources: Micronutrients New Zealanders obtain the energy and nutrients they require from a wide variety of foods and beverages, and in some cases from dietary supplements as
Renewable World Global Gender Equality Policy
 Version 1.0 of the policy approved by the Renewable World Board on 20th November 2018. Purpose This policy outlines Renewable World s approach to gender inclusion when designing and delivering our programmes
Considerations in calculating flour consumption in a country. Janneke H. Jorgensen, World Bank
 Considerations in calculating flour consumption in a country Janneke H. Jorgensen, World Bank 1 Overview Why calculate flour consumption Factors to be considered Potential sources and quality of data National
Water Use for Food Production, Nutrition and Health WRC Dialogue - 17 October Friede Wenhold
 Water Use for Food Production, Nutrition and Health WRC Dialogue - 17 October 2014 Friede Wenhold Aim of presentation: To o highlight food and nutrition findings, o present a ranking of water use / productivity
VIRGINIA COOPERATIVE EXTENSION SERVICE
 VIRGINIA COOPERATIVE EXTENSION SERVICE VIRGINDl 'IECH VIRGINDl S'Dtt.E Blacksburg, Virginia 24061 Publication 348-337 August 1984 Lesson 3 Diet, Exercise, and Behavior Modification (Weight Control by Mail)
THE CONSUMER COMES FIRST MYTH OR REALITY?
 THE CONSUMER COMES FIRST MYTH OR REALITY? PROFILING SOUTH AFRICA Population: 48+ million Almost 50/50 males to females 35% children
STRETCHING YOUR FOOD $ Leader Lesson
 STRETCHING YOUR FOOD $ Leader Lesson YOUR BEST MONEY SAVING TIP Discuss your best money saving tips for grocery shopping with the 3-4 people around you Everyone decide which is the best tip and share it
Mediterranean Diet. The word Mediterranean refers to the origins of the diet, rather than to specific foods such as Greek or Italian foods.
 Mediterranean Diet http://patient.info/health/mediterranean-diet The Mediterranean Diet is rich in vegetables, fruit, peas and beans (legumes) and grains. It also contains moderate amounts of chicken and
A SYSTEMATIC REVIEW OF THE IMPACT OF AGRICULTURAL INTERVENTIONS ON NUTRITIONAL STATUS OF CHILDREN
 A SYSTEMATIC REVIEW OF THE IMPACT OF AGRICULTURAL INTERVENTIONS ON NUTRITIONAL STATUS OF CHILDREN Edoardo Masset 21/02/2011 ACKNOWLEDGMENTS Edoardo Masset (IDS) Lawrence Haddad (IDS) Alex Cornelius (IDS)
Complementary feeding practices and nutritional status of children 6-23 months in Kitui County, Kenya
 Journal of Applied Biosciences 85:7881 7890 ISSN 1997 5902 Complementary feeding practices and nutritional status of children 6-23 months in Kitui County, Kenya Kimiywe J. and Chege P. M Prof. Judith Kimiywe-
Media centre Obesity and overweight
 1 of 5 06/05/2016 4:54 PM Media centre Obesity and overweight Fact sheet N 311 Updated January 2015 Key facts Worldwide obesity has more than doubled since 1980. In 2014, more than 1.9 billion adults,
Brunei Darussalam - Food and Nutrition Security Profiles
 Key Indicators Brunei Darussalam Food and Nutrition Security Profiles Brunei Darussalam has one of the highest rates of GDP per capita and of Dietary Energy Supply (DES) per person in the region. For decades,
DIETARY DIVERSITY. Sandra Remancus, FANTA Abizari Abdul-Razak, University of Development Studies, Ghana. Peggy Koniz-Booher,
 DIETARY DIVERSITY Sandra Remancus, FANTA Abizari Abdul-Razak, University of Development Studies, Ghana Food and Nutrition Technical Assistance III Project (FANTA) Margaret Armar-Klemesu, FHI 360 1825 Connecticut
Monitoring, Evaluation, Accountability, Learning (MEAL) Enabling Environment Finance for. Nutrition
 Enabling Environment Finance for. Nutrition") Monitoring, Evaluation, Accountability, Learning (MEAL) 2016 2020 COUNTRY DASHBOARD Kyrgyzstan The MEAL Results Framework identifies a wide range of desired results and associated indicators of progress
Monitoring, Evaluation, Accountability, Learning (MEAL) 2016 2020 COUNTRY DASHBOARD Kyrgyzstan The MEAL Results Framework identifies a wide range of desired results and associated indicators of progress
The key to a healthy balanced diet is eating the right amount of food for how active you are and eating a range of foods including:
 FACTSHEET No. 22 BREAD AS PART OF A HEALTHY DIET Background There is increasingly persuasive evidence that our diets have a significant effect on our long term health. Not only does being over or underweight
The purpose of this report is to provide feedback to relevant Councils to help inform decision making on key issues.
 Store Nutrition Report Final Store Turnover Food and Nutrition Results Nganampa Health Council March 2013 Amanda Lee and Jamie Sheard Summary This report provides food and nutrition information about the
JIGSAW READING CARBOHYDRATES
 Date: CARBOHYDRATES Carbohydrates provide an important source of energy for our bodies. There are two types of carbohydrates: Sugars are found in foods which taste sweet like candies, jams and desserts.
PERFORMANCE FUELING GUIDELINES
 PERFORMANCE FUELING GUIDELINES Although good eating habits cannot substitute for physical training and genetic endowment, proper daily diet, training and game diet, plus appropriate supplemental choices
Food Specialisations
 Food Specialisations Technologies: Design and Technologies Technologies and Society How people use and develop food related technologies: Reducing food waste Food processing Packaging/Transport Growing
Older Americans Need To Make Every Calorie Count
 Older Americans Need To Make Every Calorie Count Joanne F. Guthrie and Biing-Hwan Lin Joanne F. Guthrie (202) 694-5373 jguthrie@ers.usda.gov Biing-Hwan Lin (202) 694-5458 blin@ers.usda.gov Guthrie is a
Hunger Awareness Meal. Bring to life the challenges faced by hungry children and families in your community and around the world.
 Hunger Awareness Meal Bring to life the challenges faced by hungry children and families in your community and around the world. CLUB ACTIVITY // Hunger Awareness Meal Food insecurity is an intensely personal
Unit 5L.4: Food. Know that humans require food as an energy source. Know that a balanced diet must contain proteins, fats,
 Unit 5L.4: as an energy source Balanced diet Requirements for different lifestyles Science skills: Observing Classifying By the end of this unit you should: Know that humans require food as an energy source.
Warm up # 76. What do you think the difference is between fruits and vegetables? Warm up # 77
 Warm up # 76 What do you think the difference is between fruits and vegetables? Warm up # 77 Which of these are vegetables and which of these are fruits? Apples Tomatoes Onions Pumpkin Lettuce Broccoli