Wellness County Profile GARFIELD
|
|
|
- Tyler Marsh
- 6 years ago
- Views:
Transcription
1 Wellness County Profile 2018 GARFIELD
2 OKLAHOMA MAPS
3
4
5
6
7
8
9
10
11
12
13
14

 3.2% American Indian & Alaska Native (NH) 3.")


15 GARFIELD Insurance Coverage Population 62,603 Unemployment Rate ( ) High School Dropouts: Class of 16 Uninsured Insured 16.5% Garfield 3.9 Garfield 8.8% 83.5% Oklahoma 4.7 Oklahoma 7.2% Oklahoma Uninsured 16.1% Poverty Race Age Groups Below Poverty Above Poverty White (NH) 74.9% 65 Years & Over 15.8% 14.5% African American (NH) 3.2% American Indian & Alaska Native (NH) 3.1% Under 18 Years 25.8% 85.5% Asian (NH) 1.4% Two or more Races 3.8% Under 5 Years 7.5% Oklahoma Poverty 16.3% Hispanic or Latino 12.5% Sources 1. United States Census Bureau, State and County Quick Facts, Unemployment rate data based on U,S, Bureau of Labor Statistics, High School Dropouts data provided by the Office of Accountability using data from the Oklahoma State Department of Education.
-Authorized Retailers, 2016 11.1 9.4 WIC (Women, Infants & Children)-Authorized Food Store, 2011 24.7 22.")
 High Healthy Food Access (High Access) 0.0% Moderate Healthy Food Access (Moderate Access) 59.")
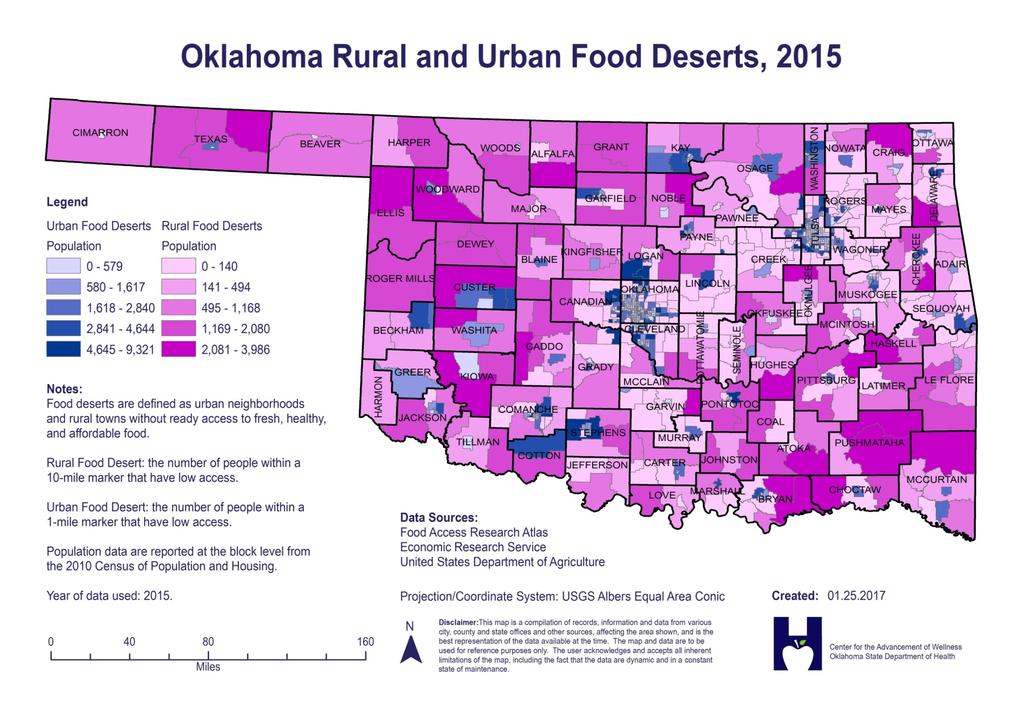
16 Community Food Retail Environment GARFIELD Status Oklahoma Establishments (rate per 100,000 population) Fast Food Restaurants, Grocery Stores, SNAP (Supplemental Nutrition Assistance Program)-Authorized Retailers, WIC (Women, Infants & Children)-Authorized Food Store, Food Access Food Desert Prevalence, % 47.8% Low Income Population with Low Food Access Prevalence, % 25.1% Modified Retail Food Environmental Index (percent of population) High Healthy Food Access (High Access) 0.0% Moderate Healthy Food Access (Moderate Access) 59.1% Low Healthy Food Access (Low Access) 17.1% No Healthy Food Outlet (Poor Access) 22.7% No Food Outlet (No Access) 1.1% Sources 1.Community Commons (2012). Retrieved November, 2017, from a.us Census Bureau, County Business Patterns. Additional data analysis by CARES Source geography: County b.us Department of Agriculture, Food and Nutrition Service, USDA - SNAP Retailer Locator. Additional data analysis by CARES Source geography: Tract c. US Department of Agriculture, Economic Research Service, USDA - Food Access Research Atlas Source geography: County d.us Department of Agriculture, Economic Research Service, USDA - Food Access Research Atlas Source geography: Tract e.centers for Disease Control and Prevention, Division of Nutrition, Physical Activity, and Obesity Source geography: Tract Notes *Rate per 100,000 population ^Rate per 10,000 population Status compares county to Oklahoma data
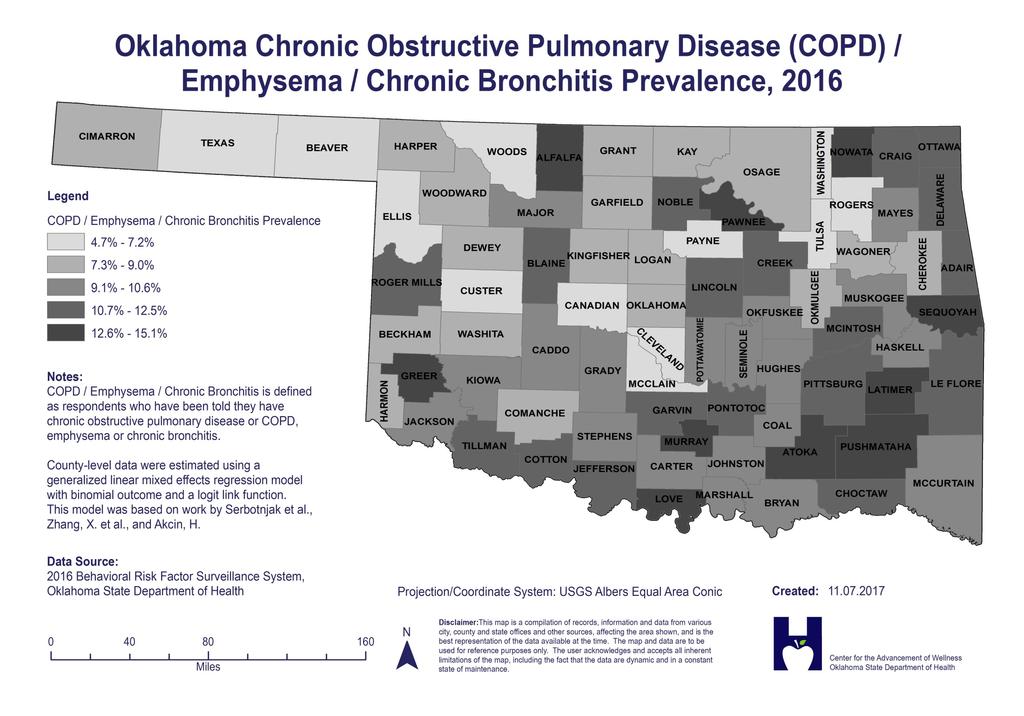
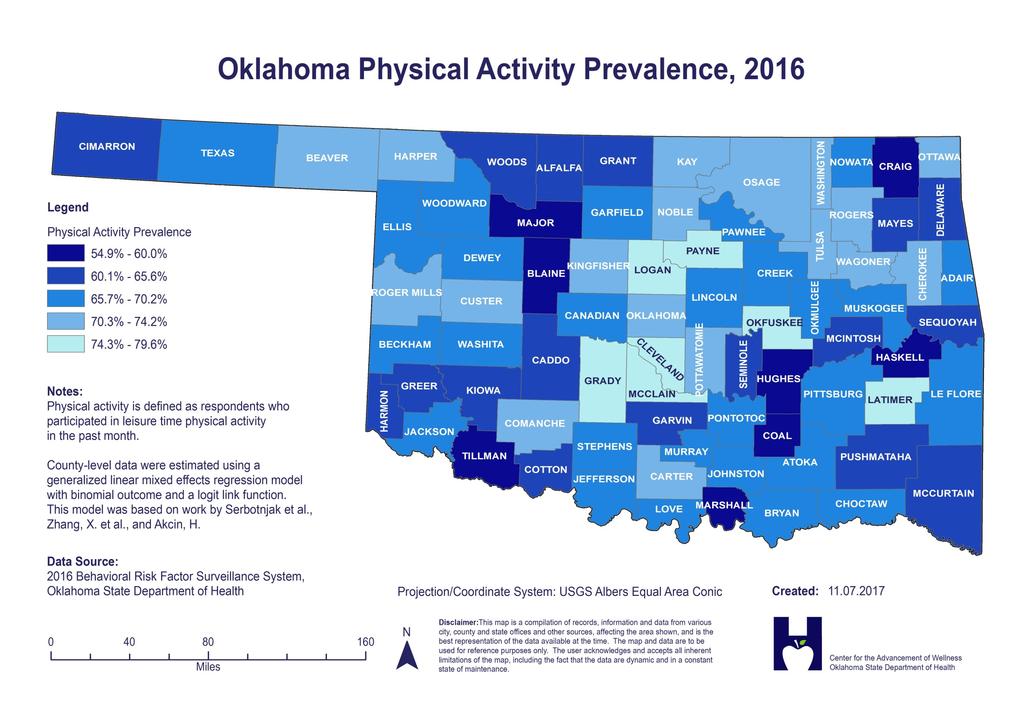
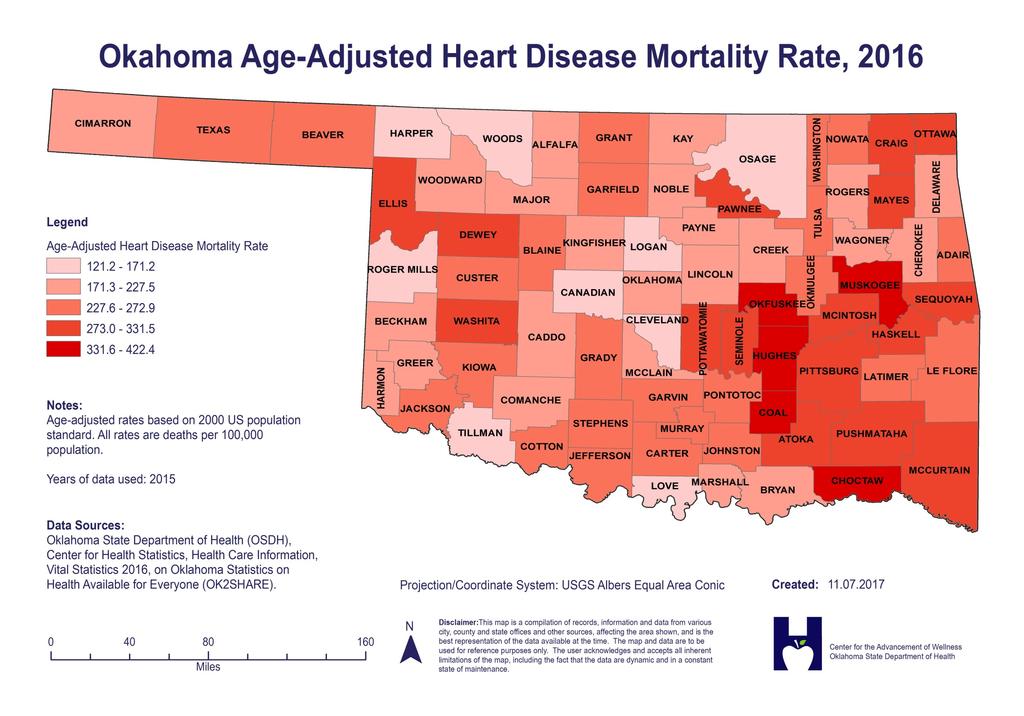
17 Health Outcomes - GARFIELD Trend Status Oklahoma Tobacco Smoking Prevalence 21.0% 25.5% 21.9% 23.4% 21.3% 19.6% COPD* / Emphysema / Chronic Bronchitis Prevalence 6.1% 6.3% 6.4% 6.9% 7.9% 8.3% Obesity Obesity Prevalence 31.2% 35.4% 36.2% 39.3% 37.5% 32.8% Physical Activity Prevalence 71.9% 59.7% 66.4% 63.0% 70.0% 71.5% Minimal Vegetable Consumption Prevalence^ 23.1% 21.8% 21.8% 24.2% 24.2% 24.5% Minimal Fruit Consumption Prevalence^ 47.0% 47.3% 47.3% 49.1% 49.1% 51.1% Diabetes Prevalence 10.5% 9.4% 10.0% 9.9% 9.4% 12.0% Hypertension Prevalence 35.3% 31.2% 31.2% 31.1% 31.1% 36.2% Mortality Heart Disease Age-Adjusted Death Rate Cancer Age-Adjusted Death Rate Notes *Chronic Obstructive Pulmonary Disease ^Consumed < 1 serving of vegetable/fruit per day Age-adjusted rates based on 2000 US population standard. All rates are deaths per 100,000 population. Legend Better than state outcome Status compares county s to Oklahoma Vegetable, Fruit and Hypertension data are only available for odd years; data is carried to even years as placeholders. Sources 1. Oklahoma State Department of Health, Center for Health Statistics, Health Care Information, Behavioral Risk Factor Surveillance System, Oklahoma State Department of Health (OSDH), Center for Health Statistics, Health Care Information, Vital Statistics (OK2SHARE), ± 0.5 from state outcome Worse than state outcome

18 DEATH PERCENTAGES * % 65.2% Garfield Oklahoma 65.7% in Garfield 3 BEHAVIORS 63.7% 64.3% 63.1% 64.7% 64.3% 62.2% 63.6% 62.6% 63.2% 61.6% 63.4% 62.4% 62.5% 61.6% 64.1% 62.9% 62.8% Tobacco Use Poor Diet Sedentary Lifestyle * deaths as a percentage of all causes of death. Deaths include cardiovascular disease, cancer, diabetes, and lung disease. Source: Oklahoma State Department of Health, Center for Health Statistics, Health Care Information, Vital Statistics (OK2SHARE), CHRONIC CONDITIONS DEATH RATES * Garfield Oklahoma Cardiovascular Disease Cancer Diabetes 60% OF DEATHS Lung Disease Three unhealthy behaviors influence four chronic diseases that account for more than 60 percent of all deaths in Garfield county and for more than 60 percent of all deaths in Oklahoma *Age-adjusted rates per 100,000 population. Deaths include cardiovascular disease, cancer, diabetes, and lung disease. Source: Oklahoma State Department of Health, Center for Health Statistics, Health Care Information, Vital Statistics (OK2SHARE),

19 Center for the Advancement of Wellness 1000 N.E. 10 th St. Oklahoma City, OK
Wellness County Profile ROGERS
 Wellness County Profile 2018 ROGERS OKLAHOMA MAPS This image cannot currently be displayed. ROGERS Insurance Coverage Population 91,766 Unemployment Rate (2013-2015) High School Dropouts: Class
Wellness County Profile STEPHENS
 Wellness County Profile 2018 STEPHENS OKLAHOMA MAPS STEPHENS Insurance Coverage Population 44,090 Unemployment Rate (2013-2015) High School Dropouts: Class of 16 Uninsured Insured 15.9% Stephens
Wellness County Profile JOHNSTON
 Wellness County Profile 2018 JOHNSTON OKLAHOMA MAPS JOHNSTON Insurance Coverage Population 11,087 Unemployment Rate (2013-2015) High School Dropouts: Class of 16 Uninsured Insured 19.1% Johnston
Wellness County Profile CRAIG
 Wellness County Profile 2018 CRAIG OKLAHOMA MAPS CRAIG Insurance Coverage Population 14,625 Unemployment Rate (2013-2015) High School Dropouts: Class of 16 Uninsured Insured 18.1% Craig 5.6
Wellness County Profile GARVIN
 Wellness County Profile 2018 GARVIN OKLAHOMA MAPS GARVIN Insurance Coverage Population 27,838 Unemployment Rate (2013-2015) High School Dropouts: Class of 16 Uninsured Insured 16.7% Garvin
Wellness County Profile BECKHAM
 Wellness County Profile 2018 BECKHAM OKLAHOMA MAPS BECKHAM Insurance Coverage Population 22,519 Unemployment Rate (2013-2015) High School Dropouts: Class of 16 Uninsured Insured 15.2% Beckham
Wellness County Profile SEMINOLE
 Wellness County Profile 2018 SEMINOLE OKLAHOMA MAPS SEMINOLE Insurance Coverage Population 25,207 Unemployment Rate (2013-2015) High School Dropouts: Class of 16 Uninsured Insured 18.9% Seminole
Wellness County Profile SEQUOYAH
 Wellness County Profile 2018 SEQUOYAH OKLAHOMA MAPS SEQUOYAH Insurance Coverage Population 41,294 Unemployment Rate (2013-2015) High School Dropouts: Class of 16 Uninsured Insured 18.1% Sequoyah
Wellness County Profile PAYNE
 Wellness County Profile 2018 PAYNE OKLAHOMA MAPS PAYNE Insurance Coverage Population 81,131 Unemployment Rate (2013-2015) High School Dropouts: Class of 16 Uninsured Insured 15.6% Payne 3.9
Wellness County Profile MCCLAIN
 Wellness County Profile 2018 MCCLAIN OKLAHOMA MAPS McCLAIN Insurance Coverage Population 38,682 Unemployment Rate (2013-2015) High School Dropouts: Class of 16 Uninsured Insured 15.3% McClain
HIP Year 2020 Health Objectives related to Perinatal Health:
 PERINATAL HEALTH Perinatal health is the health and wellbeing of mothers and babies before, during, and after child birth. As described by Healthy People 2020, Pregnancy can provide an opportunity to identify
WASHINGTON STATE COMPARISONS TO: KITSAP COUNTY CORE PUBLIC HEALTH INDICATORS May 2015
 WASHINGTON STATE COMPARISONS TO: KITSAP COUNTY CORE PUBLIC HEALTH INDICATORS This is a companion document to the Core Public Health Indicators that provides a comparison of to Washington State for the
Community Health Needs Assessment (CHNA)
") Community Health Needs Assessment (CHNA) Pierce ; St. Croix Contents Demographics... 3 Total Population... 4 Median Age... 6 Population Under Age 18... 8 Population Age 65+... 9 Population with Any Disability...
Community Health Needs Assessment (CHNA) Pierce ; St. Croix Contents Demographics... 3 Total Population... 4 Median Age... 6 Population Under Age 18... 8 Population Age 65+... 9 Population with Any Disability...
In Health Matters, Place Matters - The Health Opportunity Index (HOI) Virginia Department of Health Office of Health Equity
 Virginia Department of Health Office of Health Equity") In Health Matters, Place Matters - The Health Opportunity Index (HOI) Virginia Department of Health Office of Health Equity 1 Identifying the Problem America s Health Rankings United Health Foundation
In Health Matters, Place Matters - The Health Opportunity Index (HOI) Virginia Department of Health Office of Health Equity 1 Identifying the Problem America s Health Rankings United Health Foundation
HealtheCNY Indicator List by Data Source
 American Community Survey 23 Adults with Health Insurance Children Living Below Poverty Level Children with Health Insurance Families Living Below Poverty Level Homeowner Vacancy Rate Homeownership Households
Demographics and Health Data
 Demographics and Health Data Information for Local Planners City of Puyallup, WA Demographic Characteristics Environmental Health Division 3629 South D Street, Tacoma, WA 98418 (253) 798-6470 Table 1 presents
Demographics and Health Data
 Demographics and Health Data Information for Local Planners City of Lakewood, WA Demographic Characteristics Environmental Health Division 3629 South D Street, Tacoma, WA 98418 (253) 798-6470 Table 1 presents
Lawrence County, PA Community Health Needs Assessment
 PA Community Health Needs Assessment June 2013 This Published Data Report is a collaborative project sponsored by: Jameson Health System and The Ellwood City Hospital Compiled by: Carbis Walker LLP Table
Trends in Pneumonia and Influenza Morbidity and Mortality
 Trends in Pneumonia and Influenza Morbidity and Mortality American Lung Association Epidemiology and Statistics Unit Research and Health Education Division November 2015 Page intentionally left blank Introduction
PHACS County Profile Report for Searcy County. Presented by: Arkansas Center for Health Disparities and Arkansas Prevention Research Center
 PHACS County Profile Report for Searcy County Presented by: Arkansas Center for Health Disparities and Arkansas Prevention Research Center Contents Introduction... Page 2 Demographics...Page 3 Social Environment
Health Profile Chartbook 2016 Kalkaska County
 Health Profile Chartbook 2016 Kalkaska County 2016 Chartbooks The 2016 Chartbooks provide a snapshot of the health status of the District Health Department #10 jurisdiction. Information is presented by
Health Profile Chartbook 2016 Mecosta County
 Health Profile Chartbook 2016 Mecosta County 2016 Chartbooks The 2016 Chartbooks provide a snapshot of the health status of the District Health Department #10 jurisdiction. Information is presented by
Some college. Native American/ Other. 4-year degree 13% Grad work
 Access to Affordable Health Care Access to affordable care improves quality of life and health outcomes. Without affordable access to a doctor, residents are more likely to end up in expensive emergency
Healthy People Determinants of Health. County Health Rankings. AHR Indicator. Leading Health Indicators (LHI) CROSSWALK
 CROSSWALK") 1 of 7 CROSSWALK Crosswalk comparing America's Health Rankings' (AHR) indicators with those used by County Health Rankings (CHR) and Healthy People 2020's Leading Health Indicators (LHI). AHR indicators
1 of 7 CROSSWALK Crosswalk comparing America's Health Rankings' (AHR) indicators with those used by County Health Rankings (CHR) and Healthy People 2020's Leading Health Indicators (LHI). AHR indicators
Heart Disease and Stroke in New Mexico. Facts and Figures: At-A-Glance
 Heart Disease and Stroke in New Mexico Facts and Figures: At-A-Glance December H e a r t D i s e a s e a n d S t r o k e Heart disease and stroke are the two most common conditions that fall under the
Community Health Needs Assessment
 Community Health Needs Assessment Gratiot County Community Health Assessment Community Health Assessment Data Sources Primary Data (new data collected first-hand) Community Opinion Survey Provider Opinion
Prepared by Southern Illinois University School of Medicine s Center for Clinical Research And Office of Community Health and Service
 Hospital Sisters Health System Community Health Needs Assessment (FY2015-FY2018) Quantitative and Secondary Data Analysis Report For St. Anthony s Hospital Effingham, Prepared by Southern University School
Disparity Data Fact Sheet General Information
 Disparity Data Fact Sheet General Information Tobacco use is a well-recognized risk factor for many cancers, respiratory illnesses and cardiovascular diseases within Michigan. rates have continued to decline
ELIMINATING HEALTH DISPARITIES IN AN URBAN AREA. VIRGINIA A. CAINE, M.D., DIRECTOR MARION COUNTY HEALTH DEPARTMENT INDIANAPOLIS, INDIANA May 1, 2002
 ELIMINATING HEALTH DISPARITIES IN AN URBAN AREA VIRGINIA A. CAINE, M.D., DIRECTOR MARION COUNTY HEALTH DEPARTMENT INDIANAPOLIS, INDIANA May 1, 2002 Racial and ethnic disparities in health care are unacceptable
2013 Arizona State Health Assessment Summary and Findings. Health and Wellness for all Arizonans
 2013 Arizona State Health Assessment Summary and Findings Health and Wellness for all Arizonans Presentation Overview The State Health Assessment Process Health Indicators 15 Leading Health Issues: o County
2017 PRC Community Health Needs Assessment
 2017 PRC Community Needs Assessment Obici care Foundation Service Area Western Tidewater, Virginia Prepared for: OBICI HEALTHCARE FOUNDATION By Professional Research Consultants, Inc. The PRC Community
Health Care in Appalachia. Foundations of Modern Health Care, Lecture 12 Anya K. Cope, DO
 Health Care in Appalachia Foundations of Modern Health Care, Lecture 12 Anya K. Cope, DO Learning Objectives: At the completion of this exercise, learners should be able to: Discuss the mortality rates
Baseline Health Data Report: Cambria and Somerset Counties, Pennsylvania
 Baseline Health Data Report: Cambria and Somerset Counties, Pennsylvania 2017 2018 Page 1 Table of Contents Executive Summary.4 Demographic and Economic Characteristics 6 Race and Ethnicity (US Census,
Sarpy/Cass Department of Health and Wellness
 This 2012 Community Health Report Card is the product of many community surveys and agency recordkeeping. The staff at the Sarpy/ Department of Health and Wellness finds value in all of this community
Figure 1: COPD Age Adjusted Death Rates Based on the 1940 and 2000 Standard Population,
 Figure 1: COPD Age Adjusted Death Rates Based on the 1940 and 00 Standard Population, 1979-00 Age Adjusted Death Rates per 100,000 Persons 50 45 40 35 30 25 15 10 Years 1979 1980 1981 1982 1983 1984 1985
Mark B Horton, MD, MSPH 22 March 2011
 Mark B Horton, MD, MSPH 22 March 2011 Major Points Need for better data Focus on disparities Focus on social determinants Focus on healthy communities Focus on health care quality Public Health Data Sources
Oakwood Healthcare Community Health Needs Assessment Indicators
 POPULATION Sub-Category Education Socioeconomic Violence High School High School Dropouts Graduation Rate (Percent) Some College Births to Unmarried Women Children in Poverty Children in Singleparent Households
LINCOLN COUNTY HEALTH PROFILE Maine Shared Community Health Needs Assessment
 LINCOLN COUNTY HEALTH PROFILE 2018 Maine Shared Community Health Needs Assessment TABLE OF CONTENTS Introduction... 1 How to Read this Document... 3 Demographics... 5 Past Maine Statewide Priorities...
Santa Clara County Highlights
 Santa Clara County Highlights Data and Partnerships: Pivotal Elements to Create Healthy Communities November 6th, 2009 David Hill, PhD, MPH Cities of Santa Clara County 2 The pivotal elements Data evidence-based
Maryland SHIP Anne Arundel Baseline Data 10/26/2011. MD Baseline. County Baseline. National Baseline
 Arundel Data 10/26/2011 Increase life expectancy in Arundel 1 Reduce infant Arundel 2 deaths Arundel 3 Arundel 4 Arundel 6 Reduce low birth weight (LBW) & very low birth weight (VLBW) Reduce sudden unexpected
Vanderbilt Institute for Medicine and Public Health Women s Health Research Tennessee Women s Health Report Card TENNESSEE DEPARTMENT OF HEALTH
 Vanderbilt Institute for Medicine and Public Health Women s Health Research 2009 Tennessee Women s Health Report Card TENNESSEE DEPARTMENT OF HEALTH 2009 Tennessee Women s Health Report Card Rationale
Indiana Family Nutrition Program Fiscal Year Final Report
 Indiana Family Nutrition Program Fiscal Year 2011-2012 Final Report Submitted to: United States Department of Agriculture Food and Nutrition Service Chicago, Illinois Indiana Family and Social Services
Obesity in Clark County November 3, 2003 Jeanne Palmer, Health Education Manager, CCHD Rayleen Earney, Chronic Disease Health Educator, CCHD
 Obesity in Clark County November 3, 2003 Jeanne Palmer, Health Education Manager, CCHD Rayleen Earney, Chronic Disease Health Educator, CCHD Presented to: Legislative Committee on Health Care Subcommittee
Working Towards Addressing Women s Health Disparities in Arizona
 Working Towards Addressing Women s Health Disparities in Arizona Suncerria Tillis, MBA Arizona Health Disparities Center December 6, 2006 National Conference of State Legislatures Women s Health Pre-Conference
Our Healthy Community Partnership. and the Brown/Black Coalition are. pleased to release the Douglas County Health and
 Our Healthy Community Partnership and the Brown/Black Coalition are pleased to release the 2007 Douglas County Health and Disparities Report Card. This report provides a snapshot of local disparities in
2016 Community Service Plan & Community Health Improvement Plan
 2016 Community Service Plan & Community Health Improvement Plan A.O. Fox Memorial Hospital The Mary Imogene Bassett Hospital (dba: Bassett Medical Center) & Otsego County Health Department Service Area:
Moving Forward in 2010 Health Status by Race and Ethnicity
 Health Status by Race and Ethnicity 2005 Versus 2010 April Young Bennett, MPA Utah Department of Health, Center for Multicultural Health/ Office of Health Disparities Reduction Methods Analysis Years:
Changing Patient Base. A Knowledge to Practice Program
 Changing Patient Base A Knowledge to Practice Program Learning Objectives By the end of this tutorial, you will: Understand how demographics are changing among patient populations Be aware of the resulting
Measuring Equitable Care to Support Quality Improvement
 Measuring Equitable Care to Support Quality Improvement Berny Gould RN, MNA Sr. Director, Quality, Hospital Oversight, and Equitable Care Prepared by: Sharon Takeda Platt, PhD Center for Healthcare Analytics
Community Health Profile: Minnesota, Wisconsin, & Michigan Tribal Communities 2006
 Community Health Profile: Minnesota, Wisconsin, & Michigan Tribal Communities 26 This report is produced by: The Great Lakes EpiCenter If you would like to reproduce any of the information contained in
Walworth County Health Data Report. A summary of secondary data sources
 Walworth County Health Data Report A summary of secondary data sources 2016 This report was prepared by the Design, Analysis, and Evaluation team at the Center for Urban Population Health. Carrie Stehman,
JUSTUS WARREN TASK FORCE MEETING DECEMBER 05, 2012
 SAMUEL TCHWENKO, MD, MPH Epidemiologist, Heart Disease & Stroke Prevention Branch Chronic Disease & Injury Section; Division of Public Health NC Department of Health & Human Services JUSTUS WARREN TASK
Northampton County. State of the County Health Report (SOTCH)
") ampton County 2015 State of the County Health Report (SOTCH) ampton County Health Department 9495 NC Highway 305 P.O. Box 635 Jackson, NC 27845 252-534-5841 John White, Acting Health Director Virginia
ampton County 2015 State of the County Health Report (SOTCH) ampton County Health Department 9495 NC Highway 305 P.O. Box 635 Jackson, NC 27845 252-534-5841 John White, Acting Health Director Virginia
Health of the City & Community Health Improvement Planning. Raynard Washington, PhD, MPH Chief Epidemiologist
 Health of the City & Community Health Improvement Planning Raynard Washington, PhD, MPH Chief Epidemiologist What is the Community Health Assessment (CHA)? An annual assessment of population health in
Are You Ready to Sail. February 11, 2016
 Are You Ready to Sail your SHIP?! February 11, 2016 Acknowledgement and Disclaimer This webinar was supported by funds made available from the Centers for Disease Control and Prevention, Office for State,
PINELLAS HIGHLIGHTS DIET & EXERCISE
 PINELLAS HIGHLIGHTS DIET & EXERCISE DIET & EXERCISE Diet is not simply a matter of discipline. Access and the ability to afford healthy food play a role in food selection. Without enough income or proper
FLHealthCHARTS.com Update List
 Released = New data, statistical brief, or analytic report not previously posted on FLHealthCHARTS. Added = New features or indicators not previously posted on FLHealthCHARTS. Updated = Change to data
Food Insecurity and Food Assistance in Maryland. Stephanie Grutzmacher, PhD UME Family Health Specialist
 Food Insecurity and Food Assistance in Maryland Stephanie Grutzmacher, PhD UME Family Health Specialist Overview Food assistance programs, populations Consumer and health behaviors Needs and opportunities
Adopted by: Adams County Public Hospital District No. 2 Board of Commissioners
 Adopted by: Adams County Public Hospital District No. 2 Board of Commissioners December 21, 2017 Contents Introduction/Overview... 2 Methodology... 3 Service Area Description... 3 Population, Insurance,
Community Health Profile: Minnesota, Wisconsin & Michigan Tribal Communities 2005
 Community Health Profile: Minnesota, Wisconsin & Michigan Tribal Communities 25 This report is produced by: The Great Lakes EpiCenter If you would like to reproduce any of the information contained in
Racial disparities in health outcomes and factors that affect health: Findings from the 2011 County Health Rankings
 Racial disparities in health outcomes and factors that affect health: Findings from the 2011 County Health Rankings Author: Nathan R. Jones, PhD University of Wisconsin Carbone Cancer Center Introduction
IMPACT OF AREA-POVERTY RATE ON LATE-STAGE COLORECTAL CANCER INCIDENCE IN INDIANA, NAACCR JUNE 22, 2017
 IMPACT OF AREA-POVERTY RATE ON LATE-STAGE COLORECTAL CANCER INCIDENCE IN INDIANA, 2010-2014 NAACCR JUNE 22, 2017 Aaron Cocke, Amanda K. Raftery, Timothy McFarlane SECTION 1 OVERVIEW OF PROJECT Purposes
Lane County Health Equity Report
 2017 Health Equity Report Table of Contents Executive Summary.................................................................... 1 Introduction...........................................................................
Overview of Health Disparities in Arkansas
 Overview of Health Disparities in Arkansas Annual Critical Access Hospital Conference August 9, 2018 Joyce Biddle, MPH, MPA Chronic Disease Epidemiologist Office of Minority Health and Health Disparities
Population Percent C.I * 6.3% ± * 20.7% ± % ± * 54.2% ± and older * 59.3% ± 2.9.
 Overview Why Is This Indicator Important? High cholesterol is one of the leading risk factor for heart disease and stroke, the1st and 3 rd leading causes of death in US. How Are We Doing? In 1, 32% Hennepin
Nutrition and Physical Activity
 Nutrition and Physical Activity Lifestyle choices made early in life have a significant impact on the patterns of chronic disease developed in adulthood. In the U.S., poor diet and physical inactivity
BUILT ENVIRONMENT ACCESS TO HEALTHY FOODS
 Importance Definitions The environment in which we live often shapes the choices we make. If our built environment offers mainly fast food restaurants and liquor stores and we have limited transportation,
2012 Assessment of St. Lucie County s Social, Health, and Public Safety Services
 2012 Assessment of St. Lucie County s Social, Health, and Public Safety Services April 5, 2013 140 Intracoastal Pointe Drive, Suite 212 Jupiter, FL 33477-5064 561.744.5662 Fax: 561.575.7396 www.sra-researchgroup.com
Cancer Health Disparities in Tarrant County
 Cancer Health Disparities in Tarrant County A presentation to the Tarrant County Cancer Disparities Coalition May 3, 07 Marcela Gutierrez, LMSW Assistant Professor in Practice UTA School of Social Work
Rural Health Care Trends and Policy Issues Facing Nevada Residents
 Rural Health Care Trends and Policy Issues Facing Nevada Residents John Packham, PhD Director of Health Policy Research Nevada State Office of Rural Health and Office of Statewide Initiatives University
University of Wisconsin School of Medicine and Public Health The County Health Rankings Model of Population Health
 University of Wisconsin School of Medicine and Public Health The County Health Rankings Model of Population Health Institute of Medicine January 21, 2010 Washington DC Outline Background and rationale
FNS. State Agencies. Program Operators Participants
 Ending Hunger Improving Nutrition Combating Obesity FNS State Agencies Program Operators Participants About 1 in 4 Americans participates in at least 1 of the U.S. Department of Agriculture s (USDA) domestic
Northampton County State of the County Health Report (SOTCH)
") Northampton County 2017 State of the County Health Report (SOTCH) Northampton County Health Department 9495 NC Highway 305 P.O. Box 635 Jackson, NC 27845 (252)534-5841 Andy Smith, Health Director Virginia
Northampton County 2017 State of the County Health Report (SOTCH) Northampton County Health Department 9495 NC Highway 305 P.O. Box 635 Jackson, NC 27845 (252)534-5841 Andy Smith, Health Director Virginia
Profile of DeKalb County
 Profile of DeKalb County Figure 1: Population by Race, DeK alb County, 2012 Estimate Table 1: DeK alb County Population Profile Profile of DeKalb County POPULATION ESTIMATES According to the 2008 and 2012
Luna County Community Health Profile
 Luna County Community Health Profile Introduction This profile describes the current health status of the county. With this information, the community can complete an assessment and begin to address specific
Community Health Status Assessment
 Community Health Status Assessment EXECUTIVE SUMMARY The Community Health Status Assessment (CHSA) is one of four assessments completed as part of the 2015-2016 Lane County Community Health Needs Assessment
Service Area: Herkimer, Fulton & Montgomery Counties. 140 Burwell St. 301 N. Washington St. Little Falls, NY Herkimer, NY 13350
 2016 Community Service Plan & Community Health Improvement Plan & Herkimer County Public Health Service Area: Herkimer, Fulton & Montgomery Counties Bassett Healthcare Network s Little Falls Hospital Herkimer
AnMed Health. Community Health Needs Assessment 2015
 AnMed Health Community Health Needs Assessment 2015 Table of Contents I. Executive Summary 2 a. Summary of Findings 2 b. Identified Health Priorities 3 II. About the Research 5 III. Community Served -
This project has the objective to develop preventive medicine teaching cases that will
 STUDENT VERSION This project has the objective to develop preventive medicine teaching cases that will motivate medical be en Community Health Assessment: Onondaga County, New York Donald A. Cibula, PhD
Community Engagement to Address Health Disparities
 Community Engagement to Address Health Disparities Health Disparities Service-Learning Collaborative Meeting April 11, 2007, Toronto, ON Canada Elmer R. Freeman, Executive Director Center for Community
Breast Cancer in Women from Different Racial/Ethnic Groups
 Cornell University Program on Breast Cancer and Environmental Risk Factors in New York State (BCERF) April 2003 Breast Cancer in Women from Different Racial/Ethnic Groups Women of different racial/ethnic
JOINING HANDS: SHARING RESOURCES AND DATA ACROSS SECTORS TO IMPROVE POPULATION HEALTH
 JOINING HANDS: SHARING RESOURCES AND DATA ACROSS SECTORS TO IMPROVE POPULATION HEALTH Virginia Population Health Summit Charlottesville, Virginia March 29, 2017 Steven H. Woolf, MD, MPH Director, Center
Coney Island. Neighborhood Health Profiles Keeping Brooklyn Healthy by Assessing Population Health and Driving Innovation
 Keeping Brooklyn Healthy by Assessing Population Health and Driving Innovation 11223, 11224, 11229, 11235 Neighborhood at a glance Population: 285,502 TBHC Service Areas: Outside the Service Area for The
2014 TRENDS DATA DOCUMENTATION
 2014 TRENDS DATA DOCUMENTATION As described at /measuring-progress/rankingsmeasures, we are making trend graphs available this year for 12 measures. In addition, we are making SAS and CSV files of the
Introduction Female Breast Cancer, U.S. 9/23/2015. Female Breast Cancer Survival, U.S. Female Breast Cancer Incidence, New Jersey
 Disparities in Female Breast Cancer Stage at Diagnosis in New Jersey a Spatial Temporal Analysis Lisa M. Roche, MPH, PhD 1, Xiaoling Niu, MS 1, Antoinette M. Stroup, PhD, 2 Kevin A. Henry, PhD 3 1 Cancer
Quantitative Data: Measuring Breast Cancer Impact in Local Communities
 Quantitative Data: Measuring Breast Cancer Impact in Local Communities Quantitative Data Report Introduction The purpose of the quantitative data report for the Southwest Florida Affiliate of Susan G.
Black Women s Access to Health Insurance
 FACT SHEET Black Women s Access to Health Insurance APRIL 2018 Data released by the U.S. Census Bureau show that, despite significant health insurance gains since the Affordable Care Act (ACA) was implemented,
Overview of Health Care Disparities in Maryland
 Maryland Health Benefit Exchange Plan Management Advisory Committee Overview of Health Care Disparities in Maryland June 18, 2012 Carlessia A. Hussein, RN, DrPH David A. Mann, MD, PhD Office of Minority
Creating a Culture of Health Equity: A Public Health Approach to America s Pressing Health Needs
 Creating a Culture of Health Equity: A Public Health Approach to America s Pressing Health Needs Ali S. Khan, MD, MPH Professor and Dean, College of Public Health, UNMC Assistant Surgeon General (Ret.),
Diabetes: Where You Live Matters! What You Need to Know About Diabetes in Toronto Neighbourhoods. Peter Gozdyra, Marisa Creatore, CRICH
 Diabetes: Where You Live Matters! What You Need to Know About Diabetes in Toronto Neighbourhoods Peter Gozdyra, Marisa Creatore, CRICH 1 Tonight s talk Provide highlights of a large body of work Stimulate
RHP Community Needs Assessment. Katie Coburn, MPH, PMP
 RHP 7 2017 Community Needs Assessment Katie Coburn, MPH, PMP Summary of Themes Affordable Housing and Migration Economic and Health Disparities Chronic Conditions, Prenatal Care, Sexually Transmitted Infections
Enrollment under the Medicaid Expansion and Health Insurance Exchanges. A Focus on Those with Behavioral Health Conditions in Michigan
 Enrollment under the Medicaid Expansion and Health Insurance Exchanges A Focus on Those with Behavioral Health Conditions in Michigan Methods for Estimating Uninsured with M/SU Conditions by FPL From NSDUH,
STUDENT VERSION. Community Health Assessment: Pitt County, North Carolina. Cases in Population-Oriented Prevention (C-POP)-based teaching
-based teaching") STUDENT VERSION This project has the objective to develop preventive medicine teaching cases that will motivate medical students, residents and faculty to improve clinical preventive competencies complemented
STUDENT VERSION This project has the objective to develop preventive medicine teaching cases that will motivate medical students, residents and faculty to improve clinical preventive competencies complemented
Cascade Pacific Action Alliance Regional Health Assessment
 Cascade Pacific Action Alliance Regional Health Assessment Cowlitz, Grays Harbor, Lewis, Mason, Pacific, Thurston and Wahkiakum County December, 2014 V.4 Thematic Areas Demographics and Socioeconomic Status
HAMILTON COUNTY DATA PROFILE ADULT CIGARETTE SMOKING. North Country Population Health Improvement Program
 HAMILTON COUNTY DATA PROFILE ADULT CIGARETTE SMOKING North Country Population Health Improvement Program HAMILTON COUNTY DATA PROFILE: ADULT CIGARETTE SMOKING INTRODUCTION The Hamilton County Data Profile
Diabetes Education and Diabetes Prevention Education Needs Assessment, Las Vegas, Nevada
 Diabetes Education and Diabetes Prevention Education Needs Assessment, Las Vegas, Nevada Julie Plasencia, MS, RD University of Nevada Cooperative Extension 2009 1 Table of Contents Introduction... 3 Objective...
COMMUNITY HEALTH STATUS ASSESSMENT
 Community Health Status Assessment MATERIALS AND METHODS The CHSA contains the quantitative indicators necessary for the community health improvement planning process. Because community health crosses
County-Level Analysis of U.S. Licensed Psychologists and Health Indicators
 County-Level Analysis of U.S. Licensed Psychologists and Health Indicators American Psychological Association Center for Workforce Studies Luona Lin, Karen Stamm and Peggy Christidis March 2016 Recommended
SUBSTANCE USE AND MENTAL HEALTH IN RHODE ISLAND (2015) A STATE EPIDEMIOLOGICAL PROFILE
 A STATE EPIDEMIOLOGICAL PROFILE") SUBSTANCE USE AND MENTAL HEALTH IN RHODE ISLAND (2015) A STATE EPIDEMIOLOGICAL PROFILE PREPARED BY Samantha Rosenthal, PhD, MPH Brown University School of Public Health Center for Population Health and
SUBSTANCE USE AND MENTAL HEALTH IN RHODE ISLAND (2015) A STATE EPIDEMIOLOGICAL PROFILE PREPARED BY Samantha Rosenthal, PhD, MPH Brown University School of Public Health Center for Population Health and
Tobacco, Alcohol, and
 Healthier San Joaquin County Community Assessment 2011 Tobacco, Alcohol, and Drug Use Summary... 100 Indicators Tobacco Use... 101 Tobacco Use Among Pregnant Women... 103 Alcohol Consumption... 104 Adult