Food Literacy and Skill Development: Community & Intensive Program
|
|
|
- Charles Bradford
- 5 years ago
- Views:
Transcription


1 Food Literacy and Skill Development: & Program Foodbank WA Report July 2012 Christina Davies Research and Evaluation Consultant

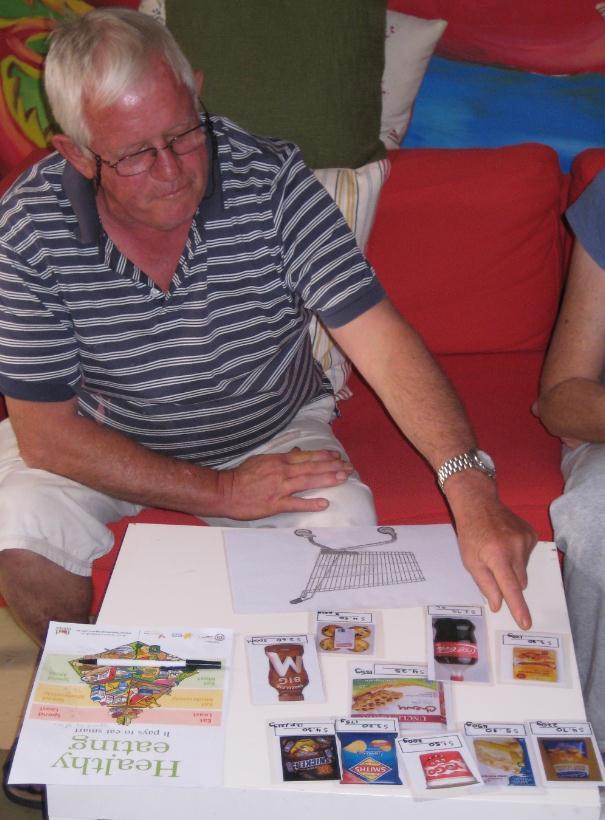
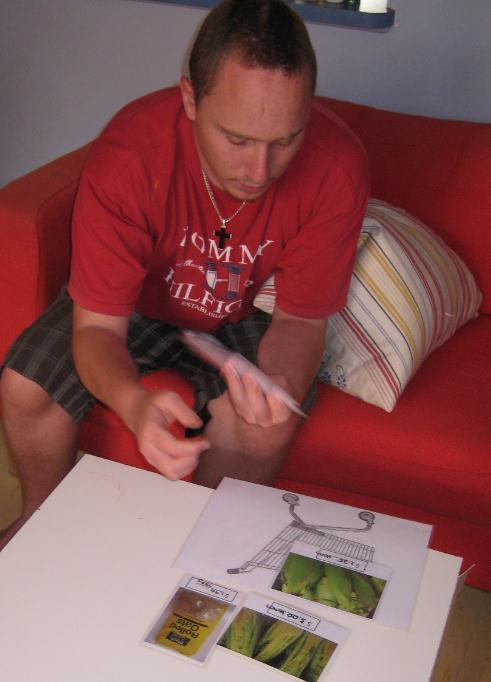
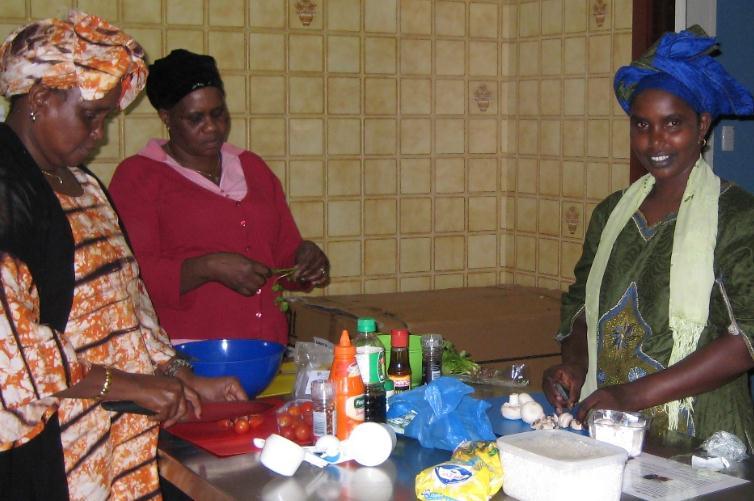
2 INTRODUCTION The aim of the Food Literacy and Skill Development Program is to help Western Australian adults and families improve their ability to make appropriate eating decisions for good health and to increase the intake of healthy food consumed by those most vulnerable to poor nutrition. The Food Literacy and Skill Development Program, consists of: (1) the Food Literacy Program and (2) the Food Literacy Program. The sessions are tailored to meet the needs of participants and include a combination of topics, i.e. basic nutrition, food budgeting, menu planning, food label reading, preparation and cooking skills, portion sizing, food safety and food storage. In partnership with Foodbank WA, the Cancer Council WA is the lead agency for the community program and the Australian Red Cross is the lead agency for the intensive program. Food Literacy: Program The Food Literacy Program is based on (and adapted to) the needs of people from a variety of social and cultural backgrounds. The program is delivered to individuals or small groups over four or more sessions (1 to 3 hours in duration). The aim of the program is to increase the prevalence of healthy eating behaviours amongst low socioeconomic WA adults and families. The key target group of the intensive program are Western Australian adults/parents who are at risk of food insecurity or poor nutrition. Food Literacy: Program The Food Literacy Program is made up of an individual session or two/three comprehensive sessions. The program is delivered to adults/parents at risk of poor nutrition as a result of a lack of nutrition knowledge and skills. Like the intensive program, the aim of the community program is to increase the prevalence of healthy eating behaviours amongst low socioeconomic WA adults and families. As part of its commitment to providing a community focused, relevant and high quality service, from the 31 st October 2011 to the 30 th June 2012, Foodbank WA evaluated both the and programs. The aim of the evaluation was to assess the effectiveness of these programs in terms of: Providing a program that was relevant and enjoyable to participants. Increasing participant knowledge and skills on a variety of nutrition and healthy eating topics as tailored to each participant group and encouraging the maintenance/increase of healthy eating behaviours. Encouraging the maintenance/improvement in participant attitudes towards healthy food. Increasing participant awareness of the benefits of a healthy diet, healthy weight, and the link between an unhealthy lifestyle and chronic disease risk. 2
3 METHOD So as to assess changes in participant knowledge, attitudes and intended behaviour, before participating in the program, participants were asked to complete a short pre-program survey comprising 11 questions. At the end of each session or topic participants completed one of four post-program surveys depending on the information taught in their session. program survey one comprised three questions (i.e. fruit and vegetable consumption knowledge, healthy snacks, foods that should be eaten most/some/least), survey two (reading a nutrition information panel, food budgeting) and survey three (frozen vs. fresh vegetables, product quality) each contained two questions and survey four comprised six questions (fats and oils, food safety, attitudes towards healthy food, enjoyment/relevance of the session, anticipated changes to their eating behaviour, healthy diet/weight and demographic questions). PRE PROGRAM SURVEY For each participant, pre and post program surveys were matched by name. Both the pre and post program surveys were designed so that they could be completed by people from a range of cultural backgrounds and literacy levels via the use of pictorial questions. The survey was pilot tested in the first three program sessions and the pictures/survey wording adjusted where necessary. As an interpreter was sometimes used in the sessions, Interpreter Instructions were developed to reduce the possibility of the interpreter prompting the class and biasing the evaluation. A descriptive analysis was conducted for each question (overall and by type of program) and where appropriate significance testing conducted between matched pre and post survey responses (overall). RESULTS Program Participants, 467 people participated in the Food Literacy and Skill Development Program (160 intensive program and 307 community program). Participants were clients of 38 different organisations. Most participants were female (85) and 18 identified themselves as being Aboriginal and/or Torres Strait Islander. In addition to Australia, the program was delivered to people from a range of countries (i.e. Afghanistan, Brazil, Burma, Canada, China, Egypt, Eritrea, Ethiopia, Hong Kong, Hungary, India, Indonesia, Iran, Iraq, Japan, Jordan, Kenya, Korea, Kurdistan, Lebanon, Liberia, Libya, Malaysia, Mali, Mauritius, Namibia, Nepal, New Zealand, Peru, Philippines, Poland, Romania, Russia, Rwanda, Saudi Arabia, Singapore, Somalia, South Africa, South Sudan, Sri Lanka, Sudan, Switzerland, Tanzania, Thailand, 3
4 Togo, Turkey, Ukraine, United Kingdom, USA, Vietnam and Zimbabwe). From the 31 st October 2011 to the 30 th June 2012, 130 sessions were run by Foodbank WA of which 108 sessions occurred in the metropolitan area and 22 sessions in regional areas. Survey Respondents Of the 467 people who participated in a session, 311 participants completed both a pre and post survey. Of those who completed both the pre and post surveys, 86 were female and 15 identified themselves as Aboriginal and/or Torres Strait Islander. The highest number of respondents indicated that their country or origin was Australia (38). (Table 1a to 1c) Table 1a: Gender (n=200) (n=86) n Male Female Total *25 participants did not receive or respond to the question Table 1b: Country (n=311) Country n Country n Country n Afghanistan Kenya 2.6 Saudi Arabia 1.3 Australia Korea 1.3 Singapore 1.3 Brazil 1.3 Kurdistan 1.3 Somalia Burma Lebanon 2.6 South Africa Canada 1.3 Libya 1.3 South Sudan 1.3 China Malaysia Sri Lanka 1.3 Eritrea Mali 1.3 Sudan Ethiopia Mauritius Switzerland 1.3 Hong Kong 1.3 Not known Thailand 2.6 Hungary 2.6 New Zealand Turkey 1.3 India 2.6 Peru 2.6 Ukraine 1.3 Indonesia Philippines UK Iran Poland 1.3 Vietnam Iraq Romania 1.3 Zimbabwe 1.3 Japan 1.3 Russia 1.3 Jordan 1.3 Rwanda 1.3 Table 1c: ATSI (n=173) (n=48) n Yes No Total *90 participants did not receive or respond to the question 4
. (Table 2 to 4) Table 2: I enjoyed taking part in the program (q11c post survey) (n=81) (n=16) n Agree 96 99.0 98.8 100.0 Unsure 1 1.0 1.2 0.")

5 Program relevance and enjoyability The vast majority of survey respondents enjoyed taking part in the program (99), thought the program was relevant to them (96) and indicated that they would use the knowledge/skills learnt in the session at home (99). (Table 2 to 4) Table 2: I enjoyed taking part in the program (q11c post survey) (n=81) (n=16) n Agree Unsure Disagree Total *214 participants did not receive or respond to the question Table 3: The class was relevant to me (q11e post survey) (n=79) (n=16) n Agree Unsure Disagree Total *216 participants did not receive or respond to the question Table 4: I will use the knowledge/skills learnt in today s class at home (q11d post survey) (n=81) (n=16) n Agree Unsure Disagree Total *214 participants did not receive or respond to the question 5
6 Participant knowledge and skills, significantly more participants in the post survey compared to the pre survey were aware that they should eat two fruit (pre survey 58, post survey 80) and five vegetables (pre survey 57, post survey 82) each day. (Table 5a and 5b) Fruit Table 5a: How many fruit should you eat each day (Q2a) (n=243) (n=173) (n=70) # # # p<0.01 Veg Table 5b: How many vegetables should you eat each day (Q2b) (n=241) (n=172) (n=69) # # # p<0.01 Participants were given a list of six foods/drinks and asked where on the healthy food pyramid the food/drink should be placed i.e. consumed most, some, least. As shown in Table 6, significant improvements in consumption knowledge were found with regard to meat, vegetables, bread, water and butter. 6
7 Table 6: For each food/drink, indicate if you should eat most, eat some or eat least each day Food/Drink Correct response (most, some or least) Participant responses Correct n Meat Some ** Vegetables Most * Soft Drink Least Bread Most ** Water Most * Butter Least ** * p<0.05 **p<0.01 Food/Drink Correct Correct n n Meat Vegetables Soft Drink Bread Water Butter In both the pre and post surveys, the vast majority of respondents were able to identify that a banana (pre survey 99, post survey 99) or a small tub of yoghurt (pre survey 98, post survey 99) were healthier snacks than potato chips or chocolate respectively, and were able to read a price tag so as to ascertain which size product was the cheapest/best value to buy (pre survey 91, post survey 93). (Table 7a, 7b and 8). Table 7a: Circle the healthy snack (Q3a) (n=247) (n=177) (n=70) # # Potato Chips Banana # Proportion correct not significantly different Table 7b: Circle the healthy snack (Q3b) (n=246) (n=175) (n=71) # # Yoghurt Chocolate # Proportion correct not significantly different 7
8 Table 8: Please circle the price tag for the rice which is the cheapest to buy (Q6) (n=139) (n=82) (n=57) # # Sunrise Long Grain mium Rice 2kg $5.55 ($0.28 per 100g) Sunrise Long Grain mium Rice 500g $1.72 ($0.34 per 100g) #Proportion correct not significantly different Respondents were asked which column of a nutrition information panel they should look at to compare different types of food and if frozen vegetables contain as many vitamins/minerals as fresh vegetables. Significantly more participants in the post survey compared to the pre survey were aware that they should look at the per 100g column of the nutrition information panel when comparing food (pre survey 48, post survey 83) and were aware that fresh and frozen vegetables contain the same amount of vitamins/minerals (pre survey 62, post survey 95). (Table 9 and 10) Table 9: Which column of the nutrition information panel would you look at to compare food (Q5) (n=163) (n=102) (n=61) # # Per 100g Per serving # p<0.01 Table 10: Do frozen vegetables contain as many vitamins and minerals as fresh vegetables (Q7) (n=151) (n=96) (n=55) # # Yes No/Unsure # p<0.01 8
9 , a similar proportion of respondents in the pre and post surveys identified that Weetbix and generic branded wheat biscuits were nutritionally the same quality. It was noted however, that some respondents thought that generic wheat biscuits tasted different to Weetbix and therefore were unwilling to accept that the quality was the same. (Table 11) Table 11: Please circle the product that you think is the better quality (Q8) (n=127) (n=76) (n=51) # # They are both the same quality Weetbix or generic wheat biscuits #Proportion correct not significantly different As shown in Table 12, the vast majority of respondents in both the pre and post surveys were able to identify that olive oil was a healthier fat/oil than butter (pre survey 95, post survey 98). Table 12: Please circle the healthier fat or oil (Q9) (n=129) (n=79) (n=50) # # Olive oil Butter/Unsure #Proportion correct not significantly different Significantly more respondents in the post survey (92) compared to the pre survey (80) were aware that using the fridge instead of the kitchen bench was the safest way to defrost meat. (Table 13) Table 13: Please circle the safest way to defrost meat? (Q10) (n=66) (n=22) (n=44) # # Fridge Kitchen bench /Unsure # p<0.05 9
10 Participant attitudes towards healthy food As shown in Table 14a and 14b, the vast majority of respondents, in both the pre and post surveys, thought that healthy food tasted good (pre survey 93, post survey 96) and that eating healthy food was important to them (pre survey 96, post survey 99). Table 14a: Healthy food tastes good (q11a) (n=117) (n=88) (n=29) # # Agree Unsure/ Disagree # Proportion correct not significantly different Table 14b: Eating healthy food is important to me (q11b) (n=120) (n=91) (n=29) # # Agree Unsure/ Disagree # Proportion correct not significantly different Participant awareness of the benefits of a healthy diet, healthy weight and the link between an unhealthy lifestyle and chronic disease, the vast majority of respondents suggested that the program made them think about eating a healthy diet (98), being a healthy weight (98) and encouraged them to consider the link between what they eat and their health (98). (Table 15a to 15c) Table 15a: Did the program make you think about eating a healthy diet (q12a post survey) (n=58) (n=32) n Yes Unsure No Total *221 participants did not receive or respond to the question Table 15b: Did the program make you think about being a healthy weight (q12b post survey) (n=59) (n=32) n Yes Unsure No Total *220 participants did not receive or respond to the question 10
11 Table 15a: Did the program make you think that what you eat can affect your health (q12c post survey) (n=58) (n=32) n Yes Unsure No Total *221 participants did not receive or respond to the question As a result of participating in the program, most respondents specified they would make changes to their diet, including eating less sugar (80), eating plenty of vegetables (79), eating plenty of fruit (77) and eating less salt (74). (Table 16) Table 16: Please tick the changes you will make to your diet as a result of taking part in this program (q13 post survey) Respondents (n=77) Eat less sugar Eat plenty of vegetables Eat plenty of fruit Eat less salt Reading nutrition information labels, shopping wisely Eat less fat, oil Other Eat less packaged food More wholemeal/fibre Drink more water Eat a healthy balanced diet Use the recipes given in the session Smaller food/meal portions *Multiple response question; 234 participants did not receive or respond to the question 11
12 SUMMARY OF FINDINGS Foodbank WA was successful at delivering a program that was relevant and enjoyable to participants. Foodbank WA was effective at increasing participant knowledge and skills on a variety of nutrition and healthy eating topics, for example: o significantly more participants in the post survey compared to the pre survey were aware they should eat two fruit and five vegetables each day; that fresh/frozen vegetables contain the same amount of vitamins/minerals and were able to identify that olive oil was a healthier fat/oil compared to butter; o significantly more participants in the post survey compared to the pre survey showed improvements in consumption knowledge regarding foods they should eat most, some, least; o significantly more participants in the post survey compared to the pre survey were able to correctly read a nutrition information panel to compare food; and o significantly more participants in the post survey compared to the pre survey showed improvements in food safety knowledge. In both the pre and post surveys, the majority of respondents maintained very positive attitudes towards healthy food and eating healthy food. The majority of respondents specified that the program made them think about eating a healthy diet, being a healthy weight and encouraged them to consider the link between an unhealthy lifestyle and chronic disease., the vast majority of respondents indicated they would use the knowledge/skills learnt in the sessions at home and would try to make healthy changes to their diet as a result of participating in the program (e.g. eating less sugar and salt; eating plenty of fruit and vegetables). 12
Country-wise and Item-wise Exports of Animal By Products Value Rs. Lakh Quantity in '000 Unit: Kgs Source: MoC Export Import Data Bank
 Country-wise and Item-wise Exports of Animal By Products Value Rs. Lakh Quantity in '000 Unit: Kgs Source: MoC Export Import Data Bank Country CAPEXIL Description HS Code Value 2010-2011 Quantity 2010-2011
Shop smart. A new way of spending your money on food to balance your diet and your food budget.
 Shop smart. A new way of spending your money on food to balance your diet and your food budget. What is FOODcents? FOODcents uses the 10-Plan to help you balance your diet and a KILOcents Counter to help
Global EHS Resource Center
 Global EHS Resource Center Understand environmental and workplace safety requirements that affect your global operations. 800.372.1033 bna.com/gelw Global EHS Resource Center This comprehensive research
Monitoring EU Agri-Food Trade: Development until February 2018
 Monitoring EU Agri-Food Trade: Development until February 2018 February 2018: a further increase in EU agri-food trade surplus The monthly value of EU agri-food exports in February 2018 decreased slightly
Food Sensations Quiz (Primary Schools 2010)
") Food Sensations Quiz (Primary Schools 2010) January 2011 Christina Mills Research and Evaluation Consultant christina.mills@westnet.com.au 0404159241 INTRODUCTION The Food Sensations program is run by
Food Sensations Quiz (Primary Schools 2010) January 2011 Christina Mills Research and Evaluation Consultant christina.mills@westnet.com.au 0404159241 INTRODUCTION The Food Sensations program is run by
The Latest Consumer & Innovation Trends in Weight Management
 The Latest Consumer & Innovation Trends in Weight Management Tanvi Savara Consumer Insight Analyst Canadean Food Matters Live 18 th November 2015 Agenda Consumer Profiles & Motivations Consumer Approaches
Multi-Country Opinion Research Survey TOPLINE RESULTS GLOBAL AVERAGE
 Multi-Country Opinion Research Survey TOPLINE RESULTS GLOBAL AVERAGE KEY SPECIFICATIONS AUDIENCE: LEGAL AGE, GENERAL POPULATION ADULTS SAMPLE SIZE: n=31,002 GEOGRAPHY: ARGENTINA AUSTRALIA AUSTRIA BRAZIL
AGRI-FOOD TRADE STATISTICAL FACTSHEET. European Union - Saudi Arabia
 European Commission Directorate-General for Agriculture and Rural Development AGRI-FOOD TRADE STATISTICAL FACTSHEET European Union - Saudi Arabia Notes to the reader: The data used in this factsheet were
AGRI-FOOD TRADE STATISTICAL FACTSHEET. European Union - Bahamas
 European Commission Directorate-General for Agriculture and Rural Development AGRI-FOOD TRADE STATISTICAL FACTSHEET European Union - Bahamas Notes to the reader: The data used in this factsheet were provided
AGRI-FOOD TRADE STATISTICAL FACTSHEET. European Union - Angola
 European Commission Directorate-General for Agriculture and Rural Development AGRI-FOOD TRADE STATISTICAL FACTSHEET European Union - Angola Notes to the reader: The data used in this factsheet were provided
THE CARE WE PROMISE FACTS AND FIGURES 2017
 THE CARE WE PROMISE FACTS AND FIGURES 2017 2 SOS CHILDREN S VILLAGES INTERNATIONAL WHERE WE WORK Facts and Figures 2017 205 58 79 families and transit 31 Foster homes 162 8 3 173 214 2 115 159 136 148
Performance against the USLP global nutrition targets in key countries 2017
 Performance against the USLP global nutrition targets in key countries Please refer to the Sustainable Living section of www.unilever.com for a full description of global progress HIGHEST NUTRITIONAL STANDARDS
ESPEN Congress Geneva 2014 FOOD: THE FACTOR RESHAPING THE SIZE OF THE PLANET
 ESPEN Congress Geneva 2014 FOOD: THE FACTOR RESHAPING THE SIZE OF THE PLANET Buy 2 and take 3: are we benefitting from cheaper food? P. Marques-Vidal (CH) Pedro Marques-Vidal Department of Internal Medicine
AGRI-FOOD TRADE STATISTICAL FACTSHEET. European Union - Sudan
 European Commission Directorate-General for Agriculture and Rural Development AGRI-FOOD TRADE STATISTICAL FACTSHEET European Union - Sudan Notes to the reader: The data used in this factsheet were provided
AGRI-FOOD TRADE STATISTICAL FACTSHEET. European Union - Rwanda
 European Commission Directorate-General for Agriculture and Rural Development AGRI-FOOD TRADE STATISTICAL FACTSHEET European Union - Rwanda Notes to the reader: The data used in this factsheet were provided
AGRI-FOOD TRADE STATISTICAL FACTSHEET. European Union - Iraq
 European Commission Directorate-General for Agriculture and Rural Development AGRI-FOOD TRADE STATISTICAL FACTSHEET European Union - Iraq Notes to the reader: The data used in this factsheet were provided
AGRI-FOOD TRADE STATISTICAL FACTSHEET. European Union - Liberia
 European Commission Directorate-General for Agriculture and Rural Development AGRI-FOOD TRADE STATISTICAL FACTSHEET European Union - Liberia Notes to the reader: The data used in this factsheet were provided
AGRI-FOOD TRADE STATISTICAL FACTSHEET. European Union - Namibia
 European Commission Directorate-General for Agriculture and Rural Development AGRI-FOOD TRADE STATISTICAL FACTSHEET European Union - Namibia Notes to the reader: The data used in this factsheet were provided
AGRI-FOOD TRADE STATISTICAL FACTSHEET. European Union - Togo
 European Commission Directorate-General for Agriculture and Rural Development AGRI-FOOD TRADE STATISTICAL FACTSHEET European Union - Togo Notes to the reader: The data used in this factsheet were provided
AGRI-FOOD TRADE STATISTICAL FACTSHEET. European Union - Philippines
 European Commission Directorate-General for Agriculture and Rural Development AGRI-FOOD TRADE STATISTICAL FACTSHEET European Union - Philippines Notes to the reader: The data used in this factsheet were
Assessment Schedule 2011 Home Economics: Examine New Zealand food choices and eating patterns (90246)
") NCEA Level 2 Home Economics (90246) 2011 page 1 of 9 Assessment Schedule 2011 Home Economics: Examine New Zealand food choices and eating patterns (90246) Evidence Statement Question Evidence Code Achievement
NCEA Level 2 Home Economics (90246) 2011 page 1 of 9 Assessment Schedule 2011 Home Economics: Examine New Zealand food choices and eating patterns (90246) Evidence Statement Question Evidence Code Achievement
AGRI-FOOD TRADE STATISTICAL FACTSHEET. European Union - Malaysia
 European Commission Directorate-General for Agriculture and Rural Development AGRI-FOOD TRADE STATISTICAL FACTSHEET European Union - Malaysia Notes to the reader: The data used in this factsheet were provided
AGRI-FOOD TRADE STATISTICAL FACTSHEET. European Union - Tanzania
 European Commission Directorate-General for Agriculture and Rural Development AGRI-FOOD TRADE STATISTICAL FACTSHEET European Union - Tanzania Notes to the reader: The data used in this factsheet were provided
AGRI-FOOD TRADE STATISTICAL FACTSHEET. European Union - Japan
 European Commission Directorate-General for Agriculture and Rural Development AGRI-FOOD TRADE STATISTICAL FACTSHEET European Union - Japan Notes to the reader: The data used in this factsheet were provided
Nutrition and Healthy Eating Policy
 Reviewed: June 2016 Next Review: June 2018 Linked Policies: Behaviour Management Reviewed June 2016 Page 1 of 5 Introduction Children are provided with regular drinks and food in adequate quantities for
3. How would you balance this Breakfast?
 Healthy Eating and You A few questions before we start: 1. Eggs belong to which food group? A. Vegetables and fruit B. Grains C. Milk and Alternatives D. Meats and Alternatives Questions Continued 2. Which
Current State of Global HIV Care Continua. Reuben Granich 1, Somya Gupta 1, Irene Hall 2, John Aberle-Grasse 2, Shannon Hader 2, Jonathan Mermin 2
 Current State of Global HIV Care Continua Reuben Granich 1, Somya Gupta 1, Irene Hall 2, John Aberle-Grasse 2, Shannon Hader 2, Jonathan Mermin 2 1) International Association of Providers of AIDS Care
AGRI-FOOD TRADE STATISTICAL FACTSHEET. European Union - Saudi Arabia
 European Commission Directorate-General for Agriculture and Rural Development AGRI-FOOD TRADE STATISTICAL FACTSHEET European Union - Saudi Arabia Notes to the reader: The data used in this factsheet were
AGRI-FOOD TRADE STATISTICAL FACTSHEET. European Union - Hong Kong
 European Commission Directorate-General for Agriculture and Rural Development AGRI-FOOD TRADE STATISTICAL FACTSHEET European Union - Hong Kong Notes to the reader: The data used in this factsheet were
AGRI-FOOD TRADE STATISTICAL FACTSHEET. European Union - Indonesia
 European Commission Directorate-General for Agriculture and Rural Development AGRI-FOOD TRADE STATISTICAL FACTSHEET European Union - Indonesia Notes to the reader: The data used in this factsheet were
AGRI-FOOD TRADE STATISTICAL FACTSHEET. European Union - North Korea
 European Commission Directorate-General for Agriculture and Rural Development AGRI-FOOD TRADE STATISTICAL FACTSHEET European Union - North Korea Notes to the reader: The data used in this factsheet were
AGRI-FOOD TRADE STATISTICAL FACTSHEET. European Union - Singapore
 European Commission Directorate-General for Agriculture and Rural Development AGRI-FOOD TRADE STATISTICAL FACTSHEET European Union - Singapore Notes to the reader: The data used in this factsheet were
AGRI-FOOD TRADE STATISTICAL FACTSHEET. European Union - Turkey
 European Commission Directorate-General for Agriculture and Rural Development AGRI-FOOD TRADE STATISTICAL FACTSHEET European Union - Turkey Notes to the reader: The data used in this factsheet were provided
AGRI-FOOD TRADE STATISTICAL FACTSHEET. European Union - South Korea
 European Commission Directorate-General for Agriculture and Rural Development AGRI-FOOD TRADE STATISTICAL FACTSHEET European Union - South Korea Notes to the reader: The data used in this factsheet were
AGRI-FOOD TRADE STATISTICAL FACTSHEET. European Union - Canada
 European Commission Directorate-General for Agriculture and Rural Development AGRI-FOOD TRADE STATISTICAL FACTSHEET European Union - Canada Notes to the reader: The data used in this factsheet were provided
AGRI-FOOD TRADE STATISTICAL FACTSHEET. European Union - Brazil
 European Commission Directorate-General for Agriculture and Rural Development AGRI-FOOD TRADE STATISTICAL FACTSHEET European Union - Brazil Notes to the reader: The data used in this factsheet were provided
AGRI-FOOD TRADE STATISTICAL FACTSHEET. European Union - South Africa
 European Commission Directorate-General for Agriculture and Rural Development AGRI-FOOD TRADE STATISTICAL FACTSHEET European Union - South Africa Notes to the reader: The data used in this factsheet were
AGRI-FOOD TRADE STATISTICAL FACTSHEET. European Union - China
 European Commission Directorate-General for Agriculture and Rural Development AGRI-FOOD TRADE STATISTICAL FACTSHEET European Union - China Notes to the reader: The data used in this factsheet were provided
AGRI-FOOD TRADE STATISTICAL FACTSHEET. European Union - Kuwait
 European Commission Directorate-General for Agriculture and Rural Development AGRI-FOOD TRADE STATISTICAL FACTSHEET European Union - Kuwait Notes to the reader: The data used in this factsheet were provided
AGRI-FOOD TRADE STATISTICAL FACTSHEET. European Union - Colombia
 European Commission Directorate-General for Agriculture and Rural Development AGRI-FOOD TRADE STATISTICAL FACTSHEET European Union - Colombia Notes to the reader: The data used in this factsheet were provided
AGRI-FOOD TRADE STATISTICAL FACTSHEET. European Union - Australia
 European Commission Directorate-General for Agriculture and Rural Development AGRI-FOOD TRADE STATISTICAL FACTSHEET European Union - Australia Notes to the reader: The data used in this factsheet were
AGRI-FOOD TRADE STATISTICAL FACTSHEET. European Union - Algeria
 European Commission Directorate-General for Agriculture and Rural Development AGRI-FOOD TRADE STATISTICAL FACTSHEET European Union - Algeria Notes to the reader: The data used in this factsheet were provided
AGRI-FOOD TRADE STATISTICAL FACTSHEET. European Union - New Caledonia
 European Commission Directorate-General for Agriculture and Rural Development AGRI-FOOD TRADE STATISTICAL FACTSHEET European Union - New Caledonia Notes to the reader: The data used in this factsheet were
AGRI-FOOD TRADE STATISTICAL FACTSHEET. European Union - Jamaica
 European Commission Directorate-General for Agriculture and Rural Development AGRI-FOOD TRADE STATISTICAL FACTSHEET European Union - Jamaica Notes to the reader: The data used in this factsheet were provided
AGRI-FOOD TRADE STATISTICAL FACTSHEET. European Union - Bangladesh
 European Commission Directorate-General for Agriculture and Rural Development AGRI-FOOD TRADE STATISTICAL FACTSHEET European Union - Bangladesh Notes to the reader: The data used in this factsheet were
Healthy eating. a pictorial guide
 Healthy eating a pictorial guide This booklet explains healthy eating and food choices. It is suitable for all adults and teenagers, including people with diabetes and those wanting to lose weight. It
AGRI-FOOD TRADE STATISTICAL FACTSHEET. European Union - Brunei
 European Commission Directorate-General for Agriculture and Rural Development AGRI-FOOD TRADE STATISTICAL FACTSHEET European Union - Brunei Notes to the reader: The data used in this factsheet were provided
AGRI-FOOD TRADE STATISTICAL FACTSHEET. European Union - Ghana
 European Commission Directorate-General for Agriculture and Rural Development AGRI-FOOD TRADE STATISTICAL FACTSHEET European Union - Ghana Notes to the reader: The data used in this factsheet were provided
AGRI-FOOD TRADE STATISTICAL FACTSHEET. European Union - Seychelles
 European Commission Directorate-General for Agriculture and Rural Development AGRI-FOOD TRADE STATISTICAL FACTSHEET European Union - Seychelles Notes to the reader: The data used in this factsheet were
AGRI-FOOD TRADE STATISTICAL FACTSHEET. European Union - Curacao
 European Commission Directorate-General for Agriculture and Rural Development AGRI-FOOD TRADE STATISTICAL FACTSHEET European Union - Curacao Notes to the reader: The data used in this factsheet were provided
AGRI-FOOD TRADE STATISTICAL FACTSHEET. European Union - Aruba
 European Commission Directorate-General for Agriculture and Rural Development AGRI-FOOD TRADE STATISTICAL FACTSHEET European Union - Aruba Notes to the reader: The data used in this factsheet were provided
AGRI-FOOD TRADE STATISTICAL FACTSHEET. European Union - Gabon
 European Commission Directorate-General for Agriculture and Rural Development AGRI-FOOD TRADE STATISTICAL FACTSHEET European Union - Gabon Notes to the reader: The data used in this factsheet were provided
AGRI-FOOD TRADE STATISTICAL FACTSHEET. European Union - Kosovo
 European Commission Directorate-General for Agriculture and Rural Development AGRI-FOOD TRADE STATISTICAL FACTSHEET European Union - Kosovo Notes to the reader: The data used in this factsheet were provided
AGRI-FOOD TRADE STATISTICAL FACTSHEET. European Union - Burundi
 European Commission Directorate-General for Agriculture and Rural Development AGRI-FOOD TRADE STATISTICAL FACTSHEET European Union - Burundi Notes to the reader: The data used in this factsheet were provided
AGRI-FOOD TRADE STATISTICAL FACTSHEET. European Union - Mongolia
 European Commission Directorate-General for Agriculture and Rural Development AGRI-FOOD TRADE STATISTICAL FACTSHEET European Union - Mongolia Notes to the reader: The data used in this factsheet were provided
AGRI-FOOD TRADE STATISTICAL FACTSHEET. European Union - Botswana
 European Commission Directorate-General for Agriculture and Rural Development AGRI-FOOD TRADE STATISTICAL FACTSHEET European Union - Botswana Notes to the reader: The data used in this factsheet were provided
AGRI-FOOD TRADE STATISTICAL FACTSHEET. European Union - Belize
 European Commission Directorate-General for Agriculture and Rural Development AGRI-FOOD TRADE STATISTICAL FACTSHEET European Union - Belize Notes to the reader: The data used in this factsheet were provided
AGRI-FOOD TRADE STATISTICAL FACTSHEET. European Union - Laos
 European Commission Directorate-General for Agriculture and Rural Development AGRI-FOOD TRADE STATISTICAL FACTSHEET European Union - Laos Notes to the reader: The data used in this factsheet were provided
AGRI-FOOD TRADE STATISTICAL FACTSHEET. European Union - St Pierre and Miquelon
 European Commission Directorate-General for Agriculture and Rural Development AGRI-FOOD TRADE STATISTICAL FACTSHEET European Union - St Pierre and Miquelon Notes to the reader: The data used in this factsheet
AGRI-FOOD TRADE STATISTICAL FACTSHEET. European Union - St Maarten (Dutch part)
") European Commission Directorate-General for Agriculture and Rural Development AGRI-FOOD TRADE STATISTICAL FACTSHEET European Union - St Maarten (Dutch part) Notes to the reader: The data used in this factsheet
European Commission Directorate-General for Agriculture and Rural Development AGRI-FOOD TRADE STATISTICAL FACTSHEET European Union - St Maarten (Dutch part) Notes to the reader: The data used in this factsheet
AGRI-FOOD TRADE STATISTICAL FACTSHEET. European Union - Tunisia
 European Commission Directorate-General for Agriculture and Rural Development AGRI-FOOD TRADE STATISTICAL FACTSHEET European Union - Tunisia Notes to the reader: The data used in this factsheet were provided
AGRI-FOOD TRADE STATISTICAL FACTSHEET. European Union - Uruguay
 European Commission Directorate-General for Agriculture and Rural Development AGRI-FOOD TRADE STATISTICAL FACTSHEET European Union - Uruguay Notes to the reader: The data used in this factsheet were provided
AGRI-FOOD TRADE STATISTICAL FACTSHEET. European Union - Bolivia
 European Commission Directorate-General for Agriculture and Rural Development AGRI-FOOD TRADE STATISTICAL FACTSHEET European Union - Bolivia Notes to the reader: The data used in this factsheet were provided
AGRI-FOOD TRADE STATISTICAL FACTSHEET. European Union - Belarus
 European Commission Directorate-General for Agriculture and Rural Development AGRI-FOOD TRADE STATISTICAL FACTSHEET European Union - Belarus Notes to the reader: The data used in this factsheet were provided
AGRI-FOOD TRADE STATISTICAL FACTSHEET. European Union - St Kitts and Nevis
 European Commission Directorate-General for Agriculture and Rural Development AGRI-FOOD TRADE STATISTICAL FACTSHEET European Union - St Kitts and Nevis Notes to the reader: The data used in this factsheet
AGRI-FOOD TRADE STATISTICAL FACTSHEET. European Union - Trinidad and Tobago
 European Commission Directorate-General for Agriculture and Rural Development AGRI-FOOD TRADE STATISTICAL FACTSHEET European Union - Trinidad and Tobago Notes to the reader: The data used in this factsheet
AGRI-FOOD TRADE STATISTICAL FACTSHEET. European Union - Panama
 European Commission Directorate-General for Agriculture and Rural Development AGRI-FOOD TRADE STATISTICAL FACTSHEET European Union - Panama Notes to the reader: The data used in this factsheet were provided
AGRI-FOOD TRADE STATISTICAL FACTSHEET. European Union - Uganda
 European Commission Directorate-General for Agriculture and Rural Development AGRI-FOOD TRADE STATISTICAL FACTSHEET European Union - Uganda Notes to the reader: The data used in this factsheet were provided
AGRI-FOOD TRADE STATISTICAL FACTSHEET. European Union - Burkina Faso
 European Commission Directorate-General for Agriculture and Rural Development AGRI-FOOD TRADE STATISTICAL FACTSHEET European Union - Burkina Faso Notes to the reader: The data used in this factsheet were
AGRI-FOOD TRADE STATISTICAL FACTSHEET. European Union - Papua New Guinea
 European Commission Directorate-General for Agriculture and Rural Development AGRI-FOOD TRADE STATISTICAL FACTSHEET European Union - Papua New Guinea Notes to the reader: The data used in this factsheet
Monitoring EU Agri-Food Trade: Development until May 2018
 Monitoring EU Agri-Food Trade: Development until May 2018 May 2018: Agri-food exports and trade surplus keep at record levels The monthly values of EU agri-food trade in May 2018, compared to April, remained
AGRI-FOOD TRADE STATISTICAL FACTSHEET. European Union - Turks and Caicos Isles
 European Commission Directorate-General for Agriculture and Rural Development AGRI-FOOD TRADE STATISTICAL FACTSHEET European Union - Turks and Caicos Isles Notes to the reader: The data used in this factsheet
Global Measles and Rubella Update November 2018
 Global Measles and Rubella Update November 218 Measles Number of Reported Measles by WHO Regions 218 Region Member States* Suspected cases Measles cases Clin Epi Lab Jan Feb Mar Apr May Jun Jul Aug Sep
Drug Prices Report Opioids Retail and wholesale prices * and purity levels,by drug, region and country or territory (prices expressed in US$ )
") 1 / 11 Region/Subregion/ Country Africa Eastern Africa Kenya Madagascar Mauritius Uganda United Republic of Tanzania Northern Africa Algeria Egypt Libya Morocco Sudan Southern Africa Botswana Burkina Faso
1 / 11 Region/Subregion/ Country Africa Eastern Africa Kenya Madagascar Mauritius Uganda United Republic of Tanzania Northern Africa Algeria Egypt Libya Morocco Sudan Southern Africa Botswana Burkina Faso
WCPT COUNTRY PROFILE December 2017 JAPAN
 WCPT COUNTRY PROFILE December 2017 JAPAN JAPAN NUMBERS WCPT Members Practising physical therapists 88,607 Total number of physical therapist members in your member organisation 128,000 Total number of
CHOOSE HEALTH: FOOD, FUN, AND FITNESS. Read the Label!
 POSTER 1-1: REPLACE SWEETENED DRINKS Read the Label! Nutrition Facts 20 oz. cola Serving Size: 1 bottle (591mL) Servings Per Container: 1 Amount Per Serving Calories 240 Calories from Fat 0 % Daily Value
מדינת ישראל. Tourist Visa Table
 Updated 23/05/2017 מדינת ישראל Tourist Visa Table Tourist visa exemption is applied to national and official passports only, and not to other travel documents. Exe = exempted Req = required Press the first
Terms and Conditions. VISA Global Customer Assistance Services
 Terms and Conditions VISA Global Customer Assistance Services Visa Global Customer Assistance Services (VGCAS) 1 The Visa Global Customer Assistance Services are co-ordinated by the Global Assistance Centre
Annex 2 A. Regional profile: West Africa
 Annex 2 A. Regional profile: West Africa 355 million people at risk for malaria in 215 297 million at high risk A. Parasite prevalence, 215 Funding for malaria increased from US$ 233 million to US$ 262
EU Market Situation for Poultry. Committee for the Common Organisation of the Agricultural Markets 20 April 2017
 EU Market Situation for Poultry Committee for the Common Organisation of the Agricultural Markets 2 April 217 -9.% -11.% -5.% -.1% -.7% -2.2% 3.% 1.7% 1.2%.8%.6%.%.%.% 7.9% 7.% 6.4% 6.2% 6.% 5.5% 5.3%
MANAGING YOUR CHOLESTEROL
 MANAGING YOUR CHOLESTEROL WHAT IS CHOLESTEROL? Cholesterol is a white waxy substance found in every cell of our bodies. It comes from The liver our body makes most of it from the fat we eat in food A little
Poll 9 - Kids and Food: Challenges families face December 2017
 Poll 9 - Kids and Food: Challenges families face December 2017 The below questions were reported on in the ninth RCH National Child Health Poll Kids and food: Challenges families face. As a parent or carer,
The purpose of this report is to provide feedback to relevant Councils to help inform decision making on key issues.
 Store Nutrition Report Final Store Turnover Food and Nutrition Results Nganampa Health Council March 2013 Amanda Lee and Jamie Sheard Summary This report provides food and nutrition information about the
מדינת ישראל. Tourist Visa Table. Tourist visa exemption is applied to national and official passports only, and not to other travel documents.
 Updated 25/05/2015 ישראל Tourist Visa Table Tourist visa exemption is applied to national and official passports only, and not to other travel documents. (C) Bearers of official passports requiring tourist
JIM PAINTER PHD, RD SUN-MAID RAISINS
 International Food Guides What do Pyramids, Plates & Boats Have in Common JIM PAINTER PHD, RD SUN-MAID RAISINS Today s Agenda 1. Culturally Specific Shapes 2. Food Groups. Fruits and Veggies Sweets and
Ulster Council GAA. Health Booklet. Name: Class: School: supported by
 Ulster Council GAA Health Booklet Name: Class: School: supported by The Food Pyramid 5 a Day Fruit & Vegetables Drink Plenty of Water HEALTH PROMOTION UNIT DEPARTMENT OF HEALTH AND CHILDREN What counts
Answering the question- Why Should You Care What You Are Eating???
 Answering the question- Why Should You Care What You Are Eating??? Never eat more than you can lift. - Miss Piggy Portion Distortion 6 Main Nutrients Vitamins Minerals Water Carbohydrates Protein Fat Keep
Healthy Eating Policy
 Healthy Eating Policy Policy Code: TPN21 Policy Start Date: October 2014 Policy Review Date: October 2015 Healthy Eating Policy Page 1 of 5 1. Policy Statement 1.1 Children are provided with regular drinks
Global Measles and Rubella Update. April 2018
 Global Measles and Rubella Update April 218 Measles Number of Reported Measles by WHO Regions 218 Region Member States* Suspected cases Measles cases Clin Epi Lab Jan Feb Mar Apr May Jun Jul Aug Sep Oct
Sund skolemad med smag smil og samvaer
 DENMARK School food policy (voluntary) Developed by Year of publication Web link(s) Sund skolemad med smag smil og samvaer Ministry of Food, Agriculture and Fisheries 2012 (website update) http://altomkost.dk/servicemenu/publikationer/publikation/pub/hent-fil/publication/
What Should I Eat to Help my Pressure Sore or Wound Heal?
 What Should I Eat to Help my Pressure Sore or Wound Heal? Information for Patients i UHL Nutrition and Dietetic Service UHL Tissue Viability Team Introduction If you have a pressure sore or a large wound
OUR LADY QUEEN OF PEACE R.C. PRIMARY SCHOOL
 OUR LADY QUEEN OF PEACE R.C. PRIMARY SCHOOL Food in School, including Packed Lunch Policy In our school we believe that each person is unique and created to flourish in God s image. We aspire to excellence
Harrow Lodge Primary School
 Harrow Lodge Primary School WHOLE SCHOOL FOOD POLICY APPROVED BY GOVERNORS ON DUE FOR REVIEW: October 2019 RESPONSIBLE PERSON(S) MRS N HART SIGNED BY CHAIR OF GOVERNORS Whole School Food Policy 1 Mission
Food Policy. Last reviewed: December 2017 Next review: December 2021
 Food Policy Last reviewed: December 2017 Next review: December 2021 INTRODUCTION WASHINGBOROUGH ACADEMY WHOLE SCHOOL FOOD POLICY The school is dedicated to providing an environment that promotes healthy
A model of how to eat healthily
 Average adult A model of how to eat healthily Shows the different types of food we need to eat and in what proportions to have a well balanced and healthy diet Not a model of each meal Applies to most
Keeping the Body Healthy!
 Name Hour Food & Nutrition 9 th Grade Keeping the Body Healthy! # Assignment Pts. Possible 1 Create a Great Plate Video 30 2 MyPlate Label & Color 15 3 Color & Food 5 4 6 Basic Nutrients 9 5 Dietary Guidelines
INDO-AFRICA PHARMA BUSINESS MEET
 INDO-AFRICA PHARMA BUSINESS MEET AYUSH Exports & Potentials by: Ranjit Puranik, Chief Executive Officer, Shree Dhootapapeshwar Limited Overall Exports from ASU&H Industry Economic region wise Export Analysis
JIGSAW READING CARBOHYDRATES
 Date: CARBOHYDRATES Carbohydrates provide an important source of energy for our bodies. There are two types of carbohydrates: Sugars are found in foods which taste sweet like candies, jams and desserts.
Global Measles and Rubella Update October 2018
 Global Measles and Rubella Update October 218 Measles Number of Reported Measles Cases by WHO Regions 218 Region Member States* Suspected cases Measles cases Clin Epi Lab Jan Feb Mar Apr May Jun Jul Aug