ELIMINATING HEALTH DISPARITIES IN AN URBAN AREA. VIRGINIA A. CAINE, M.D., DIRECTOR MARION COUNTY HEALTH DEPARTMENT INDIANAPOLIS, INDIANA May 1, 2002
|
|
|
- Samson Snow
- 5 years ago
- Views:
Transcription
1 ELIMINATING HEALTH DISPARITIES IN AN URBAN AREA VIRGINIA A. CAINE, M.D., DIRECTOR MARION COUNTY HEALTH DEPARTMENT INDIANAPOLIS, INDIANA May 1, 2002
2 Racial and ethnic disparities in health care are unacceptable in a country that values equality and equal opportunity for all. And that is why we must act now with a comprehensive initiative that focuses on health care and prevention for racial and ethnic minorities. President Bill Clinton February 21, 1998
3 President s Initiative to Eliminate Racial and Ethnic Disparities in Health Target conditions Infant mortality Cancer screening and management Cardiovascular disease Diabetes HIV infection/aids Immunizations
4 Healthy People 2010 Two Overarching Goals: Increase Quality and Years of Healthy Life Eliminate Health Disparities
5 What Are Health Disparities? Differences in the incidence, prevalence,mortality, and burden of diseases and other adverse health conditions that exist among specific population groups in the United States.
6 Why The Interest In Disparities? The changing demography of the American population The persistence of disparities in the health status of racial and ethnic minorities
7 Percent Distribution of U.S. Population by Race and Ethnicity, 2000 African American/ Black 12.2% Asian/Pacific Islander 3.8% White, not Hispanic/ Latino 71.4% Hispanic/ Latino 11.9% American Indian/Alaska Native 0.7% Source: U.S. Census Bureau, 2000
8 Percent of the Population by Race and Hispanic Origin, 2000 and % 12.2% 11.4% 8.2% 13.6% 24.5% American Indian/Alaska Native Asian/Pacific Islander Black/African American 71.8% 52.8% Hispanic/Latino White, not Hispanic/Latino Source: U.S. Bureau of the Census 2000
9 Emerging Majorities Minority people are the majority in three states California (50.1%) Hawaii (71%) New Mexico (53%) District of Columbia (71%)
10 Emerging Majorities Minority people are now at least 30% of the population in ten states: Texas (45%) Mississippi (38%) Maryland (36%) New York (35%) Georgia (34%) Arizona (32%) Florida (32%) New Jersey (32%) South Carolina (32%) Nevada (30%)
11 Percent of the Population by Race and Hispanic Origin, Indiana 1990 White, not Hispanic: 90.1% 2000 White, not Hispanic: 86.5% Black/African American: 7.8% Black/African American: 8.3% Asian/Pacific Islander: 0.2% Asian/Pacific Islander: 1.0% Hispanic/Latino: 1.7% Hispanic/Latino: 3.6% American Indian/Alaska Native: 0.3% American Indian/Alaska Native: 0.7%
12
13 Life Expectancy at Birth, Years White Black SOURCE: CDC/NCHS, National Vital Statistics Systems,
14 Infant Mortality Rates, White Black Deaths <1 year/1000 live births SOURCE: CDC/NCHS, National Vital Statistics System,
15 Infant mortality rates by race and Hispanic origin of mother Total Hispanic Non-Hispanic white Non-Hispanic black 14.3 Asian/Pacific Islander SOURCE: CDC/NCHS, National Vital Statistics System, Deaths <1 year per 1000 live births
16 Infant mortality rates by Hispanic origin of mother Total Hispanic Mexican Puerto Rican 8.9 Cuban Central/South American SOURCE: CDC/NCHS, National Vital Statistics Systems, 1995 Deaths <1 year per 1000 live births
17 Infant mortality rates by Asian/Pacific Islander subgroup Asian/Pacific Islander 5.3 Chinese 3.8 Japanese 5.3 Hawaiian 6.6 Filipino 5.6 SOURCE: CDC/NCHS, National Vital Statistics Systems, Deaths <1 year per 1000 live births
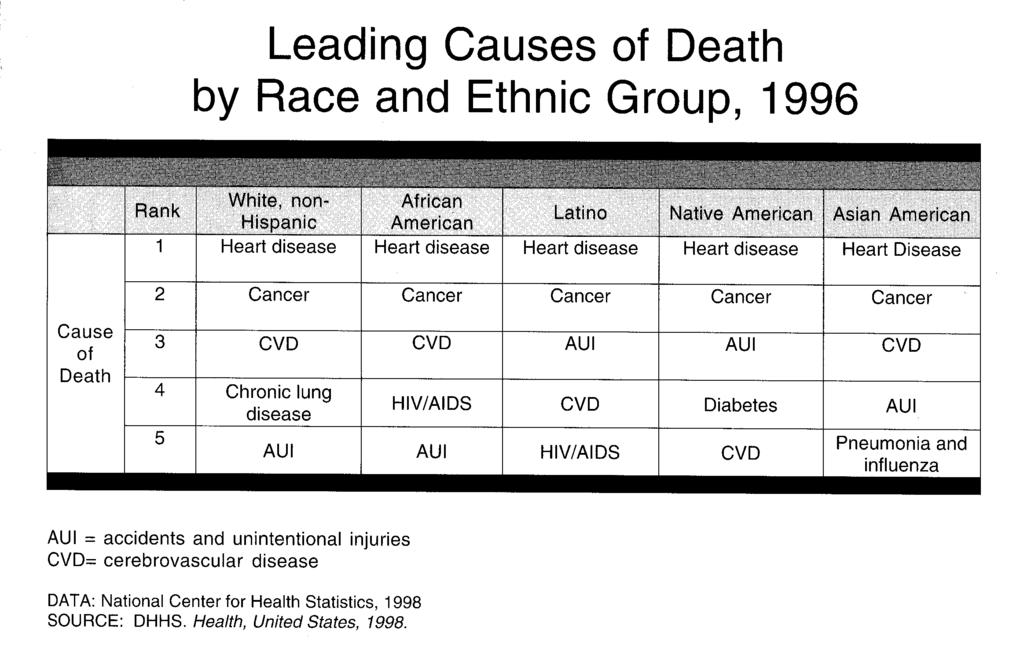
18 Coronary heart disease death rates White Black A/PI AI/AN Hispanic Per 100,000 population NOTE: Death rates are age-adjusted to 1940 standard million age distribution. A/PI is Asian American or Pacific Islander; AI/AN is American Indian or Alaska Native. SOURCE: CDC/NCHS, National Vital Statistics System, 1990 and 1996
19
20 Racial and Ethnic Disparities: Morbidity and Mortality African American men have a 40 percent higher heart disease rate than White men Women of Vietnamese origin in the United States suffer from cervical cancer at nearly five times the rate than White women
21 Racial and Ethnic Disparities: Morbidity and Mortality Native Americans have a diabetes rate that is nearly three times the rate of Whites. The Hispanic rate is nearly double that of Whites African American women are 28% more likely to die from breast cancer, although the incidence is greater in White women
22 How Do We Explain Racial And Ethnic Disparities In Health?
23 Several Causal Factors Socioeconomic status (SES) Health risk behaviors Psycho-social factors Acculturation Biologic/Genetic factors Health care
24 Socioeconomic Status Education Occupation Income Environment Culture
25
26
27 Infant Mortality Rates in the United States Deaths/1000 Live births < Education in years NHW=Non-Hispanic White NHB=Non-Hispanic Black SOURCE: CDC/NCHS/NVSS
28 Health Risk Behaviors
29 Health Risk Behaviors Female Current smokers White Black Hispanic >1 oz. alcohol per day Regular exercise or sports percentage engaging in activity SOURCE: CDC/NCHS, National Health Interview Survey, 1990
30 Health Risk Behaviors Male White Current smokers Black Hispanic >1 oz. alcohol per day Regular exercise or sports percentage engaging in activity SOURCE: CDC/NCHS, National Health Interview Survey, 1990
31 Age-adjusted Prevalence of Obesity (BMI > 30.0) Female Non-Hispanic Whites NHANES II NHANES III Non-Hispanic Blacks Mexican Americans Percent SOURCE: CDC/NCHS, Second National Health and Nutrition Examination Survey, Third National Health and Nutrition Examination Survey,
32 Age-Adjusted Prevalence of Obesity (BMI > 30.0) Non-Hispanic Whites Male 12.0 NHANES II NHANES III 20.0 Non-Hispanic Blacks Mexican Americans Percent SOURCE: CDC/NCHS, Second National Health and Nutrition Examination Survey, Third National Health and Nutrition Examination Survey,
33 Psychosocial Factors
34 Psychosocial Factors Large complex literature relating factors such as stress and discrimination with racial/ethnic differences in hypertension
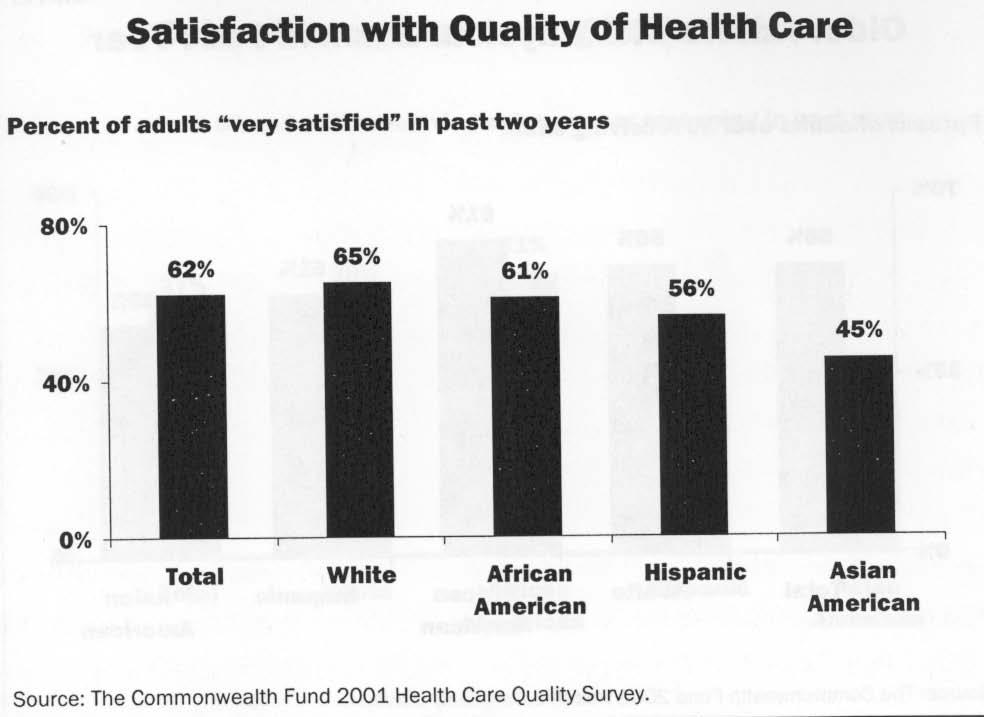
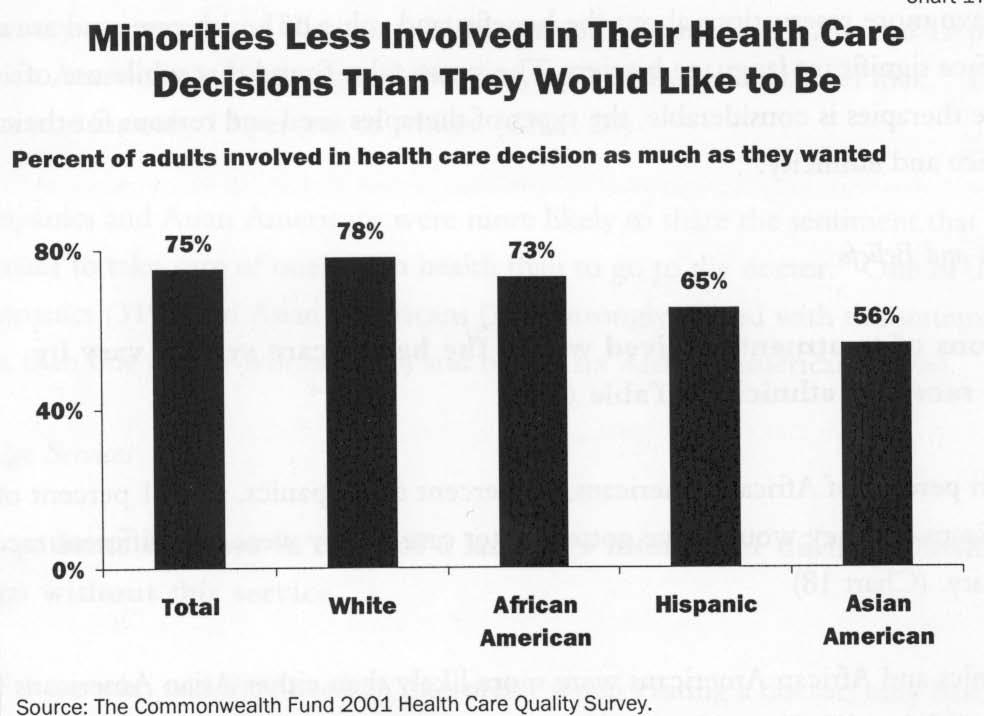
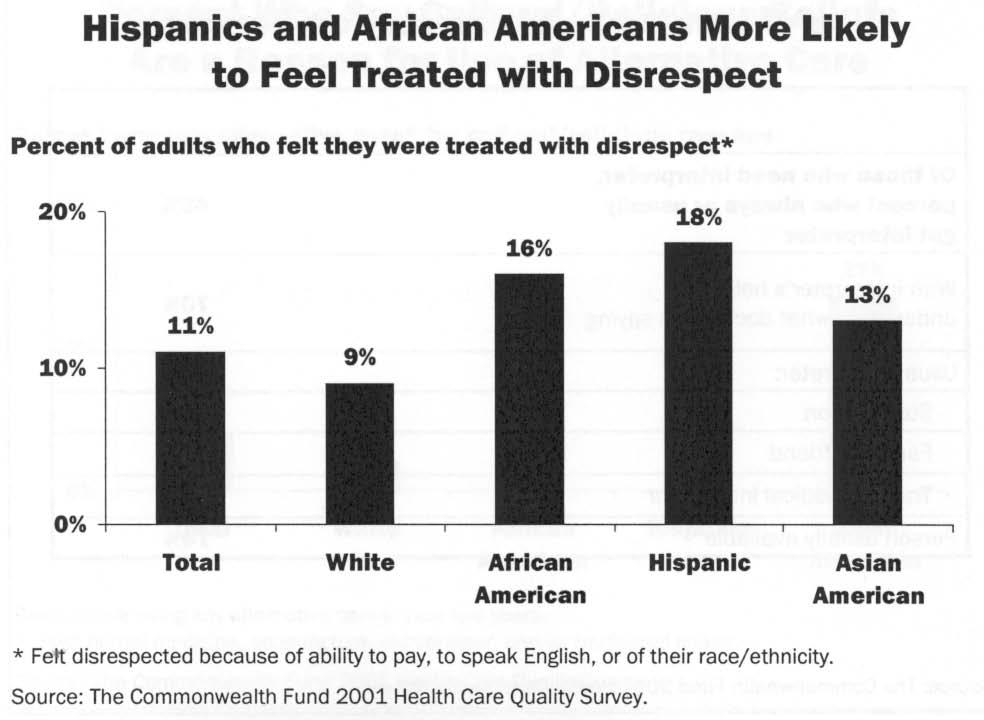
35 Acculturation
36 Acculturation Some health behaviors worsen with acculturation
37 Biological and Genetic Factors
38 Health Care
39 Percentage Uninsured Under Age 18 United States Percent of Population White Black Hispanic Source: CPS, USCB
40 Health Care Coverage of Persons Under 65 (Age-adjusted) All Hispanic NH White NH Black Private Medicaid/ Public Assistance Not covered Asian/PI Percent SOURCE: CDC/NCHS, National Health Interview Survey, 1996
41
42 Health Care Extensive evidence of racial and/or ethnic Differences in utilization of health care Diagnostic tests and procedures Therapeutic procedures Intensity of care Pain control Transplants Preventive services
43 Possible Explanations for the Racial and Ethnic Differences in Utilization Socioeconomic status Language Insurance status Severity of illness Patient health behaviors Provider bias
44
45
46
47
48
49
50
51
52
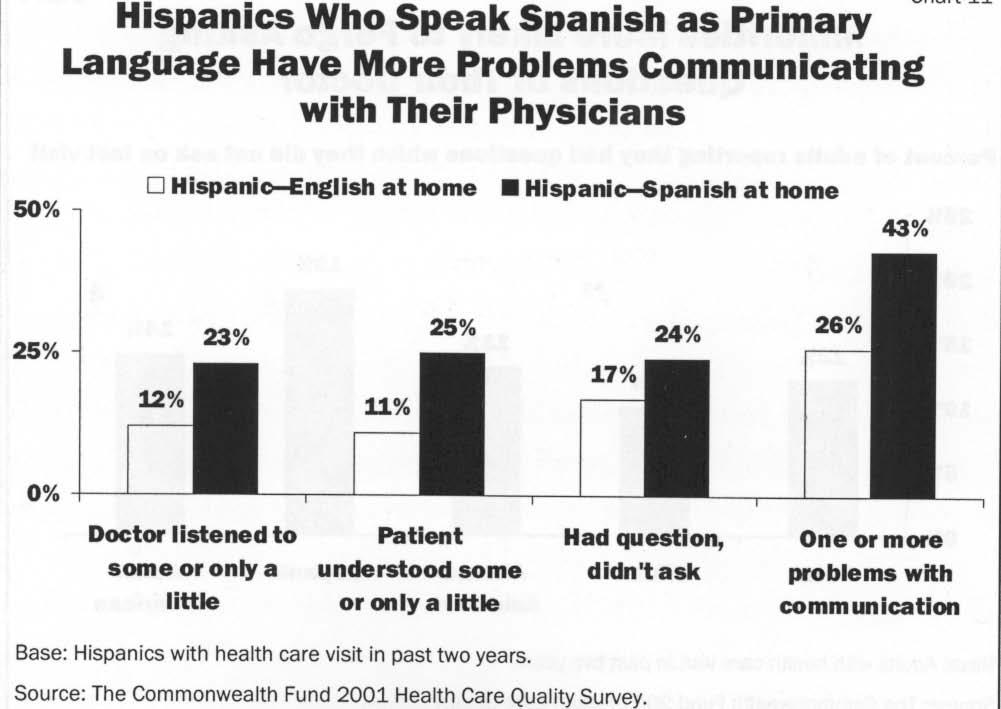
53
54
55
56
57 IOM Report Findings Racial and ethnic disparities in healthcare exist and, because they are associated with worse outcomes in many cases, are unacceptable.
58 IOM Report Findings Factors contributing to racial and ethnic disparities in healthcare: Health systems Healthcare providers Patients and utilization managers Bias, stereotyping, prejudices Clinical uncertainty on the health of care providers
59 IOM Report Recommendations Increase awareness of racial and ethnic disparities among the general public, key stakeholders, and healthcare providers Legal, regulatory, and policy interventions Health systems interventions
60 Factors Influencing Optimal Medical Care Effective patient-physician communication Overcoming cultural and linguistic barriers Access to affordable health insurance Alternatives to hospital emergency rooms Improvement in continuity of care Improving information for patients Participate in the latest quality improvement innovations

61 Of all the forms of inequality, injustice in health is the most shocking and the most inhumane. -- Dr. Martin Luther King, Jr.
Health Disparities Research. Kyu Rhee, MD, MPP, FAAP, FACP Chief Public Health Officer Health Resources and Services Administration
 Health Disparities Research Kyu Rhee, MD, MPP, FAAP, FACP Chief Public Health Officer Health Resources and Services Administration Outline on Health Disparities Research What is a health disparity? (DETECT)
Health Disparities Research
 Health Disparities Research Kyu Rhee, MD, MPP, FAAP, FACP Chief Public Health Officer Health Resources and Services Administration Outline on Health Disparities Research What is a health disparity? (DETECT)
The History and Principles of Patient Navigation. Report to the Nation on Cancer and the Poor
 The History and Principles of Patient Navigation March 30, 2012 Harold P Freeman, M.D. President & CEO Harold P. Freeman Patient Navigation Institute Report to the Nation on Cancer and the Poor In 1989,
Changing Patient Base. A Knowledge to Practice Program
 Changing Patient Base A Knowledge to Practice Program Learning Objectives By the end of this tutorial, you will: Understand how demographics are changing among patient populations Be aware of the resulting
ENDING HEALTH DISPARITIES: A Congressional Black Caucus Priority
 ENDING HEALTH DISPARITIES: A Congressional Black Caucus Priority Congresswoman Donna Christensen at the Roundtable on Value and Science-Driven Health Care with the Clinical Effectiveness Research Innovation
Community Engagement to Address Health Disparities
 Community Engagement to Address Health Disparities Health Disparities Service-Learning Collaborative Meeting April 11, 2007, Toronto, ON Canada Elmer R. Freeman, Executive Director Center for Community
Impact of Poor Healthcare Services
 Competency 3 Impact of Poor Healthcare Services Updated June 2014 Presented by: Lewis Foxhall, MD VP for Health Policy Professor, Clinical Cancer Prevention UT MD Anderson Cancer Center Competency 3 Objectives
Cirrhosis and Liver Cancer Mortality in the United States : An Observational Study Supplementary Material
 Cirrhosis and Liver Cancer Mortality in the United States 1999-2016: An Observational Study Supplementary Material Elliot B. Tapper MD (1,2) and Neehar D Parikh MD MS (1,2) 1. Division of Gastroenterology
KEY FACTS LATINOS AND HIV/AIDS
 KEY FACTS November 2001 LATINOS AND HIV/AIDS Latinos and HIV/AIDS November 2001 List of Figures Figure 1. Distribution of People Living with AIDS, by Race/Ethnicity, 1999 Figure 2. New and Cumulative AIDS
List of Detailed Tables
 This announcement signals the release of the 2011 Mortality Multiple Cause Micro-data Files. The file can be accessed at: http://www.cdc.gov/nchs/data_access/vitalstatsonline.htm This document contains
HIV and AIDS in the United States
 HIV and AIDS in the United States A Picture of Today s Epidemic More than 20 years into the AIDS epidemic, HIV continues to exact a tremendous toll in the United States. Recent data indicate that African
Unequal Treatment: Disparities in Access, Quality, and Care
 Unequal Treatment: Disparities in Access, Quality, and Care Brian D. Smedley, Ph.D. National Collaborative for Health Equity www.nationalcollaborative.org Healthcare Disparities: Are We Making Progress?
The Differential Health of Women and Minorities
 The Differential Health of Women and Minorities CHS 150, November, 6, 2013 Marjorie Kagawa Singer, PhD, MA,MN,RN, FAAN UCLA Fielding School of Public Health and Asian American Studies Minority Non-Minority
Table of Contents. 2 P age. Susan G. Komen
 RHODE ISLAND Table of Contents Table of Contents... 2 Introduction... 3 About... 3 Susan G. Komen Affiliate Network... 3 Purpose of the State Community Profile Report... 4 Quantitative Data: Measuring
Center for Health Disparities Research
 Center for Health Disparities Research EXHIBIT I Legislative Committee on Health Care Document consists of 23 pages. Entire document provided. Due to size limitations, pages provided. A copy of the complete
Working Towards Addressing Women s Health Disparities in Arizona
 Working Towards Addressing Women s Health Disparities in Arizona Suncerria Tillis, MBA Arizona Health Disparities Center December 6, 2006 National Conference of State Legislatures Women s Health Pre-Conference
ARE STATES DELIVERING?
 The Promise of Quality, Affordable Health Care for Women ARE STATES DELIVERING? A 50-State Report Card on Women s Health OCTOBER 2014 TAKING ACTION, MAKING CHANGE The Alliance for a Just Society s mission
New Mexico Department of Health. Racial and Ethnic Health Disparities Report Card
 New Mexico Department of Health Racial and Ethnic Health Disparities Report Card August 30, 2006 Acknowledgments Many individuals contributed to the production of this report card and the Office of Policy
MATERNAL AND CHILD HEALTH AND DISPARITIES FOR ASIAN AMERICANS, NATIVE HAWAIIANS, AND PACIFIC ISLANDERS
 MATERNAL AND CHILD HEALTH AND DISPARITIES FOR ASIAN AMERICANS, NATIVE HAWAIIANS, AND PACIFIC ISLANDERS Why does maternal and child health matter for realizing health justice in AA and NHPI communities?
Healthy People 2010 Leading Health Indicators: California, 2000
 January 4 DATA SUMMARY No. DS4- Healthy People Leading Health Indicators: California, By Jim Sutocky This report focuses on the Healthy People Leading Health Indicators (LHIs). H i g h l i g h t s As of
Reporting by Racial Subgroups Hawai i. Jill Miyamura, PhD Hawaii Health Information Corporation
 Reporting by Racial Subgroups Hawai i Jill Miyamura, PhD Hawaii Health Information Corporation Issues Regarding Race Hawai i Disparities: Asians and Pacific Islanders Population estimates US Census 2
Table of Contents. 2 P a g e. Susan G. Komen
 NEW HAMPSHIRE Table of Contents Table of Contents... 2 Introduction... 3 About... 3 Susan G. Komen Affiliate Network... 3 Purpose of the State Community Profile Report... 4 Quantitative Data: Measuring
Measuring Equitable Care to Support Quality Improvement
 Measuring Equitable Care to Support Quality Improvement Berny Gould RN, MNA Sr. Director, Quality, Hospital Oversight, and Equitable Care Prepared by: Sharon Takeda Platt, PhD Center for Healthcare Analytics
Conceptual framework! Definitions of race and ethnicity Census Questions, Genetics! Social Class, migration, language proficiency!
 Conceptual framework! Definitions of race and ethnicity Census Questions, Genetics! Social Class, migration, language proficiency! Patient-physician communication! Clinical Research Examples! Options for
PRINCIPLES FOR ELIMINATING DISPARITIES THROUGH HEALTH CARE REFORM. John Z. Ayanian, MD, MPP
 PRINCIPLES FOR ELIMINATING DISPARITIES THROUGH HEALTH CARE REFORM John Z. Ayanian, MD, MPP Harvard Medical School Brigham and Women s Hospital Harvard School of Public Health 8 th Annual National Summit
Populations of Color in Minnesota
 Populations of Color in Minnesota Health Status Report Update Summary Fall 2002 Center for Health Statistics Minnesota Department of Health Table of Contents Part I: Birth Related Indicators...1 Low Birthweight...1
Using Policy, Programs, and Partnerships to Stamp Out Breast and Cervical Cancers
 Using Policy, Programs, and Partnerships to Stamp Out Breast and Cervical Cancers National Conference of State Legislatures Annual Meeting J August 2006 Christy Schmidt Senior Director of Policy National
Research Needs in Support of Effective Tobacco Interventions with Priority Populations
 Research Needs in Support of Effective Tobacco Interventions with Priority Populations American Psychological Association Strengthening Psychology s Role in Reducing Tobacco Health Disparities December
Road Map. Requirements for reporting Defining health disparities Resources for data
 Health Disparities Road Map Requirements for reporting Defining health disparities Resources for data Health disparities and substance use Resources for data Challenges Building data sources Environmental
Table of Contents. 2 P age. Susan G. Komen
 NEVADA Table of Contents Table of Contents... 2 Introduction... 3 About... 3 Susan G. Komen Affiliate Network... 3 Purpose of the State Community Profile Report... 4 Quantitative Data: Measuring Breast
National Diabetes Fact Sheet, 2011
 National Diabetes Fact Sheet, 2011 FAST FACTS ON DIABETES Diabetes affects 25.8 million people 8.3% of the U.S. population DIAGNOSED 18.8 million people UNDIAGNOSED 7.0 million people All ages, 2010 Citation
Systematic Review of Dementia Prevalence and Incidence of Dementiain United States Race/Ethnic Populations
 DEMENTIA & ETHNICITY IN THE U.S.: PREVALENCE AND INCIDENCE IN ETHNIC AND RACIAL POPULATIONS Gwen Yeo, PhD, AGSF Updates on Dementia Conference May 11, 2017 Systematic Review of Dementia Prevalence and
REPRODUCTIVE HEALTH DISPARITIES FOR WOMEN OF COLOR
 DECEMBER 2004 Health Disparities REPRODUCTIVE HEALTH DISPARITIES FOR WOMEN OF COLOR Office of Human Rights and International Affairs Rita Webb, ACSW, DCSW rwebb@naswdc.org INTRODUCTION The United States
CHD in Race & Ethnicity. Gettyimages.com
 CHD in Race & Ethnicity Gettyimages.com Of all the forms of inequality, injustice in health care is the most inhumane. Martin Luther King, Jr. D e a t h s I n LEADING CAUSE OF DEATH FOR ALL MALES AND FEMALES
Issues in Women & Minority Health
 Issues in Women & Minority Health Dr. Dawn Upchurch Professor Department of Community Health Sciences PH 150 Dr. Upchurch 1 Overview of Session HP 2010 Model: Determinants of Health Review of HP 2010 Goals
Will Equity Be Achieved Through Health Care Reform?
 Will Equity Be Achieved Through Health Care Reform? John Z. Ayanian, MD, MPP Director & Alice Hamilton Professor of Medicine Mass Medical Society Public Health Leadership Forum April 4, 214 OBJECTIVES
CMS Office of Minority Health: Working To Achieve Health Equity through Understanding, Solutions, and Action
 CMS Office of Minority Health: Working To Achieve Health Equity through Understanding, Solutions, and Action Cara V. James, PhD CMS Office of Minority Health September 2015 A Quick Overview of Health Disparities
NCDB The National Center on Deaf-Blindness
 The 2016 National Child Count of Children and Youth who are Deaf-Blind NCDB The National Center on Deaf-Blindness October 2017 Table of Contents The 2016 National Child Count of Children and Youth who
Communities and Universities Working Together to Reduce Cancer Disparities Symposium 2005 UCLA
 Communities and Universities Working Together to Reduce Cancer Disparities Symposium 2005 UCLA Marjorie Kagawa Singer, Ph.D., M.N., M.A., R.N. UCLA School of Public Health and Asian American Studies Center
TOBACCO USE AND ETHNICITY
 TOBACCO USE AND ETHNICITY Adult and youth tobacco use rates and related smoking-caused death rates vary considerably among different ethnic groups in the United States. Adult Prevalence 15.5 percent of
RSR Crosswalk. Variable Client Race Race ID Values White 1 Black 2 Asian 3 Hawaiian / PI 4 Native American (AK native) 5
 5") October 2017 Purpose RSR Crosswalk This document can help you compare the data you currently collect in your data management system to the data required in the Ryan White Services Report (RSR). The Crosswalk
October 2017 Purpose RSR Crosswalk This document can help you compare the data you currently collect in your data management system to the data required in the Ryan White Services Report (RSR). The Crosswalk
Table of Contents. 2 P age. Susan G. Komen
 WYOMING Table of Contents Table of Contents... 2 Introduction... 3 About... 3 Susan G. Komen Affiliate Network... 3 Purpose of the State Community Profile Report... 4 Quantitative Data: Measuring Breast
Table of Contents. 2 P age. Susan G. Komen
 OREGON Table of Contents Table of Contents... 2 Introduction... 3 About... 3 Susan G. Komen Affiliate Network... 3 Purpose of the State Community Profile Report... 4 Quantitative Data: Measuring Breast
In Health Matters, Place Matters - The Health Opportunity Index (HOI) Virginia Department of Health Office of Health Equity
 Virginia Department of Health Office of Health Equity") In Health Matters, Place Matters - The Health Opportunity Index (HOI) Virginia Department of Health Office of Health Equity 1 Identifying the Problem America s Health Rankings United Health Foundation
In Health Matters, Place Matters - The Health Opportunity Index (HOI) Virginia Department of Health Office of Health Equity 1 Identifying the Problem America s Health Rankings United Health Foundation
Just the FACTS: You can help! Join the NMDP Registry. Vital Statistics
 Just the FACTS: You can help! Join the NMDP Registry Vital Statistics Every year, more than 10,000 men, women and children get life-threatening diseases such as leukemia and lymphoma, and do not have a
Health Disparities and Community Colleges:
 Health Disparities and Community Colleges: Being Part of the Solution Elmer R. Freeman, MSW Annual Convention of the American Association of Community Colleges Monday, April 11, 2005 Mission The mission
HEALTH DISPARITIES AMONG ADULTS IN OHIO
 OHIO MEDICAID ASSESSMENT SURVEY 2012 Taking the pulse of health in Ohio HEALTH DISPARITIES AMONG ADULTS IN OHIO Amy K. Ferketich, PhD 1 Ling Wang, MPH 1 Timothy R. Sahr, MPH, MA 2 1The Ohio State University
Table of Contents. 2 P age. Susan G. Komen
 NEW MEXICO Table of Contents Table of Contents... 2 Introduction... 3 About... 3 Susan G. Komen Affiliate Network... 3 Purpose of the State Community Profile Report... 3 Quantitative Data: Measuring Breast
Quantitative Data: Measuring Breast Cancer Impact in Local Communities
 Quantitative Data: Measuring Breast Cancer Impact in Local Communities Quantitative Data Report Introduction The purpose of the quantitative data report for the Southwest Florida Affiliate of Susan G.
Alcohol use and binge drinking among Hispanic/Latino subculture youth, and the differences in the affect of acculturation
 Alcohol use and binge drinking among Hispanic/Latino subculture youth, and the differences in the affect of acculturation Hal Johnson, MPH Florida Substance Abuse Program Office and the FSU Florida Center
CANCER SCREENING IN MINORITY AND UNDERSERVED POPULATIONS
 CANCER SCREENING IN MINORITY AND UNDERSERVED POPULATIONS Gina Villani, MD, MPH CEO and Medical Director Healthfirst 2016 Fall Symposium Prevention as a Priority in Value-Based Healthcare Part II Disparities
RACIAL AND ETHNIC APPROACHES TO COMMUNITY HEALTH. Why REACH Works Overcoming Challenges
 RACIAL AND ETHNIC APPROACHES TO COMMUNITY HEALTH Why REACH Works Overcoming Challenges Why REACH? Disparities in health care are among the nation s most serious health care problems. Research has extensively
Prevalence of Self-Reported Obesity Among U.S. Adults by State and Territory. Definitions Obesity: Body Mass Index (BMI) of 30 or higher.
 of 30 or higher.") Prevalence of Self-Reported Obesity Among U.S. Adults by State and Territory Definitions Obesity: Body Mass Index (BMI) of 30 or higher. Body Mass Index (BMI): A measure of an adult s weight in relation
Prevalence of Self-Reported Obesity Among U.S. Adults by State and Territory Definitions Obesity: Body Mass Index (BMI) of 30 or higher. Body Mass Index (BMI): A measure of an adult s weight in relation
Global TB Burden, 2016 estimates
 TUBERCULOSIS EPIDEMIOLOGY LOCAL, STATE, NATIONAL, GLOBAL Office of Communicable Disease Epidemiology Global TB Burden, 216 estimates Total TB Estimated number of TB cases 1.4 million 14 per 1, Estimated
Women s health status is one of the strongest determinants of how women use the health care system. The
 Women s health status is one of the strongest determinants of how women use the health care system. The poorer their health, the more women need and benefit from high-quality, appropriate care. Overall,
Lane County Health Equity Report
 2017 Health Equity Report Table of Contents Executive Summary.................................................................... 1 Introduction...........................................................................
Walworth County Health Data Report. A summary of secondary data sources
 Walworth County Health Data Report A summary of secondary data sources 2016 This report was prepared by the Design, Analysis, and Evaluation team at the Center for Urban Population Health. Carrie Stehman,
Health Disparities, Social Determinants of Health, and Health Equity
 Centers for Disease Control and Prevention Health Disparities, Social Determinants of Health, and Health Equity Leandris Liburd, PhD, MPH Associate Director for Minority Health and Health Equity SOPHE
Overview of Health Care Disparities in Maryland
 Maryland Health Benefit Exchange Plan Management Advisory Committee Overview of Health Care Disparities in Maryland June 18, 2012 Carlessia A. Hussein, RN, DrPH David A. Mann, MD, PhD Office of Minority
2012 Medicaid and Partnership Chart
 2012 Medicaid and Chart or Alabama $525,000.00 $4,800.00 Minimum: 25,000.00 Alaska $525,000.00 Depends on area of state; Minimum: $113,640 $10,000 in Anchorage $1,656 Minimum:$1838.75 Maximum:$2,841 Minimum:
Diversity Data Snapshots March 2014 Edition
 Diversity Data Snapshots March 2014 Edition Diversity Policy and Programs CDC Health Disparities and Inequalities Report United States, 2013 CDC Health Disparities and Inequalities Report United States,
HEALTH DISPARITIES By Hana Koniuta November 19, 2010
 HEALTH DISPARITIES By Hana Koniuta November 19, 2010 "We need to focus on the uninsured and those who suffer from health care disparities that we so inadequately addressed in the past." Sen. Bill Frist
Chlamydia, Gonorrhea, Disparities: A National Perspective (anything else?) Catherine Lindsey Satterwhite Region IV IPP Meeting October 8, 2009
 Catherine Lindsey Satterwhite Region IV IPP Meeting October 8, 2009") Chlamydia, Gonorrhea, Disparities: A National Perspective (anything else?) Catherine Lindsey Satterwhite Region IV IPP Meeting October 8, 29 Outline Disease burden and disparities Morbidity data IPP data
Chlamydia, Gonorrhea, Disparities: A National Perspective (anything else?) Catherine Lindsey Satterwhite Region IV IPP Meeting October 8, 29 Outline Disease burden and disparities Morbidity data IPP data
National Landmark Reports Highlighting Cancer Disparities Problem
 National Landmark Reports Highlighting Cancer Disparities Problem Pre - 1980 1986 1989 1996 1999 2001 2002 2003 5 Leading Causes of Death, U.S., 2003, Female 1 2 3 4 5 All races Cardiovascular Cancer Cerebrovascular
Systematic Review of Dementia Prevalence and Incidence of Dementia in United States Race/Ethnic Populations. Search. Data Base.
 BREAKOUT SESSION DEMENTIA & ETHNICITY IN THE U.S.: PREVALENCE AND INCIDENCE IN ETHNIC AND RACIAL POPULATIONS Gwen Yeo, PhD, AGSF. Meeting of the Minds Conference March 18, 2017 Systematic Review of Dementia
ABSTRACT. Effects of Birthplace, Language, and Length of Time in the U.S. on Receipt of Asthma Management Plans Among U.S. Adults with Current Asthma
 ABSTRACT Title of thesis: Effects of Birthplace, Language, and Length of Time in the U.S. on Receipt of Asthma Management Plans Among U.S. Adults with Current Asthma Sonja Natasha Williams, Masters of
Nevada Department of Health and Human Services
 Nevada Department of Health and Human Services Minority Health in Nevada February 20, 2007 Nevada Health Division Bureau of Community Health Jim Gibbons, Governor Michael J. Willden, Director Department
National Deaf Center on Postsecondary Outcomes. Data Interpretation Guide for State Reports: FAQ
 National Deaf Center on Postsecondary Outcomes Data Interpretation Guide for State Reports: FAQ This document was developed under a grant from the U.S. Department of Education, OSEP #HD326D160001. However,
Deaths in Hawaii Due to Major Cardiovascular Disease
 in Hawaii Due to Major Cardiovascular Disease Death Counts, Age-Adjusted Mortality Rates, and Years of Potential Life Lost for Coronary Heart Disease for the State of Hawaii (Residents Only), by State,
ILI Syndromic Surveillance
 ILI Syndromic Surveillance Race/ethnicity of adult respondents with influenza-like illness (ILI) in the U.S., Behavioral Risk Factor Surveillance System (BRFSS), Sept 1- Sep 30, 2009 Race/ethnicity I
Racial and Ethnic Health Disparities Report Card
 Racial and Ethnic Health Disparities Report Card August 2010 Acknowledgements Many individuals contributed to the production of this report card. The Division of Policy and Performance wishes to particularly
The Elimination of Racial and Ethnic Disparities A Public Health Priority
 Massachusetts Department of Public Health The Elimination of Racial and Ethnic Disparities A Public Health Priority September, 2009 The Elimination of Racial and Ethnic Disparities is a Core Public Health
2014 Annual Report Tuberculosis in Fresno County. Department of Public Health
 214 Annual Report Tuberculosis in Fresno County Department of Public Health www.fcdph.org Tuberculosis (TB) is a common communicable disease caused by the bacterium Mycobacterium tuberculosis and occasionally
Ten Years Later: How Far Have We Come In Reducing Health Disparities?
 Ten Years Later: How Far Have We Come In Reducing Health Disparities? Howard K. Koh MD, MPH Assistant Secretary for Health Department of Health and Human Services WHO Definition of Health: A state of complete
2018 HPV Legislative Report Card
 2018 HPV Legislative Report Card This report card is a snapshot of each state s documented efforts to enact or introduce HPV vaccine legislation to improve education and awareness, or provide access to
Statistical Fact Sheet Populations
 Statistical Fact Sheet Populations At-a-Glance Summary Tables Men and Cardiovascular Diseases Mexican- American Males Diseases and Risk Factors Total Population Total Males White Males Black Males Total
Regional and Hispanic Subgroup Disparities in the Prevalence of Diabetes & Hypertension Among Older Adults
 Regional and Hispanic Subgroup Disparities in the Prevalence of Diabetes & Hypertension Among Older Adults Catherine Pérez Jennifer A. Ailshire Conference Series on Aging in the Americas September 21,
Location of RSR Client-level Data Elements in CAREWare Updated Sept 2017
 Location of RSR Client-level Data Elements in CAREWare Updated Sept 2017 Demographics Required of all clients that received any core medical or support service if they are ELIGIBLE for RWHAP services.
Breast Cancer in Women from Different Racial/Ethnic Groups
 Cornell University Program on Breast Cancer and Environmental Risk Factors in New York State (BCERF) April 2003 Breast Cancer in Women from Different Racial/Ethnic Groups Women of different racial/ethnic
CASINO REVENUE AND AMERICAN INDIAN HEALTH
 CASINO REVENUE AND AMERICAN INDIAN HEALTH The Link Between Tribal Gaming and the Health Status and Behaviors of American Indians Barbara Wolfe Jessica Jakubowski Robert Haveman Hannah Goble Marissa Courey
Racial/Ethnic Health Disparities Among Women in California
 WOMEN S HEALTH BRIEF JANUARY 2014 Racial/Ethnic Health Disparities Among Women in California A PUBLICATION OF THE Elaine Zahnd and Roberta Wyn Introduction For the past twenty years, the goal of the federal
Table of Contents. 2 P age. Susan G. Komen
 IDAHO Table of Contents Table of Contents... 2 Introduction... 3 About... 3 Susan G. Komen Affiliate Network... 3 Purpose of the State Community Profile Report... 4 Quantitative Data: Measuring Breast
Wellness County Profile ROGERS
 Wellness County Profile 2018 ROGERS OKLAHOMA MAPS This image cannot currently be displayed. ROGERS Insurance Coverage Population 91,766 Unemployment Rate (2013-2015) High School Dropouts: Class
Wellness County Profile STEPHENS
 Wellness County Profile 2018 STEPHENS OKLAHOMA MAPS STEPHENS Insurance Coverage Population 44,090 Unemployment Rate (2013-2015) High School Dropouts: Class of 16 Uninsured Insured 15.9% Stephens
Wellness County Profile JOHNSTON
 Wellness County Profile 2018 JOHNSTON OKLAHOMA MAPS JOHNSTON Insurance Coverage Population 11,087 Unemployment Rate (2013-2015) High School Dropouts: Class of 16 Uninsured Insured 19.1% Johnston
Wellness County Profile CRAIG
 Wellness County Profile 2018 CRAIG OKLAHOMA MAPS CRAIG Insurance Coverage Population 14,625 Unemployment Rate (2013-2015) High School Dropouts: Class of 16 Uninsured Insured 18.1% Craig 5.6
The 2004 National Child Count of Children and Youth who are Deaf-Blind
 The 2004 National Child Count of Children and Youth who are Deaf-Blind NTAC The Teaching Research Institute Western Oregon University The Helen Keller National Center Sands Point, New York The National
TB EPIDEMIOLOGY. Outline. Estimated Global TB Burden, TB epidemiology
 TB EPIDEMIOLOGY TB Clinical Intensive Course Curry International Tuberculosis Center September 30, 2015 Varsha Nimbal, MPH Tuberculosis Control Branch California Department of Public Health 1 Outline TB
Data Disaggregation to Inform Health Policy
 Data Disaggregation to Inform Health Policy Minh Wendt Data Policy Lead Division of Policy & Data Office of Minority Health Department of Health and Human Services The Report of the Secretary s Task Force
Table of Contents. 2 P age. Susan G. Komen
 NORTH DAKOTA Table of Contents Table of Contents... 2 Introduction... 3 About... 3 Susan G. Komen Affiliate Network... 3 Purpose of the State Community Profile Report... 3 Quantitative Data: Measuring
Wellness County Profile GARFIELD
 Wellness County Profile 2018 GARFIELD OKLAHOMA MAPS GARFIELD Insurance Coverage Population 62,603 Unemployment Rate (2013-2015) High School Dropouts: Class of 16 Uninsured Insured 16.5% Garfield
Wellness County Profile GARVIN
 Wellness County Profile 2018 GARVIN OKLAHOMA MAPS GARVIN Insurance Coverage Population 27,838 Unemployment Rate (2013-2015) High School Dropouts: Class of 16 Uninsured Insured 16.7% Garvin
Wellness County Profile BECKHAM
 Wellness County Profile 2018 BECKHAM OKLAHOMA MAPS BECKHAM Insurance Coverage Population 22,519 Unemployment Rate (2013-2015) High School Dropouts: Class of 16 Uninsured Insured 15.2% Beckham
Wellness County Profile SEMINOLE
 Wellness County Profile 2018 SEMINOLE OKLAHOMA MAPS SEMINOLE Insurance Coverage Population 25,207 Unemployment Rate (2013-2015) High School Dropouts: Class of 16 Uninsured Insured 18.9% Seminole
Exhibit 1. Change in State Health System Performance by Indicator
 Exhibit 1. Change in State Health System Performance by Indicator Indicator (arranged by number of states with improvement within dimension) Access and Affordability 0 Children ages 0 18 uninsured At-risk
Cancer Prevention & Early Detection Facts & Figures. Tables and Figures 2018
 Cancer Prevention & Early Detection Facts & Figures Tables and Figures 2018 1 Table of Contents Tobacco Use Figure 1A. State Cigarette Excise Tax, 2018..... 3 Figure 1B. Proportion of Cancer Deaths Attributable
Hispanics/Latinos and Hepatitis: An Overlooked Health Disparity. National Hispanic Hepatitis Awareness Day
 Hispanics/Latinos and Hepatitis: An Overlooked Health Disparity National Hispanic Hepatitis Awareness Day HELLO! LUIS A. MARES, LMSW Director of Community Mobilization Latino Commission on AIDS. Lmares@latinoaids.org
Cessation and Cessation Measures
 Cessation and Cessation Measures among Adult Daily Smokers: National and State-Specific Data David M. Burns, Christy M. Anderson, Michael Johnson, Jacqueline M. Major, Lois Biener, Jerry Vaughn, Thomas
Wellness County Profile SEQUOYAH
 Wellness County Profile 2018 SEQUOYAH OKLAHOMA MAPS SEQUOYAH Insurance Coverage Population 41,294 Unemployment Rate (2013-2015) High School Dropouts: Class of 16 Uninsured Insured 18.1% Sequoyah
THE HEALTH OF CHINESE AMERICANS: 1970 TO TODAY PRESENTED BY KATHY KO CHIN, PRESIDENT AND CEO ASIAN & PACIFIC ISLANDER AMERICAN HEALTH FORUM
 THE HEALTH OF CHINESE AMERICANS: 1970 TO TODAY PRESENTED BY KATHY KO CHIN, PRESIDENT AND CEO ASIAN & PACIFIC ISLANDER AMERICAN HEALTH FORUM OUR MISSION The Asian & Pacific Islander American Health Forum