SYCAMORE SHOALS HOSPITAL CARTER COUNTY, TENNESSEE 2011 COMMUNITY HEALTH NEEDS ASSESSMENT
|
|
|
- Edmund Fields
- 6 years ago
- Views:
Transcription

1 SYCAMORE SHOALS HOSPITAL CARTER COUNTY, TENNESSEE 2011 COMMUNITY HEALTH NEEDS ASSESSMENT Published June 29, 2012 Page - 1 -
2 Page - 2 -
3 Table of Contents I. Introduction II. Executive Summary III. Community Interview Summary a. Collecting Community Input b. Health Status Rating c. Top Health Priorities d. Identifying Available Resources e. Improving Health Priorities IV. Global Perspective (America s Health Rankings overview) a. Introduction b. Findings c. State Summary V. Regional Perspective a. SSH Snapshot Page - 3 -
4 Introduction M ountain States Health Alliance (MSHA) is an integrated health care delivery system providing a comprehensive continuum of care to people in 29 counties in Tennessee, Virginia, Kentucky, and North Carolina. MSHA was formed after Johnson City Medical Center Hospital, Inc. acquired six Columbia/HCA hospitals in Northeast Tennessee on September 1, 1998; and was later renamed Mountain States Health Alliance in January Today, MSHA is the largest regional health care system with 13 hospitals operating at approximately $1.0 billion in net revenues. The hospitals are: Johnson City Medical Center Niswonger Children s Hospital Woodridge Psychiatric Hospital James H. and Cecile C. Quillen Rehabilitation Hospital Franklin Woods Community Hospital Indian Path Medical Center Johnson County Community Hospital Sycamore Shoals Hospital Dickenson Community Hospital Johnston Memorial Hospital Norton Community Hospital Russell County Medical Center Smyth County Community Hospital In addition to 13 hospitals, MSHA s integrated health care delivery system includes primary/preventive care centers and numerous outpatient care sites, including First Assist Urgent Care, MedWorks, Same Day Surgery, and Mountain States Rehabilitation. Executive Summary Regional and national rankings for health factors continue to be disappointing as cancer, heart disease, and diabetes rates continue to increase each year. Obesity continues to be a major problem in the United States, leading to additional diseases. From a global perspective, the United States falls behind other developing nations in health outcomes. Clearly, there are many needs that exist and need attention. Mountain States Health Alliance (MSHA) exists to identify and respond to the health care needs of individuals and communities in our region and to assist them in attaining their highest possible level of health. In order for MSHA to serve its region most effectively, it is essential to understand each community s individual needs. MSHA has conducted a Community Health Needs Assessment to profile the health of the residents within the local region. The assessment focuses on MSHA s 13 core counties, nine of which have MSHA facilities Carter, TN; Dickenson, VA; Johnson, TN; Norton/Wise, VA; Russell, VA; Smyth, VA; Sullivan, TN; Washington, TN; and Bristol City/Washington, VA. The other four counties in which MSHA does not have a facility include Greene, TN; Hawkins, TN; Scott, VA; and Unicoi, TN. See map on page 5. Activities associated with the development of this assessment have taken place during the winter of 2011 and spring of 2012, including state, regional and county-specific secondary data collection and primary data obtained through 67 surveys with individuals from the local communities. Page - 4 -

5 Community Health Needs Assessment Interview Summary Represents county in which MSHA owns a facility. MSHA has part-ownership in other hospitals but they are not included in this assessment. *Service Area is defined by approximately 80% of inpatient population. Throughout the assessment, high priority was given to determining the health status and available resources within each community. Community members from each county met with MSHA to discuss current health priorities and identify potential solutions. The information gathered from a local perspective, paired with regional, state and national data, helps to communicate the region s health situation in order to begin formulating solutions for improvement. After compiling the various sources of information, four top health priorities were identified by all nine counties within MSHA s core service area. These priorities include: cancer, obesity, diabetes, and heart disease. In 2011, Tennessee ranked 39 th and Virginia ranked 20 th out of 50 states, for overall health outcomes. Both states had high rates of adult obesity, cancer deaths, infant mortality, and diabetes. Though Virginia s overall ranking is moderately low, the health outcomes in Southwest Virginia, where MSHA s facilities are located, resembles those of Tennessee. By examining national data, MSHA is able to identify successful measures that have been used in other states to solve similar issues. Vermont, for instance, ranked 1 st in 2011 after being ranked 17 th in Though obesity and diabetes rates are still increasing in Vermont, the percentage of affected adults is much lower than other states. Page - 5 -
6 Community Health Needs Assessment Interview Summary According to America s Health Rankings 2011 Edition, Carter County is ranked 54th in TN for health outcomes and 52nd for health factors out of 95 counties. The leading causes of death of individuals 65 years and older are heart disease, cancer, and respiratory. In addition, Carter County ranks 78th for health behaviors when compared to other TN counties due to high rates of physical inactivity, high overweight/obesity rates, and low consumption of vegetables. These scores are offset somewhat by scoring 41st in social & economic factors and 37th in physical environment. By utilizing effective measures, available resources and community member involvement, county-specific plans have been developed and implemented which focus on preventing the growth of the four identified health outcomes. However, it is apparent that it takes more than just resources and an implementation plan to challenge these health priorities. MSHA is nevertheless, committed to seeing change take place within each community it serves. The following information has been collected and reviewed by the representatives from the Strategic Planning Department and Government Relations. Following presentation to the MSHA Social Responsibility Committee, future initiatives will be identified, prioritized, implemented, and monitored to ensure health status progress occurs. Community Interview Summary Throughout January and February of 2012, the MSHA Strategic Planning Department hosted four separate luncheons in order to connect with community members of each county in which MSHA owns a facility. MSHA hospital administration teams were contacted in order to obtain names of individuals in the community who were considered public health officials or community leaders. The 67 interviewees in attendance were local physicians, school board members, non-profit directors, health department officials, school nurses, minority group leaders, and others all from the nine counties in which MSHA has facilities: Carter, Johnson, Sullivan, and Washington counties in Tennessee and Dickenson, Norton City/Wise, Russell, Smyth, and Bristol City/Washington counties in Virginia. These individuals were invited to discuss and determine the health priorities and resources available in each area. Collecting Community Input In order to complete the community health needs assessment for Sycamore Shoals Hospital, MSHA met with six individuals from Carter County, TN. The organizations that were represented are listed in Table 1.1. Table 1.1 Summary Organizations Participating in SSH s CHNA Reported Organizations Providing Input for Assessment Carter County Board Carter County Emergency Medical Services First TN Human Resource Agency Roan Highlands Sycamore Shoals Hospital Page - 6 -
7 Community Health Needs Assessment Interview Summary To begin the community health needs assessment, MSHA s strategic planning staff presented data that had been collected in-house in order to illustrate past and current health trends for Tennessee and Virginia. The presentation depicted the current national health rankings, in addition to providing a snapshot of each county in MSHA s service area. Following the presentation, each participant was given a survey to determine the individual s personal assessment of their county s health priorities. Secondly, the individuals were asked to submit ideas and suggestions as to how MSHA could use the available resources in order to improve the health priorities determined. After the surveys had been completed, each group discussed the questions and continued brainstorming ways to address obstacles and utilize resources. All of the information collected from the surveys and open discussion was evaluated and prioritized based on health needs. In surveys obtained from six community representatives, several community health needs and resources were identified. Table 1.2 lists the survey questions given to each participant in the assessment. Table 1.2 Community Survey Questions Survey Questions 1 How would you rate the general health status of the patient population in this community on a scale of 1 to 10 (with 1 being the poorest and 10 being the best)? 2 Keeping in mind resources are not unlimited, are there other health priorities you feel should be addressed as well? 3 What existing resources, such as organized groups or public health initiatives have been developed and are in place to address these health priorities? 4 What ideas do you have that may serve to improve these health priorities? Health Status Rating Overall, the general health status of Carter County was rated as 4.91 on a scale of 1 10, with 1 being the poorest and 10 being the best. Individual responses ranged from 3 to 7. The health ranking determined by participants can be found below in Table 1.3. Table 1.3 Average Health Status Ranking MSHA Facility/County Number of Attendants Average of Health Status Rating Sycamore Shoals Hospital, Carter County, TN Top Health Priorities All six interviewees agreed that the most prevalent health priorities in all counties were obesity, diabetes, cancer and heart disease. All of these could be positively impacted by addressing the obesity issue as it is a health risk factor for each of these diseases. In addition to these four, community members identified several other health priorities that need to be addressed. Tables 1.4 and 1.5 list the top health priorities identified by community participants. Page - 7 -
8 Community Health Needs Assessment Interview Summary Table 1.4 Top Identified Health Priorities Top Health Priorities Responses % of Total Responses Obesity 6 100% Cancer 6 100% Diabetes 6 100% Heart Disease 6 100% Table 1.5 Additional Identified Health Priorities Sycamore Shoals Hospital Carter County, TN Responses Percentage Substance Abuse/Rx Abuse % Mental Health % Dental Health % Hygiene 1 7.1% Lack of Health Insurance 1 7.1% Teen Pregnancy 1 7.1% Primary Care 1 7.1% TOTAL Responses % *Interviewees submitted multiple responses regarding health priorities Identifying Available Resources MSHA realizes that there are numerous resources in all of the counties it serves that can provide care for individuals. Our goal, in order to reduce costs and provide the best care possible for patients, is to identify these resources to prevent duplication of services. The interviewees were asked to list all of the services and resources within their community. The interviewees acknowledged that many resources currently exist to help meet health needs. Table 1.6 lists the current organizations within Carter County that offer health services to the community. Table 1.6 Identified Available Resources Resources Available Carter County, Tennessee Roan Mountain Health Screenings Carter County Health Department Sycamore Shoals Hospital *MSHA understands that there are other resources available in each county that are not listed in this table. This table represents only the resources listed by participants in community health needs assessment. MSHA will continue to identify resources. Page - 8 -
9 Community Health Needs Assessment Interview Summary Improving Health Priorities The community members who were surveyed provided helpful ideas as to how to begin formulating a plan to improve the health priorities throughout the region. To enhance existing resources, the participants stressed the significance of increasing public awareness of both addressing one s health needs and the availability of health care options within each community. Additional suggestions as to how MSHA can improve the previously identified health priorities are listed in Table 1.7. Table 1.7 Ideas to Improve Health Priorities Responses 1 Focus on school children by providing education to promote healthy habits. Counter obesity, drug use, and teen pregnancy. 2 Require physical education activity as part of school curriculum. Incentivize employers or community to improve overall health status and address 3 specific health issues. 4 Network to avoid duplicating services. 5 Improve natural trails and parks to encourage physical activity. 6 Increase community support for smoke-free areas. 7 Provide early screening for underinsured or uninsured. 8 Advertise health fairs and other educational programs. 9 Develop site for end-of-life care. 10 Partner with local farmers markets. 11 Extend partnerships with private business 12 Share health information between pharmacies Page - 9 -
10 Community Health Needs Assessment Global Overview Global Perspective (Provided by America s Health Rankings)* The focus on development of a community needs assessment for Mountain States Health Alliance is to determine the needs for the local communities and the service area in which we operate. However, it is also helpful to understand from a more global perspective the health status of the nation as a whole, since many issues MSHA s service area experiences are not limited to just this region. Compiled on an annual basis, the America s Health Rankings publication developed by the United Health Foundation, the American Public Health Association and Partnership for Prevention provides one of the most comprehensive assessments regarding the status of the nation s health. The following information in the national and regional overview is from the 2011 edition. Introduction Health is a result of behavior, individual genetic predisposition to disease, the environment and the community in which we live, the clinical care received and the policies and practices of our health care and prevention systems. Each of us, individually, as a community, and as a society, strives to optimize these health determinants, so that all of us can have a long, disease-free and robust life regardless of race, gender or socio-economic status. This report looks at the four groups of health determinants that can be affected: 1. Behaviors include the everyday activities that affect personal health. It includes habits and practices developed by individuals and families that have an effect on personal health and on utilization of health resources. These behaviors are modifiable with effort by the individual supported by community, policy and clinical interventions. 2. Community and environment reflects the reality that daily conditions have a great effect on achieving optimal individual health. 3. Public and health policies are indicative of the availability of resources to encourage and maintain health and the extent that public and health programs reach into the general population. 4. Clinical care reflects the quality, appropriateness and cost of the care received at doctors' offices, clinics and hospitals. All health determinants are intertwined and must work together to be optimally effective. For example, an initiative that addresses tobacco cessation requires not only efforts on the part of the individual but also support from the community in the form of public and health policies that promote non-smoking and the availability of effective counseling and care at clinics. Similarly, sound prenatal care requires individual effort, access to and availability of prenatal care coupled with high-quality health care services. Addressing obesity, which is a health epidemic now facing this country, requires coordination among almost all sectors of the economy including food producers, distributors, restaurants, grocery and convenience stores, exercise facilities, parks, urban and transportation design, building design, educational institutions, community organizations, social groups, health care delivery and insurance to complement and augment individual actions. *America s Health Rankings 2011 Report can be found online at It is a product of United Health Foundation. Page

11 Community Health Needs Assessment Global Overview America's Health Rankings combines individual measures of each of these determinants with the resultant health outcomes into one, comprehensive view of the health of a state. Additionally, it discusses health determinants separately from health outcomes and provides related health, economic and social information to present a comprehensive profile of the overall health of each state. America's Health Rankings employs a unique methodology, developed and periodically reviewed by a panel of leading public health scholars, which balances the contributions of various factors, such as smoking, obesity, binge drinking, high school graduation rates, children in poverty, access to care and incidence of preventable disease, to a state's health. The report is based on data from the U.S. Departments of Health and Human Services, Commerce, Education and Labor; U.S. Environmental Protection Agency; the American Medical Association; the Dartmouth Atlas Project; the Trust for America's Health; the World Health Organization; and the Organization for Economic Co-operation and Development (OECD). Findings Comparison to Other Nations When health in the United States is compared to health in other countries, the picture is disappointing. The World Health Organization, in its annual World Health Statistics 2011, compares the United States to the nations of the world on a large variety of measures. While the U.S. does exceed many countries, it is far from the best in many of the common measures used to gauge healthiness, and it lags behind its peers in other developed countries. Life expectancy is a measure that indicates the number of years that a newborn can expect to live. Japan is the perennial leader in this measure, with a life expectancy of 86 years on average for females and 80 years for males (San Marino men have a longer life expectancy at 82 years). With a life expectancy of 81 years for women, the United States is 32 nd among the 193 reporting nations of the World Health Organization and at 76 years for men, the United States is 34 th among nations. Table 7 lists a few other countries for comparison purposes. U.S. male life expectancy rates are on par with Chile, Cuba and Slovenia, and U.S. female life expectancy rates are on par with Costa Rica and Denmark. *America s Health Rankings 2011 Report can be found online at It is a product of United Health Foundation. Page
12 Community Health Needs Assessment Global Overview One of the underlying causes for these differences is the gap in infant mortality rates between the United States and many other countries (Table 7). The infant mortality rate for the U.S. in 2009 was seven deaths per 1,000 live births, ranking the United States 43rd among WHO nations. Rates for Sweden, Spain, Italy, Germany, France, Czech Republic, Slovenia and Iceland are all half of the United States rate. These countries also have considerably lower infant mortality rates than those of non-hispanic whites in the United States, the ethnic/racial group with the lowest rates in the United States. In the United States, the infant mortality rate is also a health equity issue. Infant mortality among non- Hispanic whites is 4.8 deaths per 1,000 live births - still higher than 28 other countries. Infant mortality in the United States among non-hispanic blacks, however, is 11.1 deaths per 1,000 live births; 2.3 times that of non-hispanic whites and 60 th among countries 1. The life expectancy in the United States of a 65-year-old woman is 19.8 years, lower than 22 other OECD countries including France at 22.3 years, Spain at 22.2 years, Canada at 21.3 years and United Kingdom at 20.2 years. For 65-year-old men, the difference in life expectancy in the United States compared to other nations is less pronounced. Life expectancy for 65-year-old males is 17.1 years in the United States, 18.1 years in Canada, 17.6 in the United Kingdom, 18.0 years in France and 17.8 years in Spain 2. Differences in life expectancy are also impacted by the effectiveness of treating disease, especially diseases that are amenable to care, including bacterial infections, treatable cancers, diabetes, cardiovascular and cerebrovascular disease, some ischemic heart disease and complications from common surgical procedures. The age-adjusted amenable mortality rate before age 75 for the United States was 95.5 deaths per 100,000 population in 2006 to This is a considerable improvement from deaths per 100,000 population in 1997 to 1998, but the rate of improvement was much slower than in other Organization for Economic Cooperation and Development (OECD) nations studied. The rate in the U.S. remains 50 percent higher than the rate in Australia, France, Japan and Italy. This study estimated that if the United States achieved rates on par with comparative countries, between 59,500 and 84,300 deaths before age 75 would have been saved. Additionally, the study indicated that despite spending more than any other country on health care, the United States continues to slip further behind other countries. In 1997, the U.S. ranked 15th in this mortality rate. Since then, Finland, Portugal, the United Kingdom and Ireland have reduced their mortality rate from disease amenable to care more rapidly than the United States. All now have better rates than the U.S 3. The homicide rate also distinguishes the United States from other OECD countries, as the United States ranks 29th among the 31 countries and its rate is more than double that of most other countries. France, Germany, Canada, Spain and the United Kingdom have homicide rates under 2 deaths per 100,000 population, and the United States has 5.2 deaths per 100,000 population. The homicide rate in the United States disproportionately affects young black adults, where homicide rates are seven times those of young white adults. (The homicide rate for blacks age 15 to 24 is 48.9 deaths per 100,000 population, whereas the homicide rate for whites age 15 to 24 is 6.7 deaths per 100,000 population.) The results of these studies should be a wake-up call to everyone in the United States to strive to improve all aspects of the health system however possible, including education, safety, prevention and clinical care. Other countries have improved their overall health, indicating that the United States too can do the same. *America s Health Rankings 2011 Report can be found online at It is a product of United Health Foundation. Page
13 Community Health Needs Assessment National Overview National Changes from 1990 The 22-year perspective provides a view of health over time. During the past 22 years, this report has tracked the nation s 21.2 percent improvement in overall health (Graph 1). National success stems from improvements in the reduction of infant mortality, infectious disease, prevalence of smoking, cardiovascular deaths and violent crime, among others (Table 3). Graph 1 illustrates that the rate of improvement experienced in the health of the United States population occurred in two phases. During the 1990s, improvement in national health averaged 1.6 percent per year. During this decade, the annual improvement in health has averaged 0.5 percent per year. The annual rate of growth this decade is less than one-third of the annual rate of growth during the 1990s. Special concern surrounds the decline in health determinants, as those measures point to the future health of the population. Graph 1: Improvements Since 1990 *America s Health Rankings 2011 Report can be found online at It is a product of United Health Foundation. Page
14 Community Health Needs Assessment Global Overview Table 1 - National Measures of Successes and Challenges: 2011 Edition MEASURE SUCCESSES Smoking CHANGES The prevalence of smoking decreased 41 percent from 29.5 percent in the 1990 Edition to 17.3 percent of the adult population in the current edition. Smoking dropped from 17.9 percent to 17.3 percent in the last year, continuing a gradual decline over the past eight years. Violent Crime The violent crime rate declined 34 percent from 609 offenses in the 1990 Edition to 404 offenses per 100,000 population in the 2011 Edition. Violent crime dropped by 25 offenses per 100,000 population in the last year. Preventable Hospitalizations Preventable hospitalizations continue a 10-year decline. In the 2001 Edition, there were 82.5 discharges; in this edition, there were 68.2 discharges per 1,000 Medicare enrollees. Occupational Fatalities Occupational fatalities have declined slightly in the last five years from 5.3 deaths in the 2007 Edition to 4.0 deaths per 100,000 workers in the 2011 Edition. Rates are the lowest in 22 years. Air Pollution The average amount of fine particulate in the air continues to decline from 13.2 micrograms in the 2003 Edition to 10.8 micrograms per cubic meter in Infectious Disease Infectious disease has dropped from 19.7 cases in the 1998 Edition to 10.3 cases per 100,000 population in the 2011 Edition. However, the incidence is above the rate of 9.0 cases achieved in 2009 and Infant Mortality The infant mortality rate decreased 33 percent from 10.2 deaths in the 1990 Edition to 6.7 deaths per 1,000 live births in Improvements have slowed dramatically in the Premature Death CHALLENGES Obesity last 10 years as compared to the 1990s. Years of potential life lost before age 75 per 100,000 population declined 16 percent from 8,716 in the 1990 Edition to 7,279 years of potential life lost before age 75 per 100,000 population in Premature deaths, like several other metrics, have leveled off in the last decade compared to gains in the 1990s. The prevalence of obesity increased 137 percent from 11.6 percent in the 1990 Edition to 27.5 percent of the population in the 2011 Edition. Diabetes Diabetes has almost doubled in prevalence since the 1996 Edition, rising from 4.4 percent to 8.7 percent of the adult population. This continued 0.3 percent annual increase does not show signs of abating in the near term. Children in Poverty Lack of Health Insurance Binge Drinking High School Graduation Rate The percentage of children in poverty has increased for the last four editions and, at 21.5 percent of persons under age 18, is approaching the 22-year historical high of 22.7 percent in the 1994 Edition. This is far above the 22-year low of 15.8 percent in the 2002 Edition. The rate of uninsured population has increased 17 percent from 13.9 percent in the 2001 Edition to 16.2 percent in The rate of uninsured population has slowly but steadily increased during the last 10 years. The percent of adults who report binge drinking remains above 15 percent of the population. Over the last seven years, the high school graduation rate remains locked in the range of 73 percent to 75 percent of incoming ninth graders who graduate in four years. Page
15 Community Health Needs Assessment Global Overview The United States has the potential to return to the rates of improvement typical in the 1990s. However, to do so, it must address the drivers of health directly by focusing on reducing important risk factors. For example, the prevalence of smoking was stagnant for many years and now is showing improvement, declining from 23.2 percent in the 2003 Edition to 17.3 percent in the 2011 Edition, the lowest level in 22 years (Graph 2). Utah has reduced its smoking rate to less than 10 percent, lower than the 12 percent goal for the nation set forth in Healthy People Seven other states (California, Connecticut, Arizona, Massachusetts, New Jersey, Hawaii and Minnesota) have driven their smoking rates to less than 15 percent, approaching the Healthy People 2020 goal. Graph 2 - Prevalence of Smoking Since 1990 Unprecedented and still unchecked growth in the prevalence of obesity dramatically affects the overall health of the United States. The prevalence of obesity has increased 137 percent, from 11.6 percent of the population in the 1990 Edition to 27.5 percent of the population in the 2011 Edition. Now, more than one in four people in the U.S. is considered obese a category that the CDC reserves for those who are significantly over the suggested body weight given their height. This alarming rate of increase shows little evidence of slowing or abating (Graph 3). Because this data relies on self-reported height and weight, actual obesity rates, as measured by health professionals, may be up to 10 percent higher, meaning that more than one-third of the population is likely to be obese. Obesity is known to contribute to a variety of diseases, including heart disease, diabetes and general poor health. Graph 3 - Prevalence of Obesity Since 1990 *America s Health Rankings 2011 Report can be found online at It is a product of United Health Foundation. Page
16 Community Health Needs Assessment Global Overview The current economic climate also increases the challenge of maintaining a healthy population. Graph 4 shows the recent increase in the percentage of children in poverty in the last few years, increasing from 17.4 percent of children in the 2007 Edition to 20.7 percent of children in the 2010 Edition. In the 2002 Edition, the child poverty rate was at a historic low of 15.8 percent of persons under age 18. Poverty is an indication of the lack of access to health care, including preventive care, by this vulnerable population. Graph 4 Children in Poverty Since 2001 Lack of health insurance coverage increased from 13.9 percent in the 2001 Edition to 16.2 percent of the population in the 2011 Edition (Graph 5). Lack of health insurance not only inhibits people from getting the proper care when needed but also reduces access to necessary preventive care to curtail or minimize future illnesses. Massachusetts, with lack of health insurance at 5.0 percent of the population, is substantially better than all other states and less than one third of the national average. Texas has a rate five times that of Massachusetts. Changes in national health care laws have the potential to dramatically affect this metric over the next few years. Graph 5: Lack of Health Insurance Since 2001 *America s Health Rankings 2011 Report can be found online at It is a product of United Health Foundation. Page
17 Community Health Needs Assessment Global Overview Since the 2009 Edition, overall health in the United States has increased slightly from 20.3 percent to 21.3 percent above the 1990 baseline. This increase is primarily due to declines in preventable hospitalizations, infectious disease, prevalence of smoking and violent crime State Results America s Health Rankings 2011 Edition shows Vermont at the top of the list of healthiest states again this year. The state has steadily risen in the rankings for the last 13 years from a ranking of 17th in 1997 and New Hampshire is ranked second this year, an improvement from ranking third last year. New Hampshire has ranked in the top 10 states every year of the index. Connecticut is number three, followed by Hawaii and Massachusetts. Mississippi is 50th and the least healthy state, while Louisiana is 49th. Oklahoma, Arkansas and Alabama complete the bottom five states. Vermont ascended from 20th in 1990 and 1991 to the top position with sustained improvement in the last decade. Vermont s strengths include its number one position for all health determinants combined, which includes ranking in the top 10 states for a high rate of high school graduation, a low violent crime rate, a low rate of infectious disease, a high usage of early prenatal care, high per capita public health funding, a low rate of uninsured population and ready availability of primary care physicians. Vermont s challenges are low immunization coverage with 91.2 percent of children ages 19 to 35 months receiving recommended immunizations, relatively high occupational fatalities at 4.3 deaths per 100,000 workers and a high prevalence of binge drinking at 17.1 percent of the population. Mississippi remains 50th this year, the same as the last 10 years. It has been in the bottom three states since the 1990 Edition. The state ranks well for a low prevalence of binge drinking, a low violent crime rate and a high rate of immunization coverage. Mississippi s infectious disease rate improved from 11.9 to 10.5 cases per 100,000 population in the last year. It ranks in the bottom five states on 12 of the 23 measures including a high prevalence of obesity, a low high school graduation rate, a high percentage of children in poverty, limited availability of primary care physicians and a high rate of preventable hospitalizations. Mississippi ranks 48th for all health determinants combined, so its overall ranking is unlikely to change significantly in the near future. Scores presented in the table indicate the weighted number of standard deviation units a state is above or below the national norm. For example, Vermont, with a score of 1.197, is slightly more than one standard deviation unit above the national norm and Mississippi, with a score of , is more than three-quarters of a standard deviation unit below the national average. When comparing states from year to year, differences in score are more important than changes in ranking. Table Overall Rankings 2011 ALPHABETICAL BY STATE RANK ORDER RANK State Score RANK State Score 46 Alabama Vermont Alaska New Hampshire Arizona Connecticut Arkansas Hawaii California Massachusetts Colorado Minnesota Connecticut Utah Page
18 30 Delaware Maine Florida Colorado Georgia Rhode Island Hawaii New Jersey Idaho North Dakota Illinois Wisconsin Indiana Oregon Iowa Washington Kansas Nebraska Kentucky Iowa Louisiana New York Maine Idaho Maryland Virginia Massachusetts Wyoming Michigan Maryland Minnesota South Dakota Mississippi California Missouri Montana Montana Kansas Nebraska Pennsylvania Nevada Illinois New Hampshire Arizona New Jersey Delaware New Mexico Michigan New York North Carolina North Carolina Florida North Dakota New Mexico Ohio Alaska Oklahoma Ohio Oregon Georgia Pennsylvania Indiana Rhode Island Tennessee South Carolina Missouri South Dakota West Virginia Tennessee Nevada Texas Kentucky Utah Texas Vermont South Carolina Virginia Alabama Washington Arkansas West Virginia Oklahoma Wisconsin Louisiana Wyoming Mississippi *America s Health Rankings 2011 Report can be found online at It is a product of United Health Foundation. Page
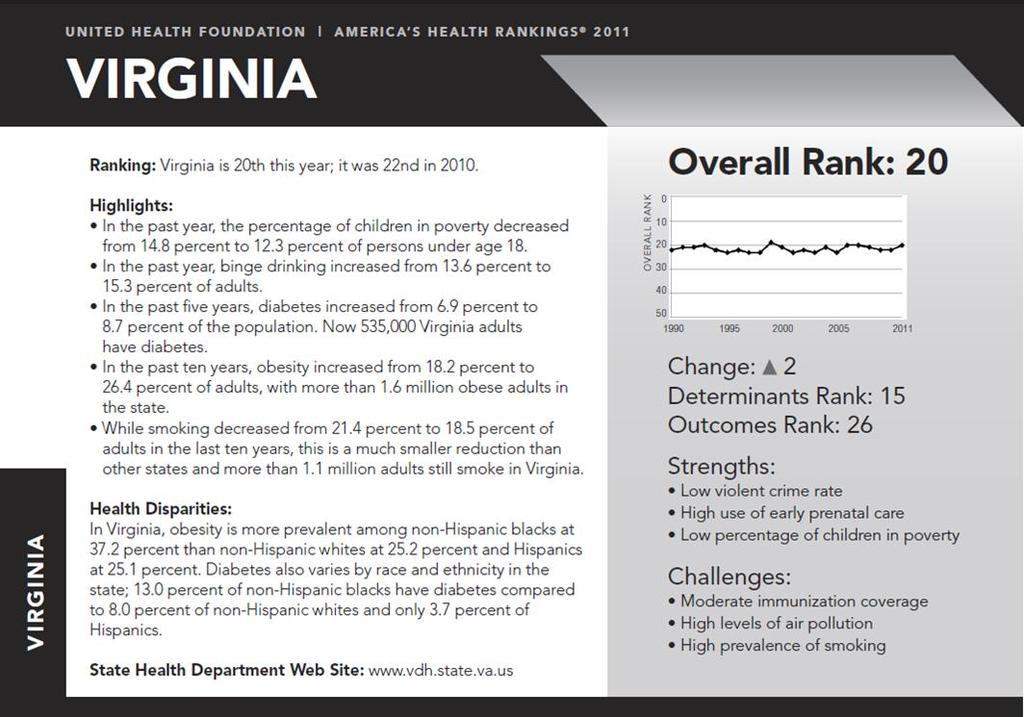
19 Community Health Needs Assessment Regional Overview Tennessee and Virginia Summary In 2011, Tennessee ranked 39 th out of 50 states in overall health outcomes, having improved from 42 nd place in Since 1990, this is the first time Tennessee has ranked below 40 th. Despite the improved rating, Tennessee still ranks very high in several measurements. For instance, Tennessee currently ranks 46 th for prevalence of diabetes, 46 th for cancer-related deaths, 46 th for preventable hospitalizations, 42 nd for obesity, and 45 th for infant mortality. In addition, Tennessee ranked 47 th for violent crime. One positive outcome is a decrease from 26.7 percent to 20.1 percent in adult smoking over the past five years. Virginia also improved in ranking, having been in 22 nd place in 2010, and currently ranking 20 th in Just like Tennessee, Virginia has seen an increase in obesity, as well as diabetes. Virginia also has a high prevalence of smoking and high levels of air pollution, which will continue to be challenges. As for health outcomes, Virginia s highest rankings were in infant mortality (31 st ), and cancer deaths (31 st ). Below is a timeline from 1990 to 2011 illustrating the rankings of each state over the past two decades. Clearly, Tennessee has seen a definite improvement within the past four years, falling from 48 th to 39 th. Virginia on the other hand has remained somewhat consistent. *America s Health Rankings 2011 Report can be found online at It is a product of United Health Foundation. Page

20 Page

21 Page
22 Community Health Needs Assessment Regional Summary Regional Overview In this assessment MSHA provides a broad overview of the current health status for MSHA s core service area. MSHA s core service area consists of 13 counties: Carter, TN; Greene, TN; Hawkins, TN; Johnson, TN; Sullivan, TN; Unicoi, TN; Washington, TN; Dickenson, VA; Russell, VA; Scott, VA; Smyth, VA; Washington/Bristol City, VA; and Wise/Norton City, VA. The following statistics for MSHA s core service area include: I. Demographic Characteristics II. Population Distribution III. Household Income Distribution IV. Education Level V. Race/Ethnicity DEMOGRAPHIC CHARACTERISTICS 2000 Total Population 2011 Total Population 2016 Total Population % Change Core Service Area USA 684, ,421, , ,650, , ,031, % 4.0% Average Household Income $46,747 $67, % Change Total Male Population 351, , % Total Female Population 367, , % Females, Child Bearing Age (15-44) 131, , % Page
23 Community Health Needs Assessment Regional Summary POPULATION DISTRIBUTION Age Distribution Age Group 2011 % of Total 2016 % of Total USA 2011 % of Total , % 119, % 20.2% , % 25, % 4.2% , % 62, % 9.7% , % 84, % 13.3% , % 190, % 27.6% , % 102, % 11.7% , % 144, % 13.3% Total 718, % 729, % 100.0% HOUSEHOLD INCOME DISTRIBUTION 2011 Household Income HH Count Income Distribution USA % % of Total of Total <$15K 61, % 12.9% $15-25K 47, % 10.8% $25-50K 97, % 26.6% $50-75K 52, % 19.5% $75-100K 23, % 11.9% Over $100K 24, % 18.3% Total 306, % 100.0% EDUCATION LEVEL Education Level Distribution USA % 2011 Adult Education Level Pop Age 25+ % of Total of Total Less than High School 48, % 6.3% Some High School 61, % 8.8% High School Degree 183, % 28.9% Some College/Assoc. Degree 132, % 28.3% Bachelor's Degree or Greater 86, % 27.7% Total 512, % 100.0% Page
24 Community Health Needs Assessment Regional Summary RACE/ETHNICITY Race/Ethnicity Race/Ethnicity Distribution USA % 2011 Pop % of Total of Total White Non-Hispanic 676, % 64.2% Black Non-Hispanic 18, % 12.1% Hispanic 11, % 16.1% Asian & Pacific Is. Non-Hispanic 3, % 4.6% All Others 8, % 3.0% Total 718, % 100.0% 2011, Claritas Inc., 2011 Thomson Reuters. All Rights Reserved Page
25 Community Health Needs Assessment Regional Summary SSH Snapshot The SSH Snapshot consists of demographics, key indicators of health status, interview highlights, and local resources. The model for the key indicators of health status analysis was based on the 2010 County Health Rankings, a key component of the Mobilizing Action Toward Community Health (MATCH). MATCH is a collaboration between the Robert Wood Johnson Foundation and the University of Wisconsin Population Health Institute. Indicators are organized into two broad categories: Health Outcomes and Health Factors. The Health Factors have multiple components, including Clinical Care, Health Behaviors, Social and Economic Factors, and Physical Environment. A number of additional key indicators of health status were included in this analysis from other sources (they are noted in blue font in the snapshot section). For each indicator, the state and county score is provided as well as a ranking comparing the county s performance to that of the other counties/localities in the state if available (95 counties in TN). The rankings are based on ascending order (with 1 being the desired rank). Page
26 SYCAMORE SHOALS HOSPITAL Service Area Counties: Primary Service Area Map: Carter, TN Johnson, TN Buchanan Letcher Dickenson Tazewell Harlan Lee Hancock Hamblen Hawkins Cocke Greene Wise Scott Washington Madison Russell Sullivan Washington Carter Johnson Unicoi Avery Mitchell Yancey Watauga Smyth Ashe Grayson Wythe Johnson County Community Hospital Sycamore Shoals Hospital Facility Profiles: Sycamore Shoals Hospital (SSH), located in Elizabethton, Tennessee, is a 121-bed non-profit hospital dedicated to providing a lifetime of quality, patient-centered health care. SSH is fully accredited by The Joint Commission and serves the East Tennessee counties of Carter, Johnson, Sullivan and Unicoi and surrounding counties in North Carolina. The caring staff is committed to providing superior care and meeting the community's need. A 5-page profile of each county is provided. The profile includes demographic highlights, key indicators of health status, utilization projections, and survey results specific to the county. A detailed demographic analysis by county is provided in the appendix which follows the collection of county snapshots. Page
27 CARTER COUNTY, TN 2010 COUNTY SNAPSHOT Demographic Highlights: Large elderly population compared to TN and US Median age of 41.8 (compared to 37.2 nationally and 38.1 statewide) Large declining rate of females of child-bearing age compared to minimal loss nationally Unemployment rate is higher than national experience Low average household income level (23% of households make less than $15,000) Lower level of educational attainment compared to state and country (11% without any high school education compared to 6.4% nationally) Low level of diversity compared to state and national Service Area Map: Buchanan, V A Kentucky Letcher, KY Tazewell, V A Virginia Dickenson, VA Wise, VA Russell, V A Wy the, VA Harlan, KY Smy th, VA Scott, V A Washington, VA Lee, V A Gray son, VA Hancock, TN Sulliv an, TN Hawkins, TN Ashe, NC Tennessee Washington, TN Watauga, NC Hamblen, TN Greene, TN North Carolina Unicoi, TN Mitchell, NC A v ery, NC Cocke, TN Yancey, NC Madison, NC Age Distribution and Population Projections: Population by Age Cohort 24,000 20,000 16,000 12,000 8,000 4, ,924 10,006 19,338 8, ,967 9,464 19,447 9,779 Key Statistics: Carter County Tennessee USA 2010 Total Population 46,870 6,310, ,421,906 % Change % 4.4% 4.1% 2010 Females, Child Bearing Age ,539 1,257,352 62,026,739 % Change % -0.7% -0.7% % of Population 65+ (2010) 18.4% 13.7% 13.2% % Unemployment (2010) 7.1% 7.0% 6.4% Average Household Income (2010) $ 40,685 $ 58,839 $ 71,071 % Minority (2010)* 4.8% 23.3% 35.3% HS Degree and Above (2010) 75.2% 82.4% 84.7% Page
28 CARTER COUNTY, TN Local Health Highlights: STRENGTHS: Divorce Rate STD Teen Pregnancy WEAKNESSES: Pre-1950 housing Diabetic HbA1c testing Smoking During Pregnancy Deaths due to cardiovascular, cancer, and diabetes Leading Causes of Death: Leading Causes of Death Ages 1-14 years Cause of Death Rate Rank Accidents Flu/Pneumonia Meningococcal Infection All Other Causes 3.76 * Ages years Cause of Death Rate Rank Accidents Suicide Flu/Pneumonia Diseases of Heart All Other Causes * Ages Cause of Death Rate Rank Cancer Diseases of Heart Accidents Respiratory Diabetes Cerebrovascular Diseases Liver & Cirrhosis Suicide Flu/Pneumonia Homicide All Other Causes * Ages 65+ Cause of Death Rate Rank Diseases of Heart Cancer Respiratory Cerebrovascular Diseases Alzheimer's Disease Flu/Pneumonia Diabetes Mellitus Accidents Kidney Pneumonitis All Other Causes * Key Indicators of Health Status: 2010 COUNTY SNAPSHOT TN Carter Rank Desired Health Outcomes 54 M ortality (years of potential life lost/100,000) 9,378 9, Low Birth Weight (3-yr avg %) 9.3% 9.3% 82 General Health Status (% fair/poor health)* 19.0% 26.0% 49 Poor Physical Health Days Poor M ental Health Days Very Low Birth Weight (%) 1.7% 3.3% n/a Infant M ortality (3-yr avg rate per 1,000) M ortality Rate (3-yr avg rate per 100,000) Cardiovascular Deaths (per 100,000) Cancer Deaths (3-yr avg rate per 100,000) Diabetes M ellitus Deaths (per 100,000) Cerebrovascular Deaths (per 100,000) Suicide Deaths (per 100,000) M ortality rate for ages 1-14 yrs M ortality rate for ages yrs M ortality rates for ages 65+ 5, , Lung Cancer Deaths (3-yr avg rate per 100,000) Female Breast Cancer Deaths (3-yr avg rate per 100,000) Prevalence of Asthma (per 1,000) n/a Prevalence of Diabetes (per 1,000) n/a Health Factors 52 Clinical Care 44 No Health Insurance (%)* 14.7% 16.4% 56 M edicaid/tenncare Enrollees (%) 19.5% 20.2% 34 M edical Doctors Per Capita (per 100,000) Dentists Per Capita (per 100,000) Percent without Pneumococcal Vaccinations (%)* 74.3% 72.3% 31 Percent without Influenza Vaccinations (%)* 58.5% 59.3% 53 No Diabetic Eye Exams (%) 53.6% 58.3% 76 No Diabetic Lipid Profile (%) 18.9% 22.5% 79 No Diabetic HbA1c Testing (%) 12.3% 18.3% 91 No Biennial M ammography (%)* 19.7% 23.3% 73 Inadequate or No Prenatal Care (%) 14.0% 5.5% n/a M onth Prenatal Care Began First Trimester Prenatal Care (%) 61.8% 72.4% 16 Newborns with M edicaid/tenncare Coverage (%) 52.9% 63.3% n/a Hospital Staffed Beds (per 1,000) n/a Licensed Nursing Beds (per 1, ) n/a Preventable Hospital Stays (ACSC Rate) # of Primary Care M Ds, Population per Professional 906 2,195 n/a # of Psychiatric Specialists, Population per Professional 9,984 0 n/a Inpatient Discharge Rate (per 1,000) - Total n/a Inpatient Discharge Rate (per 1,000) - Women's n/a Inpatient Discharge Rate (per 1,000) - Cardiac n/a Inpatient Discharge Rate (per 1,000) - Oncology n/a Inpatient Discharge Rate (per 1,000) - Ortho/Neuro n/a Health Behaviors 78 Cigarette Smoking (%)* 24.3% 28.9% 69 Smoking During Pregnancy (%) 19.4% 37.3% 86 Physical Inactivity (%)* 31.5% 38.4% 77 Page
29 CARTER COUNTY, TN 2010 COUNTY SNAPSHOT Cancer Incidence: Age-Adjusted Cancer Incidence Rates (per 100,000) Prostate Lung & Breast Colon Bronchus Tennessee Carter Age-Adjusted Cancer Mortality Rates (per 100,000 Females) Lung & Breast Colon Ovary Bronchus Tennessee Carter Age-Adjusted Cancer Mortality Rates (per 100,000 Males) Lung & Bronchus Prostate Colon Tennessee Carter Birth Rate Trend: Crude Birth Rate (per 1,000) Tennessee Carter Teen Birth Rate (per 1,000) Tennessee Carter Key Indicators of Health Status: TN Carter Rank Desired Overweight/Obesity (% BM I > 30)* 67.4% 67.6% 35 Low Fruit and Vegetable Consumption (% <5 a day)* 34.2% 41.5% 70 Binge Drinking (%)* 9.0% 7.9% 64 Teen Birth Rate (per 1,000) Sexually Transmitted Diseases (3 yr avg per 10,000) Violent Crime (per 10,000) 1, M otor Vehicle Crash Deaths (per 10,000) Unmarried M other Birth Rate (%) 44.5% 43.6% 61 Injury-related M ortality (3-yr avg rate per 100,000) % of Children (0-4) Un/Improperly Restrained in a Crash 21.1% 8.7% 24 Young Driver Crash Rate Elderly Drive Crash Rate (65+) Homicides (per 100,000) n/a All accidental deaths per 100,000 population Average Fatality Rate in Alchohol-Related Crashes (per 100,000 population) Social & Economic Factors 41 High School Graduation Rate (%) 82.5% 88.6% 31 Level of Education (%) 74.9% 75.9% 49 Some College (%) 54.0% 43.5% 33 Unemployment (%) 7.9% 8.1% 30 Children (age 0 to 17) in poverty ratio (%) 18.0% 30.3% 78 Divorce Rate (per 100,000) Food Stamp Recipients (% of individuals) 17.8% 17.7% 30 Poverty Rate (% of all ages) 15.5% 21.5% 83 Temporary Assistance for Needy Families 2.5% 1.1% 12 Inadequate Social Support (%) 19.0% 22.0% 48 Single Parent Households (%) 34.0% 30.0% 46 High School Dropout Rate 10.4% 7.1% 56 Average Annual Wage $ 33,395 $ 23, Physical Environment 37 Air Quality Cancer Risk (per 1,000,000) Air Quality Hazard Index (per 1,000,000) Air Quality - Fine Particulate M atter in Air (3 yr avg M g/m3)* Ozone Level (ppb)* Nitrate Levels in drinking water (mg/l) 1.3% 1.6% 70 Pre-1950 Housing (%) 14.3% 23.6% 93 Lead Poisoned Children (%) 0.3% 0.9% 89 Child Abuse and Neglect (rate per 1,000) Access to Healthy Foods (%) 57% 50% 50 Recreational Facility Rate Communicable Diseases n/a Hepatitis A (per 100,000) n/a Campylobacter Infection (per 100,000) n/a Salmonella, Non Typhoid (per 100,000) n/a Shigellosis (per 100,000) n/a AIDS/HIV (per 100,000) 10 0 n/a Primary and Secondary Syphilis (per 100,000) n/a Penicillin-Sensitive Streptococcus pneumoniae (per 100,000) n/a Group B Streptococcus (per 100,000) n/a Chlamydia (per 100,000) n/a Gonorrhea (per 100,000) n/a Page
JOHNSTON MEMORIAL HOSPITAL WASHINGTON COUNTY, VIRGINIA 2011 COMMUNITY HEALTH NEEDS ASSESSMENT
 JOHNSTON MEMORIAL HOSPITAL WASHINGTON COUNTY, VIRGINIA 2011 COMMUNITY HEALTH NEEDS ASSESSMENT Published June 29, 2012 Page - 1 - Page - 2 - Table of Contents I. Introduction II. Executive Summary III.
FRANKLIN WOODS COMMUNITY HOSPITAL WASHINGTON COUNTY, TENNESSEE 2011 COMMUNITY HEALTH NEEDS ASSESSMENT
 FRANKLIN WOODS COMMUNITY HOSPITAL WASHINGTON COUNTY, TENNESSEE 2011 COMMUNITY HEALTH NEEDS ASSESSMENT Published June 29, 2012 Page - 1 - Page - 2 - Table of Contents I. Introduction II. Executive Summary
A call to action for individuals and their communities. Annual Report 2017
 A call to action for individuals and their communities Annual Report 217 Behaviors Community & Environment Health Outcomes Policy Clinical Care America s Health Rankings was built upon the World Health
2012 Medicaid and Partnership Chart
 2012 Medicaid and Chart or Alabama $525,000.00 $4,800.00 Minimum: 25,000.00 Alaska $525,000.00 Depends on area of state; Minimum: $113,640 $10,000 in Anchorage $1,656 Minimum:$1838.75 Maximum:$2,841 Minimum:
Exhibit 1. Change in State Health System Performance by Indicator
 Exhibit 1. Change in State Health System Performance by Indicator Indicator (arranged by number of states with improvement within dimension) Access and Affordability 0 Children ages 0 18 uninsured At-risk
Prevalence of Self-Reported Obesity Among U.S. Adults by State and Territory. Definitions Obesity: Body Mass Index (BMI) of 30 or higher.
 of 30 or higher.") Prevalence of Self-Reported Obesity Among U.S. Adults by State and Territory Definitions Obesity: Body Mass Index (BMI) of 30 or higher. Body Mass Index (BMI): A measure of an adult s weight in relation
Prevalence of Self-Reported Obesity Among U.S. Adults by State and Territory Definitions Obesity: Body Mass Index (BMI) of 30 or higher. Body Mass Index (BMI): A measure of an adult s weight in relation
The Healthy Indiana Plan
 The Healthy Indiana Plan House Enrolled Act 1678 A Pragmatic Approach Governor Mitch Daniels July 16, 2007 Indiana s Fiscal Health is Good First Back-to-Back Balanced Budget in Eight Years $1,000.0 Revenue
An Unhealthy America: The Economic Burden of Chronic Disease Charting a New Course to Save Lives and Increase Productivity and Economic Growth
 An Unhealthy America: The Economic Burden of Chronic Disease Charting a New Course to Save Lives and Increase Productivity and Economic Growth Ross DeVol Director, Center for Health Economics Director,
Racial disparities in health outcomes and factors that affect health: Findings from the 2011 County Health Rankings
 Racial disparities in health outcomes and factors that affect health: Findings from the 2011 County Health Rankings Author: Nathan R. Jones, PhD University of Wisconsin Carbone Cancer Center Introduction
2018 HPV Legislative Report Card
 2018 HPV Legislative Report Card This report card is a snapshot of each state s documented efforts to enact or introduce HPV vaccine legislation to improve education and awareness, or provide access to
2015 COMMUNITY HEALTH NEEDS ASSESSMENT
 2015 COMMUNITY HEALTH NEEDS ASSESSMENT SMYTH COUNTY COMMUNITY HOSPITAL Published June 29, 2015 Page - 1 - TABLE OF CONTENTS I. Introduction II. Executive Summary III. Community Assessment Summary a. Collecting
STATE RANKINGS REPORT NOVEMBER mississippi tobacco data
 STATE RANKINGS REPORT NOVEMBER 2017 mississippi tobacco data METHODS information about the data sources the youth risk behavior surveillance system The Youth Risk Behavior Surveillance System (YRBSS)
Cirrhosis and Liver Cancer Mortality in the United States : An Observational Study Supplementary Material
 Cirrhosis and Liver Cancer Mortality in the United States 1999-2016: An Observational Study Supplementary Material Elliot B. Tapper MD (1,2) and Neehar D Parikh MD MS (1,2) 1. Division of Gastroenterology
Obesity Trends:
 Obesity Trends: 1985-2014 Compiled by the Centers for Disease Control and Prevention Retrieved from http://www.cdc.gov/obesity/data/prevalencemaps.html Organized into two groupings due to methodological
ACEP National H1N1 Preparedness Survey Results
 1) On a scale from 1 to 10 (10 being totally prepared and 1 being totally unprepared), do you think your hospital is prepared to manage a surge of H1N1 flu patients this fall and winter? (totally prepared)
Using Policy, Programs, and Partnerships to Stamp Out Breast and Cervical Cancers
 Using Policy, Programs, and Partnerships to Stamp Out Breast and Cervical Cancers National Conference of State Legislatures Annual Meeting J August 2006 Christy Schmidt Senior Director of Policy National
Results from the Commonwealth Fund Scorecard on State Health System Performance. Douglas McCarthy. Senior Research Director The Commonwealth Fund
 AIMING HIGHER: Results from the Commonwealth Fund Scorecard on State Health System Performance EDITION APPENDIX David C. Radley Senior Scientist The Commonwealth Fund Douglas McCarthy Senior Research Director
The Wellbeing of America s Workforce, and Its Effects on an Organization s Performance
 The Wellbeing of America s Workforce, and Its Effects on an Organization s Performance 25-year commitment; initiated January 2, 2008. 1,000 completed surveys per day, 7 days per week, 350 days per year.
Responses to a 2017 Survey on State Policies Regarding Community Health Workers: Home Visiting to Improve the Home Environment
 Responses to a 2017 Survey on State Policies Regarding Community Health Workers: Home Visiting to Improve the Home Environment The National Academy for State Health Policy (NASHP), with support from the
Medical Advisory Board. reviews medical issues for licensure regarding individual drivers. medical conditions. not specified. reporting encouraged,
 State Reporting Regulations for Physicians Adapted from the Physician s Guide to Assessing and Counseling Older Drivers 44 and Madd.org 45 State Physician/Medical Reporting (NOTE MERGED CELLS) Mandatory,
States with Authority to Require Nonresident Pharmacies to Report to PMP
 States with Authority to Require Nonresident Pharmacies to Report to PMP Research current through May 2016. This project was supported by Grant No. G1599ONDCP03A, awarded by the Office of National Drug
Strategies: Reducing Disparities in Racial and Ethnic Minority Communities. Evelyn M. Foust, CPM, MPH North Carolina Communicable Disease Branch
 Strategies: Reducing Disparities in Racial and Ethnic Minority Communities Evelyn M. Foust, CPM, MPH North Carolina Communicable Disease Branch The ten states with the lowest ranking in overall health
HOSPITAL AUTHORITY OF VALDOSTA & LOWNDES COUNTY, GEORGIA COMMUNITY HEALTH NEEDS ASSESSMENT SGMC LANIER CAMPUS
 HOSPITAL AUTHORITY OF VALDOSTA & LOWNDES COUNTY, GEORGIA COMMUNITY HEALTH NEEDS ASSESSMENT SGMC LANIER CAMPUS July 16, 2015 DRAFT Allison McCarthy Principal 70 Old Field Road, Plymouth, MA 02360 Tel/Fax:
Trends in Lung Cancer Morbidity and Mortality
 Trends in Lung Cancer Morbidity and Mortality American Lung Association Epidemiology and Statistics Unit Research and Program Services Division November 2014 Table of Contents Trends in Lung Cancer Morbidity
2014 Edition TENNESSEE
 214 TENNESSEE America's Health Rankings is the longest running comparative health index of states. It uses measures of behavior, community and environment, policy, clinical care, and health outcomes to
2014 Edition RHODE ISLAND
 214 RHODE ISLAND America's Health Rankings is the longest running comparative health index of states. It uses measures of behavior, community and environment, policy, clinical care, and health outcomes
Peer Specialist Workforce. State-by-state information on key indicators, and links to each state s peer certification program web site.
 Peer Specialist Workforce State-by-state information on key indicators, and links to each state s peer certification program web site. Alabama Peer support not Medicaid-reimbursable 204 peer specialists
ARE STATES DELIVERING?
 The Promise of Quality, Affordable Health Care for Women ARE STATES DELIVERING? A 50-State Report Card on Women s Health OCTOBER 2014 TAKING ACTION, MAKING CHANGE The Alliance for a Just Society s mission
HIV in Prisons,
 U.S. Department of Justice Office of Justice Programs Bureau of Justice Statistics Bureau of Justice Statistics BULLETIN HIV in Prisons, 2007-08 Laura M. Maruschak BJS Statistician Randy Beavers, BJS Intern
MetLife Foundation Alzheimer's Survey: What America Thinks
 MetLife Foundation Alzheimer's Survey: What America Thinks May 11, 2006 Conducted by: Harris Interactive 2005, Harris Interactive Inc. All rights reserved. Table of Contents Background and Objectives...
National Deaf Center on Postsecondary Outcomes. Data Interpretation Guide for State Reports: FAQ
 National Deaf Center on Postsecondary Outcomes Data Interpretation Guide for State Reports: FAQ This document was developed under a grant from the U.S. Department of Education, OSEP #HD326D160001. However,
Cancer Prevention & Early Detection Facts & Figures. Tables and Figures 2018
 Cancer Prevention & Early Detection Facts & Figures Tables and Figures 2018 1 Table of Contents Tobacco Use Figure 1A. State Cigarette Excise Tax, 2018..... 3 Figure 1B. Proportion of Cancer Deaths Attributable
Geographical Accuracy of Cell Phone Samples and the Effect on Telephone Survey Bias, Variance, and Cost
 Geographical Accuracy of Cell Phone Samples and the Effect on Telephone Survey Bias, Variance, and Cost Abstract Benjamin Skalland, NORC at the University of Chicago Meena Khare, National Center for Health
Medical Marijuana Responsible for Traffic Fatalities Alfred Crancer, B.S., M.A.; Phillip Drum, Pharm.D.
 Medical Marijuana Responsible for Traffic Fatalities Alfred Crancer, B.S., M.A.; Phillip Drum, Pharm.D. Abstract In California, where only 25% of the drivers in fatal crashes are tested for drugs, 252
April 25, Edward Donnell Ivy, MD, MPH
 HRSA Hemoglobinopathies Programs: Sickle Cell Disease Newborn Screening Follow-Up Program(SCDNBSP) and Sickle Cell Disease Treatment Demonstration Regional Collaboratives Program (SCDTDP) April 25, 2017
HIV/AIDS and other Sexually Transmitted Diseases (STDs) in the Southern Region of the United States: Epidemiological Overview
 in the Southern Region of the United States: Epidemiological Overview") HIV/AIDS and other Sexually Transmitted Diseases (STDs) in the Southern Region of the United States: Epidemiological Overview Prepared by The Henry J. Kaiser Family Foundation for Southern States Summit
HIV/AIDS and other Sexually Transmitted Diseases (STDs) in the Southern Region of the United States: Epidemiological Overview Prepared by The Henry J. Kaiser Family Foundation for Southern States Summit
American Association of Suicidology. Statistics AAS. Statistics. National Statistical Information FMHI. American Association of Suicidology (AAS)
") American Association of Suicidology Statistics AAS Statistics S National Statistical Information The following pages of statistical informartion are provided with permission from the web site of the American
American Association of Suicidology Statistics AAS Statistics S National Statistical Information The following pages of statistical informartion are provided with permission from the web site of the American
Perinatal Health in the Rural United States, 2005
 Perinatal Health in the Rural United States, 2005 Policy Brief Series #138: LOW BIRTH WEIGHT RATES IN THE RURAL UNITED STATES, 2005 #139: LOW BIRTH WEIGHT RATES AMONG RACIAL AND ETHNIC GROUPS IN THE RURAL
2003 National Immunization Survey Public-Use Data File
 SECTION 1. ID, WEIGHT AND FLAG VARIABLES Section 1 Variable Name SEQNUMC Label UNIQUE CHILD IDENTIFIER Frequency of Missing/Non-missing Values All Data 30930 21310 NON-MISSING CHARACTER STRING 000011 MINIMUM
HIV and AIDS in the United States
 HIV and AIDS in the United States A Picture of Today s Epidemic More than 20 years into the AIDS epidemic, HIV continues to exact a tremendous toll in the United States. Recent data indicate that African
Percent of U.S. State Populations Covered by 100% Smokefree Air Laws April 1, 2018
 Defending your right to breathe smokefree air since 1976 Percent U.S. State Populations Covered by 100% Smokefree Air April 1, 2018 This table lists the percent each state s population covered by air laws
DISCLAIMER: ECHO Nevada emphasizes patient privacy and asks participants to not share ANY Protected Health Information during ECHO clinics.
 DISCLAIMER: Video will be taken at this clinic and potentially used in Project ECHO promotional materials. By attending this clinic, you consent to have your photo taken and allow Project ECHO to use this
Forensic Patients in State Hospitals:
 Forensic Patients in State Hospitals: 1999-2016 Vera Hollen, M.A. Senior Director of Research & Consulting Director, Mental Health/Criminal Justice Research Center National Association of State Mental
HEALTH & WELL-BEING TOP LINE FINDINGS
 Health & Well-Being Reproductive Rights Violence & Safety KEY FINDINGS HEALTH & WELL-BEING TOP LINE FINDINGS Nationally, women s health status has improved in four areas and worsened in five: o Improved:
Trends in COPD (Chronic Bronchitis and Emphysema): Morbidity and Mortality. Please note, this report is designed for double-sided printing
: Morbidity and Mortality. Please note, this report is designed for double-sided printing") Trends in COPD (Chronic Bronchitis and Emphysema): Morbidity and Mortality Please note, this report is designed for double-sided printing American Lung Association Epidemiology and Statistics Unit Research
Trends in COPD (Chronic Bronchitis and Emphysema): Morbidity and Mortality Please note, this report is designed for double-sided printing American Lung Association Epidemiology and Statistics Unit Research
HealtheCNY Indicator List by Data Source
 American Community Survey 23 Adults with Health Insurance Children Living Below Poverty Level Children with Health Insurance Families Living Below Poverty Level Homeowner Vacancy Rate Homeownership Households
County Health Rankings Monroe County 2016
 Health Rankings Monroe 2016 Graphics of Health Rankings Include All Counties In the North Central Health District Public Health for Middle Georgia Serving Baldwin, Bibb, Crawford, Hancock, Houston, Jasper,
HEALTH OF WOMEN AND CHILDREN REPORT
 HEALTH OF WOMEN AND CHILDREN REPORT MARCH 2018 The full report is available at www.americashealthrankings.org OVERVIEW Promoting the health of women, infants and children is fundamental to keeping our
MAKING WAVES WITH STATE WATER POLICIES. Washington State Department of Health
 MAKING WAVES WITH STATE WATER POLICIES Washington State Department of Health Lead poisoning is a public health problem. Health Effects of Lead Lead Exposures and Pathways HOME Paint Lead pipes Lead solder
Community Health Status Assessment: High Level Summary
 Community Health Status Assessment: High Level Summary This summary provides a general overview of Community Health Status Assessment (CHSA) results as part of the Health Improvement Partnership (HIP-C)
Jackson Hospital Community Health Needs Assessment. Fiscal Year 2016
 Jackson Hospital Community Health Needs Assessment Fiscal Year 2016 JACKSON HOSPITAL AT A GLANCE Jackson Hospital, located in Montgomery, Alabama, is a not-for-profit organization committed to improving
Family Health Centers of Southwest Florida Community Health Assessment Appendix B: Charlotte County Data
 2014 Community Health Assessment Appendix B: Charlotte County Data Prepared by: The Health Planning Council of Southwest Florida, Inc. www.hpcswf.com Table of Contents Charlotte County Demographic and
County Health Rankings Baldwin County 2016 Graphics of County Health Rankings Include All Counties In the North Central Health District
 Health Rankings Baldwin 2016 Graphics of Health Rankings Include All Counties In the North Central Health District Public Health for Middle Georgia Serving Baldwin, Bibb, Crawford, Hancock, Houston, Jasper,
ROAD SAFETY MONITOR. ALCOHOL-IMPAIRED DRIVING IN THE UNITED STATES Results from the 2017 TIRF USA Road Safety Monitor
 Background What is the context of alcohol-impaired driving in the U.S.? According to the National Highway Traffic Safety Administration (NHTSA), alcohol-impaired driving fatalities involving a driver with
AAll s well that ends well; still the fine s the crown; Whate er the course, the end is the renown. WILLIAM SHAKESPEARE, All s Well That Ends Well
 AAll s well that ends well; still the fine s the crown; Whate er the course, the end is the renown. WILLIAM SHAKESPEARE, All s Well That Ends Well mthree TrEATMENT MODALITIES 7 ž 21 ATLAS OF ESRD IN THE
Quarterly Hogs and Pigs
 Quarterly Hogs and Pigs ISSN: 9- Released December 22,, by the National Agricultural Statistics Service (NASS), Agricultural Statistics Board, United s Department of Agriculture (USDA). United s Hog Inventory
Georgina Peacock, MD, MPH
 Autism Activities at CDC Act Early Region IX Summit Sacramento, CA June 8, 2009 Georgina Peacock, MD, MPH National Center on Birth Defects and Developmental Disabilities Autism Activities at CDC Surveillance/Monitoring
Michigan Nutrition Network Outcomes: Balance caloric intake from food and beverages with caloric expenditure.
 DRAFT 1 Obesity and Heart Disease: Fact or Government Conspiracy? Grade Level: High School Grades 11 12 Subject Area: Mathematics (Statistics) Setting: Classroom and/or Computer Lab Instructional Time:
The 2004 National Child Count of Children and Youth who are Deaf-Blind
 The 2004 National Child Count of Children and Youth who are Deaf-Blind NTAC The Teaching Research Institute Western Oregon University The Helen Keller National Center Sands Point, New York The National
Cessation and Cessation Measures
 Cessation and Cessation Measures among Adult Daily Smokers: National and State-Specific Data David M. Burns, Christy M. Anderson, Michael Johnson, Jacqueline M. Major, Lois Biener, Jerry Vaughn, Thomas
Health Care Reform: Colorectal Cancer Screening Disparities, Before and After the Affordable Care Act (ACA)
") University of Arkansas for Medical Sciences From the SelectedWorks of Michael Preston June 7, 2014 Health Care Reform: Colorectal Cancer Screening Disparities, Before and After the Affordable Care Act
University of Arkansas for Medical Sciences From the SelectedWorks of Michael Preston June 7, 2014 Health Care Reform: Colorectal Cancer Screening Disparities, Before and After the Affordable Care Act
Community Health Needs Assessment
 Community Health Needs Assessment Scott County, Missouri This assessment will identify the health needs of the residents of Scott County, Missouri, and those needs will be prioritized and recommendations
Quarterly Hogs and Pigs
 Quarterly Hogs and Pigs ISSN: 9- Released December 23,, by the National Agricultural Statistics Service (NASS), Agricultural Statistics Board, United s Department of Agriculture (USDA). United s Hog Inventory
Public Health Federal Funding Request to Address the Opioid Epidemic
 Public Health Federal Funding Request to Address the Opioid Epidemic On December 4, 2017, in response to the President s recent declaration of the opioid epidemic as a public health emergency and the final
Health Care Reform: Colorectal Cancer Screening Expansion, Before and After the Affordable Care Act (ACA)
") University of Arkansas for Medical Sciences From the SelectedWorks of Michael Preston April 9, 2014 Health Care Reform: Colorectal Cancer Screening Expansion, Before and After the Affordable Care Act (ACA)
University of Arkansas for Medical Sciences From the SelectedWorks of Michael Preston April 9, 2014 Health Care Reform: Colorectal Cancer Screening Expansion, Before and After the Affordable Care Act (ACA)
B&T Format. New Measures. 2 CAHPS is a registered trademark of the Agency for Healthcare Research and Quality (AHRQ).
.") TO: Interested Organizations FROM: Patrick Dahill, Assistant Vice President, Policy DATE: February 4, 2018 RE: 2018 Accreditation Benchmarks and Thresholds This document reports national benchmarks and
TO: Interested Organizations FROM: Patrick Dahill, Assistant Vice President, Policy DATE: February 4, 2018 RE: 2018 Accreditation Benchmarks and Thresholds This document reports national benchmarks and
Tobacco Control Policy at the State Level. Progress and Challenges. Danny McGoldrick Institute of Medicine Washington, DC June 11, 2012
 Tobacco Control Policy at the State Level Progress and Challenges Danny McGoldrick Institute of Medicine Washington, DC June 11, 2012 The Tools of Tobacco Control Tobacco Taxes Smoke-free Laws Comprehensive
Peer Specialist Workforce. State-by-state information on key indicators, and links to each state s peer certification program web site.
 Peer Specialist Workforce State-by-state information on key indicators, and links to each state s peer certification program web site. Alabama Peer support not Medicaid-reimbursable 204 peer specialists
Hawai i to Zero. Timothy McCormick Harm Reduction Services Branch Hawai i Department of Health. January 16, 2018
 HIV Prevention Efforts in Hawai i Hawai i to Zero Timothy McCormick Harm Reduction Services Branch Hawai i Department of Health January 16, 2018 People living with HIV who take HIV medicine as prescribed
NCQA did not add new measures to Accreditation 2017 scoring.
 2017 Accreditation Benchmarks and Thresholds 1 TO: Interested Organizations FROM: Patrick Dahill, Assistant Vice President, Policy DATE: August 2, 2017 RE: 2017 Accreditation Benchmarks and Thresholds
Average Number Citations per Recertification Survey
 10 Average Citations per Recertification Survey 201 201 2017 1Q 8 7.7 7.3 3 3.3 3..2 2 1 0..80.2.0.8.70.8.17.8.1 7.3 SRO SERO NERO NRO WRO WI 1 Source: WI DQA, March 31, 2017 3% Percentage of Recertification
It's tick time again! Recognizing black-legged (deer ticks) and measuring the spread of Lyme disease
 and measuring the spread of Lyme disease") It's tick time again! Recognizing black-legged (deer ticks) and measuring the spread of Lyme disease Actual sizes: These guys below (Ixodes scapularis) spread Lyme and other tick born diseases. Ixodes
It's tick time again! Recognizing black-legged (deer ticks) and measuring the spread of Lyme disease Actual sizes: These guys below (Ixodes scapularis) spread Lyme and other tick born diseases. Ixodes
Community Health Status Assessment
 Community Health Status Assessment EXECUTIVE SUMMARY The Community Health Status Assessment (CHSA) is one of four assessments completed as part of the 2015-2016 Lane County Community Health Needs Assessment
SENIOR REPORT A CALL TO ACTION FOR INDIVIDUALS AND THEIR COMMUNITIES 2013 EDITION
 SENIOR REPORT A CALL TO ACTION FOR INDIVIDUALS AND THEIR COMMUNITIES 2013 EDITION Components of Health The World Health Organization defines health as a state of complete physical, mental and social well-being
Radiation Therapy Staffing and Workplace Survey 2016
 Radiation Therapy Staffing and Workplace Survey 2016 2016 ASRT. All rights reserved. Reproduction in any form is forbidden without written permission from publisher. TABLE OF CONTENTS Executive Summary...
HIV in Prisons, 2000
 U.S Department of Justice Office of Justice Programs Bureau of Justice Statistics Bulletin October, NCJ HIV in Prisons, By Laura M. Maruschak BJS Statistician On December,,.% of State prison inmates, and.%
The Rural Health Workforce. Policy Brief Series. Data and Issues for Policymakers in: Washington Wyoming Alaska Montana Idaho
 The Rural Health Workforce Data and Issues for Policymakers in: Washington Wyoming Alaska Montana Idaho Policy Brief Series ISSUE #1: THE RURAL HEALTH WORKFORCE: CHALLENGES AND OPPORTUNITIES ISSUE #2:
Methamphetamines: A National and State Crisis. Research Brief. Prepared by
 Methamphetamines: A National and State Crisis Research Brief Prepared by P. Allison Minugh, Ph.D. Nicoletta A. Lomuto, M.S. Kelly R. Breeden, M.S. Dennis Embry, Ph.D. Headquarters Two Richmond Square Providence,
September 20, Thomas Scully Administrator Centers for Medicare and Medicaid Services 200 Independence Avenue SW Washington, DC 20201
 September 20, 2001 Thomas Scully Administrator Centers for Medicare and Medicaid Services 200 Independence Avenue SW Washington, DC 20201 Dear Mr. Scully: The medical organizations listed below would like
Oakwood Healthcare Community Health Needs Assessment Indicators
 POPULATION Sub-Category Education Socioeconomic Violence High School High School Dropouts Graduation Rate (Percent) Some College Births to Unmarried Women Children in Poverty Children in Singleparent Households
NM Coalition of Sexual Assault Programs, Inc.
 NM Coalition of Sexual Assault Programs, Inc. PREVALENCE OF INTIMATE PARTNER VIOLENCE AND STALKING AMONG WOMEN IN NEW MEXICO: A SUMMARY OF THE FINDINGS FROM THE NATIONAL INTIMATE PARTNER AND SEXUAL VIOLENCE
Youth and Adult Marijuana Use
 January 2016 The Legalization of Marijuana in Colorado: The Impact Latest Results for Colorado Youth and Adult Marijuana Use ROCKY MOUNTAIN HIGH INTENSITY DRUG TRAFFICKING AREA www.rmhidta.org 1 P a g
DEPARTMENT OF DEFENSE (AFHSB)
") In NORTHCOM during week 05 DEPARTMENT OF DEFENSE (AFHSB) Seasonal Influenza Surveillance Summary Northern Command -- Week 05 (27 January 2019 02 February 2019) Influenza activity increased in several states
In NORTHCOM during week 05 DEPARTMENT OF DEFENSE (AFHSB) Seasonal Influenza Surveillance Summary Northern Command -- Week 05 (27 January 2019 02 February 2019) Influenza activity increased in several states
DEPARTMENT OF DEFENSE (AFHSB)
") In NORTHCOM during week 09 DEPARTMENT OF DEFENSE (AFHSB) Seasonal Influenza Surveillance Summary Northern Command -- Week 09 (24 February 2019 02 March 2019) Influenza activity continued to increase, especially
In NORTHCOM during week 09 DEPARTMENT OF DEFENSE (AFHSB) Seasonal Influenza Surveillance Summary Northern Command -- Week 09 (24 February 2019 02 March 2019) Influenza activity continued to increase, especially
B&T Format. New Measures. Better health care. Better choices. Better health.
 1100 13th Street NW, Third Floor Washington, DC 20005 phone 202.955.3500 fax 202.955.3599 www.ncqa.org TO: Interested Organizations FROM: Patrick Dahill, Assistant Vice President, Policy DATE: August 13,
Plan Details and Rates. Monthly Premium Rate Schedule
 Basis of Reimbursement Plan Details and Rates MetLife Option 1 (Low) MetLife Option 2 (High) In-Network Out-of-Network In-Network Out-of-Network 70th percentile 70th percentile of Negotiated Negotiated
THE STEPPING UP INITIATIVE
 THE STEPPING UP INITIATIVE The Problem Each year, there are an estimated 2 million people with serious mental illnesses admitted to jail across the nation. Almost three quarters of these adults also have
-Type of immunity that is more permanent (WBC can Remember)
") -Type of immunity that is more permanent (WBC can Remember).Get disease- Your body produces its own antibodies (killer T cells) to attack a particular pathogen 2.Vaccination- Injection containing a dead
-Type of immunity that is more permanent (WBC can Remember).Get disease- Your body produces its own antibodies (killer T cells) to attack a particular pathogen 2.Vaccination- Injection containing a dead
ADVANCE FOR PHYSICAL THERAPY AND REHAB MEDICINE
 100 Beard Sawmill Road, Sixth Floor Shelton, CT USA 06484-6259 Phone: +1 203.447.2800 Fax: +1 203.447.2900 A not-for-profit organization since 1931, BPA Worldwide is governed by a tripartite board comprised
Opioid Deaths Quadruple Since 1999
 THE COUNCIL OF STATE GOVERNMENTS CAPITOL RESEARCH AUGUST 2017 HEALTH POLICY Opioid Deaths Quadruple Since 1999 Since 1999, the number of overdose deaths involving opioids (including prescription opioids
NM Coalition of Sexual Assault Programs, Inc.
 NM Coalition of Sexual Assault Programs, Inc. PREVALENCE OF SEXUAL VIOLENCE AMONG WOMEN IN NEW MEXICO: A SUMMARY OF THE FINDINGS FROM THE NATIONAL INTIMATE PARTNER AND SEXUAL VIOLENCE SURVEY 2010 2012
DEPARTMENT OF DEFENSE (AFHSB)
") In NORTHCOM during week 02 DEPARTMENT OF DEFENSE (AFHSB) Seasonal Influenza Surveillance Summary Northern Command -- Week 02 (06 January 2019 12 January 2019) Influenza activity decreased in several states,
In NORTHCOM during week 02 DEPARTMENT OF DEFENSE (AFHSB) Seasonal Influenza Surveillance Summary Northern Command -- Week 02 (06 January 2019 12 January 2019) Influenza activity decreased in several states,
Jackson County Community Health Assessment
 2016 Jackson County Community Health Assessment With Collaboration from Black River Memorial Hospital and Jackson County Public Health Wisconsin Population Health Institute Table of Contents Structure
T H E S TAT E O F HEALTH
 THE STATE OF HEALTH Are we (really) healthy? As a region, Hampton Roads has worked hard to increase the number and quality of its medical facilities. The merger of Sentara and Tidewater Health Care sealed
2017 STATE WELL-BEING RANKINGS
 2017 STATE WELL-BEING RANKINGS 3 1 South Dakota 6 2 Vermont Hawaii 3 1 Minnesota 4 16 5 North Dakota Colorado 6 5 22 7 New Hampshire 18 8 9 Idaho Utah Montana 10 8 Massachusetts 11 14 Florida 12 11 Texas
STATE ALZHEIMER S DISEASE PLANS: WORKFORCE DEVELOPMENT
 STATE ALZHEIMER S DISEASE PLANS: WORKFORCE DEVELOPMENT Recommendations to increase the number of health care professionals that will be necessary to treat the growing aging and Alzheimer s populations
Women s health status is one of the strongest determinants of how women use the health care system. The
 Women s health status is one of the strongest determinants of how women use the health care system. The poorer their health, the more women need and benefit from high-quality, appropriate care. Overall,
Act Against AIDS Healthy Communities Program Partnering and Communicating Together (PACT) to Act Against AIDS
 to Act Against AIDS") Act Against AIDS Healthy Communities Program Partnering and Communicating Together (PACT) to Act Against AIDS Dear LULAC Council: We are thrilled to announce our partnership with the Act Against AIDS campaign
Act Against AIDS Healthy Communities Program Partnering and Communicating Together (PACT) to Act Against AIDS Dear LULAC Council: We are thrilled to announce our partnership with the Act Against AIDS campaign
Identical letters were also sent to Chairman/Ranking Member of the House Ways and Means Committee and House Energy and Commerce Committee
 Identical letters were also sent to Chairman/Ranking Member of the House Ways and Means Committee and House Energy and Commerce Committee October 15, 2012 The Honorable Max Baucus Chairman Senate Committee