Tracking Progress in Scaling-Up Diagnosis and Treatment for Malaria
|
|
|
- Abel Davis
- 6 years ago
- Views:
Transcription
 Procurement and Supply")
, Rima Shretta (Co-chair of PSM Working group and MSH), Jan van Erps (RBM Partnership Secretariate)")
1 Tracking Progress in Scaling-Up Diagnosis and Treatment for Malaria A Compilation of Data on African Malaria Endemic Countries Estimates of their Commodity Needs and Funding Available Carried out on behalf of the Roll Back Malaria (RBM) Procurement and Supply Chain Working Group (PSMWG) and Medicines for Malaria Venture (MMV) This report was compiled by Melanie Renshaw (Consultant), with support from Renia Coghlan (MMV), Rima Shretta (Co-chair of PSM Working group and MSH), Jan van Erps (RBM Partnership Secretariate) October
2 Contents Acronyms... 3 Background... 4 Methodology... 9 Results Accessing the information Quantification of Need Data on ACTs: Estimated Need, Financing and Gap ACT Estimated Need ACTs Financed Gap in ACTs Required Data on RDTs: Estimated Need, Financing and Gap RDT Estimated Need RDTs Financed Gap in RDTs required Source of Funding Country Identified Bottlenecks Indicators for tracking progress Recommendations Bibliography Annex 1: Summary of documents reviewed for data included in this report Annex 2: Table 2 - Quantification Methodologies ACTs Annex 3: RDT Targets Annex 4: Country ACT Estimated Needs (number of treatments) Annex 5: Country ACTs Financed (Number of treatments) Annex 6: Gaps in ACT Treatments Annex 7: Country RDT Estimated Needs Annex 8: Country RDTs Financed Annex 9: Gaps in the Number of RDTs Annex 10: Country Identified Bottlenecks in Scaling-Up Annex 11: Key Indicators for Malaria Treatment and Diagnosis Key Indicators Suggested by This Report GFATM/RBM RBM Road Map Indicators ALMA Quarterly Bulletin PMI: End Use Malaria Case Management Indicators PMI End-Use Supply Chain Indicators ACT Watch AMFm WHO Checklist for National Monitoring and Evaluation Plans WHO Indicators (World Malaria Report, 2009) Annex 12: Purpose of the Consultancy Acknowledgements
3 Acronyms ACT AMFm GFATM MIS MMV PSM PSMWG RBM RDT SP SRN SSA TORs WHO Artemisinin-Based Combination Therapy Affordable Medicines Facility, malaria The Global Fund to Fight HIV/AIDS, TB and Malaria Malaria Indicator Survey Medicines for Malaria Venture Procurement and Supply Management (plan) RBM Procurement and Supply Chain Management Working Group Roll Back Malaria Partnership Rapid Diagnostic Test Sulphadoxine-Pyrimethamine RBM sub-regional network Sub-Saharan Africa Terms of Reference World Health Organization 3
4 Objective The RBM Partnership targets recommend universal coverage of ACTs and RDTs for all malaria endemic countries by 2010 However, the recent World Malaria Report indicated that despite incredible donor commitments for malaria in recent years which reached 1.7 billion in 2009, as well as increases in procurement of Artemisinin-based Combination Therapies (ACTs), only 15 of children under five years from a set of countries reviewed in received an ACT when they had fever. There is a paucity of information on actual ACT and RDT requirements in countries. This is exacerbated by poor information management systems in countries to track the use of these essential malaria commodities as well as gaps in definition and understanding of the measure of universal coverage for RDTs / ACTs (as opposed to LLINs). In order to understand the needs of ACTs as defined by the countries, the Roll Back Malaria Partnership Procurement and Supply Management Working Group (PSMWG) and Medicines for Malaria Venture (MMV) commissioned a consultancy to provide an updated overview of the current status of funding available to countries in Africa for ACT and RDT procurement, as well as current national estimates of commodities required. It brings together information to address the following questions: What have countries indicated as their needs for ACTs and RDTs for , as defined in recent grant proposals and other national documents? How much funding does each country have available to procure the amounts indicated? What targets have been set by each country and how these targets are estimated? How does each country measure the amount required and how does this relate to the definition of universal coverage 4
5 This report limits its focus to a compilation and review of available data based on national documentation. It is not intended to provide a national or global forecast for ACTs or RDTs. Such activity is beyond the scope of the report. Key Findings 1. The definition of need in this report is based on countries own estimates of requirements as outlined in funding or policy reports. National quantification is based on a variety of methods such as epidemiological projections based on incidence or health facility consumption data. It is likely that quantification for RDTs in particular will be refined as greater experience, absorption and scale up of this technology occurs. 2. There has been a significant scale up in both ACTs and RDTs in the last few years, as countries accelerate towards the target of universal coverage. RDT need in this report is found to be significantly lower than ACT need. These numbers are based on the countries own estimates ACT 258 mn 300 mn 277 mn RDT 97 mn 138 mn 155 mn The objective of confirmed diagnosis (parasitological diagnosis before treatment) implies that RDT requirements should, in fact, be significantly higher than ACT requirements, given that microscopy is relatively limited. There is still considerable progress required before reaching the universal coverage targets established by the RBM Partnership. Considerable effort is required to achieve scale up of ACTs, and more specifically RDTs to improve case management of malaria. 3. A more detailed analysis comparing the quantification methodologies used in countries with similar endemicities and vector control coverage could potentially identify countries which may have serious under or over-estimates of need. 5
6 4. Clarification is required on the definition of universal coverage for RDT and ACT scale up. Many countries are currently reviewing their national malaria strategic plan or undergoing a mid-term programme review, providing an excellent opportunity to make a major step forward in estimating the interaction between different intervention practices. GFATM proposal development provides another opportunity to review targets and plan for accelerated scale-up. 5. Improved understanding of expected consumption and national absorptive capacity is essential during a period of scale-up in order to avoid both stock-outs and over stocking (which potentially leads to significant wastage). 6. Availability of funding is a dynamic process, as different annual budget cycles and donor grants are approved. The information in this report was correct at the time of writing, but will change as (for example) PMI MOPs are confirmed. 7. There is a significant need to improve routine monitoring and tracking of ACT and RDT need, funding and consumption data 8. All data should be regularly verified at country level when used for programmatic purposes, to take into account new developments such as the speed of RDT roll out, epidemiologic assumptions, Global Fund or other donor disbursements rates, etc. 6
7 Background Diagnosis and prompt and effective treatment with Artemisinin-based combination therapy (ACTs) are core interventions for the control of malaria. In the last five years, sub-saharan Africa (SSA) has experienced a major transition in malaria treatment regimens. Countries have changed their first line treatments from traditional, but largely ineffective monotherapies such as chloroquine and sulphadoxinepyrimethamine (SP), to the WHO recommended, highly effective, ACTs. This policy change has been accompanied by a rapid increase in the procurement of ACTs, rising from less than 5 million treatments procured globally in 2005 to around 130 million in 2008 (UNICEF 2009). Countries have also placed increasing emphasis on improving parasitological diagnosis of malaria cases through increased use of microscopy and rolling out the use of rapid diagnostic tests (RDTs), particularly in peripheral health facilities and at community level. Before 2009, WHO recommended parasitological confirmation of all fever cases in areas of low- to moderate-transmission. In areas of stable high-transmission, it recommended clinical diagnosis in the under fives, and parasitological diagnosis in the over fives. In 2009, WHO changed this recommendation to prompt parasitological confirmation by microscopy or RDT for all patients with suspected malaria before treatment is started. In 2008, the Roll Back Malaria (RBM) Partnership revised its goals and targets in the 2008 Global Malaria Action Plan to achieve universal coverage for all populations at risk using locally appropriate interventions for prevention and case management by This implied that 80 of people with malaria should be diagnosed and treated with effective antimalarial medicines, such as ACTs within one day of the onset of illness. These targets have been interpreted in different ways at country level; some countries aim for universal coverage of the whole population; others aim for universal coverage of all health facilities or full coverage of public sector distribution mechanisms (health facilities and home management of malaria). 7
8 With the rapid increase in RDT and ACT procurement and distribution, there is a vital need to track country scale-up progress, identify major gaps in coverage and identify and address key bottlenecks to scaling-up. The PSMWG of the RBM Partnership is committed to assisting countries to identify and address major PSM bottlenecks in early diagnosis and prompt and effective treatment. This commitment was re-enforced at the 17 th RBM Board meeting in December 2009 with a resolution by endemic country, NGO and Private Sector constituencies on Procurement and Supply Chain Challenges and Systems Strengthening. The RBM Board recognized that achieving the sustained scale-up of malaria control in all countries will require concerted efforts towards strengthening health systems to enable accurate forecasting, effective procurement and stronger supply chain management. The RBM Board recommended the following actions be undertaken: Endemic countries include in their national strategic plans, plans to strengthen country level systems for forecasting, procurement, information and supply chain management capacity Increased financing and technical support towards country level capacity building for forecasting, procurement, information and supply chain management systems Efforts to improve market intelligence on global demand and supply for malaria commodities Ensure monitoring of all commodities Enhanced commitment by partners to address procurement and supply management challenges The PSMWG was requested to collaborate with key partners to ensure that these recommended actions are executed. As a contributory step, MMV and the PSMWG commissioned a consultancy to review: country level quantification assessments for ACTs and RDTs requirements the methodologies used to calculate these quantification requirements to determine the number of ACTs and RDTs already financed and by whom to identify gaps in achieving country targets. 8
9 The consultancy also included a review of country identified bottlenecks in scaling up prompt diagnosis and effective treatment. Finally, it summarised key indicators for diagnosis and case management (See Annex 12 for TORs). It is hoped that this information will further contribute towards the identification of how the RBM partnership can better mobilize to support countries towards achieving universal coverage. Methodology Much of the information presented in this report comes from a comprehensive review of key national documents including GFATM proposals (particularly for Rounds 7, 8, 9 and the Affordable Medicines Facility Malaria - AMFm), GFATM PSM plans (where available), RBM road maps, US President s Malaria Initiative Malaria Operational Plans (financial year 2009; FY10 plans were reviewed through personal communication), Needs Assessments, third generation strategic plans, Malaria Indicator Surveys (MIS), and ACT watch baseline documents. (See Annex 1: Table summarizing documents consulted by country). Documents for 45 country programmes were reviewed and the following data were extracted: 1. Data on country specific estimates of ACT and RDT requirements including a brief description of the rationale and methodologies used to obtain these estimates 2. Information on the resources flowing into each African malaria endemic country for ACT and RDT procurement from the various donors including the Global Fund, PMI, UNITAID and the World Bank Booster programme. 3. Annual procurement of ACTs and RDTs by country for 3 years (2009, 2010, 2011) based on national scale up requirements, and the anticipated funding gap (if any) to achieve this. There was considerable variation in the data available across different documents and from different sources. Data from the most recent documents took precedence over older data. The number of ACTs and RDTs to be procured as outlined in PSM plans 9
10 often differed from the figures quoted in the original proposals, indicating the importance of accessing the PSM documents. It was noted for GF Round 8 proposals that the number of treatments and RDTs tended to be revised downwards between submission of the proposals and finalization of the PSM plans. Where data were unclear, inconsistent or unavailable, country programmes were consulted to clarify data or fill gaps, in collaboration with RBM sub-regional network (SRN) focal points. Where clarifications were required around funding data from specific agencies, country level focal points were consulted (for example PMI, WHO or UNICEF). Validation of data through SRNs and country level focal points was an essential step and ideally all data in this database should be validated by country programmes, particularly as the targets are changing, even since submission of GFATM Round 9 proposals. Several countries are currently re-quantifying their requirements for universal coverage, for example, Burundi, Malawi, Angola and Madagascar. It is recommended that this database should be updated on a quarterly basis, if it is to remain valid. This could be managed by the PSM WG, working in close collaboration with SRN focal points. RBM Road Maps were reviewed and country-identified key bottlenecks relating to scaling up ACTs and RDTs were summarised (see Annex 11). Finally, key indicators relating to diagnosis and case management from RBM, WHO, GFATM, ACT Watch, PMI and AMFm were also summarised in Annex 12. Results Accessing the information Accessing and collating these documents was time consuming given that all documents were not readily available in a central repository. Fortunately many key documents are readily available on-line, for example those produced for PMI and some, but not all, GFATM documents. However, key data from some agencies, for example, the World Bank, were not readily available. It is recommended that the RBM secretariat maintains a centralized, up-to-date repository of key operational documents for easy access. Recognizing that many of these documents remain confidential (for example GF PSM 10
11 plans, GF proposals not yet awarded), it is recommended that these documents are made available through password protected sites to key individuals (to be determined by the RBM secretariat). It is also recommended that the GF should share key documents including PSM plans with the RBM secretariat with an understanding that they will not be generally circulated. Quantification of Need Annex 2 briefly summarises the different methodologies used at country level to quantify ACT requirements. Countries have used either: An extrapolation of the estimated number of episodes per year by age category, or Data from health information systems and health facility consumption data, or A combination of the two methods. Some countries have aimed for universal coverage of the whole population, whilst others have targeted health facility or public sector coverage (which in some countries includes community case management of malaria, usually for children under five years of age). With the exception of the initial countries invited to submit for phase 1 of the Affordable Medicines Facility malaria (AMFm) (Benin, Ghana, Kenya, Madagascar, Niger, Nigeria, Rwanda, Senegal, Tanzania, Uganda and Zanzibar), there is very limited targeting of the private sector outside of private clinics. Several countries have changed their targets through successive funding proposals and assessments, usually increasing the targets. It is difficult to assess whether the quantification methods used are reliable estimates of country requirements for universal coverage. An analysis comparing the methodologies used in countries with similar endemicities and vector control coverage could potentially identify countries which may have serious under or over-estimates of need. Additionally a comparison of country quantifications with the most up-to-date consumption data could 11
12 also highlight countries with significant differences between their current documented case load and their projected needs. Many of the projections of ACT need incorporate reductions in cases of up to 50 as a result of universal coverage of vector control interventions from If the scale-up of vector control interventions falls behind schedule and the predictions of reduced case load are not realised, this will result in significant short falls in availability of ACTs in countries that have incorporated these projections in their calculations. The projected reduction in ACT consumption is also based on increased use of RDTs for the parasitological diagnosis of all malaria cases. It will therefore be equally important to track the progress of RDT roll-out at the same time as ACT scale-up is monitored. It will also be important to ensure that countries, especially those with weaker infrastructures, which have factored in rapid increases in coverage of health services, have the absorptive capacity for rapid scale-up. There is a risk that global targets of universal coverage are unrealistic for some countries of Sub-Saharan Africa. In terms of RDT quantifications, countries have based their calculations of need on the number of fever cases (these may be all fever cases country wide or just those seen by the public health sector, particularly health facilities). The majority of countries (31 countries) are now targeting all age groups (e.g. children under five years of age and over-fives) for parasitological diagnosis of fever cases, in line with new WHO recommendations. 15 countries are targeting parasitological diagnosis of fever cases in children over five years of age only. This represents an increase in the number of countries targeting all fever cases, since 2008, when 20 of 45 malaria endemic countries in the WHO Africa Region reported having adopted a policy of providing parasitological diagnosis to all age groups (WMR, 2009). 12
13 Twenty-one African countries are using or planning to use RDTs at community level. The majority of countries are relying on microscopy for parasitological diagnosis in hospitals and higher level health centres with RDTs in use at peripheral health centers, community level and occasionally in the private sector (see Annex 3). Until all countries are targeting parasitological diagnosis at all age groups and all levels, including community level, the target for universal coverage of parasitological diagnosis and effective case management will not be achieved. It is becoming increasingly important to monitor country consumption data and revisit coverage targets to ensure there is neither an under-estimation nor over-estimation of need. Increased emphasis from key RBM partners, including key donors and technical agencies, is required to strengthen routine health information systems to allow monitoring of consumption and real time adjustments of targets and procurement where necessary. This also requires increased emphasis on building stronger health systems. Data on ACTs: Estimated Need, Financing and Gap ACT Estimated Need Annex 4 summarises the country quantification data for ACT requirements. The annual projected ACT requirement (number of full doses) for 2009 is 258 million treatments, rising to 300 million treatments in 2010 and decreasing to 277 million treatments in This total is likely to increase further once ACT quantification exercises for the AMFm have been completed. These projections are higher than the GMAP estimate, of 217 million ACT treatments required to achieve universal coverage in Sub-Saharan Africa (GMAP, 2008), based on the World Malaria Report 2008 data. WHO estimate that there were 208 million malaria cases in Africa in 2008 (WMR, 2009). ACTs Financed Annex 5 summarises the number of ACTs financed (this includes successful round 9 proposals, successful AMFm proposals and PMI FY 2010 data). These data do not 13
14 include private sector AMFm data as countries have not yet quantified their private sector requirements. Approximately 236 million ACT treatments are financed in 2009, increasing to 281 million treatments in 2010 and 219 million treatments in This compares to approximately 100 million ACTs procured globally by the public sector, and an estimated 62 million ACTs distributed in Africa (AFRO region only) in 2008 (WMR, 2009), showing a very significant increase in procurement in It is important that demand does not exceed supply and that this is closely monitored. The data contained in this report and in this database have also been used to further refine the PSMWG forecasting model by providing additional and detailed data for the forecasting model. If a breakdown is made of the type of ACT financed, the majority of ACTs financed are Artemether-Lumefantrine, followed by Artesunate-Amadiaquine and finally only relatively small quantities of Artesunate Sulphadoxine Pyrimethamine (See figure 1) Figure 1: Breakdown of ACTs financed by combination. 300,000, ,000,000 AS-SP AS-AQ AL 200,000,000 number of treatments 150,000, ,000,000 50,000, year 14
15 Gap in ACTs Required Annex 6 summarises the gap in ACT requirement, with around 41 million treatments requiring funding in 2009 to achieve country targets, 38 million treatments in 2010 and 61 million treatments in It will be important to ensure countries, particularly those who have failed to secure funding through GFATM rounds 8 and 9, do not have serious ACT shortfalls. Given some of the uncertainties in ACT quantification data, increased flexibility in sharing ACTs on a regional basis may be one way of avoiding short-term stock outs whilst monitoring systems are strengthened. Figure 2: ACT quantification, numbers financed and outstanding gaps in SSA ACTs in sub-saharan Africa 350,000, ,000,000 number of ACTs needed number of ACTs financed gap 250,000,000 Number of doses of ACTs 200,000, ,000, ,000,000 50,000, Year 15
16 Data on RDTs: Estimated Need, Financing and Gap RDT Estimated Need Annex 7 summarises the country quantification data for RDTs. The annual projected RDT requirement for 2009, based on the countries own forecasts, is 97 million tests, rising to 138 million tests in 2010 and 155 million tests in The GMAP estimated that to reach universal coverage for all populations at risk with appropriate interventions by the end of 2010, approximately 680 million parasitological diagnoses were needed to confirm suspected malaria fever cases; and it seems unlikely that this target will be reached, even with the ambitious scale-up currently being undertaken. RDTs Financed Annex 8 summarises the number of RDTs financed (this includes successful round 9 proposals, successful AMFm proposals and PMI FY 2010 data). Approximately 74 million RDTs are financed in 2009, increasing to 105 million tests in 2010 and 104 million tests in This compares to only 11.5 million RDTs distributed in Africa in 2008 (WMR, 2009) and represents an even more rapid scale up when compared to 2006 when approximately 12.5 million suspected malaria cases were parasitologically diagnosed in sub-saharan Africa, with 11 million of these cases confirmed through microscopy and just 1.4 million diagnoses using RDTs (GMAP, 2008). Gap in RDTs required Annex 9 summarises the gap in RDT requirement, with around 31 million tests requiring funding in 2009 to achieve country targets, 35 million tests in 2010 and 46 million in It will be important to ensure countries, particularly those who have failed round 8 and 9, do not have serious RDT shortfalls. 16
17 Figure 3: RDT quantification, numbers financed & outstanding gaps, SSA ,000, ,000,000 number of RDTs needed number of RDTs financed 140,000, ,000,000 Number of RDTs 100,000,000 80,000,000 60,000,000 40,000,000 20,000, Year Source of Funding The table below summarises the source of funding of financed ACTs. As expected, the vast majority of funding for ACTs comes from the GFATM. A small number will come from other partners (PMI, WB, UNICEF/UNITAID and governments). Around 38 million ACTs will be financed in the first three years of the successful round 9 grants, compared to 149 million treatments in round 8 and 126 million treatments in round 7. This reduction in the number of treatments financed may partly reflect the lower success rate in round 9, with several larger countries failing, but may also reflect the high success rate of a number of large countries in round 7 and 8, and also be due to the fact that most ACTs are procured from year 2 of round 9 grants. 17
18 PMI is procuring increasing numbers of ACTs in 2010 in 10 countries. The number of ACTs and RDTs procured by PMI will increase significantly, particularly as new programmes in DRC and Nigeria are implemented. Data for PMI are preliminary 1, based on information available at the time of compilation this may not be complete due to the funding cycle timeframe. The data on World Bank procured ACTs is sourced from country level plans and documents rather than direct from the World Bank and may be an underestimate of ACTs procured using World Bank resources PMI 29,616,342 21,328,400 44,158,100 WB 21,440,260 19,890,000 16,000,000 GFATM 152,698, ,684, ,629,768 UNICEF/UNITAID 14,414,895 12,237,584 4,152,472 government 13,870,978 16,430,123 22,515,983 others 13,861,541 11,925,647 10,249,099 total 236,051, ,974, ,092,428 The table below summarises the source of funding of financed RDTs. As expected, the vast majority of funding for RDTs comes from the GFATM and then from a small number of partners, particularly PMI. Again, the number of RDTs funded by is likely to increase significantly in coming years PMI 3,470,000 4,840,526 10,744,800 WB 3,000,000 6,000,000 3,000,000 GFATM 59,183,853 79,678,832 91,244,184 government 519, ,531 4,625,961 others 5,397,491 5,424,692 4,747,579 1 Note: PMI data are for the previous Fiscal Year, which is implemented in the year noted (i.e data in this report are for FY 2009). All data are from national malaria operating plans estimates come from national plans and national documents and do not include the vast majority of ACTs and RDTs likely to be financed by PMI in 2011 as the annual planning cycle had not yet been completed at the time of writing. 18
19 Country Identified Bottlenecks Annex 10 summarises the key bottlenecks to achieve universal coverage of RDTs and ACTs identified by countries in RBM roadmaps. These bottlenecks should be used to help further identify key areas of country support by the PSM WG. Indicators for tracking progress Annex 11 summarises the key indicators used by various partners to track diagnosis and treatment. It is recommended that a small set of indicators (maximum six to eight) are selected by the RBM PSMWG to track progress and help to identify bottlenecks in scaling up parasitological diagnosis with RDTs and treatment of malaria at country level on a quarterly basis. These will help to identify bottlenecks, raise early warning flags and trigger partner responses towards helping resolve these bottlenecks in a timely manner. Recommendations 1. This report highlights the prime importance of the need to have improved routine monitoring and tracking of ACT and RDT consumption data in order to avoid both stock-outs and over stocking leading to significant wastage. This will require increased financial investments in routine monitoring by key RBM donors, and an increase in technical assistance to countries by key technical partners, in the context of broader emphasis on health systems strengthening to ensure effective delivery of ACTs and RDTs. 2. A simple checklist of a core set of indicators should be developed in collaboration with the HWG, PSMWG, MERG and case management working group to support countries in tracking ACT and RDT consumption and assist in the early identification and addressing of bottlenecks (See Annex 11 outlining current indicators used by key organizations and groups and draft list of potential key indicators). 3. The RBM partnership should prioritise its support to countries to effectively monitor ACT and RDT consumption and requirements. This will require collaboration 19
20 between SRNs, PSMWG, HWG, MERG and the case management working group. The RBM Sub Regional Networks working with country level malaria control programmes could update the tracking checklist during routine telephone conference calls to identify and address key bottlenecks on a quarterly basis. Information gained through SRNs could be triangulated with information tracked through partner focal points using a similar mechanism to that established by the Alliance for Malaria Prevention (AMP). The AMP has instituted an LLIN Distribution Tracking Project that is aimed at eliciting information from local country level partners on the progress of LLIN distributions. It aims to identify and address bottlenecks encountered in the movement of nets at the country level, using focal points from key partners (including PSI, PMI, UNICEF, IFRC, etc). A monitoring template has been developed which should be completed by local partnerships. 4. It is recommended that the ACT and RDT databases should be updated on a quarterly basis. As an example, a centralized database is available for LLINs scaleup coverage, allowing all LLIN-focused data to be consolidated in one place. 5. Manufacturer data could be tracked by the forecasting task force to monitor quarterly procurements against quantities outlined in this report. Countries which are procuring fewer ACTs than expected could have bottlenecks in financial flows, procurement processes, or in-country supply chain. Alternatively, under-procurement could reflect lower ACT consumption requirements than projected. 6. It will also be important to include AMFm consumption data when it becomes available to ensure sufficient ACTs will be available to meet all public sector and private sector requirements. Attention should also be paid to countries which are updating their quantification of need or revisiting consumption data (including Burundi, Malawi, Angola, and Madagascar). There could also be a final validation of the data by country focal points and updated tracking through SRNs to a central focal point. 7. There remains a requirement for increased sharing of documents and information. A database of up to date documents should be maintained by the RBM secretariat including on password protected sites, where data are confidential. Sharing of key 20
21 documents by GFATM, particularly PSM plans and also data from World Bank should also be encouraged. 8. An analysis comparing the methodologies used in countries with similar endemicities and vector control coverage could potentially identify countries which may have serious under or over-estimates of need. 9. Further clarification is recommended around a standard definition of universal coverage for ACT and RDT coverage 10. The objective of confirmed diagnosis (parasitological diagnosis before treatment) implies that RDT requirements should, in fact, be significantly higher than ACT requirements, given that microscopy is relatively limited. There is still considerable progress required before reaching the universal coverage targets established by the RBM Partnership. Considerable effort required to achieve scale up of ACTs, and more specifically RDTs to improve case management of malaria. 11. Given the importance of rapid diagnosis and prompt and effective treatment, it is suggested that the PSM Working group holds a one day break out meeting tied to the January working group meeting to come up with a plan of action on how to support countries in monitoring ACT and RDT consumption and develop a mechanism to identify and address bottlenecks in a timely way. Country identified bottlenecks (Annex 10) provide a strong basis on which to prioritise key support areas for the PSMWG. 21
22 Bibliography UNICEF 2009: Malaria and Children. Progress in Intervention Coverage. UNICEF, New York USA, 2009 WMR 2008: World Malaria Report, World Health Organization, Geneva Switzerland
23 Annex 1: Summary of documents reviewed for data included in this report Country Documents reviewed Documents not reviewed Angola GF Rd 7 proposal; GF Rd 7 PSM plan; Road Map; PMI MOP FY 09; MIS 07 Benin GF Rd 7 proposal; GF Rd 7 PSM plan; Road Map; PMI MOP FY 09; GF Rd 8 proposal (failed); AMFm Proposal; GF RCC RD 3; ACT watch baseline Botswana NMCP data Burkina Faso GF Rd 7 proposal; GF Rd 7 PSM plan; GF Rd 8 proposal; Road Map; Needs assessment, GF PSM plan rd 8 Burundi GF Rd 2 RCC; GF Rd 2 PSM plan; Road map; GF rd 9 C.A.R. GF rd 8 proposal; Road map, GF PSM plan rd 8 Cameroon GF Rd 9 proposal; Road map Chad GF Rd 7 proposal; Road Map, GF Rd 9 proposal (no ACTs) Comoros GF Rd 8 proposal; Road map; Needs assessment, GF Rd 8 PSM plan Congo GF Rd 8 proposal; Road map; Needs assessment, GF Rd 8 PSM plan Cote d'ivoire GF Rd 8 proposal; Road map; Needs assessment, GF Rd 8 PSM plan Djibouti GF rd 8 proposal (failed); GF Rd 6 proposal, GF Rd 9 proposal DRC GF R9 proposal; GF Rd 8 proposal; Road map; Needs assessment; ACT watch E. Guinea GF Rd 5 proposal; Road map Eritrea GF r 9 proposal; GF rd 6 proposal; Road map; Ethiopia Gabon Gambia Ghana Guinea Guinea Bissau Kenya Liberia Madagascar GF Rd 8 proposal; Road map; Needs assessment; National strategy; MIS 07; Country quantification exercise GF Rd 8 PSM plan GF rd 8 proposal (failed); GF Rd 5 proposal; Road map GF Rd 6 proposal; GF Rd 9 proposal; Needs assessment GF Rd 8 proposal; GF RCC Rd 4; Road map; Needs assessment; MOP 09; AMFm, PSM plans RCC and RD 8 GF Rd 9 proposal; Needs Assessment; Road map; GF Rd 6 proposal; GF rd 9 proposal; Needs assessment, Country PSM plans; GF Rd 6 proposal; Road map GF rd 9 proposal; Needs assessment; MIS; Road map; PMI MOP 09; Draft strategic plan, AMFm proposal GF rd 7 proposal; PMI MOP 09, GF Rd 7 PSM plan National Strategy; GF RCC 4 proposal GF Rd 7 proposal; PSM plan RD 7, PMI MOP 09; GF Rd 7 PSM plan GF Rd 8 PSM plan PSM plan RCC RD 4 23
24 Country Documents reviewed Documents not reviewed AMFm proposal Malawi GF rd 9 proposal; GF Rd 7 proposal; GF PSM plan RD 7; PMI MOP 09; Mali GF RD 9 proposal; GF RD 6 proposal; PMI MOP 09; Needs assessment Mauritania Mozambique GF RD 9 proposal; PMI MOP 09; Road map GF RD 9 proposal; GF RD 8 proposal (failed); PMI MOP 09; National Strategy Namibia GF RD 6 proposal; RCC workplan RCC 2009 narrative Niger GF RD 7 proposal; AMFm proposal; GF RD 7 PSM plan; Road map; Needs assessment GF RD 9 proposal, Nigeria Rwanda Senegal GF RD 8 proposal; Needs assessment; Road map; AMFm proposal; ACT watch baseline; Country requantification, GF RD 8 PSM plan (LLINs) GF RD 8 proposal; GF RCC RD 3 proposal; GF RCC PSM plan; GF RD 5 proposal; PMI MOP FY 09; Road map AMFM proposal GF RD 9 proposal; GF RD 7 proposal; GF RD 7 PSM plan; MOP FY 09; MIS 06; AMFm proposal GF RD 8 PSM plan (ACTs) Sierra Leone GF RD 9 proposal; GF RD 7 proposal; Road map, GF PSM plan RD 7 Updated country quantification Somalia GF RD 6 proposal; RD 6 phase 2 draft South Africa Data from NMCP manager STP GF RD 7 proposal; Road map GF PSM plan RD 7 Sudan N Sudan S Swaziland Tanzania Togo Uganda Zambia Zimbabwe GF RD 7 proposal; UNITAID POA, GF RD 7 PSM plan GF RD 7 proposal; UNITAID POA, GF RD 7 PSM plan GF RD 9 proposal GF RD 8 (signed); GF Round 8 PSM plan GF RD 8 proposal; GF RD 7 proposal; Road map; GF RD 7 PSM plan; AMFm proposal; PMI MOP 09, Round 9 proposal GF RD 9 proposal; Road map; Needs assessment GF RD 9 proposal; GF RD 7 proposal; GF RD 7 PSM plan; AMFm proposal; PMI MOP FY 09; Road map ACT watch baseline GF RD 7 proposal; GF RD 7 PSM plan; Road map; PMI MOP FY 09; MIS GF RD 8 proposal (not signed); Road map; Needs assessment GF PSM plan RD 8 Zanzibar GF RD 8 proposal; Road map PMI MOP 09; AMFm PSM plan round 8 needs assessment 24
25 Annex 2: Table 2 - Quantification Methodologies ACTs Country Target Epidemiological estimates Reduction in cases with increasing vector control Angola Benin Epidemiological projection based on number of episodes per age category, extrapolated for health facility coverage. MOH is undertaking a new quantification exercise for universal coverage Epidemiological estimate extrapolated for full health facility coverage Unstable transmission 0.2 episodes per person; low but stable 0.5 episodes per person, hyper-endemic 6m -3 yrs 2 episodes, 4-8 yrs 1 episode, 9-13 years 0.7 episodes, adults, 0.5 episodes 2 episodes of malaria per year for <5s no decrease no decrease Botswana HMIS data HMIS data incidence reduces from 10 per thousand in 2009, 9, in 2010, 8 in 2011, 5 in 2012, 3 in 2013 and 2 in 2014 HMM/ private sector HMM HMM no data Burkina Faso Epidemiological estimate extrapolated for full health not detailed no decrease HMM facility coverage Burundi HMIS data HMIS data 25 reduction over next 5 years community based treatment may be introduced in C.A.R. Cameroon Chad Comoros Congo Epidemiological projection based on number of episodes per age category covering 60 of population by 2010 Epidemiological projection based on number of episodes per age category covering 80 of population by 2010 HMIS data extrapolated to cover 30 of the population Epidemiological projection based on number of episodes per age category covering 100 of population Epidemiological projection based on number of episodes per age category covering 80 of population Mean number of episodes of malaria in U5s = 2, Mean number of episodes of malaria in >5s = 1 per 2 persons. From 2012, a 10 reduction annually no data From 2010 a 10 reduction annually until data extrapolated from district health utilisation data no data no data Cote d'ivoire HMIS data extrapolation of health facility data Djibouti Extrapolation from 2008 survey, estimated one case per year per person DRC Epidemiological projection based on number of episodes per age category covering 28 of population &100 of health facilities E. Guinea Epidemiological projection based on number of episodes per age category covering 100 of the population Eritrea epidemiological extrapolation for full coverage no decrease 10 in 2010, 20 in 2011, 30 in 2012 Quantities of ACT will reduce by 10 in 2011, 20 in 2012 & 30 in 2013 no decrease 1 case per person per year Reduction by 10 starting in 2011 <5s 4 cases, cases, >15 1 case 25 decrease in number of cases in 2012, 505 in 2013 &2014 HMM HMM no data no data no data 1 case per person per year no data no data 0.3 episodes annually per person 10, 20, 30, 40 & 50 from year 1 to year five, respectively HMM Includes community case management no data HMM
26 Country Target Epidemiological estimates Reduction in cases with increasing vector control Ethiopia health facility consumption data &projections standard number of treatments per health facility Gabon epidemiological estimates <5s = 4 per year, Expected number of episodes in >5s = 2 per yr Gambia Epidemiological projection based on the number of fever cases <1s episodes, 2-4 yrs - 1.5, > 5 yrs 0.5 Ghana Epidemiological estimate <1s 1 case per year, episodes, >6 1 episode Guinea Guinea Bissau Epidemiological projection based on number of episodes per age category covering 80 of population epidemiological projection with health facility &community level coverage no decrease Reduction in morbidity 10 per yr (50 among <5s) annual decrease of 10 Reduction in cases due to prevention activities: 10 in 2011 &2012 HMM/ private sector community health posts in all communities no data HMM HMM no data no decrease HMM <3s cases, case, case, >14 = 0.5 episodes 10 decrease in 2012 HMM Kenya HMIS data health facility data used no decrease includes HMM from year 2 &private sector distribution Liberia Epidemiological projection based on number of episodes per age category covering 55 of population by 2010 Combination of HMIS data &extrapolation of number of episodes per age category <5s &PW two episodes per year, >5s one episode per year no decrease Madagascar episodes in<5s - 2, >5s - 1, decreasing with includes increasing vector HMM control &private sector Malawi HMIS data HMIS no decrease HMM Mali HMIS data HMIS data 10 decrease in no data cases annually from no data Mauritania no data no data no data Mozambique Namibia Epidemiological projection based on number of episodes per age category covering 100 of population Health management information system data <5-2 episodes of malaria annually, older children 1.5 &adults 1 malaria cases per 1000 used to calculate full coverage , 10-30, 11-20, 12-10, 13-7, 14-5; decreases HMM no data Niger Unclear No data no data no data Nigeria Epidemiological projection based on number of episodes per age category extrapolated to include increasing population coverage to 80 by 2010 <5yrs = 2.5; 5-9yrs = 1.5; 10-14yrs = 1 &>14yrs = 0.5, cumulative annual 10 decrease in the number of fever episodes from 2011 An additional annual 10 reduction in the number needing ACTs in > 5s due to use of RDTs for diagnosis from 2011 Decreases includes private sector &HMM Rwanda Epidemiological projection based on number of episodes Average number of malarialike episodes: <5s 2 episodes, HMM &private per age category ; Adult sector Senegal no data includes HMM &private sector
27 Country Target Epidemiological estimates Reduction in cases with increasing vector control Sierra Leone Somalia South Africa STP Sudan S Epidemiological projection based on number of episodes per age category Based on scaling up coverage through health facilities aiming for 90 health facility coverage 100 coverage through health facilities Health management information system data Epidemiological extrapolation of cases at health facility, private sector and community level. < 5 yrs - 2 episodes of fever per year, pregnant woman 1 episode, 5-15yrs episodes, > 15 years 0.5 episodes Number of fever episodes/year by age group are <5yrs = 3; over five years = 1 Fever episodes are anticipated to reduce by 10 in 2012, 20 in 2013, 30 in no decrease HNIS data no decrease No based of health information system data &factors in decrease in the number of cases with increasing vector control Number of episodes - < 5-2 episodes of fever, pregnant woman 1 episode, 5-15yrs 0.75 episodes, and > 15 years 0.5 episodes yes no data HMM/ private sector HMM <5s - 50 >5s - 33 <5s - 60, >5s - 39 <5s - 70, >5s - 46 includes community health workers working out of health posts no data HMM &private sector distributions Sudan N number of cases &epidemiology Not specified yes no data Swaziland Tanzania Togo Uganda Zambia Zimbabwe Zanzibar Epidemiological projection based on number of categories per age category aiming for 95 coverage through health facilities Consumption data and extrapolation of epidemiological estimates Epidemiological projection based on number of episodes per age category &100 coverage by 2010 through health facilities &community level treatment Health management information system data extrapolated for increasing coverage including HMM Health management information system data extrapolated for increasing coverage including HMM Epidemiological projection based on number of episodes per age category covering 100 of population Epidemiological projection based on number of episodes per age category covering 100 of population <5s 1.7 cases per year, >5s 0.4 episodes, Number of fever episodes by age group; < 3 yrs -4.5; 3-9 yrs - 4.5; 9-14 yrs - 1.8; >14 yrs+ 1.8; No of expected confirmed diagnosis cases is 15 cases per 1000 in 2010, 10 cases per 100 (3700 cases) in 2011, 5 cases per 1000 (1800 cases) in 2012, &1 case per 1000 (350 cases) in reduction in annual consumption following universal coverage in 2010 yes. 5 decrease in malaria incidence in 2012, 10 in 2013, 20 in 2014, &30 in 2015 HMIS projection no data &epidemiological exercise Number of episodes = 1 for < 5 s &0.4 for > 5 s. < 5 : 2.5 episodes in areas of high transmission, 1.0 in low; >5s 0.8 in high transmission areas, 0.4 in low Malaria incidence rates are reduced by 10 in 09, 35 in 10, 75 in 11 &80 in 12 yes no data HMM &private sector HMM HMM &private sector HMM HMM HMM &private sector
28 Annex 3: RDT Targets Country Target Estimated coverage Angola Parasitological diagnosis with RDTs in health facilities without microscopes, targeting fever cases in under fives in areas of unstable transmission, over fives countrywide Target Group Level Comment ND ND ND <5 & >5 HF level Country is undertaking a new quantification exercise with higher targets and so targets may increase Benin ND ND ND ND ND ND Botswana Parasitological diagnosis of all fever cases through microscopy and RDTs in health facilities <5 & >5 HF level Number of RDTs exceeds number of ACT treatments Burkina Faso Burundi C.A.R. Cameroon Chad Comoros Congo Cote d'ivoire Djibouti Parasitological diagnosis of all health facility fever cases in over fives through RDTs and microscopy Parasitological diagnosis of all health facility fever cases in over fives Parasitological diagnosis of all fever cases in under fives and over fives through microscopy and RDTs at health facility level Parasitological diagnosis of over fives in health facilities and community level Parasitological diagnosis in under fives and over fives in health facilities Parasitological diagnosis in peripheral health facilities and health centres - 25 of HFs year 1, 50 year 2, and 100 year 3 onwards, includes under fives and over fives Parasitological diagnosis in the over fives in health facilities without microscopes Parasitological diagnosis in health facilities (92 of fever cases in over fives -32 microscopically and 60 RDTs) <5s - 30 of fever cases will be parasitologically diagnosed, All hospitals will have microscopes, RDTs will be used in health centres. Parasitological diagnosis of all malaria cases (under fives and over fives) >5s HF level Microscopy of diagnosis. RDTs of diagnosis >5s HF level Greater reliance on microscopy with RDTs providing less than 20 of diagnosis <5s & >5s HF and peripher y >5s HF and commun ity level <5s & HF > 5s <5 & >5 HF - Parasitol ogical diagnosi s in peripher al HF and health centres Microscopy covers 30 of parasitological diagnosis, RDTs 70 Microscopy currently targets around 50 of parasitological diagnosis Parasitological diagnosis of all fever cases in health facilities Microscopy currently around 50 of parasitological diagnosis but RDTs expanded rapidly from 2010, Parasitological diagnosis in peripheral health facilities and health centres - 25 of HFs year 1, 50 year 2, and 100 year 3 onwards, includes under fives and over five >5s HF Target significantly reduced in PSM plan <5s and > 5s health facilities <5 & >5 HF and commun ity level 92 of fever cases will be diagnosed parasitologically at health facility level - in the over fives, 32 microscopically and 60 RDTs. Children under five - 30 of fever cases will be parasitologically diagnosed, All hospitals will have microscopes, RDTs will be used in health centres. RDTs cover 34 of parasitological diagnosis focusing on the periphery, 28
29 microscopes cover rest of diagnosis DRC Parasitological diagnosis of the >5s HF over fives in health facilities E. Guinea ND ND ND ND ND Nd requested data from GF PR and MOH - no response Eritrea Parasitological diagnosis of all malaria cases (under fives and over fives) <5 & >5 HF (those without microsc opes)an d commun ity level Microscopy is also being strengthened Ethiopia Gabon Gambia Ghana Guinea Guinea Bissau Kenya Parasitological diagnosis for under fives and over fives in health facilities including health postshealth facility consumption data and projections Parasitological diagnosis in the over fives in health facilities Parasitological confirmation at health facility and community level for under and over fives - microscopy = 15 RDTs - 85 Parasitological diagnosis in the over sevens in health facilities using RDTs (30) and microscopy (40) Parasitological diagnosis in the over fives in health facilities Parasitological diagnosis of under fives and over fives in health facilities Parasitological diagnosis of under fives and over fives in health facilities <5 & >5 HF includin g health posts Microscopy is being strengthened in health centres and hospitals. Country uses pan specific RDTs >5s HF Verifying data with NMCP <5s and >5s HF and commun ity level Parasitological diagnosis of all fever cases through microscopy and RDTs >7 HF level RDT diagnosis increases by 5 annually >5s HF RDTs account for 75 of parasitological diagnosis <5 & >5 HF level Aim for 100 parasitological diagnosis of fever cases in health facilities <5 & >5 HF level RDTs may be introduced at community level over time but are currently only used at HF level Liberia ND ND ND ND ND ND ND Madagascar Parasitological diagnosis of all malaria cases (under fives and over fives) <5s and >5s HF level and commun ity level Country will requantify if necessary based on consumption Malawi Mali Mauritania Mozambiqu e Parasitological diagnosis of health facility fever cases in the under fives where there is no microscopy Policy in place for parasitological diagnosis of all fever cases but not implemented on any scale Parasitological diagnosis of under fives and over fives Parasitological diagnosis of all malaria cases (under fives and over fives) Parasitological diagnosis of all age groups in health facilities >5s HF without microsc opes RDTs will be introduced in <5 & >5 HF level Targets are for 80 of parasitological diagnosis to be through RDTs, and 20 through microscopy <5 & >5 HF level Targets unlikely to be achieved with unsuccessful round 9 proposal <5s and > 5s HF and commun ity level Namibia <5 & >5 HF level Niger ND ND ND ND Nigeria Parasitological diagnosis of under fives and over fives in health facilities > 5s HF, microsc opy = 20, RDTs = Targets may change - need new PSM plan 29
30 Rwanda Senegal Sierra Leone Somalia South Africa STP Sudan S Sudan N Swaziland Tanzania Togo Uganda Zambia Zimbabwe Zanzibar Parasitological diagnosis of under fives and over fives in health facilities and at community level Parasitological diagnosis of over fives in health facilities and at community level Parasitological diagnosis of over fives and gradual introduction and scale-up in under fives including HMM Parasitological confirmation in health facilities <5s and health >5s facilities and commun ity level >5s HF and commun ity level >5s and introducing under fives HF and commun ity level Microscopy represents 13 (2006) - 25 (2012) of parasitological diagnosis <5s and > HF level 5s ND ND ND ND ND ND awaiting data from MNCP Parasitological diagnosis at health facilities and community level Parasitological diagnosis of over fives in health facilities and at community level Parasitological diagnosis of under fives and over fives in health facilities Parasitological diagnosis at health facility level of under fives and over fives and active case detection Parasitological diagnosis in under fives and over fives in health facilities Parasitological diagnosis of under fives and over fives in health facilities and at community level Parasitological diagnosis in health facilities and at community level Parasitological diagnosis at health facilities and through community case management of under fives and over fives Parasitological diagnosis of under fives and over fives in health facilities and at community level Parasitological diagnosis at health facility level of under fives and over fives in health facilities and private sector <5 and >5 HF and commun ity level >5s only HF and commun ity level Microscopy in higher level health facilities, RDTs in periphery and at community level 20 of the malaria diagnostic needs at hospital level, 40 at PHCU level and 100 at PHCC level will be through RDTs ND ND 70 <5 & >5 HF level Target is to test 70 of all fever cases in health facilities with microscopy or RDTS <5 & >5 HF level Also includes for use in active case detection <5 & >5 HF level Aim to parasitologically diagnose 50 of health facility fever cases 80 <5 & >5 HF and commun ity level ND <5s and > 5s (confirm) HF and commun ity level ND ND ND <5 & >5 HF and commun ity level <5 & >5 HF and commun ity level <5 & >5 HF and private sector 30 of fever cases will be tested using RDTs at community level, 40 in public health facilities (20 through microscopy and 80 through RDTs) and 40 of private sector cases 30
31 Annex 4: Country ACT Estimated Needs (number of treatments) NOTE: this is based on estimated needs based on countries own reports at the time of writing, and does not constitute a forecast Angola 6,467,039 6,648,116 3,473,259 Madagascar 2,378,938 2,452,033 1,225,494 Benin 5,697,929 5,515,071 4,010,503 Malawi 6,700,369 6,893,511 7,201,739 Botswana 17,567 16,406 14,799 Mali 15,728,634 12,372,033 5,390,792 Burkina Faso 8,795,570 5,564,889 3,436,938 Mauritania 459, , ,484 Burundi 1,610,816 1,613,638 1,593,245 Mozambique 8,612,756 6,653,280 5,834,400 C.A.R. 1,946,839 1,995,593 1,425,404 Namibia 82,995 63,433 43,095 Cameroon 4,680,207 5,503,924 5,097,184 Niger 1,500,000 1,500,000 1,500,000 Chad 1,964,911 1,964,911 1,964,911 Nigeria 40,388,920 83,362,730 97,637,542 Comoros 193, , ,394 Rwanda 4,227,918 3,038,569 3,123,665 Congo 4,412,818 6,802,451 6,999,723 Senegal 3,890,147 3,633,461 3,676,172 Cote d'ivoire 11,147,366 8,498,968 6,779,599 Sierra Leone 4,245,063 4,481,291 4,109,315 Djibouti 5,500 5,725 5,153 Somalia 90, , ,000 DRC 11,940,465 14,758,414 19,001,458 South Africa 10,000 10,000 10,000 E. Guinea 214,000 STP 38,236 36,899 35,899 Eritrea 69, , ,584 Sudan S 4,405,006 5,565,423 6,066,051 Ethiopia 15,000,000 15,000,000 15,000,000 Sudan N 5,500,000 4,500,000 3,800,000 Gabon 1,037,366 1,375, ,631 Swaziland 8,450 7,150 4,810 Gambia 543, , ,500 Tanzania 27,872,427 25,726,592 13,870,477 Ghana 13,166,087 17,494,853 15,750,991 Togo 2,846,841 2,948,519 2,740,167 Guinea 5,485,628 3,899,241 3,229,681 Uganda 13,436,138 14,270,756 14,031,721 Guinea Bissau 416, , ,090 Zambia 2,798,786 2,462,932 2,290,527 Kenya 14,260,140 17,132,875 10,122,506 Zimbabwe 1,012,500 1,012, ,024 Liberia 2,319,282 2,918,333 2,918,333 Zanzibar 186, ,711 68, TOTAL 257,599, ,125, ,937,774 31
32 Annex 5: Country ACTs Financed (Number of treatments) NOTE: this is based on estimated finance based on countries own reports at the time of writing, and does not constitute a forecast Country Country Angola 6,396,200 8,105,160 2,731,235 Madagascar 2,378,938 2,452,033 1,225,494 Benin 6,091,604 4,799,133 4,010,498 Malawi 6,360,015 6,534,038 7,201,739 Botswana 17,567 16,406 14,799 Mali 1,582,252 4,985,938 2,181,965 Burkina Faso 7,792,436 3,650,591 2,369,438 Mauritania 496, ,574 32,426 Burundi 1,710,816 1,613,638 1,593,245 Mozambique 8,612,756 6,653,280 5,834,400 C.A.R. 2,974,399 2,600,665 1,425,404 Namibia 82,995 63,433 86,190 Cameroon 4,922,385 5,458,198 6,750,081 Niger 863, ,714 Chad 520, , ,915 Nigeria 47,888,920 83,362,730 78,845,343 Comoros 213, , ,394 Rwanda 4,227,918 3,038,569 3,123,665 Congo 4,419,341 6,802,373 6,999,723 Senegal 2,589,340 2,958,789 3,457,197 Cote d'ivoire 6,439,832 7,749,337 7,340,556 Sierra Leone 1,673, , ,731 Djibouti 6,000 5,837 5,153 Somalia 90, , ,000 DRC 3,618,216 5,192,321 6,968,896 South Africa 10,000 10,000 10,000 E. Guinea 204,000 STP 38,236 36,899 35,899 Eritrea 845, , ,820 sudan S 3,243,154 3,358,519 3,300,122 Ethiopia 15,165,950 9,516,760 10,931,918 Sudan N 6,271,800 2,097,456 3,040,000 Gabon 1,042,935 1,324,124 1,118,714 Swaziland 8,450 7,100 4,810 Gambia 543, , ,500 Tanzania 27,872,427 33,967,505 13,870,477 Ghana 12,315,551 18,948,708 15,800,435 Togo 1,272,669 2,948,519 2,391,544 Guinea 2,931,778 3,899,241 3,229,681 Uganda 19,258,797 13,562,543 13,645,370 Guinea Bissau 374, , ,447 Zambia 5,540,106 8,462,269 1,847,348 Kenya 14,260,140 16,581,362 Zimbabwe 1,125,750 1,012, ,524 Liberia 2,368,423 3,962,440 2,918,333 Zanzibar 193, ,711 68, GRAND TOTAL 236,655, ,053, ,885,939 32
33 Annex 6: Gaps in ACT Treatments Country Country Angola 70, ,025 Madagascar Benin 0 715,938 0 Malawi 340, ,473 0 Botswana Mali 14,146,382 7,386,095 3,208,827 Burkina Faso 1,003,133 2,083,231 1,067,501 Mauritania ,076 Burundi Mozambique C.A.R Namibia Cameroon 0 45,726 0 Niger 636, ,286 1,500,000 Chad 1,443,929 1,263,438 1,100,996 Nigeria ,792,199 Comoros Rwanda Congo Senegal 1,300, , ,715 Cote d'ivoire 4,707, ,631 0 Sierra Leone 2,571,335 3,552,989 3,241,584 Djibouti Somalia DRC 8,322,249 9,566,093 12,032,562 South Africa E. Guinea 0 10,000 0 STP Eritrea sudan S 1,161,852 2,206,904 2,765,929 Ethiopia 0 5,483,240 4,068,082 Sudan N 0 1,630, ,000 Gabon 51,682 0 Swaziland Gambia Tanzania Ghana 850, Togo 1,574, ,623 Guinea 2,553, Uganda 0 708, ,623 Guinea Bissau 41, , ,643 Zambia ,179 Kenya 0 551,513 10,122,506 Zimbabwe Liberia Zanzibar GRAND TOTAL 40,727,272 37,896,526 61,313,082 33
34 Annex 7: Country RDT Estimated Needs NOTE: this is based on estimated needs based on countries own reports at the time of writing, and does not constitute a forecast Country Country Angola 1,877,673 2,000,000 2,000,000 Madagascar 2,165,773 2,023,569 2,052,553 Benin 5,697,929 5,515,071 4,010,503 Malawi 0 4,888,297 4,655,520 Botswana 50,000 50,000 50,000 Mali 1,789,346 5,363,960 9,562,927 Burkina Faso 1,023,195 1,470,246 1,302,197 Mauritania 0 261, ,684 Burundi 192, , ,752 Mozambique 9,261,232 11,839,190 9,503,610 C.A.R. 835, , ,179 Namibia 0 325, ,586 Cameroon 828, ,870 3,664,248 Niger 4,878,491 4,493,345 3,734,238 Chad 2,600,000 2,600,000 2,600,000 Nigeria 4,172,853 6,028,060 11,197,724 Comoros 52, , ,399 Rwanda 584, , ,789 Congo 0 37, ,080 Senegal 2,717,767 2,495,496 2,536,149 Cote d'ivoire 2,880,139 5,210,983 4,910,864 Sierra Leone 1,588,570 3,390,083 3,969,996 Djibouti 11,120 11,453 11,791 Somalia 425, , ,000 DRC 0 13,581,590 17,486,297 South Africa 30,000 30,000 30,000 E. Guinea 0 214,000 0 STP 38,236 36,899 35,899 Eritrea 34,688 71, ,987 Sudan S 1,627,172 1,981,544 2,141,909 Ethiopia 16,226,155 13,868,674 13,187,527 Sudan N 1,537,380 2,306,070 3,074,760 Gabon 118, , ,910 Swaziland 35,086 33,591 30,718 Gambia 425, , ,606 Tanzania 6,985,719 10,792,326 11,109,921 Ghana 3,239,351 4,528,163 5,466,620 Togo 3,947,990 4,060,600 3,761,851 Guinea 1,913,199 3,322,881 3,122,692 Uganda 1,182,038 3,759,939 6,426,381 Guinea Bissau 1,052,227 1,130,313 1,297,670 Zambia 3,970,458 5,029,845 5,308,985 Kenya 7,931,524 7,931,524 10,429,736 Zimbabwe 2,341,310 2,259,832 1,287,738 Liberia Zanzibar 779, , ,150 GRAND TOTAL 97,051, ,592, ,938,157 34
35 Annex 8: Country RDTs Financed NOTE: this is based on estimated finance based on countries own reports at the time of writing, and does not constitute a forecast Country Country Angola 1,200,000 1,600,000 1,000,000 Madagascar 1,690,147 3,272,000 2,636,800 Benin 6,091,604 4,799,133 4,010,498 Malawi 4,888,297 4,655,520 Botswana 50,000 50,000 50,000 Mali 40,000 31,500 Burkina Faso 818,556 1,176,197 1,113,758 Mauritania 60,000 30,000 Burundi 191, , ,752 Mozambique 4,000,000 11,839,190 9,503,610 C.A.R. 835, , ,179 Namibia 325, ,586 Cameroon 828, ,870 3,664,248 Niger 170,125 2,000,000 Chad 542, , ,000 Nigeria 5,880,796 9,425,254 13,077,952 Comoros 52, , ,399 Rwanda 584, , ,789 Congo 0 37, ,080 Senegal 2,717,767 3,120,211 3,049,326 Cote d'ivoire 2,811,861 3,786,326 4,910,864 Sierra Leone 1,376,996 1,201,437 1,036,654 Djibouti 2,480 11,453 11,797 Somalia 419, , ,650 DRC 3,329,702 4,778,290 7,239,833 South Africa 30,000 30,000 30,000 E. Guinea 0 204,000 0 STP 38,236 36,899 35,899 Eritrea 445, , ,519 sudan S 867, , ,395 Ethiopia 15,144,080 10,678,115 13,187,527 Sudan N 1,537,380 2,306,070 3,074,760 Gabon 33,539 41,925 58,693 Swaziland 35,086 33,591 30,718 Gambia 250, , ,606 Tanzania 6,985,718 10,792,326 11,109,921 Ghana 3,439,351 5,128,163 5,466,620 Togo 700,000 4,060,600 3,245,471 Guinea 340, , ,343 Uganda 2,779,116 1,365,016 Guinea Bissau 124,505 1,034,269 1,189,408 Zambia 1,980,537 5,050,903 2,027,661 Kenya 256, , ,000 Zimbabwe 2,341,310 2,259,832 1,287,738 Liberia 1,762,581 1,750,000 0 Zanzibar 779, , ,150 GRAND TOTAL 73,507, ,502, ,219,735 35
36 Annex 9: Gaps in the Number of RDTs Country Country Angola 677, ,000 1,000,000 Madagascar 475, Benin 0 715,938 1 Malawi Botswana Mali 1,729,346 5,332,460 9,562,927 Burkina Faso 204, , ,439 Mauritania 0 201, ,684 Burun Mozambique 5,261, C.A.R Namibia Cameroon Niger 4,708,366 2,493,345 3,734,238 Chad 2,058,000 1,837,500 1,666,000 Nigeria (1,707,943) (3,397,194) (1,880,228) Comoros Rwanda Congo Senegal Cote d'ivoire 68,278 1,424,657 0 Sierra Leone 125,824 1,030,134 2,589,704 Djibouti Somalia 5,950 6,650 7,350 DRC 0 8,803,300 10,246,464 South Africa E. Guinea 0 10,000 0STP Eritrea Sudan S 759,513 1,096,167 1,248,514 Ethiopia 1,082,075 3,190,559 0 Sudan N Gabon 85, , ,217 Swaziland Gambia 175, Tanzania Ghana Togo 3,247, ,380 Guinea 1,573,048 2,723,437 2,198,349 Uganda 0 797, ,380 Guinea Bissau 927,722 96, ,262 Zambia 1,989, ,281,324 Kenya 7,675,524 7,431,524 10,119,736 Zimbabwe Liberia Zanzibar GRAND TOTAL
37 Annex 10: Country Identified Bottlenecks in Scaling-Up Bottleneck Insufficient funds Delays in disbursements of funds Procurement delays and weak supply chain Details Lack of funds to support scaling-up to achieve universal coverage Delayed disbursement of funds Limited number of commodities available globally for procurement Weaknesses in commodity quantification, forecasting and tracking consumption of commodities Lengthy and bureaucratic procurement procedures Weak supply management systems including weak human resources, infrastructure and logistics support including transportation. Weak inventory management capacity Uncoordinated supply chain management systems creating interruptions in supply of medicines and supplies. Lack of a robust drug logistics management information system to direct the distribution of medicines and supplies from the central to lower levels. Timely distribution of medicines and supplies is hampered by poor road infrastructure. Storage infrastructure is inadequate. Drug regulatory and quality assurance mechanisms are weak. Lack of sufficient qualified staff Weak or none-existent pharmacovigilance system Stock outs Identified by Benin, Burundi, Botswana, Cameroon, Comoros, DRC, Djibouti, Ethiopia, Equatorial Guinea, Gabon, Gambia, Guinea, Guinea Bissau, Kenya, Nigeria, Mali, Mauritania, Namibia, Uganda, Zambia, Togo, Senegal, STP, Sudan, Tanzania, Sierra Leone, Niger Benin, Burkina Faso, Chad, CAR, Comoros, Congo, Djibouti, Ethiopia, Equatorial Guinea, Guinea, Ghana, Kenya, Liberia, Niger, Malawi, Zimbabwe, Zanzibar, Zambia, Uganda, Tanzania, Senegal, Rwanda, Niger, Madagascar, Mozambique, STP, Sierra Leone, Swaziland, Togo, Sudan N Ethiopia, Benin, Chad, Congo, Djibouti, Gambia, Ghana, Guinea Bissau, Kenya, Zimbabwe, Zambia, Uganda, Tanzania, STP, s Sudan, Sierra Leone, Senegal, Rwanda, Niger, Namibia, Liberia, Malawi, Mauritania, Ethiopia, Madagascar, Rwanda, Eritrea, Sudan N 37
38 Weak Health Management Information Systems Laboratory diagnosis through microscopy and RDTs needs urgent strengthening through equipment and training Lack of communication infrastructure and data processing facilities Feedback to collecting facilities, particularly from the district level is poor. Capacity for data analysis at all levels is weak. Systems for collecting administrative data on finances and human resources are not well established. Human resources are inadequately skilled in all steps of the information cycle and capacity to use routine information in planning and performance appraisal is low. Systems for capturing data from the private sector and community-based services are weak. Resources for supporting HIS plan are inadequate, resulting in non-implementation of planned activities. Key posts in M&E at all levels remain unfilled either due to lack of funding or lack of suitable candidates. Training programs have not yet reached the level where all the partners and stakeholders are able to process data and information in a timely and uniform manner. Over dependence on information through surveys resulting in a lack of timely information, analysis and adjustments to strategies. Over-reliance on parallel data collection by the malaria programme due to a lack of confidence in routine reporting through the HMIS. Limited dissemination of malaria monitoring information across programmes and down through the health pyramid resulting in limited evidence-based decision making. Limited monitoring of community based malaria prevention and treatment and weak reporting on partner activities and from the private sector. Limited staff training, high health facility workloads, poor systems to allow for transmission of data. Updating HMIS to capture new information requirements from programs such as consumption data of ACTs and use of RDTs. Incomplete and delayed reporting, partly as a result of inadequate numbers of human and financial resources at subnational levels Shortage of Laboratory Technicians in public health facilities Weak capacity of existing laboratory workers Inadequate laboratory equipment and supplies including microscopy and RDTs Lack of a comprehensive quality assurance and control system especially for RDTs Lack of parasitological diagnosis resulting in over use of ACTs for non malaria fevers. Even when parasitological diagnosis is available, there is poor compliance by health workers with the results. Cameroon, Cote d ivoire, Gambia, Ghana, Equatorial Guinea, Ethiopia, Madagascar, Mauritania, Nigeria. Zimbabwe, Zanzibar, Zambia, Uganda Tanzania, Swaziland, s Sudan, Sierra Leone Senegal, Kenya, Somalia, N Sudan, Angola, Benin, Burkina Faso, Cote D ivoire, Ghana, Gambia, Mali, Madagascar, Zimbabwe, Zanzibar Togo, Tanzania, Niger, Swaziland, s Sudan 38
39 Bottleneck Details Poor record keeping RDTs are not used in the private sector. Review of diagnostics policy in the under fives Identified by Weak Human resource capacity and health system weaknesses Weak Private sector linkages Behavioral change communication The development of parallel support systems and intervention strategies for priority programmes leaving mainstream systems and strategies undersubscribed and unsupported including use of parallel monitoring, communication/iec, quality assurance, planning and procurement. Inadequate human resources for health and high HR turnover Limited support supervision system, which makes it difficult to ensure high quality implementation of interventions, identify constraints and institute timely corrective actions. Inadequate transport affects health care delivery, supervision and referral of patients Inadequate training of health workers and laboratory technicians particularly at community level. Policy linkages between the private and public sector are inadequate and the majority of private practitioners receive no orientation/training on malaria policy nor do they have consistent supplies of ACTs. Private sector continues to stock and use monotherapies. Where ACTs are available, prices are prohibitively expensive at US$5-15 per adult dose. Weak engagement of the private sector: Poor public health services have led to the increased use of the private sector however wide disparities exist in the quality of services provided by this sector. Inadequate interpersonal communication between health workers and the communities has led to slow uptake and misconceptions of malaria control interventions. Communities are insufficiently informed on malaria control Benin, Burkina Faso, CAR, Equitorial Guinea, Burundi, Comoros, Gabon, Tanzania, Kenya, STP, Zimbabwe, Liberia, Rwanda, Zambia, Nigeria, Mauritania, Sierra Leone, Zanzibar, Uganda, Togo, Somalia, Sudan N, Gambia, Guinea Bissau, Madagascar, Cote d ivoire Benin, Ghana, Guinea, Sudan, Sierra Leone, Niger, Zanzibar CAR, Gambia, Togo, STP, Mali, Madagascar, Sierra Leone, Zanzibar, Uganda, Swaziland, s Sudan, N Sudan, Zambia 39
40 Annex 11: Key Indicators for Malaria Treatment and Diagnosis Key Indicators Suggested by This Report Indicator Used by COMMENT Proportion of health facilities with no reported stockouts of nationally recommended antimalarial drugs lasting more than 1 week at any time during the past 3 months (number and ) (MAL-T4) RBM, GFATM, WHO, PMI Health facility stock outs through HMIS. Raises flag on national or international supply chain problems for Number and of rural / urban outlets with no reported stock outs of nationally recommended antimalarial drugs, lasting more than one week, at any time, during the last 3 months People with fever receiving antimalarial treatment according to national policy (specify artemisininbased combination therapy versus other therapy) (potentially disaggregated by age and provider) Number of (confirmed) malaria cases seen by health workers (in facilities and/or outreach) by age group AMFm (1 month), ACTWatch, WHO RBM, GFATM (top ten indicator), WHO, PMI, AMFm, ACT watch RBM, GFATM (top ten indicator), WHO, Approximations AMFm, ACT watch, PMI further investigation. Private sector stock outs through monitoring of AMFm and ACT watch - Raises flag on national or international supply chain problems for further investigation. HMIS. Tracking this indicator would allow monitoring of the actual number of treatments (if HMIS is sufficiently reliable) against quantifications in databases - and allows quantification data to be revisited and revised. Question is this necessary on a quarterly basis? HMIS (tracking parasitological diagnosis and verifying if these match quantifications) Children younger than 5 years of age (or other target age groups) presenting to a health worker with parasitologically documented malaria infection) who received artemisinin-based combination therapy/ Percentage of positive RDTs in patients under age 5 that were treated with an ACT/ Percentage of positive RDTs in patients over age 5 that were treated with an ACT Children younger than 5 years of age (or other target age groups) with fever (or preferably with documented malaria infection) who received antimalarial treatment through home-based management (percentage) (MAL-T10) Number of RDTs procured (quarterly) against annual number to be procured Number of ACTs procured (quarterly) against annual number to be procured RBM, GFATM, PMI, WHO RBM GFATM (PMI number of RDTs purchased with USG funds) (PMI number of ACTs purchased with USG funds) AMFm (quantity of ACTs procured by first line buyers) HMIS HMM (verify if HMM roll out is on track) Numbers procured against targets raises flag of stockout potential or slower than forecasted scale-up Numbers procured against targets - raises flag of stock-out potential or slower than forecasted scaleup 40
.")
41 GFATM/RBM The Monitoring and Evaluation Toolkit Part 2: Tools for monitoring programs for malaria (GFATM, 2009) summarises key output, outcome and impact indicators for malaria (See tables below for recommended indicators relating to diagnosis and treatment). Recommended Output Indicators for consideration by NMCPs 41
")
42 Recommended Outcome indicators for Consideration by NMCPs Amongst the top 10 indicators for routine reporting, the GFATM reports the following indicator in the area of malaria case management: Number of people with fever receiving antimalarial treatment according to national policy (specify artemisinin-based combination therapy versus other therapy) 42
 Malaria-specific mortality: proportion of deaths attributed to malaria among children younger than five years of age (or")
43 Recommended Impact indicators for Consideration by NMCPs Amongst the top ten indicators for medium-term outcome and impact, the GFATM reports the following relating to malaria: All-cause mortality rate among children younger than five years of age (areas of high endemicity) Malaria-specific mortality: proportion of deaths attributed to malaria among children younger than five years of age (or other target groups) (areas of low endemicity) Number of (confirmed) malaria cases seen by health workers (in facilities and/or outreach) (high endemicity) Annual parasite index (low endemicity) Slide-positive or rapid diagnostic test positive rate (low endemicity) 43
44 RBM Road Map Indicators Population at Risk Need - LLINs (nbr); ACTs (treatments); RDTs (nbr tests); IPT (nbr of women to treat); IRS (HH); IRS ($); M&E ($); BCC/IEC ($); Human Resources ($); Other ($) Commodities already covered and distributed Needs already financed Needs already covered of needs covered Total needs covered of the population covered Proportion of the population covered by 2010 ALMA Quarterly Bulletin Gap of LLIN yet to be funded for universal coverage by end 2010 (in millions) Financing gaps Financing LLIN ACT RDT IRS No. LLIN distributed already to reach universal coverage (UC) n $USD n (mil) Financing gap, as of Jan 2010 Financing gap, as of Jan 2010 Financing gap, as of July 2009 National govt funding govt expenditure for health, 2006 Partner funding Disbursements (2007, mil) Commitments (2009, mil) Coverage and logistics ITN coverage (), as of 2008 ACT RDT IRS ITN ownership, all ages (assuming 1 ITN covers 2 persons) ITN use all ages ITN use, <5 years ACT, national stock, 2010 RDT, national stock 2010 IRS, of population protected, Impact and quality of HMIS Impact from HMIS or model HMIS quality Economic impact Reduction in malaria deaths, children <5y (), 2008 Quality of HMIS to measure malaria reduction Cost savings by health system,
45 PMI: End Use Malaria Case Management Indicators In countries where RDTs are being used for diagnosis: 1. Percentage that malaria cases comprise of the total patient population examined 2. Total number of malaria cases under age 5 3. Total number of malaria cases over age 5 4. Percentage of malaria cases under age 5 treated with an ACT 5. Percentage of malaria cases over age 5 treated with an ACT 6. Total number of malaria cases diagnosed clinically (not using RDTs or microscopy) 7. Total number of RDTs used (positive and negative) 8. Total number of positive RDTs in patients under age 5 9. Total number of positive RDTs in patients over age Percentage of positive RDTs in patients under age 5 that were treated with an ACT 11. Percentage of positive RDTs in patients over age 5 that were treated with an ACT 12. Total number of negative RDTs in patients under age Total number of negative RDTs in patients over age Percentage of negative RDTs under age 5 that were treated with an antibiotic 15. Percentage of negative RDTs over age 5 that were treated with an antibiotic In countries where RDTs are not being used for diagnosis: 1. Percentage that malaria cases comprise of the total patient population examined 2. Total number of malaria cases under age 5 3. Total number of malaria cases over age 5 4. Total number of malaria cases diagnosed clinically (not using RDTs or microscopy) 5. Percentage of malaria cases under age 5 treated with only an ACT 6. Percentage of malaria cases over age 5 treated with only an ACT 7. Percentage of malaria cases under age 5 treated with an ACT and an antibiotic 8. Percentage of malaria cases over age 5 treated with an ACT and an antibiotic Additional considerations: 1. Total number of diagnosed malaria cases that went untreated 2. Total number of malaria cases treated with a monotherapy 3. Total number of severe malaria cases 4. Percentage of malaria diagnoses treated with quinine tabs 5. Percentage of malaria diagnoses treated with quinine injections 6. Percentage of malaria diagnoses treated with SP (not for IPTp) 45
46 PMI End-Use Supply Chain Indicators 1. of facilities that have unexpired product on the day of the supervisory visit 2. Percentage of facilities with stock outs of X on the day of the supervisory visit 3. Percentage of facilities with expired product on the day of the supervisory visit 4. The percentage of facilities experiencing stock outs of X for three days or more in the previous three months 5. Index of availability of ACTs for uncomplicated malaria present at the facility on the day of the supervisory visit 6. Percentage of facilities with at least one person trained in X [create a separate fraction for each area of training identified in questions 113, 5, 7, 9, 11 of the facility questionnaire] 7. Percentage of staff working in X that have been trained in X at each level of the supply chain [create a separate fraction for each area of training identified in questions 3, 5, 7, 9, 11 of the facility questionnaire] 8. Percentage of facilities receiving supervision for logistics/inventory management during the previous six months 9. Percentage of facilities receiving supervision for malaria case management during the previous six months 10. Percentage of facilities with appropriate/acceptable storage conditions on the day of the visit for those facilities with smaller storage areas, answering only questions 1 13 of Form Percentage of facilities with appropriate/acceptable storage conditions on the day of the visit for those facilities with larger storage areas, answering all of the questions in Form Percentage of facilities with up-to-date stock cards 13. of facilities with SOPs for management of malaria medicines & supplies 14. Percentage of facilities with reference guidelines for malaria case management 15. Order Fill Rate: For facilities that order stock, the percent difference between quantity ordered and quantity received in the last three months 16. Percent difference between calculated quantity and physical inventory on day of visit by facility 17. Reporting Rates: Percentage of facilities submitting stock reports to higher level in accordance with the established timeframe 46
47 ACT Watch Proportion of outlets that had antimalarials in stock at the time of survey visit. Proportion of outlets that had non-artemisinin monotherapy or non-artemisinin combination therapy in stock at the time of survey visit. Proportion of outlets that had artemisinin monotherapy in stock at the time of survey visit. Proportion of outlets that had ACTs in stock at the time of survey visit, categorized as WHO/UNICEF-approved; nationally-registered or Non-WHO/UNICEF/nationally registered Proportion of outlets that had ACTs in stock at the time of survey visit. Proportion of outlets reporting no disruption in stock of antimalarials in the last three months; Proportion of outlets with expired stock of ACTs. Proportion of the population living in areas that achieve coverage standards of availability for a full course of an adult treatment of ACT. Proportion of the population that has access to WHO/UNICEF approved ACT Proportion of population living in areas that achieve coverage standards of availability for a full course of a child treatement of ACT Median cost of full course of an adult treatment of ACT. Median cost of full course of an adult treatment of ACT, categorized as: categorized as WHO/UNICEF-approved; nationally-registered or Non-WHO/UNICEF/nationally registered Cumulative percentage mark up between retail median price of a full course of an adult treatment of ACT and terminal wholesaler s median price. The proportion of children under five with fever in the past 2 weeks receiving antimalarial treatment by type of drug The proportion of children under five with fever in the past 2 weeks who received antimalarial treatment within 24 and 48 hours of fever onset The proportion of children under five with fever in the past 2 weeks who received antimalarial treatment within 24 and 48 hours of fever onset Proportion of people over five with fever in the past 2 weeks taking antimalarials who adhered to the full treatment dose. Proportion of people over five with fever in the past 2 weeks taking antimalarials who adhered to the full treatment dose. Proportion of people over five with fever in the past 2 weeks taking antimalarials who adhered to the full treatment dose. The proportion of all people over five with fever treated with an antimalarial (categorized as WHO/UNICEF registered ACT; Nationally registered ACT; Nonartemisinin monotherapy; Artemisinin monotherapy) The proportion of confirmed malaria cases among people over five with fever in the past 2 who received antimalarials within 24 and 48 hours of fever onset The proportion of all people over five with fever treated with an antimalarial (categorized as WHO/UNICEF registered ACT; Nationally registered ACT; Nonartemisinin monotherapy; Artemisinin monotherapy) Total volume of ACTs sold or distributed in the last week as a proportion of the total volume of all antimalarials sold or distributed in the last week. 47
48 AMFm Proportion of outlets in rural /urban areas that have any anti-malarials in stock at the time of survey visit Proportion of outlets in rural /urban areas that have non-artemisinin monotherapy or nonartemisinin combination therapy in stock at the time of survey visit Proportion of outlets in rural /urban areas that have artemisinin monotherapy in stock at the time of survey visit Proportion of outlets in rural / urban areas that have non-quality assured ACTs in stock at the time of survey visit Proportion of outlets in rural / urban areas that have quality assured ACTs in stock at the time of survey visit Number and percentage of rural / urban outlets with no reported stock outs of nationally recommended anti-malarial drugs, lasting more than one week, at any time, during the last 1 month Proportion of the rural /urban population living in areas that have access to a full course of an adult treatment with a quality assured ACT Proportion of the rural / urban population living in areas that have access to a full course of a child treatment with a quality assured ACT Median cost to patients, of a full course of treatment (adult/child) with quality assured ACTs, in rural /urban outlets Median cost to patients, of a full course of treatment (adult/child) with non-quality assured ACTs, in rural /urban outlets Median cost to patients of a full course of treatment (adult/child) with artemisinin monotherapy, in rural / urban outlets Median cost to patients of a full course of treatment (adult/child) with other anti-malarials (CQ, SP) in rural / urban outlets Cumulative percentage mark up between retail median price of a full treatment course with quality assured ACTs (adults) and wholesaler median price Proportion of children (by age band), with fever in the past 2 weeks who received ACT treatment, by source of provider Proportion of children (by age band), with fever in the past 2 weeks who received ACT treatment within 24 hours of fever onset, by source of provider Proportion of children (by age band), with fever in the past 2 weeks who received any antimalarial treatment, by source of provider Proportion of adults (>15 years) with fever in the past 2 weeks who received ACT, by source of provider Proportion of adults (>15 years), with fever in the past 2 weeks who received ACT within 24 hours of fever onset, by source of provider Proportion of adults (>15 years) with fever in the past 2 weeks treated with any antimalarial, by source of provider Proportion of households in poor areas with one or more inhabitants with fever in the past 2 weeks treated with ACTs, by source of provider Proportion of households in poor areas with one or more inhabitants with fever in the past 2 weeks who received ACT treatment within 24 hours of fever onset, by source of provider Proportion of households in poor areas with one or more inhabitants, with fever in the past 2 weeks treated with any anti-malarial, by source of provider Total volume of ACTs sold or distributed in the last week, as a proportion of the total volume of all anti-malarials sold or distributed in the last week, via outlets across sectors in rural /urban areas (by quality assured product) Quantity of ACT procured by first-line buyers ( unit = boxes of ACTs by type and dosage) 48

49 WHO Checklist for National Monitoring and Evaluation Plans Key impact, outcome and output indicators 49


50 WHO Indicators (World Malaria Report, 2009) 50
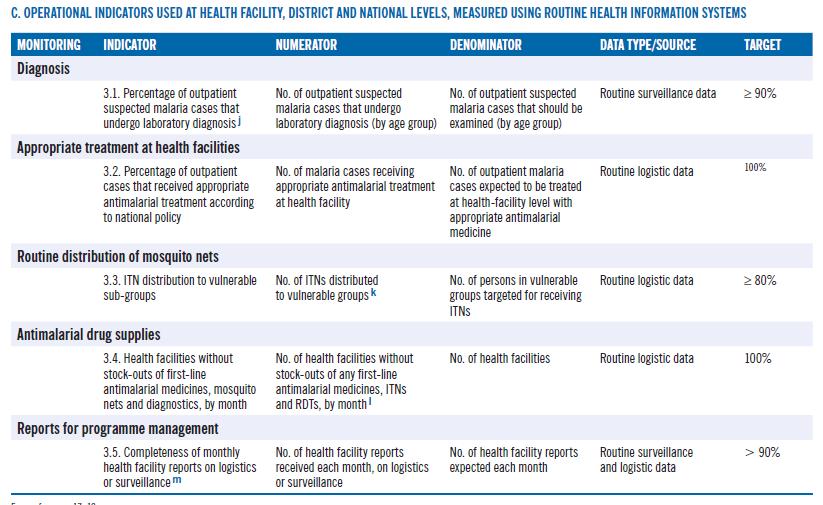
51 51
Malaria Funding. Richard W. Steketee MACEPA, PATH. April World Malaria Day 2010, Seattle WA
 Malaria Funding Richard W. Steketee MACEPA, PATH April World Malaria Day 2010, Seattle WA Malaria Funding Is there a plan? Is there money? Where does the money come from? Is the money moving efficiently?
The Challenge of Malaria
 The Challenge of Malaria Prof. Awa-Marie Coll-Seck Executive Director of RBM Partnership Donors Forum (co-organized by MMV & CRESIB) Barcelona, 15 March 2010 A DECADE OF ROLLING BACK MALARIA: WHERE ARE
PROGRESS REPORT ON THE ROAD MAP FOR ACCELERATING THE ATTAINMENT OF THE MILLENNIUM DEVELOPMENT GOALS RELATED TO MATERNAL AND NEWBORN HEALTH IN AFRICA
 5 July 2011 REGIONAL COMMITTEE FOR AFRICA ORIGINAL: ENGLISH Sixty-first session Yamoussoukro, Côte d Ivoire, 29 August 2 September 2011 Provisional agenda item 17.1 PROGRESS REPORT ON THE ROAD MAP FOR
Fighting Harder and Smarter Against Malaria. Dr.Bernard Nahlen Deputy US Global Malaria Coordinator University of Georgia, February 23, 2010
 Fighting Harder and Smarter Against Malaria Dr.Bernard Nahlen Deputy US Global Malaria Coordinator University of Georgia, February 23, 2010 Outline Burden of malaria Global support for rolling back malaria
Aboubacar Kampo Chief of Health UNICEF Nigeria
 Aboubacar Kampo Chief of Health UNICEF Nigeria Many thanks to UNICEF colleagues in Supply Division-Copenhagen and NY for contributing to this presentation Thirty-five countries are responsible for 98%
What is this document and who is it for?
 Measles and Rubella Initiative s Standard Operating Procedures for Accessing Support for Measles and Rubella Supplementary Immunization Activities During 2016 In the context of measles and rubella elimination
Pneumococcal Conjugate Vaccine: Current Supply & Demand Outlook. UNICEF Supply Division
 Pneumococcal Conjugate Vaccine: Current Supply & Demand Outlook UNICEF Supply Division Update: October 2013 0 Pneumococcal Conjugate Vaccine (PCV) Supply & Demand Outlook October 2013 Update Key updates
Global Malaria Initiative
 Global Malaria Initiative Appeal No. MAA00031 21/04/2009 This report covers the period 01/01/2008 to 31/12/2008. Volunteers from the Madagascar Red Cross participate in malaria behaviour change communication
Health systems and HIV: advocacy. Interagency Coalition on AIDS and Development
 Health systems and HIV: Priorities for civil society advocacy Michelle Munro Interagency Coalition on AIDS and Development 1 Overview GTAG, civil society and health systems advocacy Health systems and
STATUS REPORT ON MALARIA
 AFRICAN UNION UNION AFRICAINE UNIÃO AFRICANA Addis Ababa, ETHIOPIA P. O. Box 3243 Telephone +251115-517700 Fax : +251115-517844 Website : www.africa-union.org ASSEMBLY OF THE AFRICAN UNION Eleventh Ordinary
Status Report on WSS MDG Roadmaps and Country Status Overviews WSP Africa
 Status Report on WSS MDG Roadmaps and Country Status Overviews WSP Africa Ede Ijjasz Global Manager Water and Sanitation Program World Water Forum, Mexico, March 18, 2006 Outline 1. The Water Supply and
IMMUNIZATION VACCINES & EMERGENCIES
 No report No data No data IMMUNIZATION VACCINES & EMERGENCIES ROUTINE IMMUNIZATION PERFORMANCE IN THE AFRICAN REGION October 2013 issue Number of children vaccinated with the 3 rd dose of DTPcontaining
PROGRESS REPORT ON CHILD SURVIVAL: A STRATEGY FOR THE AFRICAN REGION. Information Document CONTENTS
 29 June 2009 REGIONAL COMMITTEE FOR AFRICA ORIGINAL: ENGLISH Fifty-ninth session Kigali, Republic of Rwanda, 31 August 4 September 2009 Provisional agenda item 9.2 PROGRESS REPORT ON CHILD SURVIVAL: A
1) SO1: We would like to suggest that the indicator used to measure vaccine hesitancy be DTP 1 to measles first dose dropout.
 SO1: We would like to suggest that the indicator used to measure vaccine hesitancy be DTP 1 to measles first dose dropout.") To SAGE Secretariat, WHO Dear Professor Helen Rees, Dear Dr. Jean Marie Okwo-Bele, On behalf of the Civil Society Constituency of the GAVI Alliance, we would like to thank SAGE and its members for the
To SAGE Secretariat, WHO Dear Professor Helen Rees, Dear Dr. Jean Marie Okwo-Bele, On behalf of the Civil Society Constituency of the GAVI Alliance, we would like to thank SAGE and its members for the
AIDS in Africa. An Update. Basil Reekie
 AIDS in Africa An Update Basil Reekie Contents General Statistics The trend of HIV in Africa Ugandan experience UNAIDS 2006 Latest African Statistics by Country HIV Intervention Light at the end of the
Progress has been made with respect to health conditions.
 health Strong performers in reducing child mortality 199-2 Niger Guinea-Bissau Guinea Ethiopia Benin 2 199 Strong performers in reducing maternal mortality 199-2 Djibouti Madagascar Eritrea Comoros Somalia
IMMUNIZATION & VACCINE PREVENTABLE DISEASES
 IMMUNIZATION & VACCINE PREVENTABLE DISEASES MONTHLY IMMUNIZATION UPDATE IN THE AFRICAN REGION July-August 2015 (Vol 3, issue N 6 ) Special issue on WHO/UNICEF Estimates of National Immunization Coverage
HIV DIAGNOSTIC TESTS IN LOW- AND MIDDLE-INCOME COUNTRIES: FORECASTS OF GLOBAL DEMAND FOR
 HIV DIAGNOSTIC TESTS IN LOW- AND MIDDLE-INCOME COUNTRIES: FORECASTS OF GLOBAL DEMAND FOR 2015 2020 Presented by Vincent Habiyambere (WHO), Biyi Adesina (Avenir Health) and Meghan Wareham (CHAI) on behalf
GABON. Neglected tropical disease treatment report profile for mass treatment of NTDs
 GABON Neglected tropical disease treatment report 2017 1 2017 profile for mass treatment of NTDs NEGLECTED TROPICAL DISEASES Neglected tropical diseases (NTDs) are a group of preventable and treatable
Summary World Malaria Report 2010
 Summary The summarizes information received from 106 malaria-endemic countries and other partners and updates the analyses presented in the 2009 Report. It highlights continued progress made towards meeting
Funding for AIDS: The World Bank s Role. Yolanda Tayler, WB Bi-regional Workshop for the Procurement of ARVs Phnom Penh, Cambodia
 Funding for AIDS: The World Bank s Role Yolanda Tayler, WB Bi-regional Workshop for the Procurement of ARVs Phnom Penh, Cambodia Outline New resources needs estimates Bridging the gap Global overview of
Common EQA Mistakes - A provider Perspective. Experience from East African Regional External Quality Assessment Scheme (EA-REQAS)
") Common EQA Mistakes - A provider Perspective Experience from East African Regional External Quality Assessment Scheme (EA-REQAS) Overview of Amref Health Africa Leading health development INGO in Africa
Common EQA Mistakes - A provider Perspective Experience from East African Regional External Quality Assessment Scheme (EA-REQAS) Overview of Amref Health Africa Leading health development INGO in Africa
Scaling Up Nutrition Action for Africa
 Scaling Up Nutrition Action for Africa Where are we and what challenges are need to be addressed to accelerate malnutrition? Lawrence Haddad Global Alliance for Improved Nutrition Why should African political
Addressing Malaria in Pregnancy: A Comprehensive Approach to Maternal and Newborn Health Outcomes
 Addressing Malaria in Pregnancy: A Comprehensive Approach to Maternal and Newborn Health Outcomes Malaria is a major public health crisis, especially in sub-saharan Africa, where 90% of all malaria-related
TURNING POINT FOR AFRICA AN HISTORIC OPPORTUNITY TO END AIDS AS A PUBLIC HEALTH THREAT BY 2030 AND LAUNCH A NEW ERA OF SUSTAINABILITY
 TURNING POINT FOR AFRICA AN HISTORIC OPPORTUNITY TO END AIDS AS A PUBLIC HEALTH THREAT BY 2030 AND LAUNCH A NEW ERA OF SUSTAINABILITY UNAIDS 2018 II KEY MESSAGES 1 Ending the AIDS epidemic in Africa is
UNAIDS 2013 AIDS by the numbers
 UNAIDS 2013 AIDS by the numbers 33 % decrease in new HIV infections since 2001 29 % decrease in AIDS-related deaths (adults and children) since 2005 52 % decrease in new HIV infections in children since
UNITAID. Dr Philippe Duneton Deputy Executive Director Copenhagen September 2012
 UNITAID Dr Philippe Duneton Deputy Executive Director Copenhagen September 2012 Challenges Achievements WHO Prequalification UNITAID support for prequalification of medicines Since 2007 UNITAID support
Prioritizing Emergency Polio Eradication Activities
 Prioritizing Emergency Polio Eradication Activities Managing the Financing Gap the other half of the Emergency Hamid Jafari GPEI Financing 2012-13: Budget = $2.23 b - Confirmed contributions = $1.14 b
ASLM Anti-microbial Resistance in Africa and Global Health Security. 9TH INTEREST WORKSHOP May 2015 Harare
 ASLM Anti-microbial Resistance in Africa and Global Health Security 9TH INTEREST WORKSHOP 2015 8 May 2015 Harare Recent Jim O Neil Report commissioned by the UK government predicts dire consequences of
Booster Program for Malaria Control in Africa. One Year Later: Progress and Challenges
 Public Disclosure Authorized Public Disclosure Authorized Public Disclosure Authorized Public Disclosure Authorized Booster Program for Malaria Control in Africa One Year Later: Progress and Challenges
COLD CHAIN EQUIPMENT OPTIMISATION PLATFORM (CCEOP)
") COLD CHAIN EQUIPMENT OPTIMISATION PLATFORM (CCEOP) Sushila Maharjan Senior Manager, Innovative Finance International Conference on Sustainable Cooling World Bank Washington DC - 29 November 2018 Reach
COLD CHAIN EQUIPMENT OPTIMISATION PLATFORM (CCEOP) Sushila Maharjan Senior Manager, Innovative Finance International Conference on Sustainable Cooling World Bank Washington DC - 29 November 2018 Reach
Ouagadougou Declaration
 Ouagadougou Declaration on Primary Health Care and Health Systems in Africa: Achieving Better Health for Africa in the New Millennium A declaration by the Members States of the WHO African Region 30 April
Optimizing Quality of Life through Palliative Care for Adults and Children affected by Cancer
 Optimizing Quality of Life through Palliative Care for Adults and Children affected by Cancer The Public Health need for Palliative Care for Adults and Children with Cancer Dr Emmanuel Luyirika 105M-T3
Annex 2 A. Regional profile: West Africa
 Annex 2 A. Regional profile: West Africa 355 million people at risk for malaria in 215 297 million at high risk A. Parasite prevalence, 215 Funding for malaria increased from US$ 233 million to US$ 262
CANCER OF THE CERVIX IN THE AFRICAN REGION: CURRENT SITUATION AND WAY FORWARD
 23 June 2010 REGIONAL COMMITTEE FOR AFRICA ORIGINAL: FRENCH Sixtieth session Malabo, Equatorial Guinea, 30 August 3 September 2010 Provisional agenda item 7.4 CANCER OF THE CERVIX IN THE AFRICAN REGION:
Rotavirus Vaccine: Supply & Demand Update. UNICEF Supply Division
 Rotavirus Vaccine: & Demand Update UNICEF Division July 0 Rotavirus Vaccine (RV): & Demand Update July This update provides new information on countries and their scheduled RV introductions, forecasted
MEASLES ELIMINATION BY 2020: A STRATEGY FOR THE AFRICAN REGION. Report of the Secretariat. Executive Summary
 16 June 2011 REGIONAL COMMITTEE FOR AFRICA ORIGINAL: ENGLISH Sixty-first session Yamoussoukro, Côte d Ivoire, 29 August 2 September 2011 Provisional agenda item 13 MEASLES ELIMINATION BY 2020: A STRATEGY
Sourcing of ARVs & HIV diagnostics. Procurement for Impact P4i
 Sourcing of ARVs & HIV diagnostics Procurement for Impact P4i AMDS ANNUAL STAKEHOLDERS AND PARTNERS MEETING 29 September 2014 Global Fund: Procurement for Impact: P4i Our objective was straightforward:
POLIOMYELITIS ERADICATION: PROGRESS REPORT. Information Document CONTENTS BACKGROUND PROGRESS MADE NEXT STEPS... 12
 5 August 9 REGIONAL COMMITTEE FOR AFRICA ORIGINAL: ENGLISH Fifty-ninth session Kigali, Republic of Rwanda, August 4 September 9 POLIOMYELITIS ERADICATION: PROGRESS REPORT Information Document CONTENTS
WHO Consultation on universal access to core malaria interventions in high burden countries: main conclusions and recommendations
 WHO Consultation on universal access to core malaria interventions in high burden countries: main conclusions and recommendations 12-15 February 2018 Salle XI, ILO Building, Geneva, Switzerland Country
HPV Vaccine Lessons Learned & New Ways Forward
 HPV Vaccine Lessons Learned & New Ways Forward The Gavi Alliance June 2016, Geneva www.gavi.org Overview 1 Background 2 Lessons learned 3 New Way Forward 2 1 Background 3 HPV Background HPV is responsible
Towards an Atlas of Human Helminth Infection in sub-saharan Africa: The Use of Geographical Information Systems (GIS)
") Towards an Atlas of Human Helminth Infection in sub-saharan Africa: The Use of Geographical Information Systems (GIS) S. Brooker, M. Rowlands, L. Haller, L. Savioli and D.A.P. Bundy * *Ndir, O. et al.
Towards an Atlas of Human Helminth Infection in sub-saharan Africa: The Use of Geographical Information Systems (GIS) S. Brooker, M. Rowlands, L. Haller, L. Savioli and D.A.P. Bundy * *Ndir, O. et al.
Yellow fever Vaccine investment strategy
 Yellow fever Vaccine investment strategy Background document #5 November 2013 Executive summary Since 2001, GAVI has spent ~$250M on yellow fever control $102M on routine vaccination in 17 countries ~$160M
TFI Proceedings, Recommendations and implications for 2005
 January 2005 N 053 TFI 2004 - Proceedings, Recommendations and implications for 2005 The 12th meeting of the Task Force on Immunization (TFI) in Africa and the 11th meeting of the Africa Regional Inter-
Expert Group Meeting on the Regional Report for the African Gender and Development Index
 Expert Group Meeting on the Regional Report for the African Gender and Development Index 9-10 October 2017 United Nations Conference Centre, Addis Ababa, Ethiopia Aide Memoire July 2017 I. Background and
Presentation by Dr Philippe Douste-Blazy. Chair of UNITAID Special Representative of the UN SG for Innovative Financing for Development
 Presentation by Dr Philippe Douste-Blazy Chair of UNITAID Special Representative of the UN SG for Innovative Financing for Development The Millennium Goals : Hope for Humanity 2000 UN Millennium Summit
Implementing the Abuja Declaration and Plan of Action: the journey so far
 Implementing the Abuja Declaration and Plan of Action: the journey so far The Abuja Declaration African leaders who met on 25 April 2000 in Abuja, Nigeria, laid out the foundation for a sustained battle
CONTENTS. Paragraphs I. BACKGROUND II. PROGRESS REPORT ON THE AFRICAN REGIONAL IMMUNIZATION STRATEGIC PLAN
 23 September 2013 REGIONAL COMMITTEE FOR AFRICA ORIGINAL: ENGLISH Sixty-third session Brazzaville, Republic of Congo, 2 6 September, 2013 Agenda item 14 IMMUNIZATION IN THE AFRICAN REGION: PROGRESS REPORT
Update from GAVI Aurelia Nguyen
 Update from GAVI Aurelia Nguyen (Copenhagen, Denmark, 27 June 2012) GAVI vaccine support Currently supported vaccines: pentavalent, pneumococcal, rotavirus, meningitis A, human papillomavirus (HPV), rubella,
Financing the HIV response in sub- Saharan Africa from domestic sources: moving beyond a normative approach
 Financing the HIV response in sub- Saharan Africa from domestic sources: moving beyond a normative approach Michelle Remme 1, Mariana Siapka 1, Olivier Sterck 2, Mthuli Ncube 2, Charlotte Watts 1 & Anna
Impact of Pathology Implementation Strategies in Sub Saharan Africa
 Impact of Pathology Implementation Strategies in Sub Saharan Africa June 2015 ascp.org PATHOLOGY IN AFRICA Large abdominal wall mass What do you do?? Large lesion non-diagnostic? Have to do additional
Renewing Momentum in the fight against HIV/AIDS
 2011 marks 30 years since the first cases of AIDS were documented and the world has made incredible progress in its efforts to understand, prevent and treat this pandemic. Progress has been particularly
Global Fund: Malaria in Pregnancy Perspectives
 Global Fund: Malaria in Pregnancy Perspectives Dr. Roopal Patel, Malaria Advisor Malaria in Pregnancy Working Group Annual Meeting Geneva, Switzerland September 18, 2017 Strengthening systems for health
Update on PMTCT. African Health Profession Regulatory Collaborative for Nurses and Midwives. Johannesburg, Republic of South Africa, June 18-22, 2012
 PMTCT Update Update on PMTCT Margarett Davis, MD, MPH Chief, Maternal and Child Health Branch Division of Global HIV/AIDS Centers for Disease Control and Prevention (CDC) African Health Profession Regulatory
ASLM Building laboratory capacity in Africa in a sustainable way
 ASLM Building laboratory capacity in Africa in a sustainable way Tsehaynesh Messele, PhD ASLM, Chief Executive Officer Annual AMDS meeting September 29-30, 2014 Geneva Laboratory capacity gaps in Africa
Plan of Presentation
 CONTINENTAL CONFERENCE ON MATERNAL, INFANT AND CHILD HEALTH IN AFRICA Plan of Presentation Regional Frameworks on SRH Maputo Plan of Action Five-Year Review of MPoA What is CARMMA? Why CARMMA? What is
Financing malaria control
 Chapter 6. Financing malaria control The three major sources of funds for malaria control pro - grammes are national government spending, external assistance from donors and household or private out-of-pocket
EXPLANATION OF INDICATORS CHOSEN FOR THE 2017 ANNUAL SUN MOVEMENT PROGRESS REPORT
 UNICEF / Zar Mon Annexes EXPLANATION OF INDICATORS CHOSEN FOR THE 2017 ANNUAL SUN MOVEMENT PROGRESS REPORT This report includes nine nutrition statistics, as per the 2017 Global Nutrition Report. These
ANNEX Page. AFR/RC61/11 4 July 2011 ORIGINAL: ENGLISH REGIONAL COMMITTEE FOR AFRICA
 4 July 2011 REGIONAL COMMITTEE FOR AFRICA ORIGINAL: ENGLISH Sixty-first session Yamoussoukro, Côte d Ivoire, 29 August 2 September 2011 Provisional agenda item 16 PROGRESS REPORT ON POLIOMYELITIS ERADICATION
AFRICA. The continent of All challenges
 AFRICA The continent of All challenges Part of Resources and burden of the disease in Africa Africa=25% Rest of the World=75% Africa=0.6% Rest of the World=99.4% 0% 20% 40% 60% 80% 100% 57 Critical shortage
FP2020 Expert Advisory Community Webinar
 FP2020 Expert Advisory Community Webinar Oct. 24, 2017 www.familyplanning2020.org #FP2020Progress @FP2020Global Facebook.com/familyplanning2020 AGENDA Welcome Key Updates: 2017 Family Planning Summit to
Update from the GAVI Alliance Seth Berkley, MD Chief Executive Officer
 Update from the GAVI Alliance Seth Berkley, MD Chief Executive Officer SAGE meeting Geneva, 8-10 November 2011 Topics to cover Update on new vaccine introduction Introductions New approvals Co-financing
IMMUNIZATION VACCINE DEVELOPMENT
 IMMUNIZATION VACCINE DEVELOPMENT MONTHLY IMMUNIZATION AND POLIO UPDATE IN THE AFRICAN REGION January February 2017 (Vol 5 issue N 1) District data completeness and coverage of DTP3 containing vaccine per
Gender, Poverty, and Health in Sub-Saharan Africa: A Framework for Analysis
 Gender, Poverty, and Health in Sub-Saharan Africa: A Framework for Analysis Pathways to Improved Health Outcomes Health outcomes Households/ Communities Household behaviors & risk factors Community factors
Maternal, Newborn and Child Health: Global initiatives and priority products for MNCH Dr. Mark W. Young Senior Health Specialist, UNICEF-New York
 Maternal, Newborn and Child Health: Global initiatives and priority products for MNCH Dr. Mark W. Young Senior Health Specialist, UNICEF-New York Copenhagen, Denmark 23 September 2013 Visit www.everywomaneverychild.org
EXECUTIVE SUMMARY THE PRESIDENT S MALARIA INITIATIVE
 EXECUTIVE SUMMARY THE PRESIDENT S MALARIA INITIATIVE Ninth Annual Report to Congress April 2015 EXECUTIVE SUMMARY Maggie Hallahan Photography The fight against malaria is making historic gains across sub-saharan
Progress in scaling up HIV prevention and treatment in sub-saharan Africa: 15 years, the state of AIDS
 10 th International Workshop on HIV treatment, Pathogenesis and Prevention Research in Resource-Limited setting (INTEREST, 3-6 May, 2016) Progress in scaling up HIV prevention and treatment in sub-saharan
IMMUNIZATION VACCINE DEVELOPMENT
 IMMUNIZATION VACCINE DEVELOPMENT MONTHLY IMMUNIZATION UPDATE IN THE AFRICAN REGION July-August 2016 (Vol 4, issue N 5) Special issue on 2015 WHO/UNICEF Estimates of National Immunization Coverage (WUENIC)
Excellence and Originality from Necessity: Palliative Care in Africa. Dr Emmanuel Luyirika Executive Director, African Palliative Care Association
 Excellence and Originality from Necessity: Palliative Care in Africa Dr Emmanuel Luyirika Executive Director, African Palliative Care Association Summary of the presentation 1. Introduction 2. Background
Procedure for Expedited Review of imported pre-qualified vaccines for use in national immunization programmes
 Procedure for Expedited Review of imported pre-qualified vaccines for use in national immunization programmes Dr Nora Dellepiane/Dr Anil Kumar Chawla WHO/HQ-Geneva, Switzerland 1 Expedited review procedure
Ethiopia Malaria Financial Landscape
 Ethiopia Malaria Financial Landscape PATH MACEPA DECEMBER 2015 MALARIA FUNDING IN ETHIOPIA AT A GLANCE The total estimated cost to implement Ethiopia s National Malaria Strategic Plan (NMSP) for 2015 2017
GAVI Alliance Board Meeting, 30 November 1 December 2010 Updates
 At the meeting in June 2010, the Board made three decisions of relevance to the nature of the GAVI Alliance s continuing role in health systems. The Board endorsed: 1. The inclusion of Strategic Goal 2
What is the recent experience of programs that distribute contraceptives free of charge versus for a price?
 What is the recent experience of programs that distribute contraceptives free of charge versus for a price? A Review of the Literature Jane T. Bertrand and Rebecca Emel 8 October 2015 @rhsupplies @rh_supplies
Food Production and Violent Conflict in Sub-Saharan Africa. - Supplementary Information -
 Food Production and Violent Conflict in Sub-Saharan Africa - Supplementary Information - Halvard Buhaug a,b,1, Tor A. Benaminsen c,a, Espen Sjaastad c & Ole Magnus Theisen b,a a Peace Research Institute
World Food Programme (WFP)
") UNAIDS 2016 REPORT World Food Programme (WFP) Unified Budget Results and Accountability Framework (UBRAF) 2016-2021 2 Contents Achievements 2 Introduction 2 Innovative testing strategies 2 Access to treatment
UNAIDS 2016 REPORT World Food Programme (WFP) Unified Budget Results and Accountability Framework (UBRAF) 2016-2021 2 Contents Achievements 2 Introduction 2 Innovative testing strategies 2 Access to treatment
PROGRESS REPORT ON DECADE OF TRADITIONAL MEDICINE IN THE AFRICAN REGION. Progress Report. CONTENTS Paragraphs BACKGROUND PROGRESS MADE...
 5 July 2011 REGIONAL COMMITTEE FOR AFRICA ORIGINAL: ENGLISH Sixty-first session Yamoussoukro, Côte d Ivoire, 29 August 2 September 2011 Provisional agenda item 17.2 PROGRESS REPORT ON DECADE OF TRADITIONAL
Tanzania s Progress in Combating Malaria: Achievement and Challenges
 Tanzania s Progress in Combating Malaria: Achievement and Challenges DR RENATA A MANDIKE DEPUTY PROGRAMME MANAGER NATIONAL MALARIA CONTROL PROGRAMME, MINISTRY OF HEALTH, COMMUNITY DEVELOPMENT, GENDER,
Measles Supplementary Immunization Activities and GAVI Funds as Catalysts for Improving Injection Safety in Africa
 SUPPLEMENT ARTICLE Measles Supplementary Immunization Activities and GAVI Funds as Catalysts for Improving Injection Safety in Africa Edward J. Hoekstra, 1 Maya M. V. X. van den Ent, 1 Halima Dao, 1 Hala
Putting the recommendations into action
 24 May, 2012 Putting the recommendations into action Dr Flavia BUSTREO Assistant Director General, Family, Women s and Children s Health Cluster on behalf of the multi-stakeholder implementation team The
TT Procured by UNICEF
 TT TT Procured by UNICEF 2001-08 250,000,000 200,000,000 150,000,000 100,000,000 50,000,000 0 2001 2002 2003 2004 2005 2006 2007 2008 Routine SIA TT historical demand and forecast overview Upcoming Tender
PROGRESS ON HEALTH-RELATED MILLENNIUM DEVELOPMENT GOALS AND THE POST 2015 HEALTH DEVELOPMENT AGENDA. Report of the Secretariat CONTENTS ANNEXES
 26 November 2015 REGIONAL COMMITTEE FOR AFRICA ORIGINAL: ENGLISH Sixty-fifth session N Djamena, Republic of Chad, 23 27 November 2015 Agenda item 8 PROGRESS ON HEALTH-RELATED MILLENNIUM DEVELOPMENT GOALS
Progress in scaling up voluntary medical male circumcision for HIV prevention in East and Southern Africa
 SUMMARY REPORT Progress in scaling up voluntary medical male circumcision for HIV prevention in East and Southern Africa January December 2012 Table of contents List of acronyms 2 Introduction 3 Summary
FRAMEWORK FOR IMPLEMENTING THE GLOBAL STRATEGY TO ELIMINATE YELLOW FEVER EPIDEMICS (EYE), IN THE AFRICAN REGION. Report of the Secretariat
, IN THE AFRICAN REGION. Report of the Secretariat") 13 June 2017 REGIONAL COMMITTEE FOR AFRICA ORIGINAL: ENGLISH Sixty-seventh session Victoria Falls, Republic of Zimbabwe, 28 August 1 September 20177 Provisional agenda item 11 FRAMEWORK FOR IMPLEMENTING
13 June 2017 REGIONAL COMMITTEE FOR AFRICA ORIGINAL: ENGLISH Sixty-seventh session Victoria Falls, Republic of Zimbabwe, 28 August 1 September 20177 Provisional agenda item 11 FRAMEWORK FOR IMPLEMENTING
Update on Meningococcal A Vaccine Development and Introduction
 Update on Meningococcal A Vaccine Development and Introduction WHO Product Development for Vaccines Advisory Committee Meeting (PD-VAC) @ Geneva, 7-9 September 2015 Dr Marie-Pierre Preziosi, WHO Initiative
Children in Africa. Key statistics on child survival, protection and development
 Children in Key statistics on child survival, protection and development Key Statistics In, mortality rates among children under five decreased by 48 per cent between 199 and 13, but still half of the
Global Fund ARV Fact Sheet 1 st June, 2009
 Global Fund ARV Fact Sheet 1 st June, 2009 This fact sheet outlines the principles and approach in determining the number of people on antiretroviral drugs (ARVs) for HIV/AIDS treatment, with a breakdown
Global reductions in measles mortality and the risk of measles resurgence
 Global reductions in measles mortality 2000 2008 and the risk of measles resurgence Measles is one of the most contagious human diseases. In 1980 before the use of measles vaccine was widespread, there
Global Fund Results Fact Sheet Mid-2011
 Global Fund Results Fact Sheet Mid-2011 This fact sheet outlines some of the common questions and answers regarding results reported by Global Fund-supported programs, including the principles and approach
( A JICA-IRRI-PhilRice Initiative) Presented by Noel Magor, Head Unit Impact Acceleration and Training Center, IRRI
 Presented by Noel Magor, Head Unit Impact Acceleration and Training Center, IRRI") ( A JICA-IRRI-PhilRice Initiative) Presented by Noel Magor, Head Unit Impact Acceleration and Training Center, IRRI Long partnership between; IRRI & PhilRice IRRI & JICA PhilRice & JICA The Season Long
( A JICA-IRRI-PhilRice Initiative) Presented by Noel Magor, Head Unit Impact Acceleration and Training Center, IRRI Long partnership between; IRRI & PhilRice IRRI & JICA PhilRice & JICA The Season Long
Note that the subject may be known by different names in different countries
 CALL FOR EXPRESSION OF INTEREST FOR TECHNICAL PROPOSALS TO MEASURE DELIVERY OF COMPREHENSIVE SEXUALITY EDUCATION IN EASTERN AND SOUTHERN AFRICA: AN ANALYSIS OF PROGRESS Summary of task: to develop a regional
Malaria is both preventable and treatable. Yet
 CHAPTER 23 The Malaria Control Success Story Anne-Maryse Pierre-Louis, Jumana Qamruddin, Isabel Espinosa, and Shilpa Challa Malaria is both preventable and treatable. Yet more than 220 million cases of
Africa s slow fertility transition
 Africa s slow fertility transition John Bongaarts Population Council, New York Süssmilch Lecture Max Planck Institute, Rostock 3 Sep 215 Billions 4 3 Population projections for sub-saharan Africa 215 projection
The Impact of Population Policies, Non-Governmental Organizations, and HIV/AIDS Policies on Fertility and HIV Prevalence in Sub-Saharan Africa 1
 The Impact of Population Policies, Non-Governmental Organizations, and HIV/AIDS Policies on Fertility and HIV Prevalence in Sub-Saharan Africa 1 Rachel Sullivan Robinson Assistant Professor School of International
Market Updates: Routine Vaccine Introductions IPV. Vaccine Industry Consultation October 2018 UNICEF Supply Division
 Market Updates: Routine Vaccine Introductions IPV Vaccine Industry Consultation October 2018 UNICEF Supply Division Outline Review of rapid introduction of IPV Overview of the current situation for 2018
ENHANCING THE ROLE OF TRADITIONAL MEDICINE IN HEALTH SYSTEMS: A STRATEGY FOR THE AFRICAN REGION. Report of the Secretariat EXECUTIVE SUMMARY
 3 September 2013 REGIONAL COMMITTEE FOR AFRICA ORIGINAL: ENGLISH Sixty-third session Brazzaville, Republic of Congo, 2 6 September 2013 Agenda item 10 ENHANCING THE ROLE OF TRADITIONAL MEDICINE IN HEALTH
FAST-TRACK: HIV Prevention, treatment and care to End the AIDS epidemic in Lesotho by 2030
 Evidence informed, responsive and sustainable care FAST-TRACK: HIV Prevention, treatment and care to End the AIDS epidemic in Lesotho by 2030 Alti Zwandor UNAIDS Country Director Maseru, Lesotho 9 December
Presentation title at-a-glance info (in slide master) Introduction to the Gavi CSO Platforms Project
 Introduction to the Gavi CSO Platforms Project") Introduction to the Gavi CSO Platforms Project Raquel Fernandes Coordinator of the Oversight Advisory Group May 2018 Gavi CSO Constituency for Immunisation and Stronger Health Systems ~ 4000 Constituency
Introduction to the Gavi CSO Platforms Project Raquel Fernandes Coordinator of the Oversight Advisory Group May 2018 Gavi CSO Constituency for Immunisation and Stronger Health Systems ~ 4000 Constituency
511,000 (57% new cases) ~50,000 ~30,000
 ~50,000 ~30,000") Latest global TB estimates - 2007 (Updated Mar 2009) All forms of TB Greatest number of cases in Asia; greatest rates per capita in Africa Multidrug-resistant TB (MDR-TB) Estimated number of cases 9.27
Latest global TB estimates - 2007 (Updated Mar 2009) All forms of TB Greatest number of cases in Asia; greatest rates per capita in Africa Multidrug-resistant TB (MDR-TB) Estimated number of cases 9.27
Draft Concept Note. Launching of Sahel Malaria Elimination Initiative
 Draft Concept Note Launching of Sahel Malaria Elimination Initiative Background The Global Malaria Community has set a vision of ending malaria for good. The African Union has also expressed its political
Key Messages for World Malaria Day 2009
 INFORMATION RBM/WG/2009/INF.12 10 APR 2009 Draft document General distribution English Only Key Messages for World Malaria Day 2009 Counting Malaria Out to Reaching the 2010 Targets On the occasion of