Community Health Assessment
|
|
|
- Darren Moody
- 6 years ago
- Views:
Transcription


1 2017 Community Health Assessment Pulaski County, Missouri Pulaski County Health Center & Home Health Agency 11/1/2017
2 Table of Contents Community Health Assessment Summary of Findings... 3 Demographic/Educational/Socioeconomic Indicators... 5 Population and Change:... 5 Racial Diversity:... 6 Educational Attainment:... 7 Housing, Household, and Families... 7 Income & Poverty:... 7 Environmental Health Risk Factors... 8 Lead Testing:... 8 Public Water Supplies:... 8 Private Water Supplies:... 8 Recreational Water Sampling:... 8 Environmental Health Risk Factors:... 9 Food, Lodging, and Day Care Safety:... 9 Public Safety/Domestic Violence... 9 Crime Rates:... 9 Drug Use... 9 Abuse and Neglect: Injuries Indicators Related to Injury: Indicators Related to Traffic Safety: Maternal & Child Health Maternal & Child Health: Indicators Related to Prenatal Risk: WIC (Women, Infants, and Children) Program Utilization Prevalence of Infectious Disease Communicable Disease Prevention: Sexually Transmitted Disease: Tuberculosis: Prevalence of Chronic Risk Factors Leading Causes of Mortality Health Outcomes: Health Factors: Chronic Disease Risk Factors: Disabilities: Health Care System Indicators Data Sources
3 Pulaski County Health Department 2017 Health Status Report Community Health Assessment Summary of Findings The priority risk factors and priority disease/condition report for Pulaski County indicate we have higher mortality and morbidity rates than the state rates. Many of the illnesses and deaths experienced by the adult population are in part a culmination of lifestyle choices such as smoking, lack of physical activity and proper diet, lack of regular prevention and screening services. Sexually Transmitted Disease (STD) rates have begun to fall but remain significantly higher than the state rate. Maternal and Child Health issues in Pulaski County are about average with the state. We continue to be slightly lower and equal to the state in many MCH health concerns. Child abuse rates in Pulaski County were 4% higher in the previous assessment and are now comparable to the state-wide average. The general health in Pulaski County is poor. Behavioral risk factors are now slightly lower than the statewide rates, whereas they previously were considerably higher. The trend has remained that some chronic disease cases continue to be higher with screening rates still lower. Physical inactivity, elevated blood pressure, elevated cholesterol, diabetes among adults are now below or comparable to state rates but are still a concern with the continuation of the obesity epidemic in the county, state, and country. Obesity is a risk factor for almost all the leading causes of death for Pulaski County. Obesity paired with tobacco use only continues to escalate the prevalence of chronic disease. Review of the community health status indicators, including primary and secondary data reveals the three most significant problems affecting the health status of Pulaski County s residents are: Heart Disease & Stroke All Cancers Smoking-Attributable Disease These problems attribute to the leading causes of death are preventable in most cases. Through continued effort through education and programming, the Pulaski County Center along with its partners will strive to build a healthy future for Pulaski County. 3
4 Chart A: depicts top leading causes of death in Pulaski County from Top 10 Causes of Death Pulaski County, Heart Disease All Cancers (Malignant Neoplasms) Smoking-Attributable (estimated) Chronic Lower Respiratory Disease Stroke/Other Cerebrovascular Disease Total Unintentional Injuries Kidney Disease (Nephritis and Nephrosis) Diabetes Mellitus Pneumonia and Influenza Drug-Induced Deaths Chart A: Source: MODHSS Community Health Profiles; Leading Causes of Death Profile, Pulaski County, , Rates are per 100,000 population. 4
5 Demographic/Educational/Socioeconomic Indicators Population and Change: Pulaski County is one of the fastest growing counties in Missouri. The population had steadily increased each year from 2006 until 2013 where the population started to experience a slight decline. Between , Pulaski County s population increased by 9,479, by going from 43,742 in 2006 to 53,221 in This population doesn t include the population of Ft. Leonard Wood which adds approximately 7,300 additional people. The population on the Army installation is transient and is always fluctuating. The gender breakdown of the population shows 62 percent being male and 38 percent female. The largest growth incline occurred within the timeframe of 2009 to 2010 with a change of approximately 12.5 percent compared to Missouri change of ½ percent respectively. Strategic growth planning of funds and programs is vital in preparing for future health care and environmental demands. See Chart 1.1 and 1.2 for populations trends in Pulaski County and the State of Missouri. 56,000 54,000 52,000 Population Trend: Pulaski County, MO ,000 48,000 Pulaski 46,000 44,000 42, Chart 1.1: Source: MODHSS, Population MICA, Census Bureau Population Trend: Missouri ,150,000 6,100,000 6,050,000 6,000,000 5,950,000 5,900,000 5,850,000 5,800,000 5,750,000 5,700, Chart 1.2: Source: MODHSS, Population MICA, Census Bureau Missouri 5
6 The age breakdown of Pulaski County shows that children under the age of 18 have the largest population rate of percent as compared to the State rate of percent. Our smallest population is the number of residents over the age of 85 with a total percentage of.82 compared to the State rate of 2.06 percent. Pulaski County is considered to have an overall young population. Although the highest percentage of the population is children under the age of 18 when taken into consideration as a conglomerate, these are still vastly outnumbered by all age groups between 18 to 64 when considered individually. See Chart 1.3 below for further details. Population by Age 85 & over Under 1-17 Individuals 0 5,000 10,000 15,000 20,000 Chart 1.3- Source: MODHSS, Population MICA, Census Bureau Racial Diversity: There has not been a significant change in the race and ethnicity population from 2013 to Since 2013 there has been a slight decline in White Population by 1.9 percent, yet continue to be the largest racial group in the County at 77.3 percent. Blacks are the second largest racial population at 12.9 percent with a 1 percent increase since Although the percentages of the other racial and ethnic groups are relatively small for Pulaski County, they are approximately twice the statewide rate for all races and ethnicities other than blacks. See Table 1.1 Population by Race and Ethnicity, 2015 County State Percentage of Population 2015 Percentage of Population 2015 White Alone Black Alone Am. Indian & Alaskan Native Alone Asian and Pacific Islander Alone Multiracial Hispanic Table 1.1- Source: Census Bureau, State & County Quick Facts: Pulaski County, Missouri 6
7 Educational Attainment: Per the Bureau of the Census, American Community Survey (completed ), 2015, the graduation rate for Pulaski County was 89.8 percent as compared to the statewide rate of 88 percent. The Survey also showed that 24.2 percent of the population over the age of 25 attained a Bachelor s Degree or higher. See Table 1.2 for the breakdown of educational attainment for persons over the age of 25. Educational Attainment of Percent of Persons age 25 years+, Percentage <9 th grade th -12 th grade, no diploma 7.3 High school graduate or equivalent 31.3 Some College, no degree 23.3 Associates degree 11.2 Bachelor's degree 15.8 Graduate or Professional degree 8.4 Table 1.2- Source: Bureau of the Census, American Community Survey, detailed tables for Housing, Household, and Families Per the US Census Bureau s estimates, there were 18,799 housing units in Pulaski County in Of the total units, 52.5 percent are owner occupied. The median value of an owner-occupied housing unit in 2014 was $126,000 as compared to the 2011 value of $122,600 and 2014 statewide value of $136,700. Pulaski County offers a wide range of housing with only about 7.6 percent of the units being built before In 2014, there were 15,528 households in the county. According to the Installation Community Health Status Assessment (CHSA) there are 2,146 individuals residing in on-base housing as of November Of those living on base, 70 percent are living in singlefamily housing and the remainder living in barracks or shared living spaces. All other individuals currently stationed at Ft. Leonard Wood utilize off-base housing. Income & Poverty: The 5-year estimate of the county s poverty rate in 2015 was at 13.2 percent which is a bit lower than the state rate of 14.8 percent. Of those living in poverty, 18 percent are children; this rate is slightly lower than the State-wide average of 20 percent. Median household income in 2015 was $47,931 which was a decrease from the previous year at $49,604. The unemployment rate for Pulaski County, MO as of February 2017 was 5.6% compared to the state unemployment rate of 3.3%. Of the current population under the age of 65, 12.1 percent is living with a disability and 14 percent have no health insurance. 7
8 Environmental Health Risk Factors Lead Testing: Pulaski County is a non-high risk area for lead screening. As listed in the previous section, only eight percent of the housing was built before 1950, reducing the risk of lead exposure from home. Medicaid children are tested at 12 months and 24 months. The county lead screening reporting rates are low but are steadily increasing. Our rates are low mostly due to the number of military children being tested at the General Leonard Wood Army Community Hospital (GLWACH). FLW is not a part of the Missouri Department of Health and Senior Services reporting system. Although reporting rates are relatively low, the testing outcomes are excellent. The Pulaski County Health Center has continued its efforts to educate on lead. Children under the age of six are screened on a yearly basis and are tested based upon any positive responses indicating the child is at high risk for lead poisoning. Efforts are continuously made to improve the reporting process and rates. Public Water Supplies: Pulaski County is well within the normal and safe range of standards for water. The drinking water supply is fluoridated in Waynesville, St. Robert and Ft. Leonard Wood. Most of the citizens of Pulaski County have access to public water supply systems. The water is tested for lead and other contaminants and is not an issue in public water available in Pulaski County. The populations consuming public water are those living in an incorporated area. Those in unincorporated areas consume water from private wells. Private Water Supplies: The Pulaski County Health Center opened a new water lab in its main office in Crocker this past spring to test the private well water. Our new water laboratory offers water testing for the presence or absence of bacteria for a fee. We also offer the New Well Series, which is a chemical analysis performed by the Missouri Department of Health and Senior Services (DHSS) Laboratory that identifies the levels for ph, nitrate/nitrogen, chloride, sulfate, fluoride, iron, manganese, and lead. This test can help residents with private wells determine a baseline for drinking water quality. In 2016, 96 private water samples have been processed through the lab. Recreational Water Sampling: The Health Center monitors streams and rivers located in Pulaski County for the presence of E. coli bacteria. Samples are collected from eight area swimming locations weekly by the Environmental Department, between April and September, and tested by our lab staff. Sites are selected based on their accessibility and the likelihood that people might come in contact with the water. The health center does not regulate these sites in any way but the information is provided as a community service. We use the Environmental Protection Agency's (EPA) established water quality criteria for monitoring bacteria, which states that no single water sample should have an E. coli count that exceeds 235 CFUs (colony forming units) per 100 ml of water. The current sampling results from April through September 2016 show that the E. Coil counts were well below the Environmental Protection Agency's (EPA) established water quality criteria of 235 CFUs (colony forming units) per 100 ml of water. There were a few samples during this period that were above the 235 CFUs but this was due to heavy rain events. During this sampling period, the 8
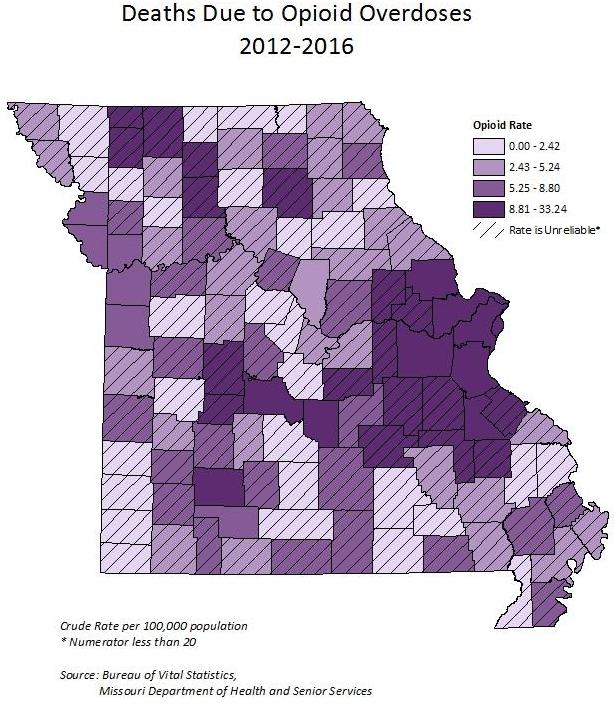
9 Environmental staff collected and analyzed 203 samples. Environmental Health Risk Factors: In early 2015, complaints were filed with multiple government agencies on the cleanliness of our local rivers and current e-coli levels. From a public health standpoint, the Health Center worked on a plan to help protect residents, patrons, and tourists from potential e-coli infection. A partnership was formed with the Pulaski County Commission to launch a Water Monitoring Program to test a total of 8-10 local public access points on the Gasconade, Big Piney, and Roubidoux. The program has been fully implemented since April Food, Lodging, and Day Care Safety: Pulaski County has seen a continued growth of restaurants, lodging facilities and day cares due to the increase of military personnel at Ft Leonard Wood. During 2016 the environmental staff conducted 571 food inspections, 120 lodging inspections, and 38 child care inspection. The environmental staff worked 49 food recalls requiring calls and visits to grocery stores, schools, and other facilities. The Environmental Public Health Staff conducted a total of 965 inspections in Public Safety/Domestic Violence Crime Rates: The health of the community is negatively impacted by crime and substance abuse for stress, fear, injuries, and addictions that prevent some county residents from reaching their fullest potential. In 2016, law enforcement made 1,750 total arrests to include: 238 driving under the influence, 75 disorderly conduct, 89 aggravated assault, 141 larceny/theft and 611 drug-related arrests. Among the leading causes of death for Pulaski County from the years of , some causes of interest were Homicide at 7.11, alcohol-induced deaths at a rate of 5.54, drug-induced deaths a 17.09, and injury by firearm at None of these rates are statistically significantly different than the respective state rates. Drug Use The illicit drug continues to rise and plague Pulaski County just as it has across the nation. There was one methamphetamine laboratory seizure in Pulaski County in The following graphs depict the opioid and heroin crisis in Pulaski County and across Missouri. 9
10 10
11 The majority of counties with high opioid-involved mortality rates are clustered in and to the south of the St. Louis metropolitan region, though some additional counties with high opioid-involved death rates can be found across the state. Opioid-involved emergency room discharge rates follow a similar statewide distribution with the greatest rates in the St. Louis area; however, there is an additional cluster in the southwest region of the state. 11

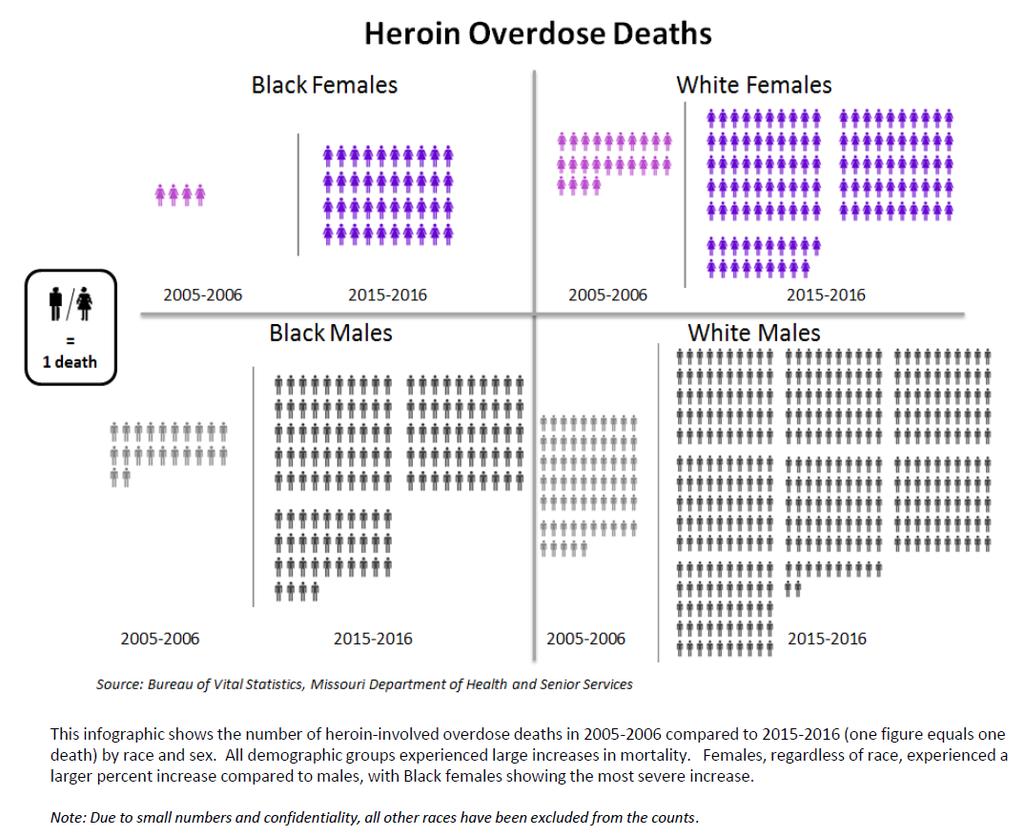
12 High rates of mortality due to heroin-involved overdoses (a subset of opioid-involved overdoses) are strongly concentrated in the St. Louis metropolitan region and surrounding counties with a secondary cluster in the southeast corner of Missouri. This is a markedly different distribution than a non-heroin opioid-involved overdoses as will be shown in the following map. 12
13 13

14 Abuse and Neglect: The abuse and neglect of the children in our community impacts everyone. Pulaski County s rate of child abuse/neglect had continued a decline since 2005 until the period of when the county experienced a slight increase. Pulaski County has also maintained a slightly higher trend than the statewide average rates. Chart 3.1 shows a comparison of the rate of child abuse/neglect in 2013 of Pulaski County, Missouri, and surrounding counties. Chart 3.2 depicts the average moving rates for Pulaski County and the State of Missouri. There are currently two shelters for battered women and children in Pulaski County. Chart 3.1-Rates for Child Abuse/Neglect indicators are per year per 1000 population. Source: Community Data Profiles - Missouri Department of Health and Senior Services Chart 3.2-Rates for Child Abuse/Neglect indicators are per year per 1000 population. Source: Community Data Profiles - Missouri Department of Health and Senior Services 14
15 Injuries Indicators Related to Injury: In 2013, there were a total of 2,396 injuries reported in Pulaski County. This represents a decrease from 2614 reported injuries during The reported injuries in 2013 include the following categories: Assault-101 Legal Int./War- 0 Self-Injury- 46 Unintentional Unknown- 21 Indicators Related to Traffic Safety: Pulaski County s motor vehicle accident death rate mean was 19.8 from 2003 to 2013 per 100,000. Motor vehicle crashes cause about one-quarter of Missouri's unintentional deaths to children age This holds true in Pulaski County. For the period of , the Pulaski County s rate was 20.6 per 100,000 populations, which is not significantly different than the statewide rate of 17.6 per 100,000 populations. The rate motor vehicle deaths in children in Pulaski County was 21.2 compared to the state rate of The Pulaski County rates are unstable due to less than 20 events, and thus a statically significant difference cannot be determined. The overall motor vehicle death rate for all ages combined was 19.7 in Pulaski County compared to a statewide rate of The rate, though slightly higher than the state, has no statistical difference. Although child seats can significantly reduce fatal injury to children, they are often misused or not used at all. In focusing on decreasing the prevalence of motor vehicle crash-related injury and death, the first step to prevention is increasing awareness and knowledge. The use of restraint devices and improving environmental dangers are another step in decreasing these injuries. Environmental changes include: eliminating drinking and driving, improving driver skills and behaviors, and increasing social support interventions. Child Safety Seat installation and inspections are available at the Pulaski County Health Center. Seats may be provided if available for eligible children. 15
16 Maternal & Child Health Maternal & Child Health: The indicators of a child s wellbeing include many factors such as socio & economic and environmental. There are currently 16,167 children under the age of 19 in Pulaski County. Chart 5.1 shows the breakdown of the children & adolescent population ages by gender. 3,500 Child & Adolescent Population By Gender, Pulaski County, ,000 2,500 2,000 1,500 1,000 Male Female Under Chart 5.1- Source: MO DHSS, Population MICA The 2017 County Health Rankings shows multiple areas that impact family health. Table 5.1 shows some of these areas and how well we are doing as compared to the State of Missouri and our 2015 Rates. Health Factor Pulaski Co Pulaski Co Missouri Missouri Adult Smoking 23% 23% 23% 22% Adult Obesity 34% 28% 31% 26% Food Environment Index Physical Inactivity 27% 24% 26% 25% Access to exercise opportunities 62% 63% 77% 76% Excessive drinking 22% 21% 17% 18% Teen Births Uninsured 16% 14% 16% 14% High School Graduation 85% 92% 86% 90% Unemployment 7.5% 5.8% 6.5% 5.0% Children in Poverty 17% 18% 22% 20% Children in single-parent households 26% 23% 34% 24% Severe housing problems 12% 13% 14% 15% Table 5.1- Source: County Health Rankings, 2015 and
17 According to the 2015 Youth Risk Behavior Survey, 12.1% of middle school and 13.3% of high school students in Missouri were overweight. Additionally, it showed that 8% of middle school and 13.1% of high school students were obese. Overweight for youth is defined as having a BMI between the 85 th and 95 th percentile on the CDC Growth Chart. Obese for youth is defined as having a BMI at or above the 95 th percentile on the CDC growth chart. Through a local survey of first through fifth grade students in Pulaski County, it was found that an average of 24.5% of elementary students were overweight or obese. Indicators Related to Prenatal Risk: Several factors contribute to birth outcome and child health. Among those is a lack of education, late care received during pregnancy, inadequate prenatal care, smoking during pregnancy and births to teens. Pulaski County rate for prenatal care beginning in the first trimester at 77.8 percent is slightly higher than the statewide average rate of 74.5 percent. Prenatal smoking rates are slightly higher in Pulaski County than statewide. County rate for inadequate prenatal care is slightly lower than statewide. The two greatest statistical differences to consider are the prenatal WIC and Prenatal Food Stamps rates which are significantly higher statewide than those of the county. See Table 5.2 for the prenatal profile for Pulaski County. Data Years Count Rate State Rate Care Began First Trimester Late Care (2nd/3rd Trimester) No Prenatal Care Inadequate Prenatal Care - Missouri Index Prenatal Medicaid Prenatal WIC Prenatal Food Stamps Weight Gain less than 15 Pounds - Term Singleton Weight Gain greater than or equal to 45 Pounds Term Singleton Gestational Diabetes Pre-Pregnancy Diabetes Mother Smoked During Pregnancy Table 5.2- Source: MO DHSS Community Health Profiles, Prenatal; * Fewer than 20 events in the numerator; rate is unstable. 17

18 WIC (Women, Infants, and Children) Program Utilization WIC is an educational based nutrition program that teaches mothers and young children how to eat well and stay healthy. WIC is for women who are pregnant, breastfeeding or whose pregnancy recently ended; infants under 12 months old; and children under 5 years old who qualify based on income and health risk needs. WIC promotes and educates on the benefits of breastfeeding for mothers and their infants. Qualifying women, infants and children are prescribed a food package based on individual need. New food items recently added to WIC food packages include whole wheat bread or tortillas, tofu, fresh or frozen fruits and vegetables, canned beans and jars of baby food. WIC participation continues to decline despite efforts to recruit new eligible clients. Chart 5.4 below shows the trend of participation since FY2011. Note: The WIC fiscal year (FY) runs October 1 September WIC Participation Rates, Pulaski County, FY12-FY Count FY12 FY13 FY14 FY15 FY16 FY17 Source: Pulaski County Health Center Board Report, October
19 Prevalence of Infectious Disease Each year the Pulaski County Health Center reports, investigates and educates on the communicable diseases in the county. A system is in place to receive and transmit information on reportable communicable, environmental and occupational disease reports received from laboratories, physicians, hospitals, clinics, or other public/private institutions as defined in CSR The Communicable Disease Preventions programs: Provide health care providers and mandated disease reporters information about reporting requirements, methods of reporting, and recognition of, and response to critical incidents. Provide the community with information on community health risk. Provide health education information on specific diseases to individual clients. The total number of communicable diseases reported to the health department in 2016 is 377 plus 139 animal bites that were investigated. Communicable Disease Prevention: The prevention and spread of disease are a major public health concern. Prevention programs by education and screenings are provided throughout the community via presentations, display boards, news releases, and public health updates. Disease surveillance of local doctor s offices, schools, nursing homes and child care facilities is collected and analyzed by the health department s CD nurse and is forwarded to the Region Epidemiologist. The environmental specialist and community health nurse investigate any disease with an abnormal amount of increase. The leading communicable disease in Pulaski County is sexually transmitted diseases, which includes Chlamydia and Gonorrhea. Sexually Transmitted Disease: The health department does testing and treatment for sexually transmitted diseases during walk-in clinics on Mondays and by appointment Tuesday through Thursday. Treatment is provided to all positive cases and their partner(s). There were 157 office visits in 2016 for STD testing and treatment. Services for testing and treatment are on a sliding scale fee and waived if the patient cannot pay. There were 314 cases in Tuberculosis: The Pulaski County Health Department offers TB skin testing, TB medications (if indicated) and TB counseling / prevention education for residents of the community. When indicated (positive case), the health department offers case management to the clients this includes monthly health assessments, medications as ordered, interaction with physician concerning the health status of the client, and frequent follow care with the patient and/or family. Visits related to the prevention and treatment of tuberculosis in 2016 was

20 Prevalence of Chronic Risk Factors Leading Causes of Mortality Health Outcomes: Per the 2017 County Health Rankings, Pulaski County is ranked 40 out of 115 counties overall for Health Outcomes. This ranking is scored based on a county s mortality and morbidity rates. The county s ranking for mortality or length of life was 55 out of 115. Mortality looks at premature death rate or the number of years of potential life lost before the age of 75. Every death that occurs before the age of 75 will add to the total number of potential years of life lost. Our quality of life ranking was 64 out of 115. The quality of life ranking looks at the reported number of quality of health days and low birth-weight. For a more in-depth look at the details, see Table 7.1. Health Factors: The 2017 County Health Rankings shows Pulaski County at a ranking of 34 out of 115 for Health Factors. Four different categories were looked at to obtain the overall Health Factors ranking; Health Behaviors (ranked 86), Clinical Care (ranked 39), Social & Economic Factors (ranked 28) and Physical Environment (ranked 1). The lower ranking of the Health Behaviors category is associated with our adult smoking rates (23%), adult obesity rates (28%), physical inactivity (24%) as well as motor vehicle crash death rate STD rates and teen birth rate(rates discussed in previous sections). See Chart 7.1 for Health Risk Factors, Chart 7.2 for the Missouri Health Factors Ranking Map. Health Risk Factors, 2015 Percentage Comparison Pulaski County Missouri Top US Performers Poor or Fair Health Adult Smoking Adult Obesity Physical Inactivity Uninsured Chart 7.1- Source: County Health Rankings,
 Chronic Obstructive Pulmonary Disorder (COPD) Stroke Diabetes Ongoing")
21 Missouri Health Factors Ranking Map, 2017 Chart 7.2- Source: County Health Rankings, 2017 Chronic Disease Risk Factors: Chronic Disease Risk factors are a significant concern in Pulaski County. For the period ending 2014, the leading causes of death related to disease for the county were: Heart Disease Cancer (All Types) Chronic Obstructive Pulmonary Disorder (COPD) Stroke Diabetes Ongoing program activities help to educate and increase screening opportunities for the residents in and around Pulaski County. Disabilities: According to the 2015 American Community Survey, the average number of civilians living with a disability was at 6,357. Of this population, approximately 10% are under the age of 18, 60% are between 18 and 64 years of age and 30% are age 65 or older. As of June 2013, there were 857 totally and permanently disabled people receiving MO Healthnet benefits in Pulaski County of the total 5,832 recipients. 21

22 Health Care System Indicators The health care system in Pulaski County has a somewhat lower rate than the state rate. The county is a physician shortage area with only five health care clinics. There are two additional clinics with only one physician, but with limited hours. The only hospital in the county is General Leonard Wood Army Community Hospital, which sees military personnel and dependents only. Mercy Clinic-St. Robert has extended their clinic hours to include weekend walk-in clinics. There are six dental offices; two that will accept Medicaid patients and patients with no insurance. Table 8.1 depicts the residents to primary care physician per 100,000 throughout each County within Missouri, 2013 Table
23 Data Sources Behavioral Health Epidemiology Workgroup. (2017). Behavioral Health Profile: Pulaski County. Missouri Division of Behavioral Health and Substance Abuse and Mental Health Services Administration. MO DHSS. (2017). Deaths Due to Heroin Overdoses, Jefferson City, MO: Bureau of Vital Statistics, MO DHSS. MO DHSS. (2015). Health Risk Behaviors among Middle School and High School Students. Jefferson City, MO: MODHSS. MO DHSS. (n.d.). MICA. Retrieved November 2017, from MO Healthnet (Medicaid) MICA: MODHSS. (2017). Deaths Due to Opiod Overdoses, Jefferson City, MO: Bureau of Vital Statistics and MO DHSS. MODHSS (Missouri Department of Health & Senior Services). MICA. In Population MICA. Retrieved from, MODHSS (Missouri Department of Health & Senior Services). Community Data Profiles In Social and Economic Indicators. Retrieved from, MODHSS (Missouri Department of Health & Senior Services). Community Data Profiles, In Child Health Profile. Retrieved from, MODHSS (Missouri Department of Health & Senior Services). Community Data Profiles, In Death- Leading Cause Profile. Retrieved from, MODHSS (Missouri Department of Health & Senior Services). Community Data Profiles, In Prenatal Profile. Retrieved 2017, October, from Pulaski County Health Department Annual Report Document, Retrieved 2017, September. County Health Rankings Snapshot: Pulaski County. Retrieved 2017, September, from US Bureau of the Census, American Community Survey, Retrieved 2017, September from 23


24 Publication produced by: Pulaski County Health Center & Home Health Agency th Street Crocker, MO For additional copies: Call or obtain a downloadable copy online at 24
HealtheCNY Indicator List by Data Source
 American Community Survey 23 Adults with Health Insurance Children Living Below Poverty Level Children with Health Insurance Families Living Below Poverty Level Homeowner Vacancy Rate Homeownership Households
Community Health Needs Assessment
 Community Health Needs Assessment Scott County, Missouri This assessment will identify the health needs of the residents of Scott County, Missouri, and those needs will be prioritized and recommendations
2017 State Of The County Health Report Jones County, NC
 217 State Of The County Health Report Jones County, NC Promoting sound health policies, preventing and controlling the spread of disease, and safeguarding the integrity of the environment for all citizens
FLHealthCHARTS.com Update List
 Released = New data, statistical brief, or analytic report not previously posted on FLHealthCHARTS. Added = New features or indicators not previously posted on FLHealthCHARTS. Updated = Change to data
Tuscarawas County Health Department
 Tuscarawas County Health Department Community Health Needs Assessment 214 TUSCARAWAS COUNTY HEALTH DEPARTMENT Community Health Needs Assessment 214 Assessment Commissioned by: Dr. James Hubert D.O Health
WASHINGTON STATE COMPARISONS TO: KITSAP COUNTY CORE PUBLIC HEALTH INDICATORS May 2015
 WASHINGTON STATE COMPARISONS TO: KITSAP COUNTY CORE PUBLIC HEALTH INDICATORS This is a companion document to the Core Public Health Indicators that provides a comparison of to Washington State for the
Jackson County Community Health Assessment
 2016 Jackson County Community Health Assessment With Collaboration from Black River Memorial Hospital and Jackson County Public Health Wisconsin Population Health Institute Table of Contents Structure
Community Health Status Assessment
 Community Health Status Assessment EXECUTIVE SUMMARY The Community Health Status Assessment (CHSA) is one of four assessments completed as part of the 2015-2016 Lane County Community Health Needs Assessment
Prince George s County Health Department Health Report Findings
 Prince George s County Health Department 2018 Health Report Findings Our Residents Socioeconomic Factors Compared to Maryland, Prince George s residents: have a higher median household income, are employed
Walworth County Health Data Report. A summary of secondary data sources
 Walworth County Health Data Report A summary of secondary data sources 2016 This report was prepared by the Design, Analysis, and Evaluation team at the Center for Urban Population Health. Carrie Stehman,
Sarpy/Cass Department of Health and Wellness
 This 2012 Community Health Report Card is the product of many community surveys and agency recordkeeping. The staff at the Sarpy/ Department of Health and Wellness finds value in all of this community
Community Health Status Assessment: High Level Summary
 Community Health Status Assessment: High Level Summary This summary provides a general overview of Community Health Status Assessment (CHSA) results as part of the Health Improvement Partnership (HIP-C)
San Diego County Health Briefs North Coastal Region
 Non-Communicable Disease This brief contains 2009 chronic disease health data for the of San Diego County. Data are provided from the Community Health Statistics Unit and the 2009 California Health Interview
Health Profile Chartbook 2016 Kalkaska County
 Health Profile Chartbook 2016 Kalkaska County 2016 Chartbooks The 2016 Chartbooks provide a snapshot of the health status of the District Health Department #10 jurisdiction. Information is presented by
Health Profile Chartbook 2016 Mecosta County
 Health Profile Chartbook 2016 Mecosta County 2016 Chartbooks The 2016 Chartbooks provide a snapshot of the health status of the District Health Department #10 jurisdiction. Information is presented by
Cascade Pacific Action Alliance Regional Health Assessment
 Cascade Pacific Action Alliance Regional Health Assessment Cowlitz, Grays Harbor, Lewis, Mason, Pacific, Thurston and Wahkiakum County December, 2014 V.4 Thematic Areas Demographics and Socioeconomic Status
Community Health Needs Assessment
 Community Health Needs Assessment Gratiot County Community Health Assessment Community Health Assessment Data Sources Primary Data (new data collected first-hand) Community Opinion Survey Provider Opinion
JOINING HANDS: SHARING RESOURCES AND DATA ACROSS SECTORS TO IMPROVE POPULATION HEALTH
 JOINING HANDS: SHARING RESOURCES AND DATA ACROSS SECTORS TO IMPROVE POPULATION HEALTH Virginia Population Health Summit Charlottesville, Virginia March 29, 2017 Steven H. Woolf, MD, MPH Director, Center
New Mexico Department of Health. Racial and Ethnic Health Disparities Report Card
 New Mexico Department of Health Racial and Ethnic Health Disparities Report Card August 30, 2006 Acknowledgments Many individuals contributed to the production of this report card and the Office of Policy
Lincoln County. Community Health Assessment
 Community Health Assessment Contents Acknowledgements 1 Introduction 2 Key Informant Health Survey 3 Community Health Data 7 Demographics 8 Substance Abuse 10 Mental Health and Trauma 11 Chronic Disease
2018 Community Health Assessment
 2018 Community Health Assessment Community Health Status Assessment Linn County, IA Prepared by Amy Hockett, PhD, MPH, CHES Epidemiologist Linn County Public Health August 9, 2018 Community Health Status
Oakwood Healthcare Community Health Needs Assessment Indicators
 POPULATION Sub-Category Education Socioeconomic Violence High School High School Dropouts Graduation Rate (Percent) Some College Births to Unmarried Women Children in Poverty Children in Singleparent Households
M.A.P. II. Monitoring and Assessment Project Executive Summary. Infectious Diseases. Chronic Diseases. Tarrant County Public Health
 M.A.P. II Monitoring and Assessment Project 2002-2004 Environmental Health Social & Mental Health Injuries Chronic Diseases County Maternal & Child Health Infectious Diseases County Public Health Safeguarding
LPHA Contractor: Wright County Health Department. LPHA Administrator/Director or Designee: Tracy Hardcastle. Report Prepared By:
 LPHA Contractor: Wright County Health Department LPHA Administrator/Director or Designee: Tracy Hardcastle Report Prepared By: Contact Telephone Number: Date: 1. Please describe (summarize) the methodology
Family Health Centers of Southwest Florida Community Health Assessment Appendix B: Charlotte County Data
 2014 Community Health Assessment Appendix B: Charlotte County Data Prepared by: The Health Planning Council of Southwest Florida, Inc. www.hpcswf.com Table of Contents Charlotte County Demographic and
2016 Collier County Florida Health Assessment Executive Summary
 2016 Florida Health Assessment Executive Summary Prepared by: The Health Planning Council of Southwest Florida, Inc. www.hpcswf.com Executive Summary To access the report in its entirety, visit http://www.hpcswf.com/health-planning/health-planningprojects/.
Pierce County Health Indicators
 Pierce County Health Indicators 3629 S. D. St., Tacoma WA 98418-6813 Phone: 253-798-7668 email: oapi@tpchd.org Demographics Characteristics Latest Year count Percent WA State count Percent Data Source
Pierce County Health Indicators
 Pierce County Health Indicators Updated 11/10/2016 Demographics Characteristics Latest Year count Percent WA State count Percent Total Population 2015 830,120 7,061,408 2015 Total Percent Total Percent
STATE OF THE COUNTY HEALTH REPORT
 STATE OF THE COUNTY HEALTH REPORT 2015 Teresa C. Ellen, RN., MPH Health Director Matthew A. Hojatzadeh, MPH Public Health Educator II Wilson County Health Department 1801 Glendale Dr. SW Wilson, NC 27893
2013 DUPLIN COUNTY SOTCH REPORT
 2013 DUPLIN COUNTY SOTCH REPORT December 2013 State of the County Health Report The State of the County Health Report (SOTCH) provides a snapshot of the health issues affecting the residents of Duplin
HIP Year 2020 Health Objectives related to Perinatal Health:
 PERINATAL HEALTH Perinatal health is the health and wellbeing of mothers and babies before, during, and after child birth. As described by Healthy People 2020, Pregnancy can provide an opportunity to identify
Worcester County Report Card 2012
 Worcester County Report Card 2012 W H Deborah Goeller, R.N., M.S. Health Officer Introduction This community health 2012 Report Card is the fourth published by the Worcester County Health Department. There
Community Health Assessment. May 21, 2014
 Community Health Assessment May 21, 2014 1 Presenters Stacey Adams, MS Co-Leader Domain 1 Carol Heier, LCSW Accreditation Coordinator Dale Quinney, MPH Co-Leader Domain 1 2 Recording available There is
Prepared by Southern Illinois University School of Medicine s Center for Clinical Research And Office of Community Health and Service
 Hospital Sisters Health System Community Health Needs Assessment (FY2015-FY2018) Quantitative and Secondary Data Analysis Report For St. Anthony s Hospital Effingham, Prepared by Southern University School
MARICOPA COUNTY COMMUNITY HEALTH ASSESSMENT. Maricopa County Board of Health July 23, 2012 Eileen Eisen-Cohen, PhD
 MARICOPA COUNTY COMMUNITY HEALTH ASSESSMENT Maricopa County Board of Health July 23, 2012 Eileen Eisen-Cohen, PhD 1 What? Why? We Are Here 2 Local Public Health System Faith Instit. Military Dentists Labs
Baseline Health Data Report: Cambria and Somerset Counties, Pennsylvania
 Baseline Health Data Report: Cambria and Somerset Counties, Pennsylvania 2017 2018 Page 1 Table of Contents Executive Summary.4 Demographic and Economic Characteristics 6 Race and Ethnicity (US Census,
2017 PRC Community Health Needs Assessment
 2017 PRC Community Needs Assessment Obici care Foundation Service Area Western Tidewater, Virginia Prepared for: OBICI HEALTHCARE FOUNDATION By Professional Research Consultants, Inc. The PRC Community
The Health of the Santa Barbara County Community
 The Health of the Santa Barbara County Community WHAT IS OUR COMMUNITY S CURRENT HEALTH? WHAT ARE PRIORITY AREAS TO FOCUS FOR IMPROVEMENT? HOW CAN WE IMPROVE HEALTH IN OUR COMMUNITY? What is Health? Health
HOSPITAL AUTHORITY OF VALDOSTA & LOWNDES COUNTY, GEORGIA COMMUNITY HEALTH NEEDS ASSESSMENT SGMC LANIER CAMPUS
 HOSPITAL AUTHORITY OF VALDOSTA & LOWNDES COUNTY, GEORGIA COMMUNITY HEALTH NEEDS ASSESSMENT SGMC LANIER CAMPUS July 16, 2015 DRAFT Allison McCarthy Principal 70 Old Field Road, Plymouth, MA 02360 Tel/Fax:
Community Health Profile: Minnesota, Wisconsin, & Michigan Tribal Communities 2006
 Community Health Profile: Minnesota, Wisconsin, & Michigan Tribal Communities 26 This report is produced by: The Great Lakes EpiCenter If you would like to reproduce any of the information contained in
Health of the City & Community Health Improvement Planning. Raynard Washington, PhD, MPH Chief Epidemiologist
 Health of the City & Community Health Improvement Planning Raynard Washington, PhD, MPH Chief Epidemiologist What is the Community Health Assessment (CHA)? An annual assessment of population health in
Healthy People Determinants of Health. County Health Rankings. AHR Indicator. Leading Health Indicators (LHI) CROSSWALK
 CROSSWALK") 1 of 7 CROSSWALK Crosswalk comparing America's Health Rankings' (AHR) indicators with those used by County Health Rankings (CHR) and Healthy People 2020's Leading Health Indicators (LHI). AHR indicators
1 of 7 CROSSWALK Crosswalk comparing America's Health Rankings' (AHR) indicators with those used by County Health Rankings (CHR) and Healthy People 2020's Leading Health Indicators (LHI). AHR indicators
Racial/Ethnic Composition South Hayward, 2010
 South Hayward Data Alameda County Public Health Department Community Assessment, Planning, Education, and Evaluation (CAPE) Epidemiology Team May 7, 2014 Racial/Ethnic Composition South Hayward, 2010
2017 STATE OF THE COUNTY HEALTH REPORT
 2017 STATE OF THE COUNTY HEALTH REPORT Hyde County, NC From the Lodge to the Lighthouse We re striving for a healthier Hyde 1 About the Report The State of the County Health (SOTCH) Report is created during
Populations of Color in Minnesota
 Populations of Color in Minnesota Health Status Report Update Summary Fall 2002 Center for Health Statistics Minnesota Department of Health Table of Contents Part I: Birth Related Indicators...1 Low Birthweight...1
2016 PRC Community Health Needs Assessment
 2016 PRC Community Health Needs Assessment Staunton City, Waynesboro City, and Augusta County, Virginia Prepared for: Augusta Health By Professional Research Consultants, Inc. The PRC Community Health
Jackson Hospital Community Health Needs Assessment. Fiscal Year 2016
 Jackson Hospital Community Health Needs Assessment Fiscal Year 2016 JACKSON HOSPITAL AT A GLANCE Jackson Hospital, located in Montgomery, Alabama, is a not-for-profit organization committed to improving
2012 Assessment of St. Lucie County s Social, Health, and Public Safety Services
 2012 Assessment of St. Lucie County s Social, Health, and Public Safety Services April 5, 2013 140 Intracoastal Pointe Drive, Suite 212 Jupiter, FL 33477-5064 561.744.5662 Fax: 561.575.7396 www.sra-researchgroup.com
State of the County Health Report
 Robeson County Department of Public Health Working Together To Create Healthier & Safer Communities Table of Contents Morbidity & Mortality..1 Leading Causes of Death Leading Mortality Trends Top Causes
Racial and Ethnic Health Disparities Report Card
 Racial and Ethnic Health Disparities Report Card August 2010 Acknowledgements Many individuals contributed to the production of this report card. The Division of Policy and Performance wishes to particularly
Community Health Profile: Minnesota, Wisconsin & Michigan Tribal Communities 2005
 Community Health Profile: Minnesota, Wisconsin & Michigan Tribal Communities 25 This report is produced by: The Great Lakes EpiCenter If you would like to reproduce any of the information contained in
2015 United States Fact Sheet
 Fact Sheet Unintentional injuries and violence are the leading causes of death, hospitalization, and disability for children ages -. This fact sheet provides a state snapshot of data on the injury-related
5 Public Health Challenges
 5 Public Health Challenges The most recent Mecklenburg County Community Health Assessment (CHA) prioritized the prevention of premature death and disability from chronic disease as the number one public
Neighbourhood HEALTH PROFILE A PEEL HEALTH STATUS REPORT BRAMPTON. S. Fennell, Brampton Mayor
 Neighbourhood HEALTH PROFILE 2005 A PEEL HEALTH STATUS REPORT BRAMPTON S. Fennell, Mayor This report provides an overview of the health status of residents of, including: Socio-demographic facts Reported
Health Care in Appalachia. Foundations of Modern Health Care, Lecture 12 Anya K. Cope, DO
 Health Care in Appalachia Foundations of Modern Health Care, Lecture 12 Anya K. Cope, DO Learning Objectives: At the completion of this exercise, learners should be able to: Discuss the mortality rates
How Wheaton Franciscan is meeting the NEEDS of our community. NSWERING HE CALL
 ANSWERING THE CALL MEETING OUR COMMUNITY NEEDS S July 1, 2013 June 30, 2016 How Wheaton Franciscan is meeting the NEEDS of our community. NSWERING HE CALL COMMUNITY HEALTH NEEDS IMPLEMENTATION PLAN: ST.
GASTON COUNTY STATE OF THE COUNTY HEALTH REPORT
 GASTON COUNTY STATE OF THE COUNTY HEALTH REPORT 2016 Overview The Gaston County Department of Health and Human Services (DHHS) is a consolidation of Gaston County Social Services and Public Health and
Our Healthy Community Partnership. and the Brown/Black Coalition are. pleased to release the Douglas County Health and
 Our Healthy Community Partnership and the Brown/Black Coalition are pleased to release the 2007 Douglas County Health and Disparities Report Card. This report provides a snapshot of local disparities in
Racial disparities in health outcomes and factors that affect health: Findings from the 2011 County Health Rankings
 Racial disparities in health outcomes and factors that affect health: Findings from the 2011 County Health Rankings Author: Nathan R. Jones, PhD University of Wisconsin Carbone Cancer Center Introduction
Bernalillo County Community Profile
 County Community Profile Introduction This profile describes the current health status of the county. With this information, the community can complete an assessment and begin to address specific issues
Summary of Findings. Significant Health Needs of the Community. Areas of Opportunity Identified Through This Assessment. Healthy Lifestyles
 Summary of Findings Significant Health Needs of the Community The following areas of opportunity represent the significant health needs of the community, based on the information gathered through this
Redington-Fairview General Hospital Community Health Needs Assessment Annual Report
 Redington-Fairview General Hospital 2017 Community Health Needs Assessment Annual Report Original Community Needs Assessment: November 2007 Updated: January 2010; April 2012, September ; August 2015; July
Clark County Community Health Status Assessment
 2012 Clark County Community Health Status Assessment Southern Nevada Health District Office of Epidemiology 5/29/2012 Authors Nancy Williams, MD, MPH Patricia Rowley, BS Contributors Brian Labus, MPH Zuwen
Baptist Health Jacksonville Community Health Needs Assessment Implementation Plans. Health Disparities. Preventive Health Care.
 Baptist Health Jacksonville Community Health Needs Assessment Implementation Plans Health Disparities Infant Mortality Prostate Cancer Heart Disease and Stroke Hypertension Diabetes Behavioral Health Preventive
Manatee County Community Health Assessment 2015
 Manatee County Community Health Assessment 2015 W E L L N E S S C O M M I T T E E M A N A T E E H E A L T H C A R E A L L I A N C E 7 / 3 0 / 1 5 Overview Background 4 Subcommittee Findings Community Health
RURAL HEALTH CARE. Lanis L. Hicks Professor Department of Health Management and Informatics. October 9, 2002
 RURAL HEALTH CARE Lanis L. Hicks Professor Department of Health Management and Informatics October 9, 2002 URBANIZATION LEVELS DEFINED LARGE CENTRAL METRO Counties in large metropolitan areas (1 million
PHACS County Profile Report for Searcy County. Presented by: Arkansas Center for Health Disparities and Arkansas Prevention Research Center
 PHACS County Profile Report for Searcy County Presented by: Arkansas Center for Health Disparities and Arkansas Prevention Research Center Contents Introduction... Page 2 Demographics...Page 3 Social Environment
Randolph County. State of the County Health Report 2014
 Randolph County State of the County Health Report 2014 Inside this issue: Priority Areas 2-4 Overweight and Obesity Data 5 Physical Activity 6 Substance Abuse 7 Access to Care 8 Morbidity and Mortality
Health Status of New Mexico 2015
 Health Status of New Mexico 2015 New Mexico Health s Northwest Northeast Metro Southwest Southeast NM Urban-Rural County Classification Metropolitan Counties Small Metro Counties Mixed Urban/Rural Counties
Nutrition and Physical Activity
 Nutrition and Physical Activity Lifestyle choices made early in life have a significant impact on the patterns of chronic disease developed in adulthood. In the U.S., poor diet and physical inactivity
799 N. Highland Avenue, Winston-Salem, NC Tel: Fax: Mr. Marlon Hunter Health Director
 2015 Forsyth County State of the County Health (SOTCH) Report 799 N. Highland Avenue, Winston-Salem, NC 27101 Tel: 336 703 3100 Fax: 336 748 3292 Mr. Marlon Hunter Health Director Table of Contents Introduction.....2
Sierra County Community Health Profile
 Sierra County Community Health Profile Introduction This profile describes the current health status of the county. With this information, the community can complete an assessment and begin to address
Annual Report. Fiscal Year 2010 July 1, 2009 June 30, Dorchester County Health Department
 Annual Report Dorchester County Health Department Fiscal Year 2010 July 1, 2009 June 30, 2010 Dorchester County Health Department 3 Cedar Street Cambridge, MD 21613 (410) 228-3223; Fax (410) 228-9319 Dorchester
Platte Valley Medical Center Page 0
 Platte Valley Medical Center Page 0 Table of Contents Introduction 4 Background and Purpose... 4 Service Area... 4 Map of the Service Area...5 Project Oversight...5 Consultants... 6 Identification of Community
Arizona Health Improvement Plan
 Arizona Health Improvement Plan Arizona Alliance for Community Health Centers February 4, 2015 Will Humble, MPH ADHS Director Leading Health Issues State Health Assessment Obesity Behavioral Health Services
THE HEALTH OF LINN COUNTY, IOWA A COUNTYWIDE ASSESSMENT OF HEALTH STATUS AND HEALTH RISKS
 THE HEALTH OF LINN COUNTY, IOWA A COUNTYWIDE ASSESSMENT OF HEALTH STATUS AND HEALTH RISKS Project Team Pramod Dwivedi, Health Director Amy Hockett, Epidemiologist Kaitlin Emrich, Assessment Health Promotion
University of Wisconsin School of Medicine and Public Health The County Health Rankings Model of Population Health
 University of Wisconsin School of Medicine and Public Health The County Health Rankings Model of Population Health Institute of Medicine January 21, 2010 Washington DC Outline Background and rationale
El Paso County Health Indicators 2012 Report
 El Paso County Health Indicators 2012 Report El Paso County Health Indicators 2012 Report The print report is available on El Paso County Public Health s website: www.elpasocountyhealth.org These slides
County Health Rankings Monroe County 2016
 Health Rankings Monroe 2016 Graphics of Health Rankings Include All Counties In the North Central Health District Public Health for Middle Georgia Serving Baldwin, Bibb, Crawford, Hancock, Houston, Jasper,
Cambridge Health Indicators 2015
 Cambridge Health Indicators 2015 Cambridge Health Indicators Broad Measures of Health for Cambridge, Massachusetts, and the United States Division of Epidemiology & Data Services November 2015 Claude-Alix
Health System Members of the Milwaukee Health Care Partnership
 Health System Members of the Milwaukee Health Care Partnership Aurora Health Care Children s Hospital of Wisconsin Columbia St. Mary s Health System Froedtert Health Wheaton Franciscan Healthcare In Collaboration
Progress Tracker. Photo - https://www.healthypeople.gov/
 Progress Tracker Healthy People provides a framework for prevention for communities in the U.S. Healthy People 2020 is a comprehensive set of key disease prevention and health promotion objectives. The
Health Status Disparities in New Mexico Identifying and Prioritizing Disparities
 Health Status Disparities in New Mexico Identifying and Prioritizing Disparities Public Health Division March 23 Health Status Disparities in New Mexico Identifying and Prioritizing Disparities New Mexico
Report Card of Community Health Indicators March 2001
 Report Card of Community Health Indicators March 2001 Building Healthier Communities Janet S. Owens County Executive Frances B. Phillips, R.N., M.H.A. Health Officer Anne Arundel County Department of Health
2010 Mecklenburg County Health Department Community Report Appointments: General Information:
 2010 Mecklenburg County Health Department Community Report Appointments: 704-336-6500 General Information: 704-336-4700 meckhealth.org twitter.com/meckhealth Table of Contents Message from the Health Director
Executive Summary To access the report in its entirety, visit
 Executive Summary To access the report in its entirety, visit http://www.hpcswf.com/health-planning/health-planningprojects/. Demographic and Socioeconomic Characteristics Population Demographics has a
State of the County Health Report
 2 0 1 7 State of the County Health Report The 2017 State of the County Health (SOTCH) Report is a review of health indicators pertaining to residents of and counties. The purpose of this report is to track
Centers for Disease Control and Prevention (CDC) Coalition C/o American Public Health Association 800 I Street NW Washington, DC,
 Coalition C/o American Public Health Association 800 I Street NW Washington, DC,") Centers for Disease Control and Prevention (CDC) Coalition C/o American Public Health Association 800 I Street NW Washington, DC, 20001 202-777-2514 Donald Hoppert, Director of Government Relations, American
Centers for Disease Control and Prevention (CDC) Coalition C/o American Public Health Association 800 I Street NW Washington, DC, 20001 202-777-2514 Donald Hoppert, Director of Government Relations, American
County Health Rankings Baldwin County 2016 Graphics of County Health Rankings Include All Counties In the North Central Health District
 Health Rankings Baldwin 2016 Graphics of Health Rankings Include All Counties In the North Central Health District Public Health for Middle Georgia Serving Baldwin, Bibb, Crawford, Hancock, Houston, Jasper,
Racial and Ethnic Health Disparities Report Card, 7th Edition
 Racial and Ethnic Health Disparities Report Card, 7th Edition September 2012 Department of Health 1190 South St. Francis Drive Santa Fe, NM 87502 www.nmhealth.org/opa/ Produced by the Office of Health
Community Health Needs Assessment (CHNA)
") Community Health Needs Assessment (CHNA) Pierce ; St. Croix Contents Demographics... 3 Total Population... 4 Median Age... 6 Population Under Age 18... 8 Population Age 65+... 9 Population with Any Disability...
Community Health Needs Assessment (CHNA) Pierce ; St. Croix Contents Demographics... 3 Total Population... 4 Median Age... 6 Population Under Age 18... 8 Population Age 65+... 9 Population with Any Disability...
Brant County Community Health Status Report: 2001 OVERVIEW
 Brant County Community Health Status Report: 2001 OVERVIEW Brantford County of Brant Brant County Health Unit and Grand River District Health Council April 2001 Brant County Community Health Status Report:
Multnomah County Health Department. Report Card on Racial and Ethnic Health Disparities. April 2011
 Multnomah County Health Department Report Card on Racial and Ethnic Health Disparities April 2011 Lillian Shirley, Director, Multnomah County Health Department Sandy Johnson, Office of Health and Social
Summit County Public Health
 Page 1 Death and Life Expectancy Summit County Public Health Population Health Vital Statistics Brief: VOLUME 1: DEATH AND LIFE EXPECTANCY Summit County Public Health Population Health Division 1867 W.
Racial and Ethnic Health Disparities Report Card, 6th Edition
 Racial and Ethnic Health Disparities Report Card, 6th Edition September 2011 Acknowledgements Many individuals contributed to the production of this report card. The Office of Policy and Performance wishes
Rockford Health Council
 2010 Healthy Community Study Rockford Area Early Learning Council Becky Cook Kendall April 12, 2011 Rockford Health Council Community-based healthy community collaborative Formed in 1982 as the Rockford
Mora County Community Health Profile
 Mora County Community Health Profile Introduction This profile describes the current health status of the county. With this information, the community can complete an assessment and begin to address specific
2012 Community Health Needs Assessment of St. Vincent North Primary Service Area. St. Vincent Health System Catholic Health Initiatives
 2012 Community Health Needs Assessment of St. Vincent North Primary Service Area St. Vincent Health System Catholic Health Initiatives May 2012 2012 Community Health Needs Assessment of St. Vincent North
Los Alamos County Community Health Profile
 Los Alamos County Community Health Profile Introduction This profile describes the current health status of the county. With this information, the community can complete an assessment and begin to address
Colorado Health Disparities Profiles
 Health Disparities Profiles includes: Larimer County Population Total Population Source: CDC/NCHS 2007-based, bridged-race population estimates, 2007. Social Determinants of Health 287,574 248,312 26,629