Supplementary appendix
|
|
|
- Geoffrey Newton
- 5 years ago
- Views:
Transcription
1 Supplementary appendix This appendix formed part of the original submission and has been peer reviewed. We post it as supplied by the authors. Supplement to: Singh S, Shekhar C, Acharya R, et al. The incidence of abortion and unintended pregnancy in India, Lancet Glob Health 2018; 6: e
2 Appendix: The Incidence of abortion and unintended pregnancy in India, 2015 Overview Appendix Part 1 describes the methodology used to estimate the incidence of abortion, total pregnancy and unintended pregnancy in India. Part A is organized according to the three major components used to estimate abortion incidence in India. For each component, we discuss data sources, adjustments to available data, sensitivity analyses and in the case of one component, how state-level estimates were used to calculation national results. Component 1: Facility based abortions. These include induced abortion performed in facilities with the capability of performing abortion services: public and private hospitals, clinics, community health centers, primary health centers, maternity and nursing homes, medical colleges and few other types of facilities. Component 2: Medication abortions outside facilities. These include abortions using medication abortion drugs, obtained and administered outside of government, private and nonprofit health facilities. Component 3: Other abortions. These abortions are those obtained outside of health facilities and are not medication abortions. They may include abortions using a range of methods used by other non-medical providers or self-induced abortions. Part B discusses calculations for estimating the national total number and rates of abortion, total pregnancy and its components, intended and unintended pregnancy in India in Appendix Part 2 provides detail about the design and implementation of the Health Facility Survey (HFS). It includes information about the sample design; existing lists of facilities and a listing activity, which was undertaken for some categories of facilities for which lists of the universe of facilities do not exist; results of the fieldwork; and the calculation of sample weights. Appendix Part 3 provides the Hindi/English version of the Health Facility Survey questionnaire. The questionnaire was also translated into the languages of the study states for Assam, Gujarat and Tamil Nadu. 1
3 Appendix Part 1: Methodology for estimating incidence of abortion and pregnancy Content Part A. Estimating state-level abortion incidence... 4 A.1 Component 1: Facility-based abortions... 4 A.1.1 NGO sector facility-based abortions... 4 A.1.2 Public and private sector facility-based abortions from Health Facilities Survey (HFS) for six surveyed states... 4 Table A.1 Universe of facilities and completed number of interviews, HFS, for each of six focus states, India Table A.2 Total number of induced abortions estimated HFS, six surveyed states... 5 A.3 Scaling up public and private sector facility based abortions... 6 Table A.3 Geographic regional grouping of surveyed and non-surveyed states... 6 A.1.3a Universe of health facilities... 6 A.1.3b Assumptions and calculations to scale up from surveyed to non-surveyed states... 7 Table A.4 Example of estimating facility universes, and abortion caseloads and total abortions in nonsurveyed states... 7 A.1.4 National estimates of facility-based abortions... 9 Table A.5 Facility based abortion in six regions and nationally... 9 A.1.5 Computing standard errors for HFS estimates Table A.6 Total number of MTPs, standard errors and confidence intervals around MTP totals, six surveyed states... 5 A.2 Component 2: Medication abortion outside of health facilities A.2.1 Data sources A.2.1a For profit sector drug sales A.2.1b Nonprofit sector drug sales A.2.2 Data adjustments to MA drug sales A.2.2a Adjustments to IMS drug sales data A.2.2b Adjustments to for-profit and nonprofit MA data combined A.2.3 Calculating component 2: Medication abortion outside facilities A.2.4 Results: Medication abortion outside facilities Table A.7 Medication abortions outside of facilities in six regions and nationally A.3 Component 3: Other induced abortions A.3.1 Indirect estimate of the proportion of other abortions Table A.8 Other types of abortion in six regions and nationally A.3.2 Sources explored and found to be not usable A.4 Sensitivity analysis
4 A.4.1 Variables used in sensitivity analysis Table A.9 Variables used in sensitivity analyses on abortion estimates A.4.2 Calculation of total number of abortions and upper and lower bound estimates Table A.10 Medium, low and high estimates of the number of abortions and abortion rates for the six study regions, Part B. National Estimates of Abortion, Pregnancy and Unintended Pregnancy, B.1 National estimates of the number and rate of abortion Table A.11 National medium, low and high estimates of the number of abortions and the abortion rate for India, B.2 Estimating Pregnancy at the National Level B.3 Estimating intended and unintended pregnancies Table A.12 Pregnancy Rates and number of pregnancies by component, for the six study regions and national estimates,
5 Part A. Estimating the Three Components of Abortion Incidence A.1. Component 1: Facility-based abortions Facility-based abortions comprise those that are provided in facilities in the public and private sectors and those in NGO facilities. Our estimates of abortions in public and private sector facilities, from a Health Facility Survey (HFS) of a representative sample of these facilities conducted in six states: these six states represent major regions, and as described below, national estimates were obtained by weighting up from the six states to all states in the country. NGO service provision data were obtained separately (described in A.1.2), to supplement the data collected in the HFS. To ensure no duplication of facilities occurred between these two data sources, NGO facilities captured in the HFS were carefully crosschecked with the NGO service provision data. A.1.1 NGO sector facility-based abortions National and state-level data were obtained for 2015 on the total number of surgical and medication abortions provided by NGOs in their own clinics. NGOs for which we obtained data include Family Planning Association of India (FPAI), Janani, Marie Stopes International (MSI), Population Health Services India (PHSI), Parivar Seva Santha (PSS), World Health Partners (WHP) and MSI Franchise clinics. These data include the total number of abortions provided, by NGO clinics by state for all states in India. The national-level distribution by abortion method among each NGO was also provided. In order to calculate the number of medication and surgical abortions provided by each NGO at the state-level, we assume the distribution by method in each state is equal to that at the national level. Applying this distribution to the total number of abortions as reported by NGOs in each state, allowed us to estimate the number of medication and surgical abortions occurring in such facilities in the six study states in A.1.2 Public and private sector facility-based abortions from HFS for six surveyed states The HFS was our primary data source for facility-based abortions. It was conducted in six states Assam, Bihar, Gujarat, Madhya Pradesh, Tamil Nadu and Uttar Pradesh that comprise about 45% of the population of women (See Appendix Part 2 for a full description of the design of the survey). These six states were selected to represent six major regions with the goal of generalizing from each to their respective regions, for Component 1, facility based abortions. In addition to geographic location, population size and key sociodemographic characteristics were used to select the six states to represent their respective regions. The HFS collected data on the number of induced abortion patients served, by type of procedure (surgical abortion and medication abortion) in 4,001 public and private health care facilities (Table 1.1). The sample of facilities was designed to provide representative data from all public and private health facilities in each state, for the purpose of estimating the total number of facility-based abortions in each state. The sample included facilities that were both registered and unregistered to provide MTP. A small number of NGO facilities were captured by the HFS sample, but upon further checking some of these were found to be not NGO facilities but rather Trust facilities and other types of public facilities, and were accordingly reclassified. A few others that were confirmed to be NGO facilities were crosschecked with our separately collected NGO data from large NGO networks (not included in the HFS) and were confirmed to be unique facilities, non-duplicative of clinics operated by the large NGO networks that were already covered. These few facilities were treated as private facilities and weighted accordingly. 4
6 Table 1.1. Universe of facilities and completed number of interviews, Health Facilities Survey, for each of six focus states, India 2015 Facility ownership State Public Private Total Assam Bihar Gujarat Madhya Pradesh Tamil Nadu Uttar Pradesh Total in Six Focus States Universe 1, ,688 Completed interviews Universe 2,127 2,919 5,046 Completed interviews Universe 1,557 2,270 3,827 Completed interviews Universe 1,897 3,422 5,319 Completed interviews Universe 2,264 3,853 6,117 Completed interviews Universe 5,092 8,695 13,787 Completed interviews ,222 Universe 14,244 21,540 35,784 Completed interviews 2,046 1,955 4,001 Calculating annual number of abortions per facility The HFS obtained from each surveyed facility the number of women who received induced abortions in the past month or year, and in the average month or year. Our calculations to estimate the total annual number of MTPs in facilities uses both of these questions. We first convert the data to annual caseloads, multiplying caseloads that were reported for the past and average month by 12, and combining these with responses reported for the past and average year. We then take the average of the number of MTPs reported in the past and average year as the best estimate of the total annual number of MTPs in each facility. We then apply sample weights to obtain total estimates at the state level, by type of facility and ownership (Table 1.2). For information on weights, see Appendix Part 2. Table 1.2. Total number of induced abortions provided in public and private sector facilities, estimated HFS, six surveyed states State Induced abortions Assam 122,291 Bihar 185,169 Gujarat 120,758 Madhya Pradesh 265,421 Tamil Nadu 224,975 Uttar Pradesh 346,352 5
7 A.1.3. Scaling up public and private sector facility based abortions We used results from the six states covered by the HFS to develop estimates for all states in India. The process of scaling up involved three assumptions: (1) that each surveyed state represented other non-surveyed states in its region; (2) that for types of facilities for which there is no known universe (primarily private sector and a few types of public sector facilities) -- the average population ratio of women per facility of each type in the surveyed states represented the ratio of women per facility of that same type in the non-surveyed states in the region (Tables 1.3 and 1.4); and (3) that average caseloads for each type of facility in the surveyed states represent the average caseload for the same facility type in non-surveyed states in a region. Table 1.3. Geographic regional grouping of surveyed and non-surveyed states Geographic region Surveyed state States not surveyed Northeast Assam Arunachal Pradesh, Manipur, Meghalaya, Mizoram, Nagaland, Sikkim and Tripura North Uttar Pradesh Chandigarh, Delhi, Haryana, Himachal Pradesh, Jammu & Kashmir, Punjab, Rajasthan and Uttarakhand East Bihar Jharkhand, Odisha and West Bengal Central Madhya Pradesh Chhattisgarh West Gujarat Goa and Maharashtra South Tamil Nadu Andhra Pradesh & Telangana, Karnataka, Kerala and Pondicherry A.1.3a Universe of health facilities For each state not surveyed, we used several sources and methods to obtain or estimate the total number of facilities of each type. Facility types with available universes There are known universes of major types of public sector facilities (District Hospitals, Subdivisional hospitals, community health centers, primary health centers), Medical Colleges and Employees State Insurance Corporation (ESIC) hospitals. The Health Management Information System (HMIS), a division of the Indian Ministry of Health and Family Welfare provides updated lists of the first four types of public sector facilities listed above, for all states in the country. ESIC hospital lists are available on government websites and lists of public and private medical colleges are available on the Medical Council of India website. Facility types with no available universe There are no data available on the universe of other types of public sector facilities (railway and tea hospitals, urban health centers as well as a few other types of facilities (few in number and grouped together) or of private facilities (hospitals, nursing/maternity homes and clinics). To estimate the number of private urban facilities in the surveyed states, we calculated the ratio of the urban population per urban facility of each type for each of the three city size 6
8 strata used in the listing exercise (See Appendix Part 2): 5,000 to 100,000 population, 100,000 to 1,000,000 population and more than 1,000,000 population. We applied this ratio from the surveyed state in each region to the urban populations of non-surveyed states in the same region to calculate the universe of urban private facilities in the non-surveyed states. To illustrate: if the ratio of population to urban private hospitals in large cities (population = more than 1 million) is 1: 9,234 in Madhya Pradesh, and the urban population of large cities (1,000,000+) in Chhattisgarh (one of the non-surveyed states within the Central region), is 1,122,555, then the total number of urban private hospitals in large cities in Chhattisgarh would be (1,122,555/9,234) =122 (Table 1.4). For rural private facilities we were able to use the same principle described above, but we used the total rural population in each state as the base for the ratio of population to facility. A.1.3b Assumptions and calculations to scale up from surveyed to non-surveyed states General approach for all regions except Northeast The average abortion caseload for a facility type in a surveyed state was assumed to be the same for the corresponding facility type in each non-surveyed state in a given region.(1) For example, if district hospitals in Madhya Pradesh had an average MTP caseload of 200 per year, then we assumed a district hospital in Chhattisgarh would have the same average caseload (Table 1.4). Within a given region, the average caseload for each facility type in the surveyed state was multiplied by the total number of facilities within that facility type in each non-surveyed state to estimate the total number of MTPs by facility type in non-surveyed states. The estimated MTP counts for each non-surveyed state were divided into annual totals of surgical and medication abortion assuming the same distribution by method as estimated by the HFS for the surveyed state. These annual numbers of surgical, medication and other abortions are used later in incidence calculations. Table 1.4. Example of estimating facility universes, abortion caseloads and total abortions in non-surveyed states. CENTRAL REGION Total urban or rural population Universe of facilities* Population per Facility Weighted total annual number of MTPs Average Annual MTP caseload Total urban or rural population Universe of facilities* Calculated total annual number of MTPs CHHATTISGARH (NOT FACILITY TYPE MADHYA PRADESH (SURVEYED) SURVEYED) MAJOR PUBLIC FACILITIES 1,603 53, ,895 District Hospital Sub-divisional Hospital Community Health Center Primary Health Center, 24x7 Primary Health Center, non-24x7 URBAN OTHER PUBLIC FACILITIES Urban Facility (5K-100K) 51 13, , , , , , , , , , ,175 8,873, , ,585,
9 Urban Facility (100K-1M) Urban Facility (1M+) ESIC Hospital URBAN PRIVATE FACILITIES Towns 5K-100K Hospital Nursing/Maternity Home Clinic Towns 100K-1M Hospital Nursing/Maternity Home Clinic Towns 1M+ Hospital Nursing/Maternity Home Clinic RURAL PRIVATE FACILITIES Hospital Nursing/Maternity Home 5,299, ,212 3, ,167, ,380 5,864, ,977 9, ,122, , , , ,347 8,873, ,369 19, ,585, ,820 8,873, ,765 30, ,585, ,968 8,873, ,961 6, ,585, ,020 5,299, ,888 20, ,167, ,296 5,299, ,568 17, ,167, ,018 5,299, ,536 4, ,167, ,770 5,864, ,234 49, ,122, ,438 5,864, ,643 14, ,122, ,791 5,864, ,557 16, ,122, , , ,444 52,537, ,108 10, ,603, ,030 52,537, ,926 2, ,603, Clinic 52,537, ,576 1, ,603, OTHER TYPES OF FACILITY 15 3, ,134 Medical College** Public Medical 15 3, , , Private Medical 6 1, TOTAL 5, , ,049 86,995 *Major public facilities, ESIC hospitals and all medical colleges use known universes and private hospitals, clinics, nursing and maternity homes as well as other types of urban public facilities use estimated universes ** Public and private Medical Colleges were combined when calculating average MTP caseloads. Additional assumption for states within the Northeast region In the Northeast region, the surveyed state, Assam, is by far the largest and most urban state in the region, accounting for about two-thirds of the region s population. The other seven states have much smaller ratios of population to public facilities compared to Assam. Because of these factors, we made a further adjustment to the caseload for facilities in the seven small Northeast states assuming that facilities in these seven states would have smaller caseloads than Assam: The annual caseload for each type of public facility (except for medical colleges) were reduced proportional to each state s ratio of their population of women ages to that of Assam. For private facilities and urban public facilities, the ratio used was of the non-surveyed states urban population to Assam s urban population in cities of the same size. 8
10 For example, district hospitals in Assam had an annual MTP caseload of 27,047, and Mizoram s female population of reproductive age is 3.6% of Assam s, the caseload for district hospitals in Mizoram would be 3.6% of 27,047, or 993. To estimate the caseloads in private facilities of all types and urban public facilities in the non-surveyed states, the ratio of the non-surveyed states total urban population in small cities (the seven non-surveyed states in the Northeast have overall small populations, and only had towns in the size range of 5,000 to 100,000 total population ) to Assam s urban population in cities of the same size was calculated and applied to the total caseloads in those types of facilities in small cities in Assam. For example, the total annual MTP caseload in private hospitals in urban areas of 5,000 to 100,000 population was 1,633 in Assam, and the urban population in Manipur is 22.1% of that in Assam, then the total MTP count in urban private hospitals in Manipur is 18.8% of 1,633, or 307. Only four of the non-surveyed states had medical colleges in the Northeast region. Because of the unique role that medical colleges play in service provision in general, we assumed that the annual caseload of medical colleges in non-surveyed states would be the same as the average caseload for this type of facility in Assam. A.1.4. National estimates of facility-based abortions The total annual number of MTPs were summed across all facility types to estimate the total number of MTPs for that state. Then, the total annual number of MTPs in all states (surveyed and non-surveyed) in each region were summed to estimate the total annual number of MTPs for that region. Then, the regional totals were summed to provide national estimates of public and private health facility-based abortions. These totals were combined with the NGO abortion service data to produce region-specific and national estimates of all facility-based abortions in India (Table 1.5). Table 1.5. Facility based abortion in six regions and nationally State HFS Source NGO Total facility based abortions Northeast 195, ,675 East 866,242 30, ,568 West 333,514 10, ,652 Central 352,416 18, ,063 South 704,947 7, ,553 North 824,884 30, ,921 India (national) 3,277,979 97, ,252 A.1.5. Computing standard errors for HFS estimates The computation of standard errors, requires that we make adjustments for the design of the probability sample in our study the HFS. To collect the HFS data, we used a probability proportional to size (PPS) sampling method to select districts in a state (see Appendix Part 2 for a full description). In each of the six states, we selected 70% of all districts, from which to sample facilities. All facilities in our sample were obtained from this 70% sample of districts, except two types of facilities: medical colleges and ESIC hospitals. ESIC hospitals are public sector facilities that cater to specific groups of government employees, such as military personnel or railway employees. 9
11 We conducted a census of all medical colleges and ESIC hospitals in each of the states in our sample, regardless of location, and they were selected with 100% probability into our sample. In order to make sample design adjustments, we ordered all selected districts by size, from the largest to the smallest. We treated district size as the strata, and grouped adjacent pairs of districts in one strata. If the last district in the list did not have a pair, it was included in the strata with the previous pair of districts. Therefore each strata had at least two districts and sometimes three. Each district was treated as the cluster from which we sampled facilities. All medical colleges and ESIC hospitals in a state were treated as being grouped into one strata, regardless of location. Every medical college and ESIC hospital was treated as an independent cluster within that strata. We also made finite population corrections (fpc) to adjust for correlation between samples. A variable was created to make this adjustment with a value set to 0.7 for those clusters that were part of the 70% sample of districts. For the clusters in the census group, the value of the variable was set to 1. The strata, cluster and fpc variables were included while estimating the state-level statistics to obtain the associated standard errors and confidence intervals (Table 1.6). Table 1.6. Total number of MTPs, standard errors and confidence intervals around MTP totals, six surveyed states State Total number of MTPs Standard Error Coefficient of Variation 95% Confidence Interval Assam 122,291 12,338 10% 100, ,022 Bihar 185,169 18,859 10% 153, ,586 Gujarat 120,758 13,198 11% 98, ,378 Madhya Pradesh 265,421 19,224 7% 232, ,876 Tamil Nadu 224,975 19,451 9% 192, ,487 Uttar Pradesh 346,352 44,707 13% 271, ,434 A.2. Component 2: Medication abortion outside of health facilities A.2.1 Data sources National-level data for medication abortion (MA) drug sales were obtained from both for-profit and nonprofit sectors. A.2.1a For profit sector drug sales We obtained MA drug sales data from IMS Health, a company that compiles and provides health service data, and routinely captures sales of medication abortion drugs by the for-profit sector. IMS Health estimates that their numbers represent 95% of sales in the for-profit market; they supply distributors who in turn sell to smaller distributors, and do not include government tenders. Data on sales of the combined regimen of mifepristone and misoprostol, known as combipacks (each containing the correct dosage for one abortion), as well as mifepristone tablets alone (which induce abortion when combined with misoprostol) were obtained for 2015, for all states in India. These data comprise all sales within India, and exclude formally exported commodities. A.2.1b Nonprofit sector drug sales We obtained national-level data (i.e. not state-specific) on the number of MA drugs distributed by four major nonprofit organizations who are active in this field Population Services International (PSI), WHP, PSS and Janani. In addition, DKT International and MSI both provided data on their own distribution of MA drugs by state (DKT s 10
12 own distribution channel is known as A-Kare). Although only national-level data on MA drug sales are available for the four aforementioned nonprofit organizations it is important to incorporate these sources because they together comprise 25% of all NGO MA drug distribution. A.2.2. Data adjustments to MA drug sales Several adjustments needed to be made to the MA drug sales data provided by IMS Health, DKT and MSI. These adjustments were made based on both expert opinion and assumptions that the study team made about the distribution of MA across states and the flow of MA drugs within India and to neighboring countries. A.2.2a Adjustments to IMS Health drug sales data 1. Because IMS Health report that their drug sales data only cover 95% of all for-profit drug sales in India, the total MA drug sales were increased by 5% to account for incomplete data. 2. The number of mifepristone-only abortions were reduced to account for women taking more than one mifepristone tablet per abortion. While one 200mg mifepristone tablet is medically indicated for an abortion, evidence suggests that some women may be instructed by providers, based on the providers experiences or opinions, to take more than one pill at a time for one induced abortion(2). Based on the available evidence, and expert opinion, we estimate that 80% of women taking mifepristone for an abortion will take one pill, 10% will take two pills and 10% will take three pills per abortion(3). Thus, for every 130 mifepristone pills sold, there are an estimated100 medication abortions using mifepristone alone. 3. MA drug sales in states that border Nepal were reduced to account for illegal cross-border sales to Nepal. While IMS drug sales data do not cover legally exported commodities, they do include drugs that are sold within India and then subsequently exported on the black market to neighboring countries. This necessitated further adjustments to reduce the number of MA drugs sold in India that were actually being used by women in Nepal. Data from Nepal indicate that 25% of medication abortion drugs (72,000 packets) sold in 2015 were unregistered drugs that had been imported illegally from India.(4,5) Four states in India border Nepal and would likely be the sources of these MA drugs: Bihar, Uttar Pradesh, Uttarakhand and West Bengal. We reduced the number of IMS drug sales in each of these four states by 18,000 MAs to account for this export. 4. A similar adjustment was made to the MA drug sales in states that border Bangladesh. There is also evidence that a portion of MA drugs used in Bangladesh, come from India through illegal cross-border sales.(6) Four states in India share a border with Bangladesh and would likely be the sources of these MA drugs: West Bengal, Assam, Meghalaya and Tripura. Using data from the 2014 Bangladesh Health Facilities Survey and Health Professionals Survey, we estimated around 21,000 illegal medication abortions (MAs) in the divisions in Bangladesh that border West Bengal, and around 30,000 in the divisions that border Assam, Meghalaya and Tripura.(7,8) Based on advice from experts who are knowledgeable on abortion in Bangladesh, the assumption was made that 10% of these illegal MAs are from drugs that were illegally exported from West Bengal and Assam.(5) Among the Northeast states that share a border with Bangladesh, we reduced the number of IMS drug sales from Assam only because it accounts for nearly 70% of all MA drug sales in the Northeast region and we assume that drugs are passing from Assam through Meghalaya and Tripura before crossing over the border to Bangladesh. Thus, we reduced the IMS drug sales in these two states by about 2,100 in West Bengal (10% of the estimated 21,000 illegal MAs in Bangladesh districts bordering West Bengal) and 3,000 in Assam (10% of the estimated 30,000 illegal MAs in Bangladesh districts bordering Assam). A.2.2b Adjustments to for-profit and nonprofit MA data combined 1. Sales of MA drugs for both the for-profit and nonprofit segments were reduced by 10% to account for wastage or non-use based on available literature sources.(9,10) 2. Five percent of all facility-based abortions captured by both the HFS and NGO service provision statistics were removed from the number of abortions estimated based on MA drug sales data. There is evidence that around 5% of women seeking abortion in health facilities in India have already bought MA from a 11
13 chemist or informal vendor and attempted an abortion and failed.(11) To account for this, and to avoid double counting these women in our estimates, we reduced the total number of medication abortions based on drug sales by 5% of the total number of facility-based MTPs. A.2.3 Calculating component 2: Medication abortion outside facilities The second component of our estimate of induced abortion in India is the number of MAs occurring outside facilities. To estimate this component, and because MAs occurring in health facilities were already included in component 1, the total MA drug sales data was reduced by the number of medication abortions occurring in health facilities. To do this: 1. The number of medication abortions occurring in private and NGO health facilities (as estimated from the HFS and NGO clinic data), were removed from the total number of abortions based on MA drug sales, to avoid duplication. 2. The number of medication abortions provided as a prescription in public sector health facilities (as estimated from the HFS) were also removed from the total number of abortions based on MA drug sales to avoid double-counting these abortions. Although these MA drugs are bought outside of facilities, the women obtaining them received care and instructions from a health provider at a facility and are therefore counted in the public facility-based number of medication abortions. MA abortions that are conducted at public facilities, however, were not reduced from the drug sales data because the public sector obtains its supplies of MA drugs through a system of government tenders that is separate from IMS drug sales. A.2.4. Results: Medication abortion outside facilities The result is our best estimate of component 2: the number of medication abortions occurring outside of health facilities a (Table 1.7). Table 1.7. Medication abortions outside of facilities in six regions and nationally Regions Medication Abortions Northeast 578,882 East 2,705,215 West 1,358,616 Central 1,061,694 South 1,844,145 North 3,913,693 India (national) 11,462,245 A3. Component 3: Other induced abortions This component comprises women who obtain abortions using methods other than MA from sources other than health facilities of the categories that were surveyed by the HFS. While it is generally considered that this group is now extremely small, as use of MA rose rapidly in the past decade, there are no broad based studies that directly quantify the size of the group of women having this type of abortion. The percent of women in this group was therefore estimated using an indirect approach, since it could not be estimated directly using data from our surveys or other data sources. A few other data sources were explored but various limitations rendered them not usable for a Some MAs included in our estimate of those occurring outside facilities are in fact provided, or prescribed in private doctors offices or consultation rooms. We cannot remove these because these types of providers were not included in the Health Facilities Survey and no other estimate exists of this category of MA abortions. 12
14 our purposes. They are briefly mentioned below because they provide some degree of triangulation with the assumption and estimate we chose and applied. A.3.1 Indirect estimate of the proportion of other abortions Findings from the HFS show that across the six study states, 4-16% of postabortion care (PAC) patients were treated for one category of serious complications (infection of the uterus and surrounding areas) and smaller proportions were treated for other serious complications including injury (any kind of physical trauma such as laceration and perforation), sepsis and shock. Because a given PAC patient may suffer from more than one of these complications, multiple responses were allowed and these groups are therefore overlapping, and the data do not permit the estimation of an overall percentage of patients that had one or more serious complications. The overall proportion of PAC patients with one or more of these types of complications would be higher than the 4-16% mentioned above, because some women would have had one of these complications. These data provide a useful crosscheck because they indicate that at a minimum, a substantial minority of PAC patients experienced serious complications consistent with abortions that were performed using unsafe methods or in unhygienic conditions by unqualified providers. In order to estimate the number of abortions that occur using these other methods and types of providers, we used an indirect technique detailed below. 1. Two Population Council studies conducted in Rajasthan and Maharashtra in show that 6%-8% of women reported that their recent abortions were from Other methods/providers.(12,13) Since there is no other high quality data on this small component of other types of abortion in India, we assume the midpoint (7%) to be the overall proportion of women having other abortions in We also assume the proportion of women having these types of abortions has continued to decrease between and Our best estimate for the amount of this reduction is based on the % increase in MA drug sales. b 2. Based on IMS data obtained for and 2015, MA drug sales have increased by around 26% during that time period. We therefore reduce the proportion of other abortions estimated for by the two Population Council studies (7%) by 26%, estimating that 5.2% of abortions in 2015 were obtained from other methods/providers. We infer the number of women having other abortions relative to the total count of women in Components 1 and 2 (i.e. women having facility-based and medication abortions outside of facilities). For example, if 5% of women had other abortions, then: # Other Abortions = [((100/95) * A] A] Where A= [Component #1 + Component #2] Lacking any data to differentiate the size of this group by state, we assume that this proportion applies to all states (Table 1.8). Table 1.8. Other types of abortions in six regions and nationally State Other abortions Northeast 42,195 East 195,959 West 92,653 Central 77,928 South 139,073 North 259,442 India (national) 807,251 b This approach was recommended by the Technical Advisory Committee, meeting in November,
15 A.3.2 Sources explored and found to be not usable for estimating Other abortions 1. The Health Professionals Survey (HPS) provided data on the proportion of women obtaining other types of abortion. These proportions range between 6-9% in three of our focus states (Assam, Gujarat and Tamil Nadu), but are higher for the other three focus states (16%, 18% and 29% in MP, UP and Bihar, respectively). The current views of experts is that the proportion of women having abortions categorized as other has decreased over time and should now be relatively small.(14) It is possible that HPS respondents overestimated the degree to which abortions are unsafe for some states because their knowledge of this aspect of abortion provision is outdated and they may be drawing on experiences from a number of years ago. 2. Provisional results from the National Family Health Survey (NFHS-4), an external source that obtains information from a population-based cross-sectional survey of women, show fairly high proportions of women obtaining abortions from other sources, ranging from 8% in Tamil Nadu to 24-29% in Assam, Bihar and Madhya Pradesh. The questions asked in the NFHS-4, however, do not allow us to calculate the specific comparable proportion needed because there is no question about what method of abortion women are using. Since some (and possibly a large proportion) of NFHS-4 respondents who reported having abortions outside of health facilities would have used medication abortion, these proportions relying on the NFHS-4 would overestimate the proportion of women having other types of abortion outside facilities. 3. Studies by Ipas India special tabulations from these studies provide support for the pace of decline in other abortions as estimated by the change in sales of MA drugs described below.(15) A.4. Sensitivity analysis A few sub-components of the estimates are from comprehensive data sources (NGO statistics and drug sales data from for-profit and nonprofit data sources). Other sub-components are based on HFS results, expert opinion or published studies: These sub-components involve adjustments that are based on assumptions that have a certain degree of uncertainty. To account for this, we performed sensitivity analyses to calculate upper and lower bound ranges around each sub-component, depending on the certainty of the data underlying each. The total number of induced abortions for the medium estimate and the range around it are the result of aggregating the medium, lower and upper bound estimates across all sub-components. Since Component 1 was mostly derived from survey data, we used 95% confidence intervals around the estimated number of abortions calculated in the HFS to create upper and lower bounds of the facility-based abortions. It was not necessary to perform sensitivity analyses on the much smaller number of NGO facility-based abortion because they were not survey estimates, but a comprehensive count, similar to a census. Estimating abortions in Components 2 (number of MAs outside of health facilities) and Component 3 (other types of abortions) required making certain assumptions and adjustments related to black market MA export, differential use of mifepristone tablets, degrees to which women attempt an MA outside a facility and then later return to a facility to obtain an abortion, etc. (detailed in Sections A.2 and A.3). To perform sensitivity analyses on Components 2 and 3, we developed high and low values for each adjustment around the medium values discussed in A.2 and A.3, based on available literature and expert opinion on the likely range of uncertainty. For example, adjustments for black market export of MA drugs to Nepal and Bangladesh are based on large-scale HFS surveys, thus we assumed a relatively low level of uncertainty for these two adjustments when calculating upper and lower bounds. Adjustments for the percent of women who unsuccessfully use MA outside of a facility and then obtain an abortion in a facility is based on a small study in one state, thus we assumed a relatively high level of uncertainty for this adjustment with a wider range for the upper and lower bound estimates. We then aggregated these high and low values around each adjustment in order to estimate a range of upper and lower bounds around each of these parameters (Table 1.7). The high and low estimates are presented along with the medium estimate of induced abortions in Table 1.8. The cumulative impact of these sensitivity analyses on the total estimated number of abortions provides a range around the recommended, medium estimate, and demonstrates how the incidence estimate would vary if we modified these adjustments. 14
16 A.4.1 Variables used in sensitivity analyses The following table (Table 1.9) shows the variables for which we performed sensitivity analyses, and the range we assumed around each of them: Table 1.9. Variables used in sensitivity analyses on abortion estimates Variable Low Medium High 1 Reduced for-profit MA drug sales by informal export of MA drugs to 13% 10% 7% Bangladesh from Assam and West Bengal: The proportion of illegal MA Bangladesh attributed to informal export from India(5) 2 Reduced for-profit MA drug sales by informal export of MA drugs to Nepal, divided evenly among 4 border states: UP, Uttarakhand, +25% (90,000) 72,000-25% (54,000) Bihar, and West Bengal (4) 3 Reduce all MA drug sales data to account for wastage of MA drugs.(16) 13% 10% 7% 4 Reduced mifepristone-only abortions to account for differential use. Proportion of women who will use 1, 2, and 3 mifepristone pills to induce one abortion.(2,3) 5 Percent of all facility-based abortions that is removed from the total number of MAs occurring outside of facilities [to avoid doublecounting women who used MA outside of a facility and failed, then obtained an abortion in a facility]. (11) 6 Percent other abortions (occurring outside of facilities and without 70%=1 15%=2 15%=3 MA).(12,13) 7 Confidence Intervals (CI) for HFS abortion yearly totals Low end of CI 80%=1 10%=2 10%=3 90%=1 5%=2 5%=3 8% 5% 2% 3% 5% 7% HFS estimate High end of CI A.4.2 Calculation of total number of abortions and upper and lower bound estimates The total number of abortions were obtained by summing the three components, separately for the low, medium and high assumptions (Table 1.10). Abortion rates were then calculated as the number of abortions occurring in 2015 per 1,000 women aged 15-49, for the medium, low and high estimates. Estimates of the 2015 population of women of reproductive age by state and region are from projections developed at the International Institute for Population Sciences, based on the 2001 and 2011 Censuses of India.(17) Table Medium, low and high estimates of the number of abortions and abortion rates for the six study regions, 2015 Total # of induced abortions Northeast East West Central South North Medium 817,752 3,797,742 1,795,643 1,510,275 2,695,282 5,028,055 Low 726,112 3,397,673 1,624,714 1,376,867 2,387,528 4,538,836 High 915,840 4,222,946 1,975,207 1,649,089 3,033,599 5,538,706 Abortion rate per 1000 WRA* Medium Low High *Women of reproductive age,
17 Part B. National Estimates of Abortion, Pregnancy and Unintended Pregnancy, 2015 B.1 National estimates of the number and rate of abortion The total annual number of each of the three major components of abortions were summed across the six regions to estimate the national total number of abortions. Using the same sources for female population, we calculated national abortion rates per 1000 women ages The same sensitivity analyses as described in Part A were conducted for all states, and provide the results shown below, as medium, low and high estimates for national abortion incidence (Table 1.11). Table National medium, low and high estimates of the number of abortions and the abortion rate for India, 2015 Medium Low High Total # of induced abortions 15,644,748 14,051,729 17,335,388 Abortion rate* * Number of abortions per 1000 women age B.2 Estimating Pregnancy at the National Level A second objective of the study was to estimate the number of pregnancies both unintended and intended occurring in India in 2015, and the outcomes of such pregnancies: the proportion of unplanned and planned pregnancies, and the distribution of pregnancies by outcome births, abortions and miscarriages. Below we describe the methods for estimating these measures. Estimating pregnancy incidence Total pregnancies are obtained by combining three components: births, abortions and miscarriages. The national total annual number of live births in India is based on the United Nations Population Division 2015 birth estimates.(18) c The national estimate of abortions is that estimated by this study. Miscarriages are estimated based on models that are derived from clinical studies. Estimating pregnancies that end in miscarriage Reporting on surveys, through direct questions to women about their experiences of miscarriages, is known to be very incomplete--women can only report what they actually know or observe and what they remember; and to some extent, reporting is also influenced by what they want to let the interviewer know. The earliest miscarriages may not be noticed for example an early miscarriage could be mistaken for a heavy period. Conversely, some women may misreport an induced abortions as a miscarriage. Thus data from surveys of women are likely to yield inaccurate data on miscarriage. As a result, estimates of miscarriages based on clinical studies are considered to provide more accurate data on the pregnancy loss throughout gestation from week six to term. There are few such studies, and most are in developed countries; however lacking alternative sources, these studies have been assumed to provide a reasonable estimate for all countries, based on the assumption that the incidence of miscarriage is c Estimates of the number of live births for individual states were developed by IIPS. These estimates used the UN s 2015 estimate of births for India, and integrate data from national sources such as sample registration system to capture state specific variation in fertility level, while ensuring that the national total number of births was consistent with the UN's national estimate for
18 largely biologically driven, and would not vary widely across countries or subpopulations. Syntheses of such studies have been done and more detailed life table data are presented in some studies.(19 21) To estimate miscarriage, we draw on the detailed life-table results of Harlap et al to calculate the ratio of miscarriage to events (births and abortions) for which external estimates are available, allowing an indirect estimation of the number of pregnancies ending in miscarriage. The ratios are 20% of live births and 10% of abortions. The 10% estimate is an approximation based on the fact that the average gestational age at which women have abortions is approximately 10 weeks, and detailed life-table estimates of pregnancy loss up to this gestation is about 10%. Applying the assumptions of 20% to the number of live births in 2015 and 10% to the number of abortions, we estimate that the total number of miscarriages that occurred in 2015 in India is 6.7 million. B.3. Estimating intended and unintended pregnancies We further divided the total pregnancy estimates into those that are intended and those that are unintended. Unintended pregnancies Using data from the NFHS-4, we calculated for each state the difference between the total fertility rate (TFR) and the wanted fertility rate (WTFR) and calculated the proportion of births that are unwanted or unintended. At the national level, when all states are combined, the proportion of births that are unwanted is 19.7%. The number of unintended births is calculated by applying the proportion of births that are unwanted to the number of births in each state, and accumulated to arrive at the national number of unplanned births. We assumed that all abortions result from unintended pregnancies; however, we acknowledge that a small proportion likely result from intended pregnancies, but lack data to estimate this number for India. A study in the United States found that approximately 4% of abortions resulted from intended pregnancies, a proportion that is small enough that if true for India, would not greatly affect the estimate of unintended pregnancies. d (22) As described above, unintended miscarriages are estimated as 20% of unwanted births and 10% of abortions. By summing unplanned births, abortions and miscarriages from unintended pregnancies, we estimated the total number of unintended pregnancies (Table 1.10). Intended pregnancies Intended pregnancies were calculated by summing the total number of planned births (80% of all births in 2015), with the number of miscarriages from intended pregnancies (equivalent to 20% of intended births) (Table 1.12). Table Pregnancy Rates and number of pregnancies by component, for the six study regions and national estimates, 2015 Rate and Number Northeast East West Central South North National Pregnancy rate per 1000 WRA Total pregnancies 1,979,118 11,092,624 5,827,222 4,600,336 8,235,229 16,401,849 48,136,379 Intended 900,719 5,456,580 3,101,582 2,358,366 4,553,498 8,454,049 24,824,793 d The effect of correcting for an overcount of unintended pregnancies by this amount would be to reduce the percent of all pregnancies that are unintended by 1.3 percentage points, from 48.4% to 47.1%. 17
19 Unintended 1,078,398 5,636,045 2,725,640 2,241,970 3,681,731 7,947,801 23,311,585 Births 899,659 5,762,590 3,210,013 2,449,195 4,392,016 9,059,157 25,772,630 Abortions 817,752 3,797,742 1,795,643 1,510,275 2,695,282 5,028,055 15,644,748 Miscarriages 261,707 1,532, , ,866 1,147,931 2,314,637 6,719,001 18
20 Appendix Part 2: Sample design and implementation for the Health Facilities Survey (HFS) Contents A. Geographic scope A.1 State selection A.2 District selection B. Facility lists B.1 Listing plan B.1.1 Listing in urban areas B.1.2 Listing in rural areas B.2 Criteria for inclusion B.3 Facility information B.4 Listing implementation B.4.1 Urban private health facilities and Other Public facilities B.4.2 Rural private health facilities B.4.3 NGO Facilities B.4.4 Limitations C. Sampling public facilities C.1 District hospitals C.2 Sub-district/sub-divisional hospitals C.3 Community Health Centers C.4 Primary Health Centers C.5 Other Public facilities D. Sampling private and Other Public facilities D.1 Sample design for private and Other Public facilities D.1.1 Urban selection criteria D.1.1a Sample design for towns of population 5,000-1,000, D.1.1b Sample design for towns of population of 1,000,000 and greater D.1.2 Rural facility sample design and selection criteria E. Selection of medical college facilities F. Summary of HFS Sample and Response Rates G. Sample weights G.1 Weights for facilities with known universes G.1.1 Weights for district hospitals, sub-district hospitals, ESIC hospitals, CHCs and medical colleges G.1.2 Weights for PHCs G.2. Weights for facilities with no known universe G.2.1 Private urban facilities
21 G.2.2 Other Public urban facilities G.2.3 Private rural facilities G.2.4 Universe calculation G.2.4a Private urban facilities and Other Public urban facilities G.2.4b Rural private facilities
22 A. Geographic scope The HFS collected data from a sample of facilities from each of the two main health sectors: public and private. The sampled facilities represent the universe of all facilities providing elective abortion services (MTP) and/or postabortion care (PAC) in the selected states. Weights were constructed in order to produce representative results in each of the six selected states. A.1 State selection Because of India s size, it was not possible to conduct the study in every state of the country. Therefore, the study team selected six large states to maximize the percent population covered by the study, to represent several regions defined by the National Family Health Survey (NFHS), and to span a wide range of demographic, economic and socio-cultural indicators that may be related to the incidence of unintended pregnancy and abortion. The selected states are Assam, Bihar, Gujarat, Madhya Pradesh, Tamil Nadu and Uttar Pradesh, representing 45 percent of women of reproductive age. Selected indicators that show the diversity of the six study states include the percent of the population that is urban, the educational level of women, the gap between the total fertility rate (TFR) and the wanted total fertility rate (WTFR), contraceptive prevalence, and the percent of women with unmet need for family planning (Table 2.1). (23 26) Table 2.1. Socio-cultural and demographic indicators considered in selecting six states included in study (data available at the time the study was being designed, in 2013). State Source Assam Bihar Gujarat Madhya Pradesh Tamil Nadu Uttar Pradesh 2011 total population (millions) No. of districts % urban of total population % with 5+ years education* Sex ratio at birth (females per 1,000 males) Total fertility rate (TFR) Wanted total fertility rate (WTFR) Gap between WTFR and TFR % using contraception** % using modern contraception** % with unmet need for contraception** *Among ever-married women **Among married women Census Census Census India NFHS Sample Registration Statistics, India NHFS India NHFS India NHFS India NHFS India DLHS India NHFS A.2 District selection The study team randomly selected 70% of all districts within each of the six selected states using the PPS (population proportional to size) method from 2011 Primary Census Abstract (PCA) data.(27) This resulted in a sample of 171 districts drawn from a universe of 244 districts listed in the 2011 census for the six selected states (Supplemental Table B.1). 21
23 The process of selecting districts in each state was as follows: The districts were chosen using probability proportion to the size (PPS) sampling procedure without replacement within each state. 1. Districts were ordered from most populous to least populous and the cumulative population was calculated. 2. A sampling interval was calculated (total state population divided by the number of districts to be selected). 3. A random start was generated from the cumulative population of districts using function in MS-Excel. 4. Districts were selected, beginning with the district in whose cumulative population the random start lay, by successively adding the sampling interval to the random start and selecting the district in whose cumulative population the new number lay. When this process reached the end of the list it looped back to the top of the list and continued. During this process, if a district was selected for a second time, the next available district in the list was chosen instead (i.e., selection without replacement). This occurred five times in the selection process (twice in Bihar, twice in Gujarat and once in Madhya Pradesh). B. Facility lists The study used lists of public sector facilities obtained from the Health Management Information System (HMIS)(28), a division of the Ministry of Health and Family Welfare (MOHFW) of the Government of India, to draw samples for district hospitals, sub-district or sub-divisional hospitals, community health centers and primary health centers. Comprehensive lists of ESIC hospitals and lists for public and private Medical Colleges are available from the Medical Council of India website,(29) but there are no such lists of other types of public facilities that we refer to collectively as Other Public facilities (railway hospitals, military hospitals, other municipal hospitals, urban health centers and urban family welfare centers), or of private sector health facilities (hospitals, maternity and nursing homes, and clinics). Therefore, a listing effort was designed and conducted prior to the main HFS fieldwork to obtain a comprehensive list of these facility types in selected areas of the six states. B.1 Listing plan B.1.1 Listing in urban areas Within each selected town or Urban Sample Unit (USU) (see below, section D), all private facilities and Other Public facilities that met specific criteria (see below) were eligible for listing. The study team used a variety of lists to help identify facilities and/or to cross check the lists generated in the field. These included the Federation of Obstetrics and Gynaecological Societies of India (FOGSI) and Indian Medical Association (IMA) lists of obstetricians and gynecologists and lists of registered abortion providers from District Level Committee (DLC) or District headquarters.(2,30,31) A team of listing fieldworkers were trained in each of the six states and the study team reviewed data they collected on an on-going basis. The fieldwork staff listed facilities systematically, district by district. The study team cleaned, coded and analyzed the listing data as it arrived. Facilities were then sampled from these lists, district by district. B.1.2 Listing in rural areas To create lists of rural private facilities and primary health centers (PHCs), the study team randomly selected about half (231) of the sampled Community Health Centers (CHCs), and listed all rural private facilities within each of the selected CHCs catchment areas (roughly defined as 2-5 kilometers radius around the CHC), as well as all PHCs administratively linked to the CHC. To list rural private facilities and PHCs, the study team used the following methodology: 1. If there was only one CHC in a district, it was selected. 22
24 2. In districts with two or more CHCs selected, a start either 1 or 2 was randomly generated. Every second CHC was selected beginning with the random start. 3. All private facilities in the catchment area of the selected CHCs were listed. In addition to listing these categories of facilities in urban and rural areas, the study team gathered specific information on each facility for purposes of stratification and sample selection. B.2 Criteria for inclusion Two main criteria were used to determine whether a facility would be listed. The facility must have had at least: 1. A minor operation theater or an equipped labor room where abortion or post abortion care services can be provided. 2. One obstetrician-gynecologist or an MBBS doctor on staff who provides reproductive health services. B.3 Facility information Information collected from each listed facility included: 1. Type of facility (e.g. hospital, nursing home or clinic) 2. Number of beds (maternity and total beds) 3. Contact information (e.g. name, address, phone number, any landmark, etc.) 4. From single providers: whether the facility is the primary site where he or she practices B.4 Listing implementation B.4.1 Urban private health facilities and Other Public facilities All private health facilities and Other Public facilities that met the listing criteria in sampled towns or USUs were listed. The data were collected and recorded on an Excel form. Just over 2,000 private facilities and 227 Other Public facilities were listed in urban areas (Table 2.2). B.4.2 Rural private health facilities All private facilities in the catchment areas of the randomly selected CHCs were listed. The listing exercise in rural catchment areas was done concurrently with the listing exercise for urban private facilities. Information on private facilities that met our criteria and were located within the catchment area of specific CHCs was often available from the CHC staff or from nearby chemist or drug stores. From CHC staff, we obtained a list of all PHCs administratively linked to the CHC, and a list or any information about potentially eligible private providers within the CHCs catchment areas. From chemists and drug sellers, we obtained a list or any information they had about potentially elligible private providers or facilities located in the surrounding areas. A total of 453 rural private facilities were listed among the six states. 23
25 Table 2.2. Number of facilities listed by type STATE PHCs Urban Public Facilities Private Facilities (rural and urban)* Sample plan No. listed Sample plan No. listed Sample plan No. listed Total sampled Total listed Assam Bihar Gujarat Madhya Pradesh Tamil Nadu Uttar Pradesh ,042 1,319 TOTAL 1,040 1, ,110 2,463 3,299 4,376 * Includes a small number of NGOs B.4.3 NGO Facilities As a separate effort, not part of the listing exercise or HFS, NGO service provision data were obtained (described in Appendix Part 1, Section A.1.1), to supplement the data collected in the HFS. To ensure no duplication of facilities occurred between these two data sources, NGO facilities captured in the HFS were carefully crosschecked with the NGO service provision data, and were confirmed to be unique facilities, non-overlapping with facilities covered by the NGO networks for which complete data were collected. B.4.4 Limitations Using the listing criteria described above, the intention was to list all private facilities that had the capability of providing abortion-related care (not just those confirmed to provide services). This procedure, however, was not followed consistently. After listing was completed, the study team discovered that in many cases, facilities were listed only if they were known or thought to be providing abortion-related care. Facilities that were capable of providing services according to the listing criteria, but known or assumed not to provide abortion-related services were not always listed consistently within and across states. Thus the universe of listed private facilities (and thereby the estimated universe of private facilities) does not represent the universe of all private facilities that are capable of providing abortion. As a result, for the private sector, the analysis focused only on those private facilities that actually reported providing abortion-related care. C. Sampling public facilities C.1 District hospitals All (100%) district hospitals located in the 171 sampled districts were selected. In some districts the HMIS listed more than one district hospital. For these cases, the study team followed up with local authorities to determine which 24
26 of the facilities was the appropriate district hospital to be included in the study. The most common reason for multiple district hospitals was there was one hospital that specialized in services for women and one that served only men. In these instances, the hospital attending to female patients was selected. Since the 2011 census, a few of the 171 sample districts were divided into two separate districts. This occurred in three districts in Uttar Pradesh, four in Gujarat and one in Madhya Pradesh. For these instances, the population of the 2011 districts (before division occurred) was used to calculate the universe populations for sample selection purposes. Initially, there was a total universe and sample of 171 district hospitals, however, during fieldwork an additional two facilities were found, totaling to 173 district hospitals. C.2 Sub-district/sub-divisional hospitals The HMIS list of sub-district or sub-divisional hospitals (SDHs) served as the universe for selecting the sample. Two anomalies were noted: there were no SDHs listed for Uttar Pradesh and the number of SDHs in Tamil Nadu greatly exceeded the numbers in the other states. For Assam, Bihar, Gujarat and Madhya Pradesh, 100% of the SDHs were selected. For Tamil Nadu, 25% of the SDHs were selected randomly using PPS. The SDHs were first ordered, largest to smallest, by the populations of the districts in which they were located. The SDHs within each district were randomly ordered. This method assured that more SDHs were selected in the most populous districts. Using the HMIS list, a total of 146 SDHs were selected in the sampled districts for five states, excluding Uttar Pradesh. After the listing exercise was completed, this number increased slightly with newly identified SDHs, and a total of 152 SDHs were identified and eventually included in the HFS sample. The listing exercise confirmed that no SDHs existed in Uttar Pradesh. All the additional SDHs were found in Gujarat, increasing the total from 18 to 24. The listing exercise also found that some medical colleges became SDHs. C.3 Community Health Centers One-third of the community health centers (CHCs) located in the 171 sampled districts were randomly selected in all states, with the exception of Bihar. In Bihar, 66% were chosen because there were significantly fewer CHCs in each district. For each district, the number of CHCs to be selected (N) was determined as a percentage (33% or 66%) of the total number of CHCs in the district (M). The sampling interval was calculated (interval = M / N). The CHCs were selected sequentially, starting with the random-start CHC and continuing using the sampling interval to identify the next CHC to be chosen. A total of 438 CHCs were originally selected in this manner from the 1,282 CHCs located in the sampled districts. The overall universe of CHCs in the six states is 2,033. During the listing exercise, some additional CHCs were found, some that were selected could not be found and had to be replaced. A total of 450 CHCs were ultimately included in the final sample across the six states. In Assam, six out of the 28 CHCs originally selected were replaced; in these cases the CHC identified in the HMIS list was either not a CHC or was not found. In Uttar Pradesh, seven sampled CHCs were found to be lower level faciities (primary health centers) during listing. In Gujarat two SDHs were found to be CHCs and therefore included in the CHC sample universe. In Madhya Pradesh and Tamil Nadu, all sampled CHCs were located. 25
27 C.4 Primary Health Centers Sampling of PHCs differed from other types of facilities in that it used a two-step process: (a) in each state a random sample of CHCs (within the sample districts) was selected; and (b) PHCs administratively linked to the selected CHCs were listed and grouped into 24x7 PHCs and non-24x7 PHCs, from which random samples of PHCs were selected. Approximately 40% of the PHCs listed under the sampled CHCs were sampled for the HFS. The rules for selecting PHCs were adjusted as the field work proceeded to ensure that the planned numbers of PHCs per state were selected. The study used slightly different rules to select PHCs in each state due to the different ratios of PHCs to CHCs in the selected states. For Gujarat, Madhya Pradesh, Tamil Nadu and Uttar Pradesh, two PHCs per selected CHC were randomly sampled using a random generation table. Ideally, one PHC of each of two categories was represented: those open at all hours 24/7 and those with limited hours non 24/7. (In the field it was found that the actual proportion of 24x7 PHCs did not conform to a priori expectations. For instance, in several cases, there were no 24x7 PHCs under a CHC. Ad hoc decisions needed to be made during the field work with the goal of assuring a proportion of 24x7 PHCs around 50%. In the end, the proportions of 24x7 and non 24x7 PHCs sampled varied greatly among the states). If there was only one 24/7 PHC administratively linked to the selected CHC, that PHC was selected purposively. In Assam and Bihar, there were large numbers of PHCs and relatively small numbers of CHCs. In Assam, three PHCs per sampled CHC were chosen and in Bihar six PHCs per sampled CHCs were chosen. A total of 1,062 PHCs were sampled for the HFS across the six states. In Assam, PHCs are administratively under block PHCs (BPHC), rather than CHCs. Therefore, selection of PHCs for the HFS sample in Assam was based on those PHCs listed as administered by specific BPHCs associated with the sampled CHCs. Also in Assam, three sampled PHCs were found to be co-located with CHCs and for these cases, replacement PHCs were selected. C.5 Other Public facilities Certain other types of public sector facilities in urban areas, aside from the facility types described above, may also have the capacity to provide abortion services or post abortion care. These included Railway hospitals and military hospitals, as well as other municipal hospitals, ESIC Hospitals, Urban Health Centers and Urban Family Welfare Centers. Comprehensive lists of these facilities were not available except for ESIC hospitals, for which there is a complete list nationwide.(32) For all categories of Other Public facilities, the same approach was used as for listing and sampling private facilities. In the selected urban areas these facilities were listed and included in the sample. A total of 227 Other Public facilities were listed. 181 Other Public facilities were included in the final HFS sample, including ESIC hospitals. D. Sampling private and Other Public facilities D.1 Sample design for private and Other Public facilities Sample selection for private and Other Public facilities was designed to conform to several principles. The six focus states contain about 38% of the urban population in the country as a whole. In order to produce national estimates of abortion service provision in private and Other Public facilities, the HFS was designed to cover about 3% of the all-india population in towns and cities, providing an acceptable basis for weighting up. Therefore, we drew the urban HFS sample from areas containing 7.5% of the urban population in the six states. 26
28 D.1.1 Urban selection criteria Population data and ward (municipal areas within a town) boundaries within urban areas were based on data and maps from the 2011 Census. The sample included selected wards in all cities of one million or more in the six states (i.e. not limited to the selected districts). The sample of towns with a population of fewer than one million were drawn from the same districts that were selected for the public sector sample (70% of all districts in the six states). The first stage of the urban sample design was to select towns, by grouping towns into strata and selecting a proportion from each strata (described below), using a systematic random sampling approach. Once towns were selected, the design for selecting areas for which facilities would be listed differed depending on the population size of the towns (described below). No towns of size under 5,000 were selected for the HFS sample. Weighting up from surveyed facilities in selected wards was a function of the percent of the population listed to the total urban population of the state. The sampling fraction was chosen to yield a number of sampled private facilities amounting to 50-60% of the entire HFS sample. D.1.1a Sample design for towns of population 5,000-1,000,000 In the six states there are 3,098 towns with 5,000-1,000,000 population summing to a total population of million. Nationally, such towns have a total population of 230 million. Assuming that we should cover about 3% of the national population in smaller towns (under 1 million), our urban listing should cover at least 6.6 million of this category of population. However, the final listing exercise design exceeded the minimum and covered urban areas with 7.6 million population in the six focus states. (Supplemental Table B.2) In the 171 selected districts, we sampled from all towns of size under 1,000,000 population in each of the six states by first grouping them into the following town-size categories: under 5,000; 5,000-24,999; 25,000-99,999; 100, ,999; and 500, ,999. The towns were sorted by population size and then selected by PPS random sampling to roughly equal 7.5% of the population in the four size categories used. The study team selected 159 out of 2,158 towns in the smallest size town category (populations of 5,000-24,999) and 55 out of 768 towns in the next largest size category (25,000-99,000). All private facilities that met the study criteria were listed in entire towns selected from these categories. In towns of population 100,000 and above, the study team used an aggregation approach to group several contiguous wards into urban sample units (USUs), each with a population of approximately 100,000. All selected towns and USUs in large towns, were sorted by population size and then USUs were randomly selected for listing sampling (a total of 31 USUs). Twenty-one out of 157 towns with populations of 100, ,999 and 8 out of 15 towns with populations of 500, ,999 were selected. For towns in the range 100, ,999, one USU was selected for listing in each of the 21 towns using simple random sampling. For towns in the range 500, ,999, one USU was selected for listing in each of the 8 towns using simple random sampling. All private facilities that met study criteria in all selected USUs were listed. Two additional USUs were selected randomly from the two largest towns in the sample. An additional six USUs were randomly selected during listing, after discovering that the number of private facilities per USU were below expectations (not shown in Supplemental Table B.2). Overall, the listing exercise covered towns and USUs containing a total population of 3.9 million. (The initially selected USUs had a population of 3.1 million, and the additional USUs covered 200,000 and 600,000 population for a total of 3.9 million). 27
29 D.1.1b Sample design for towns of population of 1,000,000 and greater In the six states there are 19 towns with a population of 1,000,000 or more, totaling 39.9 million. Nationally, there are 46 such towns with a total population of 116 million. Assuming that we should cover 3% of the national population in large cities, our urban listing (in towns with population of 1,000,000+) should cover at least 3.5 million population (8.7% of the six-state population in this town size category). Whereas for towns of population under 1,000,000, the universe from which our sample was drawn was restricted to towns within the sample districts in each state; all cities with populations of 1,000,000 or more in the six focus states, were included in the sample universe. (Supplemental Table B.3.) In these 19 towns there were a total of approximately 1,600 wards of varying population sizes. These 1,600 wards were grouped into approximately 400 USUs of about 100,000 population each. In a few cases, in which cities or towns had wards that were very large, they were divided into equal parts of approximately 100,000 and therefore these wards could have more than one USU. All 19 towns had at least one USU selected for listing. The remaining 14 USUs to be selected (14 = 33 19) were selected randomly using PPS. All 19 towns were pooled into one list regardless of state for this stage of selection. For example, if a city has 12% of the total population of the 19 towns taken together, it will be assigned 12% of the 14 remaining USUs. We divided these towns into broad areas, one for each USU to be selected (e.g., if 3 USUs were to be selected, the town was divided into 3 areas). We used areas that were already known or established, where we had knowledge of the towns, otherwise, an arbitrary segmentation was done. The purpose of this approach was to reduce the probability of disproportionately under-counting private facilities by selecting USUs located in periphery areas, where fewer clinics are generally located. Initially, the study team selected a total of 33 USUs (with a population of approximately 3,300,000) from the 19 cities. As the fieldwork progressed and the number of facilities listed was lower than expected, an additional 25 USUs were randomly selected in this category of cities, for a total of 58 USUs, covering 5.8 million population, equivalent to 14.5% of the population in this category of cities in the six focus states. As Table 2.3 shows, a total of 40 additional USUs were added to the listing exercise since it was found that the number of private facility per USU was below expectations. This was especially true in Assam, Gujarat and Tamil Nadu. Additional USUs were added through random selection in all cases. Table 2.3. Number of urban sample units (USUs) listed Size of Town No. of USUs (planned) No. of USUs (final sample) 100, , , , ,000, TOTAL D.1.2 Rural facility sample design and selection criteria Due to the small number of private facilities found in rural areas during listing, all facilities that were listed were included in the sample. In many rural areas, no private facilities meeting our criteria were found. All 453 rural private health facilities that were listed across the six states were selected. This was lower than originally 28
30 anticipated. For the selection of rural private facilities, the total number of CHCs used was approximately half the number of CHCs used for selecting PHCs. E. Selection of medical college facilities All medical colleges (public and private) with reproductive health services or an obstetrics and gynecology department in all 244 districts of the six selected states were included in the sample. A variety of lists, including web-based information, were consulted to create the list of medical colleges. During the listing exercise, the list of medical colleges in each state was confirmed. The total number of medical colleges, after adjustments, in the six states is 122. F. Summary of HFS Sample and Response Rates The number of facilities sampled and completed by type is summarized in Table 2.4 (state-specific data are in Table 2.5). Around 51% of the HFS sample consisted of private facilities. Table 2.4. National summary of sample, completed interviews and response rates by facility type Facility Type No. in HFS sample No. completed Response Rate Public Facilities* District hospitals 2, , % 98% Sub-district/divisional hospitals % CHCs % PHCs 1,062 1,052 99% Other urban public facilities % Private Facilities* 2,009 1,910 95% Hospitals Nursing Homes Clinics Medical Colleges % 94% 97% 91% TOTAL SAMPLE 4,149 4,001 96% *Excluding medical colleges 29
31 Table 2.5. Summary of listing, HFS sample selection and interview status by facility type and state Number of facilities listed State PHC Private facilities* Urban Medical DH SDH CHC Non 24x7 Total Urban Rural public colleges 24x7 Total Assam Bihar Gujarat Madhya Pradesh Tamil Nadu Uttar Pradesh ,538 Total ,463 1, ,267 Number of facilities in original HFS sample Assam Bihar Gujarat Madhya Pradesh Tamil Nadu Uttar Pradesh ,308 Total ,104 1, ,284 Number of facilities in final HFS sample (after fieldwork) Assam Bihar Gujarat Madhya Pradesh Tamil Nadu Uttar Pradesh ,286 Total ,009 1, ,149** Number of facilities with completed valid interviews Assam Bihar Gujarat Madhya Pradesh Tamil Nadu Uttar Pradesh ,222 Total ,910 1, ,001 * Including NGO/Trust facilities ** At the time of the interview, 135 facilities were found to not exist, could not be found, did not offer any reproductive health services or were duplicate listings. Includes ESI hospitals 30
32 G. Sample weights Estimates from the HFS were weighted to represent each of the six states. Two weighting processes were necessary to calculate state estimates for facilities with known universes and facilities with no known or complete universes. See Supplemental Table B.4 for detail on all weights calculated by state and type of facility. The text below describes the methodology for creating these weights. G.1 Weights for facilities with known universes G.1.1 Weights for district hospitals, sub-district hospitals, ESIC hospitals, CHCs and medical colleges There are known universes at the national and state level for the following categories of facilities: district hospitals, sub-divisional hospitals, ESIC hospitals and CHCs and public and private Medical Colleges. The process of calculating weights for these facilities are shown below: Definitions: MF N TOT MF N SU MF N SAMP MF N COMP MF W PRIM MF W FIN = no. of facilities in state-level universe = no. of facilities in sampled universe = no. of facilities sampled = no. of facilities with completed interviews = immediate sample weight = final sample weight Calculations: and MF MF WW PPPPPPPP = WW FFFFFF = MF NN SSSS MF NN SSSSSSSS MF NN SSSS MF MF NN TTTTTT = NN MF CCCCCCCC NN SSSS MF NN TTTTTT MF NN CCCCCCCC MF N SAMP is the number of facilities actually sampled, not the number initially planned to be sampled. The quantity MF N SU was useful to document the sample fraction, an important aspect of sample design and a factor in assessing representativeness. These equations summarize the main procedure for calculating the weights, but there were further adjustments that were necessary once the HFS data were collected. Some facilities in the sample did not respond when interviews were attempted (e.g., outright refusal or continued absence of any facility worker capable of responding). An adjustment to the weight was made to account for non-response. Other situations that needed to be taken into account when calculating weights is when facilities originally selected for the sample were no longer actual 31
33 facilities (e.g., facilities have permanently closed, facilities which did not offer any sort of reproductive health services and facilities that were duplicate listings). e (See Supplemental Table B.4). G.1.2 Weights for PHCs The calculation of the weights for PHCs PHC W PRIM and PHC W FIN was the same process as for the facilities described above. The calculations were performed separately for 24x7 and non-24x7 PHCs based on the two respective PHC universes, not on the universe of CHCs. Definitions: S i = no. of PHCs selected for the sample in CHCi P i = no. of PHCs reporting administratively to CHCi C = no. of CHCs in the sampled universe PHC N TOT = no. of PHCs in universe (state) Calculations: PHC NN SSSSSSSS = SS ii ii=11,22,..ii and PHC NN SSSS = PP ii ii=11,22,..ii G.2. Weights for facilities with no known universe Private facilities (hospitals, maternity or nursing homes and clinics) and Other Public facilities (military hospitals, railway hospitals, municipal hospitals, urban family welfare centers and urban health centers) do not have official, complete or known state or national-level universes. The listing exercise described above allowed the study team to systematically sample these types of facilities by listing all such facilities in areas of known population size. Population ratios were then used to estimate the universe of facilities to calculate weights. G.2.1 Private urban facilities Private urban facilities f were divided into nine sub-categories: three facility types in each of the three town size groups. Weight calculation for each of the nine sub-categories followed the same process as described above, e These cases required adjustments to NSAMP, NSU and NTOT. If, say, x originally sampled facilities are found to be non-facilities, then NSAMP should be reduced by x and NSU and NTOT should be reduced by a factor (x / NSAMP), under the assumption that the proportion of facilities found to be non-facilities in the sample is the same as the proportion found in the universe f The category private facilities (rural and urban) includes NGO clinics and trust hospitals. 32
34 however, an estimated universe was necessary to complete the calculations. Therefore, a process for estimating the universe ( PU NTOT) was devised and is explained in section G.1.1. G.2.2 Other Public urban facilities The same procedure was used for estimating the universe of Other Public facilities as was used for private urban facilities. The weight calculation was identical to the process described in section G.1.1. G.2.3 Private rural facilities Weights for the three types of private rural facilities were calculated using the same process shown above for PHCs because private rural facilities were randomly selected in the same manner based on a random selection of CHCs. For the selection of rural private facilities, the total number of CHCs used was approximately half the number of CHCs used for selecting PHCs. G.2.4 Universe calculation Since no sampling frame for most private facilities and certain public facilities was available in India, the rural and urban universes were estimated from the data gathered through the listing exercise. G.2.4a Private urban facilities and Other Public urban facilities The study team used numbers of listed facilities in the sample areas and applied an inflation factor based on the ratio of the urban population covered in the areas listed to the total urban population in each category of town size (Supplemental Table B.5). The calculation of universes for private urban facilities was as follows: Definitions: PU N TOT = no. of facilities in universe for each town-size class (5K-100K, 100K-1M, 1M+) and each facility type (hospital, nursing home and clinic) PU N LIST = no. of facilities listed in the sampled areas for each town-size class and each facility type S P TOT = state population for each town-size class SS P LIST = population for each town-size class in sampled areas Calculation: PU S NN TTTTTT = PP TTTTTT PU SS NN PP LLLLLLLL LLLLLLLL The universes of Other Public urban facilities were calculated in the same way, however, because of the small number of such facilities only three universes were calculated for the three town-size classes. G.2.4b Rural private facilities Universes of private rural facilities were calculated in a similar fashion but used CHCs as the basis of calculation rather than population ratios since the listing exercise for these facilities depended on the catchment areas of a randomly chosen subset of CHCs. The calculation was as follows: 33
35 Definitions: PR N TOT = no. of rural private facilities in universe for each type (hospital, nursing home and clinic) PR N LIST = no. of rural private facilities listed in the sampled CHC catchment area for each type C TOT C LIST = no. of CHCs in the state = no. of selected CHCs in sampled areas Calculation: PR NN TTTTTT = CC TTTTTT PR NN CC LLLLLLLL LLLLLLLL 34
36 Supplemental Tables Supplemental Table B.1. Sample district population and proportion sampled, six focus states Assam Bihar Gujarat District Population District Population District Population Baksa 950,075 Araria 2,811,569 Ahmadabad 7,214,225 Barpeta 1,693,622 Aurangabad 2,540,073 Anand 2,092,745 Cachar 1,736,617 Banka 2,034,763 Banas Kantha 3,120,506 Dhemaji 686,133 Begusarai 2,970,541 Bhavnagar 2,880,365 Dhubri 1,949,258 Bhagalpur 3,037,766 Dohad 2,127,086 Dibrugarh 1,326,335 Bhojpur 2,728,407 Gandhinagar 1,391,753 Dima Hasao 214,102 Buxar 1,706,352 Jamnagar 2,160,119 Goalpara 1,008,183 Darbhanga 3,937,385 Junagadh 2,743,082 Golaghat 1,066,888 Gaya 4,391,418 Kachchh 2,092,371 Kamrup 1,517,542 Jehanabad 1,125,313 Kheda 2,299,885 Kamrup Metro 1,253,938 Kaimur (Bhabua) 1,626,384 Navsari 1,329,672 Karimganj 1,228,686 Katihar 3,071,029 Panch Mahals 2,390,776 Kokrajhar 887,142 Madhubani 4,487,379 Rajkot 3,804,558 Morigaon 957,423 Muzaffarpur 4,801,062 Sabar Kantha 2,428,589 Nagaon 2,823,768 Nalanda 2,877,653 Surat 6,081,322 Nalbari 771,639 Pashchim Champaran 3,935,042 Surendranagar 1,756,268 Sivasagar 1,151,050 Patna 5,838,465 Vadodara 4,165,626 Sonitpur 1,924,110 Purba Champaran 5,099,371 Valsad 1,705,678 Tinsukia 1,327,929 Purnia 3,264,619 Rohtas 2,959,918 Saharsa 1,900,661 Samastipur 4,261,566 Saran 3,951,862 Sitamarhi 3,423,574 Siwan 3,330,464 Supaul 2,229,076 Vaishali 3,495,021 No. sample districts Total districts % sampled 70.4% 71.1% 69.2% 35
37 Supplemental Table B.1 (continued). Sample district population and proportion sampled, six focus states Madhya Pradesh Tamil Nadu Uttar Pradesh District Population District Population District Population District Population Anuppur 749,237 Chennai 4,646,732 Agra 4,418,797 Meerut 3,443,689 Balaghat 1,701,698 Coimbatore 3,458,045 Aligarh 3,673,889 Mirzapur 2,496,970 Betul 1,575,362 Cuddalore 2,605,914 Allahabad 5,954,391 Moradabad 4,772,006 Bhind 1,703,005 Dindigul 2,159,775 Ambedkar Nagar 2,397,888 Muzaffarnagar 4,143,512 Bhopal 2,371,061 Kancheepuram 3,998,252 Azamgarh 4,613,913 Pilibhit 2,031,007 Chhatarpur 1,762,375 Kanniyakumari 1,870,374 Bahraich 3,487,731 Pratapgarh 3,209,141 Chhindwara 2,090,922 Madurai 3,038,252 Ballia 3,239,774 Rae Bareli 3,405,559 Damoh 1,264,219 Nagapattinam 1,616,450 Bara Banki 3,260,699 Saharanpur 3,466,382 Datia 786,754 Namakkal 1,726,601 Bareilly 4,448,359 Sant Kabir Nagar 1,715,183 Dewas 1,563,715 Ramanathapuram 1,353,445 Bijnor 3,682,713 Shahjahanpur 3,006,538 Dhar 2,185,793 Salem 3,482,056 Budaun 3,681,896 Siddharthnagar 2,559,297 Gwalior 2,032,036 Thanjavur 2,405,890 Bulandshahr 3,499,171 Sitapur 4,483,992 Hoshangabad 1,241,350 The Nilgiris 735,394 Chandauli 1,952,756 Sultanpur 3,797,117 Indore 3,276,697 Thiruvallur 3,728,104 Chitrakoot 991,730 Unnao 3,108,367 Jabalpur 2,463,289 Thiruvarur 1,264,277 Etawah 1,581,810 Varanasi 3,676,841 Khandwa (East Nim 1,310,061 Tiruchirappalli 2,722,290 Faizabad 2,470,996 Khargone (West Nim 1,873,046 Tirunelveli 3,077,233 Gautam Buddha Nagar 1,648,115 Mandla 1,054,905 Tiruppur 2,479,052 Ghaziabad 4,681,645 Mandsaur 1,340,411 Tiruvannamalai 2,464,875 Ghazipur 3,620,268 Morena 1,965,970 Vellore 3,936,331 Gonda 3,433,919 Narsimhapur 1,091,854 Viluppuram 3,458,873 Gorakhpur 4,440,895 Panna 1,016,520 Virudhunagar 1,942,288 Hardoi 4,092,845 Rajgarh 1,545,814 Jaunpur 4,494,204 Ratlam 1,455,069 Jyotiba Phule Nagar 1,840,221 Rewa 2,365,106 Kanpur Dehat 1,796,184 Sagar 2,378,458 Kanpur Nagar 4,581,268 Satna 2,228,935 Kanshiram Nagar 1,436,719 Sehore 1,311,332 Kheri 4,021,243 Seoni 1,379,131 Kushinagar 3,564,544 Shajapur 1,512,681 Lalitpur 1,221,592 Sheopur 687,861 Lucknow 4,589,838 Shivpuri 1,726,050 Mahrajganj 2,684,703 Singrauli 1,178,273 Mainpuri 1,868,529 Tikamgarh 1,445,166 Mathura 2,547,184 Ujjain 1,986,864 Mau 2,205,968 No. sample districts Total districts % sampled 70.0% 68.8% 70.4% 36
38 Supplemental Table B.2. Sample design for selecting towns and cities by population size categories, six focus states Universe Sample State Population Size Category No. of Towns in Category Total Pop. in Category Percent of Pop. in Category Average Pop. Per Town No. of Towns Sampled Estimated Pop. Estimated Pop. Listed* No. of USUs Percent of Universe Towns Sampled Percent of Universe Pop. Sampled <5, , % 3, ,000-24, ,525, % 9, , ,649 NA 7.2% 7.2% Assam 25,000-99, ,232, % 42, ,032 85,032 NA 6.9% 6.9% 100, , , % 112, , , % 17.8% 500, , , % 962, , , % 20.8% 1,000, % Totals 218 4,398, % 20, ,269, , % 11.2% <5, , % 3, ,000-24, , % 12, ,450 61,450 NA 6.8% 6.8% Bihar 25,000-99, ,058, % 45, , ,661 NA 7.8% 7.8% 100, , ,071, % 202, , , % 7.9% 500, , % ,000, ,684, % 1,684, ,684, , % 11.9% Totals ,758, % 59, ,872, , % 8.3% <5, , % 2, ,000-24, ,437, % 13, , ,464 NA 7.5% 7.5% Gujarat 25,000-99, ,656, % 46, , ,704 NA 6.9% 6.9% 100, , ,252, % 170, , , % 7.1% 500, , ,206, % 603, , , % 8.3% 1,000, ,121, % 3,280, ,121,471 1,000, % 7.6% Totals ,745, % 73, ,740,317 1,905, % 7.4% <5, , % 3, ,000-24, ,343, % 13, , ,030 NA 7.2% 7.2% Madhya Pradesh 25,000-99, ,529, % 44, , ,880 NA 6.9% 6.9% 100, , ,718, % 174, , , % 6.4% 500, , , % 515, , , % 19.4% 1,000, ,929, % 1,482, ,929, , % 8.4% Totals ,084, % 41, ,592,640 1,523, % 7.6% 37
39 Supplemental Table B.2 (continued). Sample design for selecting towns and cities by population size categories, six focus states Universe Sample Percent of Universe Pop. Sampled Percent of Universe Towns Sampled No. of USUs Estimated Pop. Listed* Estimated Pop. No. of Towns Sampled Ave. Pop. Per Town Percent of Pop. in Category Total Pop. in Category No. of Towns in Category Population Size Category State <5, , % 4, ,000-24, ,130, % 12, , ,800 NA 7.4% 7.4% 25,000-99, ,808, % 45, , ,296 NA 7.2% 7.2% Tamil Nadu 100, , ,431, % 201, , , % 7.4% 500, , ,676, % 838, , , % 6.0% 1,000, ,715, % 2,238, ,715, , % 8.9% Totals ,917, % 31, ,885,363 2,627, % 7.5% <5, , % 4, ,000-24, ,928, % 12, , ,088 NA 7.5% 7.5% 25,000-99, ,300, % 44, , ,502 NA 7.2% 7.2% , , ,356, % 174, ,044, , % 7.2% Uttar Pradesh 500, , ,309, % 701, ,804, , % 7.9% 1,000, ,491, % 1,784, ,491,814 1,000, % 8.0% Totals ,495, % 48, ,600,092 3,359, % 7.6% <5, , % 3, ,000-24,999 2,158 27,274, % 12, ,010,481 2,010,481 NA 7.4% 7.4% 25,000-99, ,586, % 45, ,477,075 2,477,075 NA 7.2% 7.2% 100, , ,390, % 180, ,807,314 2,100, % 7.4% All Sampled States 500, , ,670, % 711, ,723,405 1,000, % 9.4% 1,000, ,942, % 2,102, ,942,108 3,300, % 8.3% Totals 3, ,398, % 43, ,960,382 10,887, % 7.7% * For towns <100,000 population, all wards listed; for larger towns, ward clusters totaling 100, ,000 populationlisted depending on the city size. NA= not applicable
40 Supplemental Table B.3. Total population of large* cities, and total number of wards in populaton categories, six focus states No. of Wards with Populations of: Population State District Subdistrict Town/ City Total < Bihar Patna Patna Rural Patna ,684,297 Gujarat Ahmadabad Ahmadabad City Ahmadabad ,577,940 Gujarat Surat Surat City Surat ,467,797 Gujarat Vadodara Vadodara Vadodara ,752,371 Gujarat Rajkot Rajkot Rajkot ,323,363 Madhya Pradesh Indore Indore Indore ,992,422 Madhya Pradesh Bhopal Huzur Bhopal ,798,218 Madhya Pradesh Jabalpur Jabalpur Jabalpur ,069,292 Madhya Pradesh Gwalior Gwalior (Gird) Gwalior ,069,276 Tamil Nadu Chennai n/a Chennai ,646,732 Tamil Nadu Coimbatore Coimbatore South Coimbatore ,050, Tamil Nadu Madurai Madurai South Madurai ,017,865 Uttar Pradesh Lucknow Lucknow Lucknow ,817,105 Uttar Pradesh Kanpur Nagar Kanpur Kanpur ,768,057 Uttar Pradesh Ghaziabad Ghaziabad Ghaziabad ,648,643 Uttar Pradesh Agra Agra Agra ,585,704 Uttar Pradesh Meerut Meerut Meerut ,305,429 Uttar Pradesh Varanasi Varanasi Varanasi ,198,491 Uttar Pradesh Allahabad Allahabad Allahabad ,168,385 *Cities with population of at least 1,000,000
41 Supplemental Table B.4. Facility universes, sample size, response rates and final weights: Assam Assam Universe of Health Facilities Adjusted Universe HFS Sample HFS adjusted sample Completed interviews Response Rate Weight Facility type PUBLIC FACILITIES 1,203 1, District Hospital (DH) Sub-divisional Hospital (SDH) Community Health Center (CHC) Primary Health Center (PHC), 24x Primary Health Center (PHC), non-24x URBAN OTHER PUBLIC FACILITIES Urban Public Facility (5K-100K) Urban Public Facility (100K-1M) Urban Public Facility (1M+) na na na na na na na ESI Hospital URBAN PRIVATE FACILITIES* Private Hospital (Towns 5K-100K) Private Nursing Home (Towns 5K-100K) Private Clinic (Towns 5K-100K) Private Hospital (Towns 100K-1M) Private Nursing Home (Towns 100K-1M) Private Clinic (Towns 100K-1M) Private Hospital (Towns 1M+) na na na na na na na Private Nursing Home (Towns 1M+) na na na na na na na Private Clinic (Towns 1M+) na na na na na na na RURAL PRIVATE FACILITIES* Private Rural Hospital na na na na na na na Private Rural Nursing Home na na na na na na na Private Rural Clinic OTHER TYPES OF FACILITY Medical College (MC) TOTAL NUMBER OF FACILITIES 1,687 1, TOTAL PUBLIC 1,307 1, TOTAL PRIVATE *including a few NGO facilities Notes: Adjusted universes were calculated after fieldwork was completed. Facilities that were closed, not found or not appropriate were proportionally removed from the universe. HFS samples include all facilities visited after removing facilities that were not found or deemed ineligible. The total for public sector includes all medical colleges, public and private. 40
42 Supplemental Table B.4, cont. Facility universes, sample size, response rates and final weights: Bihar Bihar Universe of Health Facilities Adjusted Universe HFS Sample HFS adjusted sample Completed interviews Response Rate Weight Facility type PUBLIC FACILITIES 2,034 2, District Hospital (DH) Sub-divisional Hospital (SDH) Community Health Center (CHC) Primary Health Center (PHC), 24x Primary Health Center (PHC), non-24x7 1,387 1, URBAN OTHER PUBLIC FACILITIES Urban Public Facility (5K-100K) Urban Public Facility (100K-1M) Urban Public Facility (1M+) na na na na na na na ESI Hospital URBAN PRIVATE FACILITIES* 2,244 2, Private Hospital (Towns 5K-100K) Private Nursing Home (Towns 5K-100K) Private Clinic (Towns 5K-100K) Private Hospital (Towns 100K-1M) Private Nursing Home (Towns 100K-1M) Private Clinic (Towns 100K-1M) Private Hospital (Towns 1M+) Private Nursing Home (Towns 1M+) Private Clinic (Towns 1M+) RURAL PRIVATE FACILITIES* Private Rural Hospital Private Rural Nursing Home Private Rural Clinic OTHER TYPES OF FACILITY Medical College (MC) TOTAL NUMBER OF FACILITIES 5,070 5, TOTAL PUBLIC 2,142 2, TOTAL PRIVATE 2,941 2, *including a few NGO facilities Notes: Adjusted universes were calculated after fieldwork was completed. Facilities that were closed, not found or not appropriate were proportionally removed from the universe. HFS samples include all facilities visited after removing facilities that were not found or deemed ineligible. The total for public sector includes all medical colleges, public and private. 41
43 Supplemental Table B.4, cont. Facility universes, sample size, response rates and final weights: Gujarat Gujarat Universe of Health Facilities Adjusted Universe HFS Sample HFS adjusted sample Completed interviews Response rates Weight Facility type PUBLIC FACILITIES 1,530 1, District Hospital (DH) Sub-divisional Hospital (SDH) Community Health Center (CHC) Primary Health Center (PHC), 24x Primary Health Center (PHC), non-24x7 1,046 1, URBAN OTHER PUBLIC FACILITIES Urban Public Facility (5K-100K) Urban Public Facility (100K-1M) na na na na na na na Urban Public Facility (1M+) na na na na na na na ESI Hospital URBAN PRIVATE FACILITIES* 1,802 1, Private Hospital (Towns 5K-100K) Private Nursing Home (Towns 5K-100K) Private Clinic (Towns 5K-100K) Private Hospital (Towns 100K-1M) Private Nursing Home (Towns 100K-1M) Private Clinic (Towns 100K-1M) Private Hospital (Towns 1M+) Private Nursing Home (Towns 1M+) Private Clinic (Towns 1M+) RURAL PRIVATE FACILITIES* Private Rural Hospital Private Rural Nursing Home Private Rural Clinic OTHER TYPES OF FACILITY Medical College (MC) TOTAL NUMBER OF FACILITIES 3,914 3, TOTAL PUBLIC 1,592 1, TOTAL PRIVATE 2,341 2, *including a few NGO facilities Notes: Adjusted universes were calculated after fieldwork was completed. Facilities that were closed, not found or not appropriate were proportionally removed from the universe. HFS samples include all facilities visited after removing facilities that were not found or deemed ineligible. The total for public sector includes all medical colleges, public and private. 42
44 Supplemental Table B.4 cont. Facility universes, sample size, response rates and final weights: Madhya Pradesh Madhya Pradesh Universe of health facilities Adjusted universe HFS Sample HFS adjusted sample Completed Interviews Response Rate Weight Facility type PUBLIC FACILITIES 1,608 1, District Hospital (DH) Sub-divisional Hospital (SDH) Community Health Center (CHC) Primary Health Center (PHC), 24x Primary Health Center (PHC), non-24x URBAN OTHER PUBLIC FACILITIES Urban Public Facility (5K-100K) na Urban Public Facility (100K-1M) Urban Public Facility (1M+) ESI Hospital URBAN PRIVATE FACILITIES* 3,277 3, Private Hospital (Towns 5K-100K) Private Nursing Home (Towns 5K-100K) Private Clinic (Towns 5K-100K) Private Hospital (Towns 100K-1M) Private Nursing Home (Towns 100K-1M) Private Clinic (Towns 100K-1M) Private Hospital (Towns 1M+) Private Nursing Home (Towns 1M+) Private Clinic (Towns 1M+) RURAL PRIVATE FACILITIES* Private Rural Hospital Private Rural Nursing Home Private Rural Clinic OTHER TYPES OF FACILITY Medical College (MC) TOTAL NUMBER OF FACILITIES 5,732 5, TOTAL PUBLIC 1,974 1, TOTAL PRIVATE 3,758 3, *including a few NGO facilities Notes: Adjusted universes were calculated after fieldwork was completed. Facilities that were closed, not found or not appropriate were proportionally removed from the universe. HFS samples include all facilities visited after removing facilities that were not found or deemed ineligible. The total for public sector includes all medical colleges, public and private. 43
45 Supplemental Table B.4, cont. Facility universes, sample size, response rates and final weights: Tamil Nadu Tamil Nadu Universe of Health Facilities Adjusted Universe HFS Sample HFS adjusted sample Completed interviews Response Rate Weight Facility type PUBLIC FACILITIES 2,025 2, District Hospital (DH) Sub-divisional Hospital (SDH) Community Health Center (CHC) Primary Health Center (PHC), 24x7 1,229 1, Primary Health Center (PHC), non-24x URBAN OTHER PUBLIC FACILITIES Urban Public Facility (5K-100K) Urban Public Facility (100K-1M) Urban Public Facility (1M+) ESI Hospital URBAN PRIVATE FACILITIES* 3,814 3, Private Hospital (Towns 5K-100K) 1,235 1, Private Nursing Home (Towns 5K-100K) Private Clinic (Towns 5K-100K) Private Hospital (Towns 100K-1M) Private Nursing Home (Towns 100K-1M) Private Clinic (Towns 100K-1M) Private Hospital (Towns 1M+) Private Nursing Home (Towns 1M+) Private Clinic (Towns 1M+) RURAL PRIVATE FACILITIES* Private Rural Hospital Private Rural Nursing Home na na na na na na na Private Rural Clinic OTHER TYPES OF FACILITY Medical College (MC) TOTAL NUMBER OF FACILITIES 6,188 6, TOTAL PUBLIC 2,294 2, TOTAL PRIVATE 3,894 3, *including a few NGO facilities Notes: Adjusted universes were calculated after fieldwork was completed. Facilities that were closed, not found or not appropriate were proportionally removed from the universe. HFS samples include all facilities visited after removing facilities that were not found or deemed ineligible. The total for public sector includes all medical colleges, public and private. 44
46 Supplemental Table B.4, cont. Facility universes, sample size, response rates and final weights: Uttar Pradesh Uttar Pradesh Universe of Health Facilities Adjusted Universe HFS Sample HFS adjusted sample Completed interviews Response Rates Weight Facility type PUBLIC FACILITIES 4,350 4, District Hospital (DH) Sub-divisional Hospital (SDH) na na na na na na na Community Health Center (CHC) Primary Health Center (PHC), 24x Primary Health Center (PHC), non-24x7 3,132 3, URBAN OTHER PUBLIC FACILITIES Urban Public Facility (5K-100K) Urban Public Facility (100K-1M) Urban Public Facility (1M+) ESI Hospital URBAN PRIVATE FACILITIES* 5,637 5, Private Hospital (Towns 5K-100K) Private Nursing Home (Towns 5K-100K) Private Clinic (Towns 5K-100K) 1,038 1, Private Hospital (Towns 100K-1M) Private Nursing Home (Towns 100K-1M) Private Clinic (Towns 100K-1M) 1,373 1, Private Hospital (Towns 1M+) Private Nursing Home (Towns 1M+) Private Clinic (Towns 1M+) RURAL PRIVATE FACILITIES* 3,114 3, Private Rural Hospital Private Rural Nursing Home Private Rural Clinic 1,756 1, OTHER TYPES OF FACILITY Medical College (MC) TOTAL NUMBER OF FACILITIES 13,880 13,787 1,294 1,286 1, TOTAL PUBLIC 5,129 5, TOTAL PRIVATE 8,751 8, *including a few NGO facilities Notes: Adjusted universes were calculated after fieldwork was completed. Facilities that were closed, not found or not appropriate were proportionally removed from the universe. HFS samples include all facilities visited after removing facilities that were not found or deemed ineligible. The total for public sector includes all medical colleges, public and private. 45
47 Supplemental Table B.4, cont. Facility universes, sample size, response rates and final weights: all six states All six states Universe of Health Facilities Adjusted Universe HFS Sample HFS adjusted sample Completed interviews Response Rates Facility type PUBLIC FACILITIES 12,750 12,685 1,849 1,837 1, District Hospital (DH) Sub-divisional Hospital (SDH) Community Health Center (CHC) 2,033 2, Primary Health Center (PHC), 24x7 3,109 3, Primary Health Center (PHC), non-24x7 6,969 6, URBAN OTHER PUBLIC FACILITIES 1,559 1, Urban Public Facility (5K-100K) Urban Public Facility (100K-1M) Urban Public Facility (1M+) ESI Hospital URBAN PRIVATE FACILITIES* 17,138 16,739 1,483 1,450 1, Private Hospital (Towns 5K-100K) 3,042 3, Private Nursing Home (Towns 5K-100K) 1,909 1, Private Clinic (Towns 5K-100K) 2,959 2, Private Hospital (Towns 100K-1M) 1,866 1, Private Nursing Home (Towns 100K-1M) 1,406 1, Private Clinic (Towns 100K-1M) 2,049 1, Private Hospital (Towns 1M+) 1,985 1, Private Nursing Home (Towns 1M+) Private Clinic (Towns 1M+) 1,070 1, RURAL PRIVATE FACILITIES* 4,928 4, Private Rural Hospital 1,737 1, Private Rural Nursing Home Private Rural Clinic 2,445 2, OTHER TYPES OF FACILITY Medical College (MC) TOTAL NUMBER OF FACILITIES 36,471 35,783 4,225 4,149 4,001 TOTAL PUBLIC 14,438 14,293 2,164 2,140 2,091 TOTAL PRIVATE 22,065 21,490 2,061 2,009 1,910 *including a few NGO facilities Adjusted universes were calculated after fieldwork was completed. Facilities that were closed, not found or not appropriate were proportionally removed from the universe. HFS samples include all facilities visited after removing facilities that were not found or deemed ineligible. The total for public sector includes all medical colleges, public and private. 46
48 Supplemental Table B.5. Total urban population and urban population covered during listing fieldwork in small, medium and large towns, six focus state Total urban population Urban population covered in listing fieldwork Total urban population Urban population covered in listing fieldwork Total urban population Urban population covered in listing fieldwork Facility type URBAN PRIVATE FACILITIES* Private Hospital (Towns 5K-100K) Assam 2,758, ,141 Bihar 4,967, ,016 Gujarat 7,003, ,537 Private Nursing Home (Towns 5K-100K) 2,758, ,141 4,967, ,016 7,003, ,537 Private Clinic (Towns 5K-100K) 2,758, ,141 4,967, ,016 7,003, ,537 Private Hospital (Towns 100K-1M) 1,523, ,028 5,072, ,067 5,684, ,601 Private Nursing Home (Towns 100K-1M) 1,523, ,028 5,072, ,067 5,684, ,601 Private Clinic (Towns 100K-1M) 1,523, ,028 5,072, ,067 5,684, ,601 Private Hospital (Towns 1M+) na na 1,683, ,866 12,986,285 2,522,225 Private Nursing Home (Towns 1M+) na na 1,683, ,866 12,986,285 2,522,225 Private Clinic (Towns 1M+) na na 1,683, ,866 12,986,285 2,522,225 URBAN OTHER PUBLIC FACILITIES** Urban Public Facility (5K-100K) 2,758, ,141 4,967, ,016 7,003, ,537 Urban Public Facility (100K-1M) 1,523, ,028 5,072, ,067 5,684, ,601 Urban Public Facility (1M+) na na 1,683, ,866 12,986,285 2,522,225 Facility type URBAN PRIVATE FACILITIES* Madhya Pradesh Tamil Nadu Uttar Pradesh Private Hospital (Towns 5K-100K) 8,873, ,601 20,938,728 1,373,046 17,229,367 1,161,835 Private Nursing Home (Towns 5K-100K) 8,873, ,601 20,938,728 1,373,046 17,229,367 1,161,835 Private Clinic (Towns 5K-100K) 8,873, ,601 20,938,728 1,373,046 17,229,367 1,161,835 Private Hospital (Towns 100K-1M) 5,299, ,071 7,063,753 1,263,316 16,372,542 1,096,757 Private Nursing Home (Towns 100K-1M) 5,299, ,071 7,063,753 1,263,316 16,372,542 1,096,757 Private Clinic (Towns 100K-1M) 5,299, ,071 7,063,753 1,263,316 16,372,542 1,096,757 Private Hospital (Towns 1M+) 5,864,120 1,011,502 6,759,419 1,226,224 10,785,106 2,033,948 Private Nursing Home (Towns 1M+) 5,864,120 1,011,502 6,759,419 1,226,224 10,785,106 2,033,948 Private Clinic (Towns 1M+) 5,864,120 1,011,502 6,759,419 1,226,224 10,785,106 2,033,948 URBAN OTHER PUBLIC FACILITIES** Urban Public Facility (5K-100K) 8,873, ,601 20,938,728 1,373,046 17,229,367 1,161,835 Urban Public Facility (100K-1M) 5,299, ,071 7,063,753 1,263,316 16,372,542 1,096,757 Urban Public Facility (1M+) 5,864,120 1,011,502 6,759,419 1,226,224 10,785,106 2,033,948 *Includes some NGO/Trusts **Include any urban public facilities that are not District Hospitals, Sub-divisional hospitals, CHCs, PHCs, ESIC hospitals or medical colleges. Notes: na=not applicable 47

49 Appendix Part 3: Health Facility Survey Questionnaire Hindi/English 48
50 49

51 50

52 51
53 52

54 53
55 54
56 55
57 56

58 57

59 58
60 59
61 60
62 61

63 62
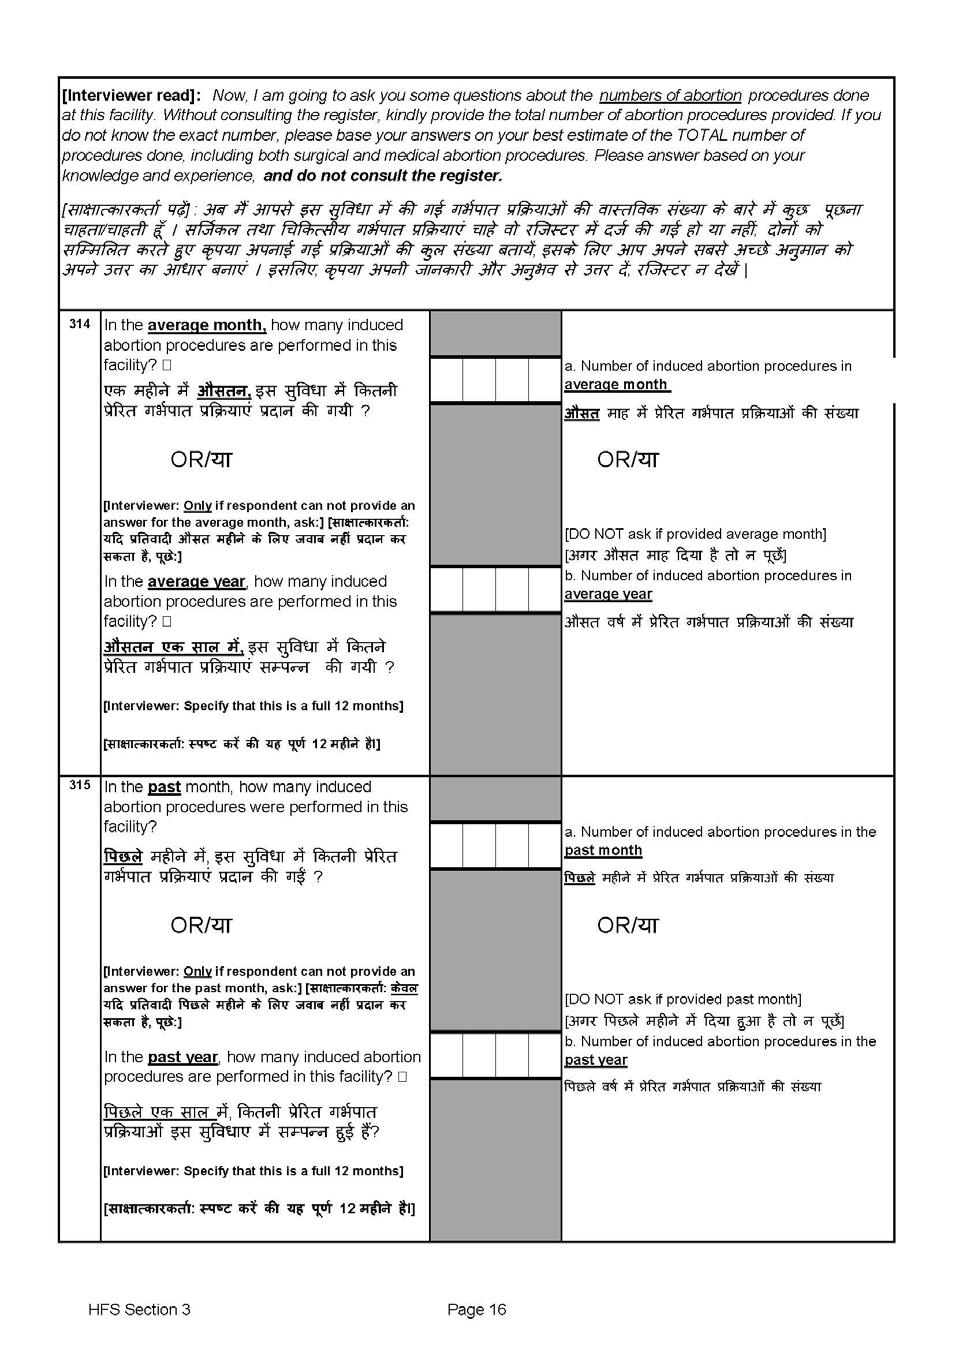
64 63

65 64

66 65
67 66
68 67
69 68

70 69

71 70
72 71
73 72

74 73

75 74

76 75

77 76
78 77

79 78

80 79

81 80
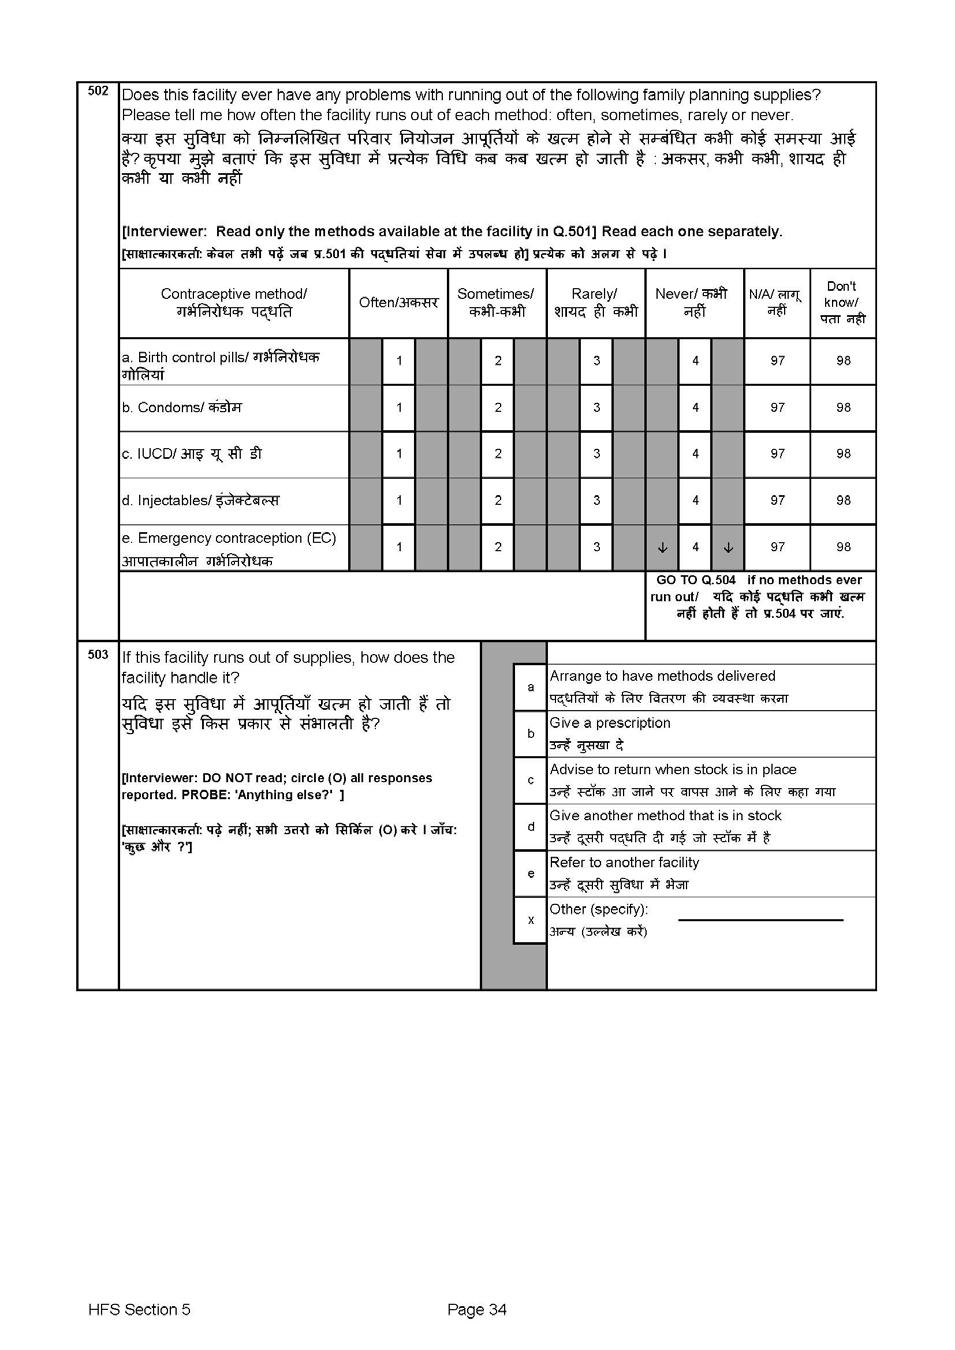
82 81

83 82

84 83
85 84

86 85
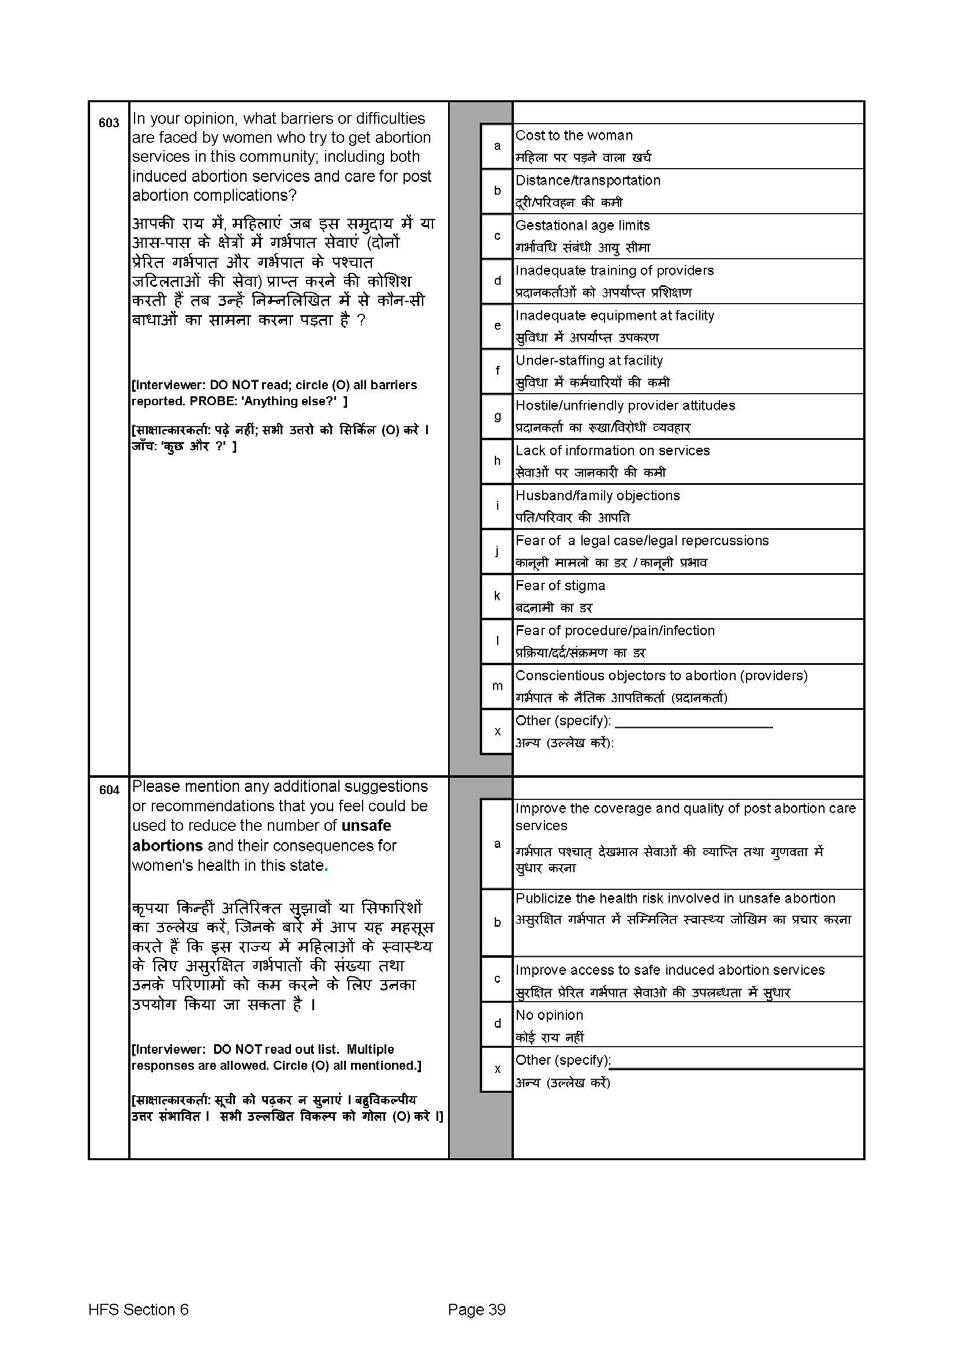
87 86

88 87

89 88
90 89

91 90
Haryana-06 Delhi-07 Total disabled population Persons 455, , , ,886 13, ,454 Males 273, ,908 68, ,872 8, ,44
 INDIA-00 Jammu & Kashmir-01 Total disabled population Persons 21,906,769 16,388,382 5,518,387 302,670 229,718 72,952 Males 12,605,635 9,410,185 3,195,450 171,816 129,443 42,373 Females 9,301,134 6,978,197
Supplementary webappendix
 Supplementary webappendix This webappendix formed part of the original submission and has been peer reviewed. We post it as supplied by the authors. Supplement to: Arinaminpathy N, Batra D, Khaparde S,
CHARACTERISTICS OF SURVEY RESPONDENTS 3
 CHARACTERISTICS OF SURVEY RESPONDENTS 3 The health, nutrition, and demographic behaviours of women and men vary by their own characteristics, such as age, marital status, religion, and caste, as well as
Trends and Differentials in Fertility and Family Planning Indicators of EAG States in India
 Trends and Differentials in Fertility and Family Planning Indicators of EAG States in India September 2012 Authors: Dr. R.K Srivastava, 1 Dr. Honey Tanwar, 1 Dr. Priyanka Singh, 1 and Dr. B.C Patro 1 1
The burden of cancers and their variations across the states of India: the Global Burden of Disease Study
 The burden of cancers and their variations across the states of India: the Global Burden of Disease Study 0 0 India State-Level Disease Burden Initiative Cancer Collaborators* Summary Background Previous
GOVERNMENT OF INDIA MINISTRY OF HEALTH AND FAMILY WELFARE DEPARTMENT OF HEALTH AND FAMILY WELFARE
 GOVERNMENT OF INDIA MINISTRY OF HEALTH AND FAMILY WELFARE DEPARTMENT OF HEALTH AND FAMILY WELFARE 1103. SHRI J.J.T. NATTERJEE: SHRI KANWAR SINGH TANWAR: ADV. JOICE GEORGE: SHRI PANKAJ CHAUDHARY: LOK SABHA
A I D S E p I D E m I c u p D A t E a S I a ASIA china India
 ASIA In Asia, national HIV prevalence is highest in South-East Asia, with wide variation in epidemic trends between different countries. While the epidemics in Cambodia, Myanmar and Thailand all show declines
Swiss Re Institute Symposium Insurance at the crossroad of technology development and growth opportunities. 31 October 2017
 Swiss Re Institute Symposium Insurance at the crossroad of technology development and growth opportunities 31 October 2017 This event may be photographed, videotaped, filmed and/or recorded. A summary
Briefing on Intensified Malaria Control Project-3 (IMCP-3)
") Briefing on Intensified Malaria Control Project-3 (IMCP-3) India CCM Induction and Orientation Workshop 3 rd -4 th December 2015 Directorate of National Vector Borne Diseases Control Programme, Delhi Plan
Briefing on Intensified Malaria Control Project-3 (IMCP-3) India CCM Induction and Orientation Workshop 3 rd -4 th December 2015 Directorate of National Vector Borne Diseases Control Programme, Delhi Plan
India's voice against AIDS. December 2012
 India's voice against AIDS December 2012 HIV Sentinel Surveillance 2010-11 A Technical Brief India's voice against AIDS December 2012 Contents Acronyms...4 Executive Summary...5 1. Introduction...8 Objectives
The changing patterns of cardiovascular diseases and their risk factors in the states of India: the Global Burden of Disease Study
 The changing patterns of cardiovascular diseases and their risk factors in the states of India: the Global Burden of Disease Study 1990 2016 India State-Level Disease Burden Initiative CVD Collaborators*
CHAPTER 5 FAMILY PLANNING
 CHAPTER 5 FAMILY PLANNING The National Family Welfare Programme in India has traditionally sought to promote responsible and planned parenthood through voluntary and free choice of family planning methods
PREVENTION AND EARLY DETECTION OF CANCER. Will the Minister of HEALTH AND FAMILY WELFARE be pleased to state:
 GOVERNMENT OF INDIA MINISTRY OF HEALTH AND FAMILY WELFARE DEPARTMENT OF HEALTH AND FAMILY WELFARE LOK SABHA UNSTARRED QUESTION NO. 2212 TO BE ANSWERED ON 28 TH JULY, 2017 PREVENTION AND EARLY DETECTION
6.10. NUTRITIONAL STATUS OF TRIBAL POPULATION
 6.1. NUTRITIONAL STATUS OF TRIBAL POPULATION The tribal populations are is recognised as socially and economically vulnerable. Their lifestyles and food habits are different from that of their rural neighbours.
7.10. NUTRITIONAL STATUS OF TRIBAL POPULATION
 7.1. NUTRITIONAL STATUS OF TRIBAL POPULATION The tribal populations are is recognised as socially and economically vulnerable. Their lifestyles and food habits are different from that of their rural neighbours.
BMJ Open ESTIMATE OF HIV PREVALENCE AND NUMBER OF PEOPLE LIVING WITH HIV IN INDIA
 ESTIMATE OF HIV PREVALENCE AND NUMBER OF PEOPLE LIVING WITH HIV IN INDIA 00-0 Journal: BMJ Open Manuscript ID: bmjopen-0-000 Article Type: Research Date Submitted by the Author: 0-Feb-0 Complete List of
Rural Healthcare Infrastructural Disparities in India: a Critical Analysis of Availability and Accessibility
 DOI: http://doi.org/10.15415/jmrh.2017.32011 Rural Healthcare Infrastructural Disparities in India: a Critical Analysis of Availability and MOHD TAQI 1 *, SWATI BIDHURI 2, SUSMITA SARKAR 3, WANI SUHAIL
DFID India VAW strategy
 DFID India VAW strategy 1. Catalysis 2. Analysis 3. Strategies Dr Peter Evans, Senior Governance Adviser, DFID India 1 1. Catalysis India s Domestic Violence Act (2005) (some) legal ambiguity cleared up
Ageing in India: The Health Issues
 Malcolm Adiseshiah Mid-Year Review of the Indian Economy 2016-17 Ageing in India: The Health Issues Debasis Barik November 5, 2016 India International Centre, New Delhi Outline Background Population Ageing:
7.2 VITAMIN A DEFICIENCY
 7.2 VITAMIN A DEFICIENCY Vitamin A is an important micronutrient for maintaining normal growth, regulating cellular proliferation and differentiation, controlling development, and maintaining visual and
CHAPTER TWO: TRENDS IN FAMILY PLANNING USE AND PUBLIC SECTOR OUTLAY IN INDIA
 CHAPTER TWO: TREDS I FAMILY PLAIG USE AD PUBLIC SECTOR OUTLAY I IDIA 2.1 Introduction: This chapter examines the trends in use of family planning methods, changes in use of family planning methods over
SUMMARY OF HEALTH AND FAMILY WELFARE PROGRAMME IN INDIA
 SUMMARY OF HEALTH AND FAMILY WELFARE PROGRAMME IN INDIA Executive Summary Health and Family Welfare Statistics in India 2015 The Ministry of Health and Family Welfare has been bringing out a statistical
HEALTHCARE OF ELDERLY PEOPLE. Will the Minister of HEALTH AND FAMILY WELFARE be pleased to state:
 1871. SHRI R. PARTHIPAN: GOVERNMENT OF INDIA MINISTRY OF HEALTH AND FAMILY WELFARE DEPARTMENT OF HEALTH AND FAMILY WELFARE LOK SABHA UNSTARRED QUESTION NO. 1871 TO BE ANSWERED ON 29 TH DECEMBER, 2017 HEALTHCARE
India HIV Estimates-2006
 TECHNICAL REPORT India HIV Estimates-2006 NA O C National AIDS Control Organisation Ministry of Health and Family Welfare Government of India TECHNICAL REPORT India HIV Estimates-2006 NA O C National
GOVERNMENT OF INDIA MINISTRY OF HEALTH AND FAMILY WELFARE DEPARTMENT OF HEALTH AND FAMILY WELFARE
 GOVERNMENT OF INDIA MINISTRY OF HEALTH AND FAMILY WELFARE DEPARTMENT OF HEALTH AND FAMILY WELFARE LOK SABHA STARRED QUESTION NO. 83 TO BE ANSWERED ON THE 21 ST JULY, 2017 VECTOR BORNE DISEASES *83. SHRI
Methodology. 1 P a g e
 Extended Abstract Disparities in Social Development and Status of women: An analysis of India and its states Ranjana Kesarwani* *Doctoral Candidate, International Institute for Population Sciences, Mumbai-400088,
India - National Family Health Survey
 Microdata Library India - National Family Health Survey 1998-1999 International Institute for Population Sciences (IIPS) - Ministry of Health and Family Welfare (MOHFW) Report generated on: June 16, 2017
WOMEN ENTERPRENEURSHIP STAUS, CHALLENGES AND PROBLEMS
 WOMEN ENTERPRENEURSHIP STAUS, CHALLENGES AND PROBLEMS DURE YOJANA UTTAMRAO Ph.D. SCOLAR, JJU E.Mail osdyojana@gmail.com Mobile no-9011960848 Introduction Though endowed with the natural capacity of production
Measuring Level and Pattern of Infertility and Childlessness in India
 Measuring Level and Pattern of Infertility and Childlessness in India Sujata Ganguly a, Sayeed Unisa b a PhD scholar, International Institute for Population Sciences, Mumbai, India. Emailsujataganguly2002@rediffmail.com
The incidence of abortion in Ethiopia: Current levels and trends
 The incidence of abortion in Ethiopia: Current levels and trends Abstract: In 2005, the Ethiopian Parliament amended the penal code to allow abortion in cases of rape/incest, if the woman has physical
FOREWORD. Sayan Chatterjee. Sayan Chatterjee. 30 November, 2012
 CONTENTS Foreword v Preface vii Acronyms ix List of Figures and Tables xi Executive Summary xv Chapter 1: Overview of the Process of HIV Estimations 1 Chapter 2: Methodology 7 Chapter 3: Results 27 Chapter
India s Contribution in Rolling out Newer and Rapid Diagnostics towards PMDT Scale-up
 India s Contribution in Rolling out Newer and Rapid Diagnostics towards PMDT Scale-up Balasangameshwara Vollepore, FIND (India) FIND and Partners Symposium 43 rd Union World Conference on Lung Health November
XXVI IUSSP International Population Conference in Marrakech, Morocco, 2009
 Paper Submitted in XXVI IUSSP International Population Conference in Marrakech, Morocco, 2009 Title Understanding the Factors Associated with Slow Progress in Childhood Immunisation in India Abhishek Kumar
7.11. MICRONUTRIENT DEFICIENCIES
 Introduction 7.11. MICRONUTRIENT DEFICIENCIES Goitre due to iodine deficiency, blindness due to Vitamin A deficiency, dry and wet beriberi and pellagra were the major public health problems in preindependent
Revitalization of PPFP/PPIUCD Services in India Dr Bulbul Sood Country Director Jhpiego/India
 Revitalization of PPFP/PPIUCD Services in India Dr Bulbul Sood Country Director Jhpiego/India Family Planning Technical Meeting Women Deliver Conference, Kuala Lumpur, Malaysia 27 May 2013 India Most Populous
SURAKSHA YOJANA, INSTITUTIONAL DELIVERIES AND MATERNAL MORTALITY: WHAT DOES THE EVIDENCE SAY?
 14 JANANI SURAKSHA YOJANA, INSTITUTIONAL DELIVERIES AND MATERNAL MORTALITY: WHAT DOES THE EVIDENCE SAY? Ambrish Dongre Despite tremendous medical advances, the instances of maternal and neonatal mortality
IODINE DEFICIENCY DISORDERS
 Iodine Deficiency Disorders (IDD) have been recognized as a major public health problem in India. Unlike other micronutrient deficiencies, IDD is due to deficiency of iodine in water, soil and 7.11.3 IODINE
Assessment of Progress Made in Health Infrastructure and Manpower through NRHM and Their Impact in Reducing IMR in India
 Journal of Finance and Economics, 2013, Vol. 1, No. 4, 118-127 Available online at http://pubs.sciepub.com/jfe/1/4/9 Science and Education Publishing DOI:10.12691/jfe-1-4-9 Assessment of Progress Made
Gender Inequality in Terms of Health and Nutrition in India: Evidence from National Family Health Survey-3
 Pacific Business Review International Volume 5 Issue 12 (June 2013) Gender Inequality in Terms of Health and Nutrition in India: Evidence from National Family Health Survey-3 A K Tiwari * Gender inequality
Tuberculosis-HIV epidemic situation and emerging challenges in North India
 NTI Bulletin 2015,51 /1&4, 1 7 Tuberculosis-HIV epidemic situation and emerging challenges in North India Rajesh Deshmukh 1,3, Raghu Ram Rao 2, Shah A 2,3, Sreenivas A Nair 3, R S Gupta 1, SD Khaparde
Achieving Polio Eradication in India. Emergency Preparedness and Response Plan 2011
 Achieving Polio Eradication in India Emergency Preparedness and Response Plan 2011 Emergency Preparedness and Response Plan 2011 The Emergency Preparedness and Response Plan has been developed at the request
Role of National Rural Employment Guarantee Scheme in achieving Gender Equality in Rural India
 Role of National Rural Employment Guarantee Scheme in achieving Gender Equality in Rural India Dr Waheeda Sunny Thomas Faculty Economics, SEMCOM, Gujarat, India ABSTRACT National rural employment guarantee
International Journal of Health Sciences and Research ISSN:
 International Journal of Health Sciences and Research www.ijhsr.org ISSN: 2249-9571 Original Research Article Trends of Imbalance in Child Sex Ratio of Gujarat, India Jaiminkumar P. Patel 1, Medhavi Agarwal
SUMMARY OF THE DIABETIC RETINOPATHY AND RETINOPATHY OF PREMATURITY INITIATIVES IN INDIA MID-TERM REVIEW
 SUMMARY OF THE DIABETIC RETINOPATHY AND RETINOPATHY OF PREMATURITY INITIATIVES IN INDIA MID-TERM REVIEW Review conducted by Amaltas, India. Submitted January 2017 AN INDEPENDENT REVIEW OF THE TRUST S DIABETIC
DECENTRALISED PLANNING, IMPLEMENATION &MONITORING OF HEALTH CARE IN INDIA
 DECENTRALISED PLANNING, IMPLEMENATION &MONITORING OF HEALTH CARE IN INDIA Presented at the Forum of Federations conference on Decentralization of Health Care Delivery in India New Delhi Feb. 8 to 10, 2004
Participation of Female Labour Force in Agriculture Sector (A Study with Reference to Chhattisgarh, India)
") Participation of Female Labour Force in Agriculture Sector (A Study with Reference to Chhattisgarh, India) Dr. Seraphinus Kispotta 1, Gyanesh Kumar 2, and Arun Vadyak 3 1 (Asst. Prof., Department of Economics,
Participation of Female Labour Force in Agriculture Sector (A Study with Reference to Chhattisgarh, India) Dr. Seraphinus Kispotta 1, Gyanesh Kumar 2, and Arun Vadyak 3 1 (Asst. Prof., Department of Economics,
Transition in Age Pattern of Marital Fertility in India:
 Transition in Age Pattern of Marital Fertility in India: 1985-2007 Aalok Ranjan Shyam Institute aranjan@shyaminstitute.in Abstract This paper analyses the transition in the age pattern of marital fertility
Millennium Development Goals India Country Report 2014
 Millennium Development Goals India Country Report 2014 Social Statistics Division Ministry of Statistics and Programme Implementation Government of India www.mospi.nic.in I Millennium Developm Development
Flour Fortification: Millers and Governments Working Together to Reduce Vitamin and Mineral Deficiencies. Annoek van den Wijngaart 10 October 2012
 Flour Fortification: Millers and Governments Working Together to Reduce Vitamin and Mineral Deficiencies Annoek van den Wijngaart 10 October 2012 What is Flour Fortification? Fortification is adding vitamins
Chapter 2 Changing Calorie Consumption and Dietary Patterns
 Chapter 2 Changing Calorie Consumption and Dietary Patterns While access to adequate food and appropriate caring practices underlie the formulation of nutrition policy in India, an emerging and different
Impact of Violence On Women s Reproductive Health: A Case Study in India Ananya Patra* Dr. Jalandhar Pradhan
 EXTENDED ABSTRACT Impact of Violence On Women s Reproductive Health: A Case Study in India Ananya Patra* Dr. Jalandhar Pradhan Introduction Domestic violence has become a matter of serious concern in both
National Family Health Survey-2. Bihar FAMILY PLANNING AND QUALITY OF CARE
 1998-99 Bihar FAMILY PLANNING AND QUALITY OF CARE Family Planning and Quality of Care Knowledge Use Source Informed Choice and Follow-Up Unmet Need for Family Planning Trends in Knowledge of Contraceptive
New Infections (all age groups)
") C H A P T E R 27 Epidemiology BB Rewari The terms /AIDS were unknown just about three and half decades ago, yet it has emerged as one of the leading cause of death among young adults. In July 1981, the
C H A P T E R 27 Epidemiology BB Rewari The terms /AIDS were unknown just about three and half decades ago, yet it has emerged as one of the leading cause of death among young adults. In July 1981, the
ISSN: (Online) RESEARCH REVIEW International Journal of Multidisciplinary
 RESEARCH REVIEW International Journal of Multidisciplinary") Volume-03 Issue-12 December -2018 ISSN: 2455-3085 (Online) www.rrjournals.com [UGC Listed Journal] Demographic Change and Urbanization in India with reference to Empowered Action Group (EAG) States: Some
Volume-03 Issue-12 December -2018 ISSN: 2455-3085 (Online) www.rrjournals.com [UGC Listed Journal] Demographic Change and Urbanization in India with reference to Empowered Action Group (EAG) States: Some
The changing contours of fertility in India CZ Guilmoto, IRD/CEPED, Paris
 The changing contours of fertility in India CZ Guilmoto, IRD/CEPED, Paris Abstract: India provides a terrain ground for investigating the long-term dynamics of fertility change for several reasons. First,
Summary of Family Welfare Programe in India
 Summary of Family Welfare Programe in India Executive Summary The Ministry of Health and Family Welfare brings out a statistical publication titled Family Welfare Statistics in India. The publication
India Factsheet: A Health Profile of Adolescents and Young Adults
 India Factsheet: A Health Profile of Adolescents and Young Adults Overview of Morbidity and Mortality With a population of 1.14 billion people, the more than 200 million youth aged 15-24 years represent
TRENDS AND DIFFERENTIALS IN FERTILITY AND FAMILY PLANNING INDICATORS IN JHARKHAND
 Journal of Economic & Social Development, Vol. - XI, No. 1, June 2015 ISSN 0973-886X 129 TRENDS AND DIFFERENTIALS IN FERTILITY AND FAMILY PLANNING INDICATORS IN JHARKHAND Rajnee Kumari* Fertility and Family
A Call to Action Children The missing face of AIDS
 A Call to Action Children The missing face of AIDS Prevention of Mother to Child Transmission: Implementation Status in Asia and Pacific Dr Myo Zin Nyunt, UNICEF ROSA CONSULTATION ON INTEGRATING PREVENTION
WORKING PAPER DEMOGRAPHIC CHANGE AND GENDER INEQUALITY: A COMPARATIVE STUDY OF MADHYA PRADESH AND KARNATAKA. C M Lakshmana
 WORKING PAPER 183 DEMOGRAPHIC CHANGE AND GENDER INEQUALITY: A COMPARATIVE STUDY OF MADHYA PRADESH AND KARNATAKA C M Lakshmana INSTITUTE FOR SOCIAL AND ECONOMIC CHANGE 2007 DEMOGRAPHIC CHANGE AND GENDER
Fertility Transition in India:
 Fertility Transition in India: 1985-2003 Alok Ranjan Chaurasia Professor Population Research Centre Institute of Economic Growth University of Delhi Enclave Delhi-110007 India December 2006 Abstract Using
Global summary of the AIDS epidemic, December 2007
 Global summary of the AIDS epidemic, December 27 Number of people living with HIV in 27 Total Adults Women Children under 15 years 33.2 million [3.6 36.1 million] 3.8 million [28.2 33.6 million] 15.4 million
ASSESSING INDIA S PROGRESS IN ACHIEVING THE MILLENNIUM DEVELOPMENT GOALS: KEY DRIVERS OF INTER-STATE VARIATIONS
 ESCAP SOUTH AND SOUTH-WEST ASIA OFFICE ASSESSING INDIA S PROGRESS IN ACHIEVING THE MILLENNIUM DEVELOPMENT GOALS: KEY DRIVERS OF INTER-STATE VARIATIONS Shiladitya Chatterjee, Matthew Hammill, Nagesh Kumar
SPATIO-TEMPORAL PATTERNS OF SEX RATIO AND ITS DIFFERENTIALS IN WEST BENGAL
 International Journal of Research in Social Sciences Vol. 7 Issue 9, September 2017, ISSN: 2249-2496 Impact Factor: 7.081 Journal Homepage: Double-Blind Peer Reviewed Refereed Open Access International
A FOCUS ON CHILDREN ANDHRA PRADESH
 A FOCUS ON CHILDREN ANDHRA PRADESH TABLE OF CONTENT 1 Introduction... 2 1.1. Demography and income ---------------------------------------------3 2 Water & Sanitation... 6 2.1. Sanitation ---------------------------------------------------------------7
Myanmar and Birth Spacing: An overview
 Myanmar and Birth Spacing: An overview Background Myanmar is bordered by three of the world s most populous countries: China, India and Bangladesh. The total population of Myanmar is 59.13 million and,
Alcohol Consumption in India: An Analysis of IHDS Data
 ISSN (Online) : 2378-7031 Volume 4, 2018, 15 pages Research Article Introduction Open Access Nasim Ahamed Mondal 1 *, Mithun Mog 2, Kacho Amir Khan 3 * 1 Project Officer, International Institute for Population
Evaluation of Malnutrition in India with Reference to its Poverty
 IJA MH International Journal on Arts, Management and Humanities 5(2): 15-19(2016) ISSN No. (Online): 2319 5231 Evaluation of Malnutrition in India with Reference to its Poverty Nilima Y. Bhoge Head, Department
DECOMPOSITION ANALYSES OF RECENT DECLINE IN FERTILITY OF INDIA AND ITS MAJOR STATES
 DECOMPOSITION ANALYSES OF RECENT DECLINE IN FERTILITY OF INDIA AND ITS MAJOR STATES Ravendra K Sharma 1, Manju Rani 2, Arvind Pandey 3 1 Regional Medical Research Centre for Tribals (ICMR), Jabalpur, India
3. THE NATIONAL SURVEY-
 3. THE NATIONAL SURVEY- OBJECTIVE AND METHODOLOGY The objective of the present survey is to develop national baseline estimates and determine the extent of drug abuse. It suggests steps to be initiated
Hanimi Reddy Modugu 1*, Manish Kumar 2, Ashok Kumar 3 and Christopher Millett 4
 Modugu et al. BMC Public Health 2012, 12:1048 RESEARCH ARTICLE Open Access State and socio-demographic group variation in out-of-pocket expenditure, borrowings and Janani Suraksha Yojana (JSY) programme
Strengthening Evidence for Programming on Unintended Pregnancy. Safe abortion and post-abortion care research
 Strengthening Evidence for Programming on Unintended Pregnancy Safe abortion and post-abortion care research 1 Today s session Purpose: Share STEP UP abortion research insights Showcase how evidence has
Family Planning in India
 National Consultation of Civil Society Organizations on Family Planning in India Friday, June 8, 2012 India International Centre (IIC) New Delhi A Concept Note 1 Access to contraceptive choices and ability
TB-HIV in the South-East Asia Region
 TB-HIV in the South-East Asia Region 13 th Core Group Meeting of the TB/HIV Working Group April 17-18 New York, USA Dr Nani Nair Regional Advisor-TB TB and HIV in South-East Asia Outline Epidemiology of
in chapter 2, for regulation 2.1 relating to DAIRY PRODUCTS AND ANALOGUES, the following shall be substituted, namely:-
 Dated, the 2 nd August, 2017 Notice for operationalisation of amendment regulations regarding revised standards for milk and milk products and certain restriction on sale of cream. 1. The Food Safety and
Disparities in Social development and Status of women: An analysis of India and its States
 International Research Journal of Social Sciences ISSN 2319 3565 Disparities in Social development and Status of women: An analysis of India and its States Abstract Kesarwani Ranjana and Yadav Awdhesh
Exploring the socioeconomic, demographic and behavioral correlates of gender disparities in HIV testing in India
 Exploring the socioeconomic, demographic and behavioral correlates of gender disparities in HIV testing in India Mayank Kumar Singh 1 S.K. Singh 2 Ravi Prakash 3 Abstract: The existence and rapid spread
HUMAN DEVELOPMENT INDEX: STATUS IN TELANGANA
 Chapter6 HUMAN DEVELOPMENT INDEX: STATUS IN TELANGANA People are the real wealth of nations, and human development focuses on enlarging people s choices Human Development Report, 2015, UNDP. Human development
IJCISS Vol.2 Issue-09, (September, 2015) ISSN: International Journal in Commerce, IT & Social Sciences (Impact Factor: 2.
 ISSN: International Journal in Commerce, IT & Social Sciences (Impact Factor: 2.") (Impact Factor: 2.446) Infant and Child Mortality in India: Levels, Trends and Determinants Naveen Sood Naveen Sood, Assistant Professor PG Department of Economics, DAV College, Jalandhar, Punjab ABSTRACT
(Impact Factor: 2.446) Infant and Child Mortality in India: Levels, Trends and Determinants Naveen Sood Naveen Sood, Assistant Professor PG Department of Economics, DAV College, Jalandhar, Punjab ABSTRACT
The predominance of female deficiency has been a
 a case study International Journal of Commerce and Business Management ; Vol. 4 Issue 1 (April, 2011) : 155-162 A critical analysis of sex ratio in n scenario with special reference to Orissa Received
INTRODUCTION BACKGROUND OF THE NATIONAL FAMILY HEALTH SURVEYS
 INTRODUCTION 1 1.1 BACKGROUND OF THE NATIONAL FAMILY HEALTH SURVEYS The National Family Health Surveys (NFHS) are nationwide surveys conducted with a representative sample of households throughout the
Fertility Trends in North-East India
 Association for North East India Studies From the SelectedWorks of Journal of North East India Studies December, 2015 Fertility Trends in North-East India P Thongkhanthang Available at: https://works.bepress.com/jneis/70/
USERS OPINION ON USE AND WASTAGE OF CONDOM IN INDIA
 Health and Population- Perspectives and Issues 30 (3): 189-207, 2007 USERS OPINION ON USE AND WASTAGE OF CONDOM IN INDIA A. M. Khan*, R. Gandotra** and G.S. Karol** ABSTRACT A country-wide survey was carried
Form IV-A Short-term Inter-State Transactions of Electricity by Trading Licensees ( RTC*)
") Form IV-A Short-term Inter-State Transactions of Electricity by Trading Licensees ( RTC*) Name of the Trading Licensee: Tata Power Trading Co. Ltd. Month: June 07 Sr.No Period of Power Delivery Start date
Form IV-A Short-term Inter-State Transactions of Electricity by Trading Licensees ( RTC*) Name of the Trading Licensee: Tata Power Trading Co. Ltd. Month: June 07 Sr.No Period of Power Delivery Start date
India with its burgeoning population and changes
 Concentration of Undergraduate Dental College Admissions in Areas with High Health and Human Development in India Veerasathpurush Allareddy, BDS, MBA, MHA, PhD, MMSc Abstract: The aims of this study were
A District Level Investigation of Family Planning Program in Rural India: Stagnant or Progressive?
 Demography India (2017) ISSN: 0970-454X Vol.46, Issue: 2, pp: 53-67 Research Article A District Level Investigation of Family Planning Program in Rural India: Stagnant or Progressive? Nizamuddin Khan 1,*,
Full Length Research Article
 Available online at http://www.journalijdr.com International Journal of DEVELOPMENT RESEARCH ISSN: 2230-9926 International Journal of Development Research Vol. 06, Issue, 10, pp.9798-9803, October, 2016
Chapter IV Interstate Analysis of Health Outcomes
 Chapter IV Interstate Analysis of Health Outcomes CHAPTER IV INTERSTATE ANALYSIS OF HEALTH OUTCOMES 4.1 Health Outcomes: Meaning and Importance It is well acknowledged by all that health is an integral
Interstate Disparity of Infant Mortality rates & Its Determinants in India: Evidence from Cross Sectional Data in
 IOSR Journal Of Humanities And Social Science (IOSR-JHSS) Volume 20, Issue 7, Ver. VII (July 2015), PP 130-136 e-issn: 2279-0837, p-issn: 2279-0845. www.iosrjournals.org Interstate Disparity of Infant
CHAPTER THREE: PROJECTING FAMILY PLANNING AND DEMOGRAPHIC PARAMETERS UNDER ASSUMPTION OF REDUCTION IN UNMET NEED
 CHAPTER THREE: PROJECTING FAMILY PLANNING AND DEMOGRAPHIC PARAMETERS UNDER ASSUMPTION OF REDUCTION IN UNMET NEED 3.1 Introduction: The immediate objective of National Population Policy, 2000 was to meet
Does Lifestyle Matters in Prevalence of Tuberculosis: Evidence from India
 Does Lifestyle Matters in Prevalence of Tuberculosis: Evidence from India Santosh Kumar Gupta 1, Usha Ram 2 Introduction and Context Smoking, drinking and tobacco use continues to be the leading cause
Meeting of the Strategic Advisory Group of Experts on Immunization (SAGE)
") Meeting of the Strategic Advisory Group of Experts on Immunization (SAGE) Engagement of private providers with the National Immunization Programme: Opportunties and Challenges - - - - - - - - - - - - -
Meeting of the Strategic Advisory Group of Experts on Immunization (SAGE) Engagement of private providers with the National Immunization Programme: Opportunties and Challenges - - - - - - - - - - - - -
DECEMBER India's voice against AIDS. # 25 Years of India's AIDS Control Programme
 ldyd aa Status of National AIDS Response DECEMBER 2017 India's voice against AIDS # 25 Years of India's AIDS Control Programme December 2017 National AIDS Control Organisation Ministry of Health & Family
Postpartum IUD Expansion and Scale-up: Challenges, Opportunities and Essential Program Practices
 Postpartum IUD Expansion and Scale-up: Challenges, Opportunities and Essential Program Practices ENRIQUITO LU, MD, MPH Jhpiego XX FIGO WORLD CONGRESS Fiera di Roma, Italy 10 October 2012 GLOBAL: BURDEN/NEED
Introducing medical abortion into the public sector in Nepal
 Introducing medical abortion into the public sector in Nepal Dr B K Suvedi Director, Family Health Divisionision Department of Health Services Ministry of Health and Population Kathmandu, Nepal Safe motherhood
Impact of Sterilization on Fertility in Southern India
 Impact of Sterilization on Fertility in Southern India Background The first two international conferences on population were mainly focused on the need for curtailing rapid population growth by placing
Original Article. Abstract INTRODUCTION. Sutapa Agrawal, Praween K. Agrawal 1
 Original Article Vitamin A supplementation among in India: Does their socioeconomic status and the economic and social development status of their state of residence make a difference? Sutapa Agrawal,
CHAPTER 3 INDIA: RURAL-URBAN DIFFERENTIALS IN VITAL RATES
 CHAPTER 3 INDIA:RURAL-URBAN DIFFERENTIALS IN VITAL RATES THE STATUS OF VITAL RATES GEOGRAPHIC STUDIES ON VITAL RATES INDIA: RURAL-URBAN DIFFERENTIALS IN FERTILITY HYPOTHESES ON FERTILITY TREND OF RURAL-URBAN
Doctoral Student, International Institute for Population Sciences
 Explaining gender differentials in child mortality in India: Trends and determinants First author and presenting author: Shrikant Kuntla Doctoral Student, International Institute for Population Sciences
CHAPTER: 4 HEALTH STATUS IN GUJARAT AND SURAT DISTRICT
 CHAPTER: 4 HEALTH STATUS IN GUJARAT AND SURAT DISTRICT 4.1 INTRODUCTION 4.2 INTER-STATE HEALTH DISPARITIES 4.3 INTER-REGIONAL DISPARITIES OF HEALTH INDICATORS IN GUJARAT 4.4 INTER-DISTRICT DISPARITIES