Supplemental Information. Human CD1c + Dendritic Cells Drive. the Differentiation of CD103 + CD8 + Mucosal Effector T Cells via the Cytokine TGF-
|
|
|
- Laurel Singleton
- 6 years ago
- Views:
Transcription
1 Immunity, Volume 38 Supplemental Information Human CD1c + Dendritic Cells Drive the Differentiation of CD103 + CD8 + Mucosal Effector T Cells via the Cytokine TGF- Chun I. Yu Christian Becker Yuanyuan Wang, Florentina Marches, Julie Helft, Marylene Leboeuf, Esperanza Anguiano, Stephane Pourpe, Kristina Goller, Virginia Pascual, Jacques Banchereau, Miriam Merad, and Karolina Palucka Supplemental Inventory 1. Supplemental Figures and Tables Figure S1, Related to Figure 1 Figure S2, Related to Figure 2 Figure S3, Related to Figure 3 Figure S4, Related to Figure 4 Figure S5, Related to Figure 5 Figure S6, Related to Figure 6 2. Supplemental Experimental Procedures
2
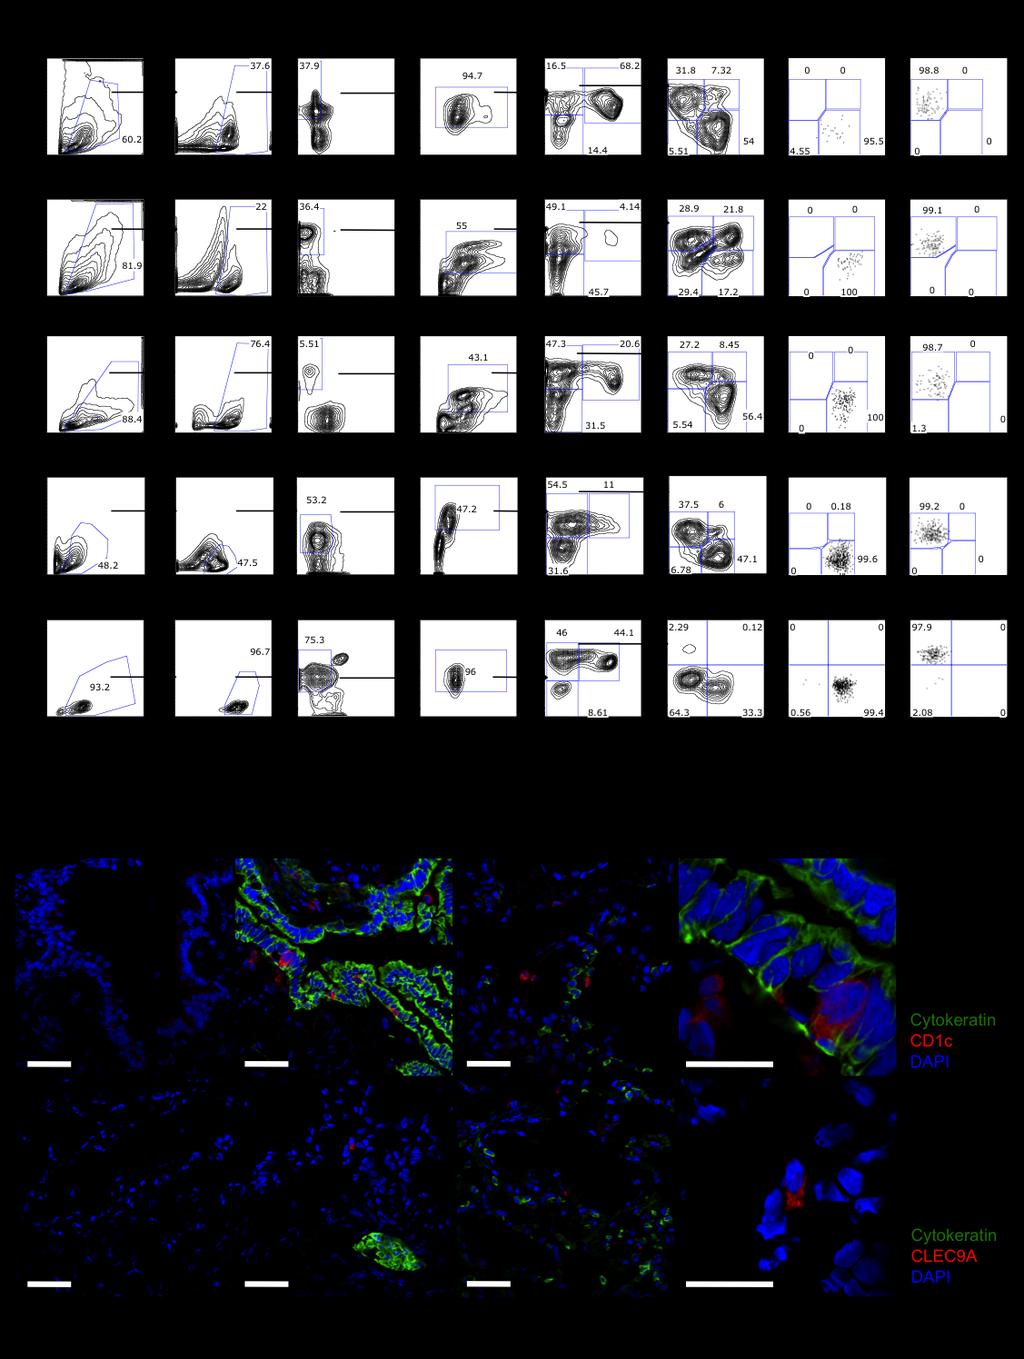
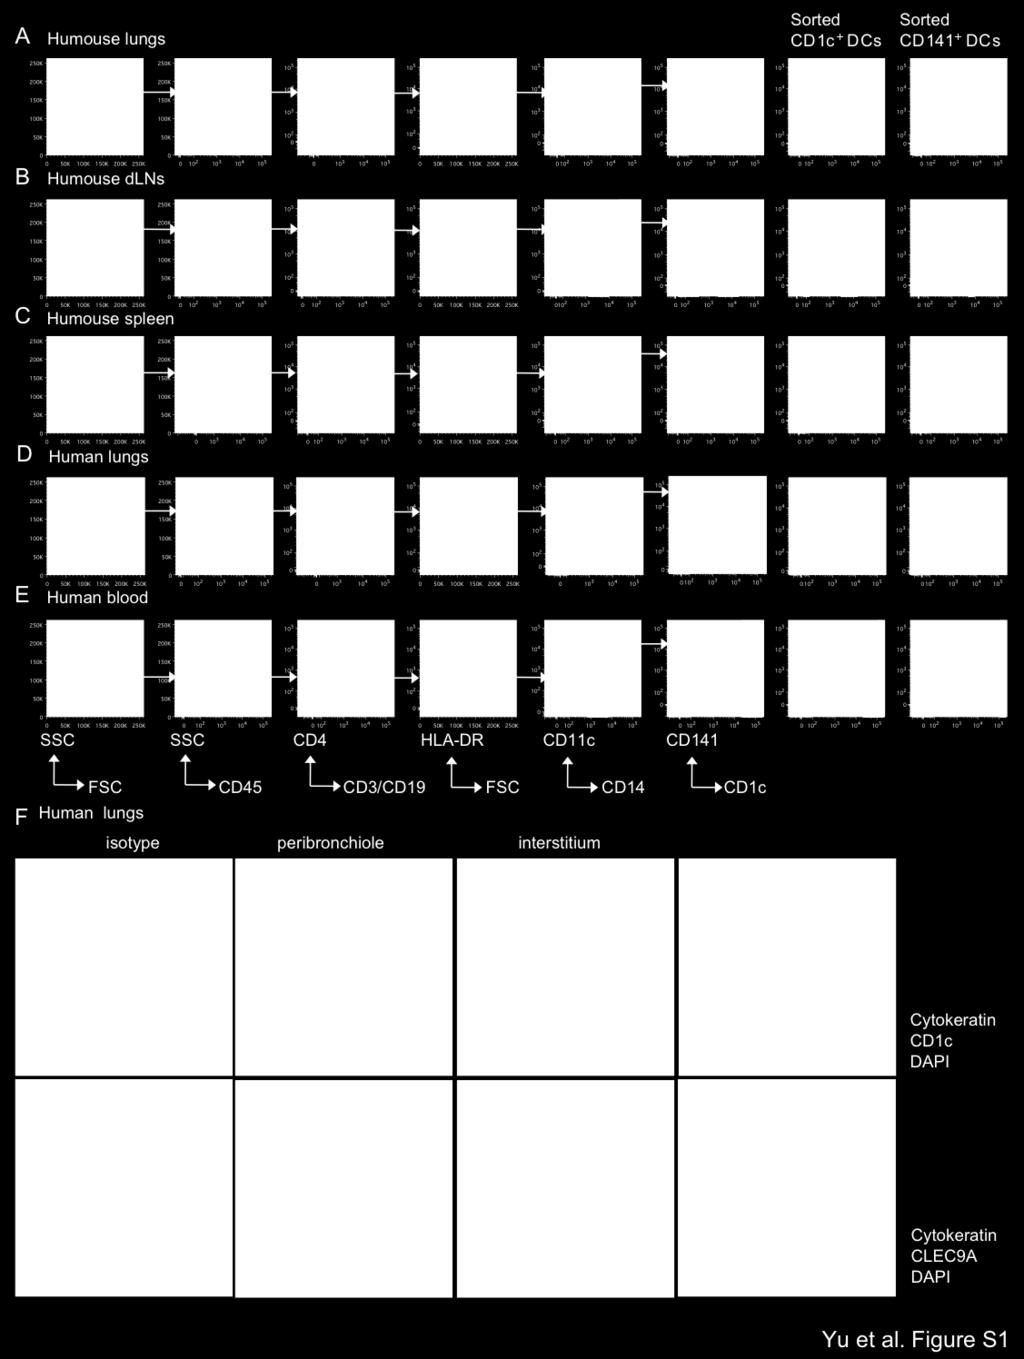
3 Figure S1. Human DC Subsets in Tissues of Humans and Humanized Mice, Related to Figure 1 This figure provides additional data on the characterization of DC subsets. (A-E) Single-cell suspensions were stained with specific antibodies and analyzed by flow cytometry. DCs were gated as human CD45 +, CD3 -, CD19 -, CD4 +, HLA-DR +, CD14 - and CD11c + cells with differential expression of CD1c and CD141. Flow cytometry characterization of sorted CD1c + and CD141 + DCs in the lungs (A), draining LNs (B), and spleen of humanized mice (C), human lungs (D), and human blood (E). (F) Immunofluorescence staining of DCs in human lung frozen tissue sections (scale bar = 100 m). Nucleated cells were defined by DAPI staining (blue); epithelial cells were identified by cytokeratin staining (green); DCs were identified by CD1c staining (red, upper plots) and CLEC9A staining (red, lower plots). CLEC9A is expressed by CD141 + DCs. Representative data from 5 different donors.
4
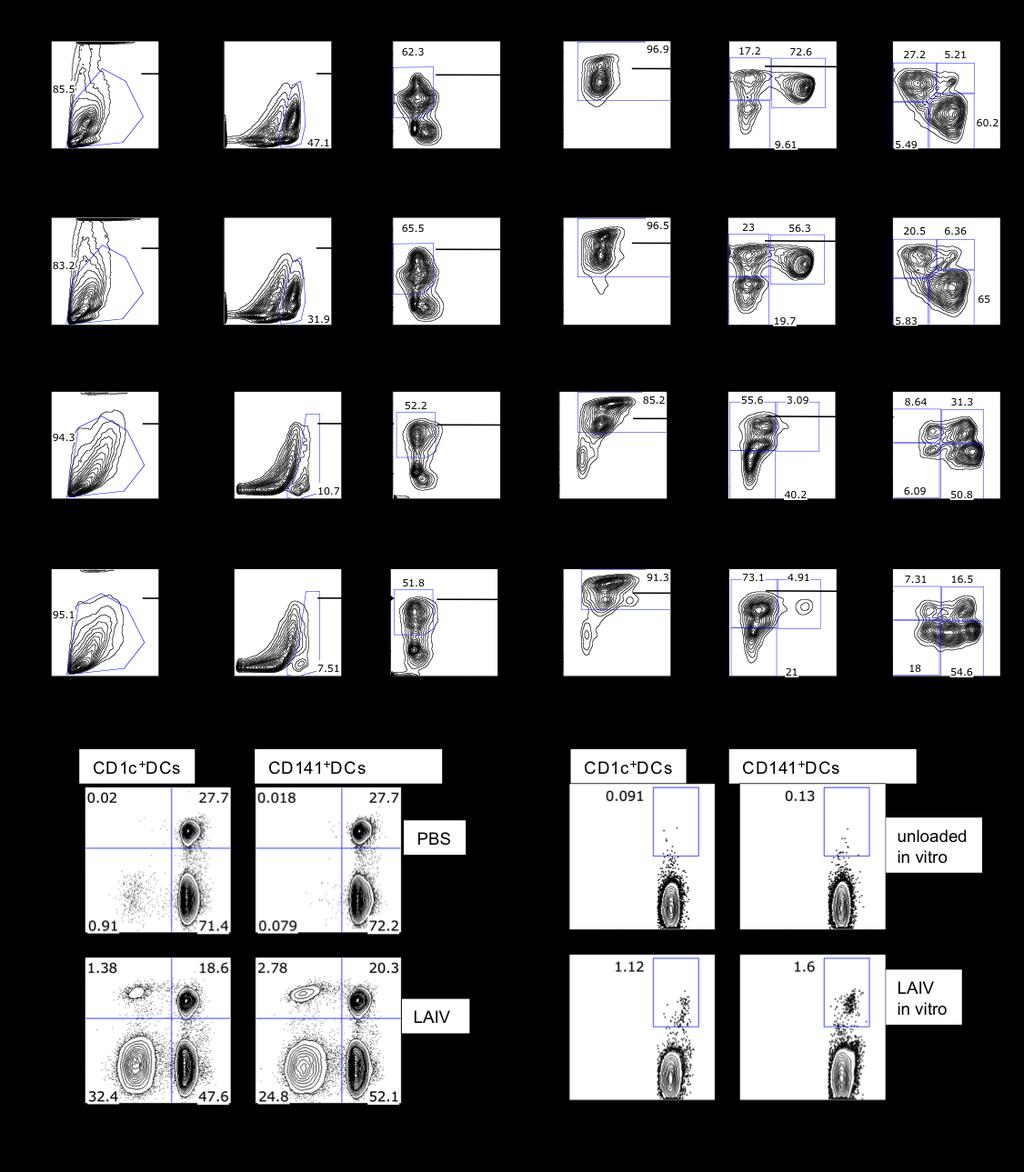
5 Figure S2. Autologous CD8 + T Cell Responses Mediated by Subsets of Human Lung DCs in Humanized Mice, Related to Figure 2 (A-D) provides additional data on the characterization of DC subsets in humanized mice 3 days after PBS or LAIV inoculation. Panel E-F provides additional data illustrating the capacity of both DC subsets to trigger T cell proliferation and expansion. (A-D) Humanized mice were inoculated intranasally with PBS or LAIV. Three days later, lungs (A-B) and draining LNs (C-D) were harvested. Single cell suspensions were stained with specific antibodies. DCs were gated as human CD45 +, CD3 -, CD19 -, CD4 +, HLA-DR +, CD14 - and CD11c + cells with differential expression of CD1c and CD141. Representative dot plots illustrating the gating strategy for CD1c + and CD141 + DCs in the lungs and draining LNs of humanized mice at 3 days after PBS (A, C) or LAIV (B, D) inoculation. (E) Humanized mice were treated with PBS or LAIV intranasally for 3 days. Different subsets of DCs were sorted from the lungs of humanized mice and cocultured with autologous T cells. Dot plots illustrating T cell expansion by 3000 DCs sorted from the lungs of humanized mice treated with PBS or LAIV for 3 days. (F) Sorted DCs from the lungs of naïve humanized mice were treated with or without LAIV in vitro and then cocultured with autologous T cells for 8 days. Dot plots illustrating CD8 + T cells specific to FluM1 epitope expanded by 3000 DCs.
6
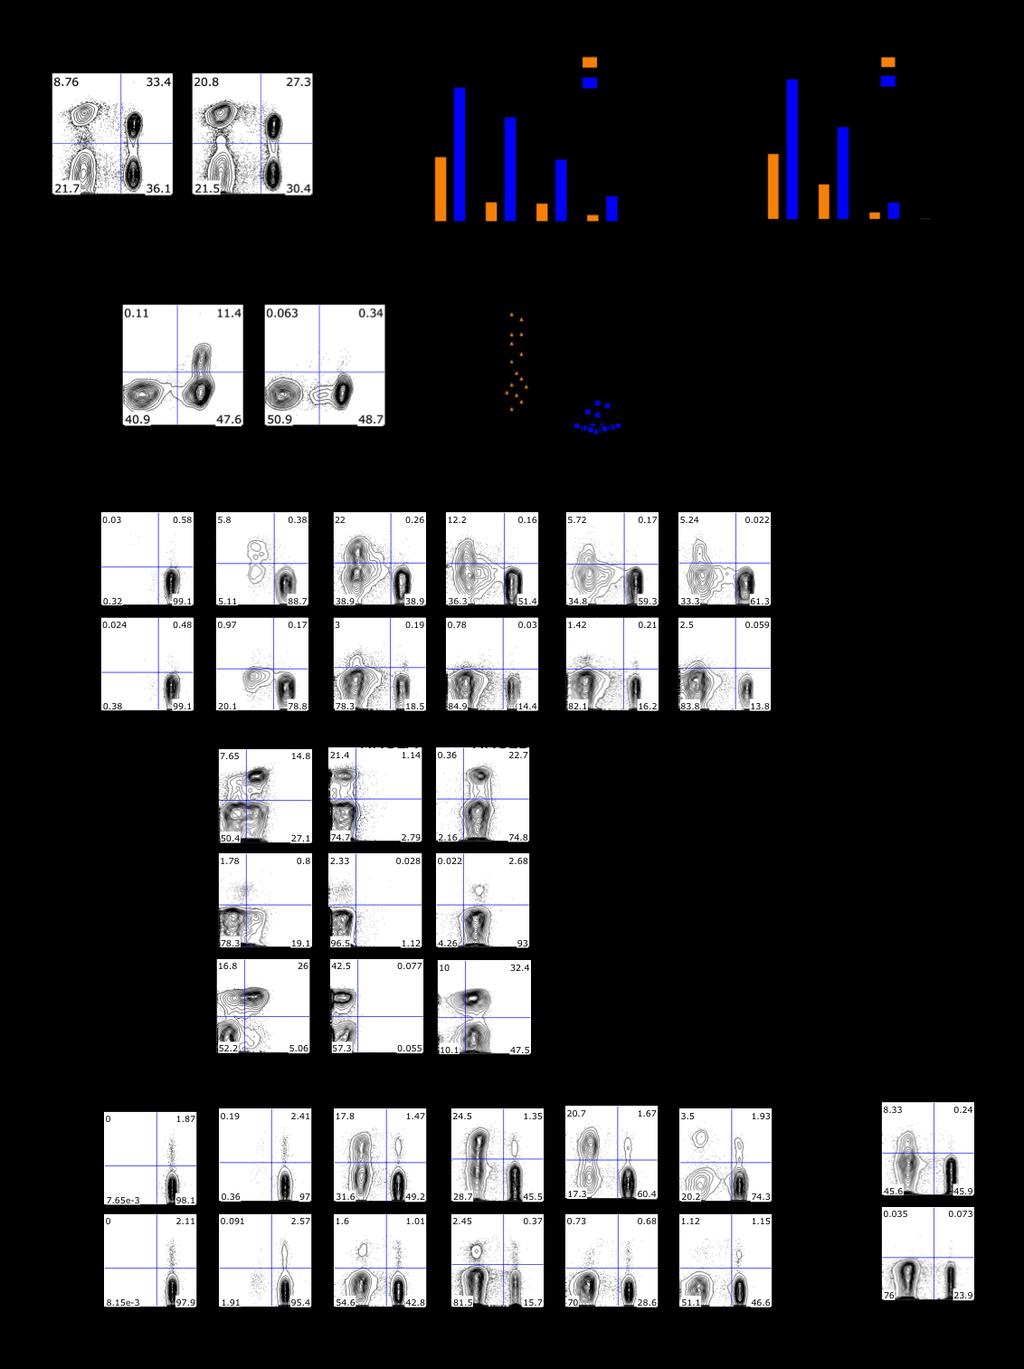
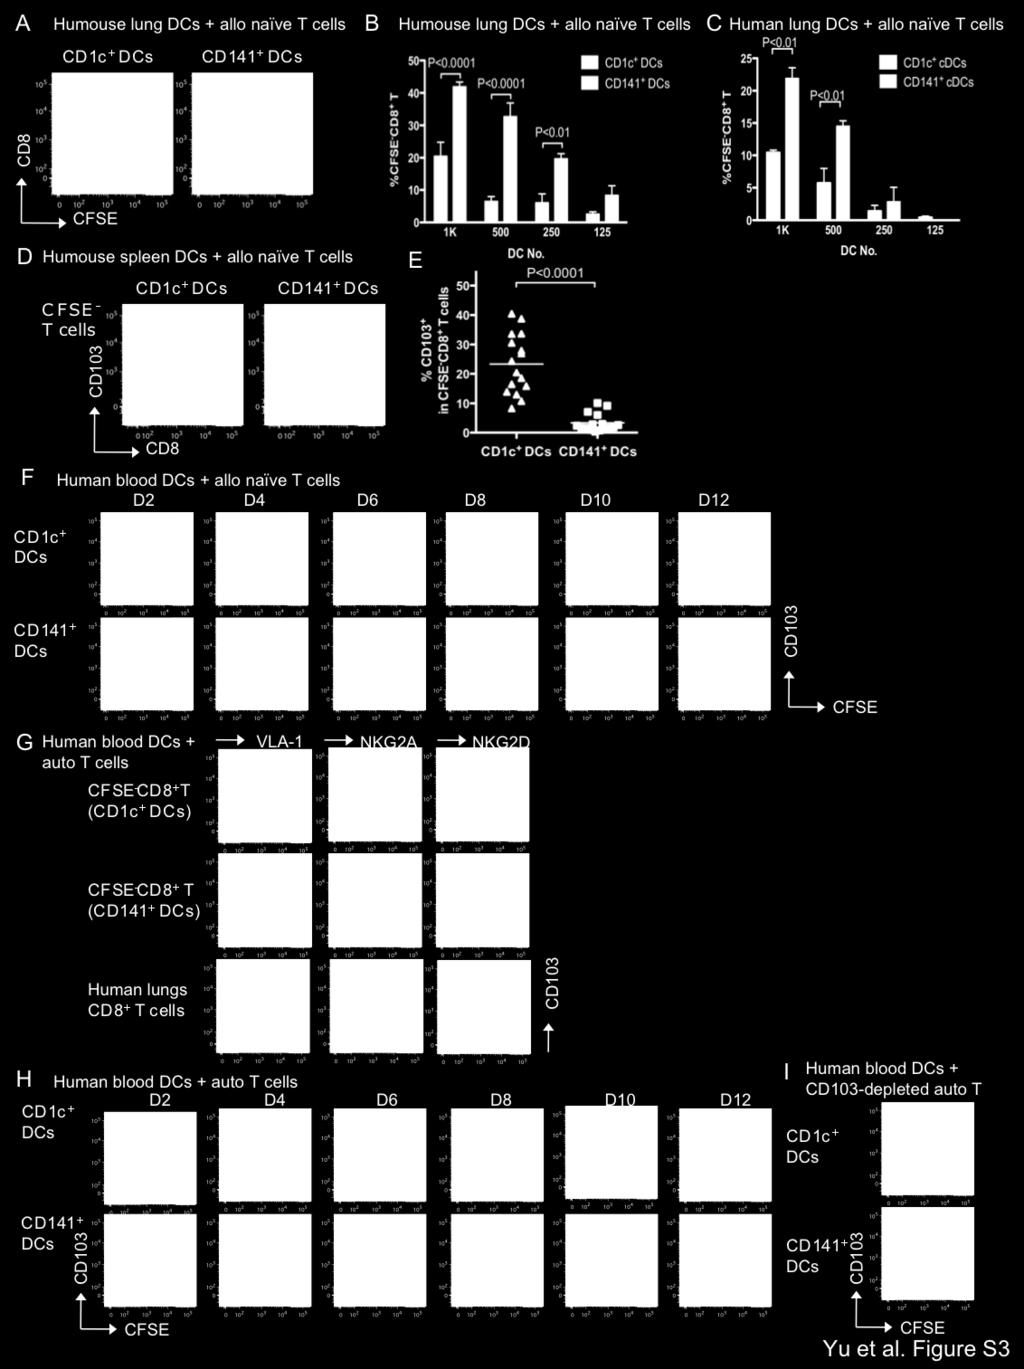
7 Figure S3. CD103 + CD8 + T Cell Responses in Cultures with CD1c + DCs, Related to Figure 3 (A-C) shows that, as expected, CD141 + DCs induce higher allogeneic T cell proliferation at different DC:T cell ratios. Panel D-F shows additional data corroborating the conclusion that CD1c + DCs are uniquely able to elicit the expansion of allogeneic CD103 + CD8 + T cells regardless of their tissue origin. Panel G-I shows additional data corroborating the conclusion that CD1c + DCs are uniquely able to elicit the expansion of autologous CD103 + CD8 + T cells. (A-C) Different subsets of DCs were sorted from the lungs of humanized mice treated with LAIV intranasally for 3 days (A-B), or from human lungs (C), and cocultured with 10 5 CFSE-labeled allogeneic naïve T cells. (A) Representative dot plots illustrating CFSE-dilution on T cells at day 6. (B-C) CD8 + T cell proliferation measured by the percentage of CFSE - CD8 + T cells (ordinate) in cocultures with CD1c + (red) or CD141 + (blue) DCs at titrated doses (abscissa). Representative data from more than three experiments. Two-way ANOVA with Bonferroni posttests. Data are shown as mean ± SEM. (D-E) CD1c + and CD141 + DCs were sorted from the spleen of humanized mice. Sorted DCs were cocultured with 10 5 CFSE-labeled allogeneic naïve T cells for 6 days. T cell proliferation measured by CFSE dilution and CD103 expression in CSFE-negative CD8 + T cells were assessed by flow cytometry analysis. (F) Sorted CD1c + or CD141 + DCs from human blood were activated with LAIV in vitro and cocultured with 10 5 allogeneic naïve T cells. T cell proliferation measured by CFSE dilution and CD103 expression in CD8 + T cells were assessed every two days by flow cytometry analysis. (G-I) Sorted CD1c + and CD141 + DCs from human blood were loaded with LAIV in vitro and then cocultured with autologous T cells. (G) Representative dot plots illustrating the phenotype of proliferation-gated CFSE-negative CD8 + T cells in cocultures with CD1c + or CD141 + DCs at day 8 in comparison to the phenotype of freshly isolated CD8 + T cells from human lungs. (H) T cell proliferation measured by CFSE dilution and CD103 expression in CD8 + T cells were assessed every two days by flow cytometry analsysis. (I) LAIV-loaded human blood DC subsets were cocultured with CD103-depleted autologous blood T cells. Representative dot plots illustrating CFSE-dilution and CD103 expression on CD8 + T cells at day 8 of the cocultures.

 DCs were cocultured with CFSE-labeled naïve allogeneic T cells. After 6 days, CFSE - CD8 + T cells were stained to assess intracellular expression of granzyme.")
8 Figure S4. CD103 + CD8 + T Cells Expanded by CD1c + DCs Express Granzyme and Kill Peptide-Pulsed Target Cells, Related to Figure 4 Figure S4 shows additional data corroborating the conclusion that CD103 + CD8 + T cells expanded by CD1c + DCs express an effector phenotype. CD1c + and CD141 + DC subsets were sorted from the lungs of humanized mice after LAIV inoculation (A) and from human blood (B-C). (A-B) DCs were cocultured with CFSE-labeled naïve allogeneic T cells. After 6 days, CFSE - CD8 + T cells were stained to assess intracellular expression of granzyme. Dot plots illustrating the expression of effector molecules in gated CFSE - CD8 + T cells stimulated by CD1c + or CD141 + DC subsets as indicated in the figure. (C) DC subsets were sorted from HLA-A* human blood, loaded with LAIV and used in cocultures with autologous T cells. At day 8 of coculture, proliferating CFSE - CD8 + T cells were sorted and used as effector cells in a flow cytometry-based four-hour cytotoxicity assay following the manufacture s protocol (Invitrogen). Target cells were HLA-A*0201 transduced T2 cells that were used either unpulsed (control) or pulsed with HLA-A*0201-restricted FluM1 peptide. Specific lysis of T2 cells (ordinate) was assessed at different effector-to-target (E:T) ratios (abscissa). Data are shown as mean ± SEM.

 into human epithelial grafts created as described in Figure 5A.")

9 Figure S5. CD1c + DCs Elicit the Differentiation of CD103 + CD8 + T Cells In Vivo Figure S5 shows additional data corroborating the conclusion that CD1c + DCs elicit the differentiation of CD103 + CD8 + T cells in vivo regardless of the survival of T cells. Sorted CD1c + or CD141 + DCs from human blood were co-injected with allogeneic naïve CFSElabeled T cells (3x10 5 DCs and 3x10 6 T cells) into human epithelial grafts created as described in Figure 5A. The frequencies of CD3 + CD8 + human T cells in the spleen were analyzed by flow cytometry at day 6. Figure S6: CD1c + DCs elicited the differentiation of CD103 + CD8 + T cells independent of GM-CSF. Figure S6 shows additional data corroborating the conclusion that CD1c + DCs elicit the differentiation of CD103 + CD8 + T cells via TGF-. Sorted blood DCs were first stimulated with LAIV for one hour and then cocultured with CFSElabeled allogeneic naïve T cells at a 1:10 ratio in the presence of GM-CSF-neutralizing Abs (30 g/ml) or TGF-β receptor I kinase inhibitor (1 M). At day 6, CFSE - CD8 + T cells were analyzed for CD103 expression by flow cytometry. The percentage of CFSE - CD8 + T cells (left, ordinate) and the percentage CD103-expressing CFSE - CD8 + T cells (right, ordinate) in cocultures with DCs with different conditions as indicated (abscissa). Data are shown as mean ± SEM.
10 Supplemental Experimental Procedures Antibodies and Reagents Antibodies (Abs) to human CD1a (HI149), CD3 (UCHT1), CD4 (SK3), CD8 (SK1), CD11c (B-ly6), CD19 (HIB19), CD36 (CB38), CD80 (L307.4), CD83 (HB15e), CD86 (IT2.2), CD87 (VIM5), and granzyme B (GB11) were from BD (Franklin Lakes, NJ); CCR7 (112509), HLA-DR (LN3) were from ebioscience (San Diego, CA); CD1c (L161), CD103 (Ber-ACT8), CD105 (43A3), GM-CSF (BVD2-23B6), granzyme A (GB9), and perforin (dg9) were from Biolegend (San Diego, CA); CD303 (AC144), CD141 (AD5-14H12), and cytokeratin (AE1/AE3) Abs were from Mitenyi Biotec (Auburn, CA). Human CD14 (Tuk4), CD45 (HI30), and HLA-ABC (W6/32) Abs were from Invitrogen (Carlsbad, CA). Anti-human CLEC9A (4C6) Ab was a gift of M. Lahoud and K. Shortman (Walter and Eliza Hall Institute, Melbourne, Victoria, Australia). Anti-human CLEC9A (683409), NKG2A (131411), NKG2D (149810), TGF-, TGF- receptor I, and TGF- receptor II Abs, and recombinant human IL-2, IL-7, CD40L, and TGF- 1 were from R&D Systems (Minneapolis, MN). CD40 (MAB89) Ab and HLA-A*0201 tetramers loaded with influenza A virus M (GILGFVFTL), NS (AIMDKNIIL), and HIV-1 gag (SLYNTVATL) were purchased from Beckman Coulter (Brea, CA). TGF-β RI Kinase Inhibitor II was purchased from EMD Chemicals (Gibbston, NJ). Trivalent live-attenuated influenza virus (LAIV) vaccine FluMist ( season; MedImmune, Gaithersburg, MD) was obtained from the hospital pharmacy. Cytotoxicity Assay Killing activity was measured using a flow cytometry-based Live/Dead Cytotoxicity assay following the manufacturer s protocol (Invitrogen). Briefly, target cells including both unloaded or peptide-loaded T2 (ATCC, Manassas, VA) were first labeled with 5 l of DiOC for 20 mins at 37 C and then cultured with effector cells at different effector:target (E:T) ratios in a 96-well U-bottom plate in the presence of propidium iodide (PI). The plate was centrifuged at 1200 rpm for 30 sec before incubating at 37 C for 4 hours. Total cytotoxicity was measured as the percentage of PI + in DiOC + target cells. The spontaneous cytotoxicity was determined as the percentage of PI + in DiOC + target cells without the presence of effector cells. The specific cytotoxicity was calculated as [(total cytotoxicity)-(spontaneous cytotoxicity)] x 100 percentages. Immunohistofluorescence Staining Tissues were embedded in OCT (Sakura Finetek U.S.A., Torrance, CA) and snap frozen in liquid nitrogen. Frozen sections were cut at 6 μm and air dried on Superfrost slides (CardinalHealth, Dublin, Oh). Frozen sections were fixed with cold acetone for five minutes and air-dried. Tissue sections were first treated with Background Buster and Fc Receptor Block (Innovex Bioscience, Richmond, CA). The sections were then stained with primary mouse monoclonal Abs for one hour at room temperature, followed by staining with fluorochrome-labeled secondary Abs. Respective isotype Abs were used as the control. Finally, sections were mounted with ProLong Gold with DAPI (Invitrogen), visualized using a fluorescence microscope (Olympus, Japan) with MetaMorph software (Molecular Devices, Sunnyvale, CA) or a Leica SP 5 confocal microscope with Leica LAS AF 2.0 software (Buffalo Grove, IL). Flow Cytometry Analysis Cells were first treated with Fc blocker (Mitenyi Biotec) and then stained for 30 min on ice with fluorochrome-conjugated specific Abs. After washing twice with PBS, the samples were acquired on an LSRII (BD), and analyzed with FlowJo software (Tree Star, Ashland, OR). For tetramer analysis, samples were stained at room temperature for 30 min with fluorochrome-conjugated Abs for surface markers and APC-conjugated FluM1-HLA-A*0201 tetramer for FluM1-specific CD8 + T cells. To assess the expression of intracellular proteins, samples were first stained with fluorochrome-conjugated Abs against surface markers at room temperature for 15 min, followed by fixation and permeabilization. They were then stained for intracellular proteins at room temperature for 30 min.
MATERIALS AND METHODS. Neutralizing antibodies specific to mouse Dll1, Dll4, J1 and J2 were prepared as described. 1,2 All
 MATERIALS AND METHODS Antibodies (Abs), flow cytometry analysis and cell lines Neutralizing antibodies specific to mouse Dll1, Dll4, J1 and J2 were prepared as described. 1,2 All other antibodies used
Commercially available HLA Class II tetramers (Beckman Coulter) conjugated to
 conjugated to") Class II tetramer staining Commercially available HLA Class II tetramers (Beckman Coulter) conjugated to PE were combined with dominant HIV epitopes (DRB1*0101-DRFYKTLRAEQASQEV, DRB1*0301- PEKEVLVWKFDSRLAFHH,
Class II tetramer staining Commercially available HLA Class II tetramers (Beckman Coulter) conjugated to PE were combined with dominant HIV epitopes (DRB1*0101-DRFYKTLRAEQASQEV, DRB1*0301- PEKEVLVWKFDSRLAFHH,
Blocking antibodies and peptides. Rat anti-mouse PD-1 (29F.1A12, rat IgG2a, k), PD-
, PD-") Supplementary Methods Blocking antibodies and peptides. Rat anti-mouse PD-1 (29F.1A12, rat IgG2a, k), PD- L1 (10F.9G2, rat IgG2b, k), and PD-L2 (3.2, mouse IgG1) have been described (24). Anti-CTLA-4 (clone
Supplementary Methods Blocking antibodies and peptides. Rat anti-mouse PD-1 (29F.1A12, rat IgG2a, k), PD- L1 (10F.9G2, rat IgG2b, k), and PD-L2 (3.2, mouse IgG1) have been described (24). Anti-CTLA-4 (clone
Detailed step-by-step operating procedures for NK cell and CTL degranulation assays
 Supplemental methods Detailed step-by-step operating procedures for NK cell and CTL degranulation assays Materials PBMC isolated from patients, relatives and healthy donors as control K562 cells (ATCC,
Ex vivo Human Antigen-specific T Cell Proliferation and Degranulation Willemijn Hobo 1, Wieger Norde 1 and Harry Dolstra 2*
 Ex vivo Human Antigen-specific T Cell Proliferation and Degranulation Willemijn Hobo 1, Wieger Norde 1 and Harry Dolstra 2* 1 Department of Laboratory Medicine - Laboratory of Hematology, Radboud University
SUPPLEMENTARY INFORMATION
 Complete but curtailed T-cell response to very-low-affinity antigen Dietmar Zehn, Sarah Y. Lee & Michael J. Bevan Supp. Fig. 1: TCR chain usage among endogenous K b /Ova reactive T cells. C57BL/6 mice
Supplementary Table e-1. Flow cytometry reagents and staining combinations
 Supplementary data Supplementary Table e-1. Flow cytometry reagents and staining combinations Reagents Antibody Fluorochrome Clone Source conjugation CD3 FITC UCHT1 BD Biosciences CD3 PerCP-Cy5.5 SK7 Biolegend
CD14 + S100A9 + Monocytic Myeloid-Derived Suppressor Cells and Their Clinical Relevance in Non-Small Cell Lung Cancer
 CD14 + S1A9 + Monocytic Myeloid-Derived Suppressor Cells and Their Clinical Relevance in Non-Small Cell Lung Cancer Po-Hao, Feng M.D., Kang-Yun, Lee, M.D. Ph.D., Ya-Ling Chang, Yao-Fei Chan, Lu- Wei, Kuo,Ting-Yu
Supplementary Figure 1. Characterization of basophils after reconstitution of SCID mice
 Supplementary figure legends Supplementary Figure 1. Characterization of after reconstitution of SCID mice with CD4 + CD62L + T cells. (A-C) SCID mice (n = 6 / group) were reconstituted with 2 x 1 6 CD4
SUPPLEMENTARY METHODS
 SUPPLEMENTARY METHODS Histological analysis. Colonic tissues were collected from 5 parts of the middle colon on day 7 after the start of DSS treatment, and then were cut into segments, fixed with 4% paraformaldehyde,
Supplemental Methods. CD107a assay
 Supplemental Methods CD107a assay For each T cell culture that was tested, two tubes were prepared. One tube contained BCMA-K562 cells, and the other tube contained NGFR-K562 cells. Both tubes contained
Human Immunodeficiency Virus Type-1 Myeloid Derived Suppressor Cells Inhibit Cytomegalovirus Inflammation through Interleukin-27 and B7-H4
 Human Immunodeficiency Virus Type-1 Myeloid Derived Suppressor Cells Inhibit Cytomegalovirus Inflammation through Interleukin-27 and B7-H4 Ankita Garg, Rodney Trout and Stephen A. Spector,,* Department
Supporting Online Material for
 www.sciencemag.org/cgi/content/full/1175194/dc1 Supporting Online Material for A Vital Role for Interleukin-21 in the Control of a Chronic Viral Infection John S. Yi, Ming Du, Allan J. Zajac* *To whom
PBMC from each patient were suspended in AIM V medium (Invitrogen) with 5% human
 with 5% human") Anti-CD19-CAR transduced T-cell preparation PBMC from each patient were suspended in AIM V medium (Invitrogen) with 5% human AB serum (Gemini) and 300 international units/ml IL-2 (Novartis). T cell proliferation
Anti-CD19-CAR transduced T-cell preparation PBMC from each patient were suspended in AIM V medium (Invitrogen) with 5% human AB serum (Gemini) and 300 international units/ml IL-2 (Novartis). T cell proliferation
Supplementary Figure 1. Enhanced detection of CTLA-4 on the surface of HIV-specific
 SUPPLEMENTARY FIGURE LEGEND Supplementary Figure 1. Enhanced detection of CTLA-4 on the surface of HIV-specific CD4 + T cells correlates with intracellular CTLA-4 levels. (a) Comparative CTLA-4 levels
L-selectin Is Essential for Delivery of Activated CD8 + T Cells to Virus-Infected Organs for Protective Immunity
 Cell Reports Supplemental Information L-selectin Is Essential for Delivery of Activated CD8 + T Cells to Virus-Infected Organs for Protective Immunity Rebar N. Mohammed, H. Angharad Watson, Miriam Vigar,
Supplementary Figure 1. Efficient DC depletion in CD11c.DOG transgenic mice
 Supplementary Figure 1. Efficient DC depletion in CD11c.DOG transgenic mice (a) CD11c.DOG transgenic mice (tg) were treated with 8 ng/g body weight (b.w.) diphtheria toxin (DT) i.p. on day -1 and every
well for 2 h at rt. Each dot represents an individual mouse and bar is the mean ±
 Supplementary data: Control DC Blimp-1 ko DC 8 6 4 2-2 IL-1β p=.5 medium 8 6 4 2 IL-2 Medium p=.16 8 6 4 2 IL-6 medium p=.3 5 4 3 2 1-1 medium IL-1 n.s. 25 2 15 1 5 IL-12(p7) p=.15 5 IFNγ p=.65 4 3 2 1
Dendritic cell subsets and CD4 T cell immunity in Melanoma. Ben Wylie 1 st year PhD Candidate
 Dendritic cell subsets and CD4 T cell immunity in Melanoma Ben Wylie 1 st year PhD Candidate Melanoma Melanoma is the 4 th most common cancer in Australia. Current treatment options are ineffective resulting
Supplementary Figure 1
 Supplementary Figure 1 Identification of IFN-γ-producing CD8 + and CD4 + T cells with naive phenotype by alternative gating and sample-processing strategies. a. Contour 5% probability plots show definition
D CD8 T cell number (x10 6 )
") IFNγ Supplemental Figure 1. CD T cell number (x1 6 ) 18 15 1 9 6 3 CD CD T cells CD6L C CD5 CD T cells CD6L D CD8 T cell number (x1 6 ) 1 8 6 E CD CD8 T cells CD6L F Log(1)CFU/g Feces 1 8 6 p
IFNγ Supplemental Figure 1. CD T cell number (x1 6 ) 18 15 1 9 6 3 CD CD T cells CD6L C CD5 CD T cells CD6L D CD8 T cell number (x1 6 ) 1 8 6 E CD CD8 T cells CD6L F Log(1)CFU/g Feces 1 8 6 p
Canberra, Australia). CD11c-DTR-OVA-GFP (B6.CD11c-OVA), B6.luc + and. Cancer Research Center, Germany). B6 or BALB/c.FoxP3-DTR-GFP mice were
. CD11c-DTR-OVA-GFP (B6.CD11c-OVA), B6.luc + and. Cancer Research Center, Germany). B6 or BALB/c.FoxP3-DTR-GFP mice were") Supplemental Materials and Methods Mice Female C57BL/6 (B6, I-E null, H-2 b ), BALB/c (H-2 d ) + ), FVB/N (H-2 q, I-E null, CD45.1 + ), and B6D2F1 (H-2 b/d ) mice were purchased from the Animal Resources
Supplemental Materials and Methods Mice Female C57BL/6 (B6, I-E null, H-2 b ), BALB/c (H-2 d ) + ), FVB/N (H-2 q, I-E null, CD45.1 + ), and B6D2F1 (H-2 b/d ) mice were purchased from the Animal Resources
Cover Page. The handle holds various files of this Leiden University dissertation.
 Cover Page The handle http://hdl.handle.net/1887/23854 holds various files of this Leiden University dissertation. Author: Marel, Sander van der Title: Gene and cell therapy based treatment strategies
Supplementary Figure 1. IL-12 serum levels and frequency of subsets in FL patients. (A) IL-12
 IL-12") 1 Supplementary Data Figure legends Supplementary Figure 1. IL-12 serum levels and frequency of subsets in FL patients. (A) IL-12 serum levels measured by multiplex ELISA (Luminex) in FL patients before
1 Supplementary Data Figure legends Supplementary Figure 1. IL-12 serum levels and frequency of subsets in FL patients. (A) IL-12 serum levels measured by multiplex ELISA (Luminex) in FL patients before
ILC1 and ILC3 isolation and culture Following cell sorting, we confirmed that the recovered cells belonged to the ILC1, ILC2 and
 Supplementary Methods and isolation and culture Following cell sorting, we confirmed that the recovered cells belonged to the, ILC2 and subsets. For this purpose we performed intracellular flow cytometry
Supplementary Figures
 Supplementary Figures Supplementary Figure 1. NKT ligand-loaded tumour antigen-presenting B cell- and monocyte-based vaccine induces NKT, NK and CD8 T cell responses. (A) The cytokine profiles of liver
NK cell flow cytometric assay In vivo DC viability and migration assay
 NK cell flow cytometric assay 6 NK cells were purified, by negative selection with the NK Cell Isolation Kit (Miltenyi iotec), from spleen and lymph nodes of 6 RAG1KO mice, injected the day before with
of whole cell cultures in U-bottomed wells of a 96-well plate are shown. 2
 Supplementary online material Supplementary figure legends Supplementary Figure 1 Exposure to T reg cells causes loss of T resp cells in co-cultures. T resp cells were stimulated with CD3+CD28 alone or
Combined Rho-kinase inhibition and immunogenic cell death triggers and propagates immunity against cancer
 Supplementary Information Combined Rho-kinase inhibition and immunogenic cell death triggers and propagates immunity against cancer Gi-Hoon Nam, Eun-Jung Lee, Yoon Kyoung Kim, Yeonsun Hong, Yoonjeong Choi,
Dual Targeting Nanoparticle Stimulates the Immune
 Dual Targeting Nanoparticle Stimulates the Immune System to Inhibit Tumor Growth Alyssa K. Kosmides, John-William Sidhom, Andrew Fraser, Catherine A. Bessell, Jonathan P. Schneck * Supplemental Figure
B220 CD4 CD8. Figure 1. Confocal Image of Sensitized HLN. Representative image of a sensitized HLN
 B220 CD4 CD8 Natarajan et al., unpublished data Figure 1. Confocal Image of Sensitized HLN. Representative image of a sensitized HLN showing B cell follicles and T cell areas. 20 µm thick. Image of magnification
Nature Medicine: doi: /nm.3922
 Title: Glucocorticoid-induced tumor necrosis factor receptor-related protein co-stimulation facilitates tumor regression by inducing IL-9-producing helper T cells Authors: Il-Kyu Kim, Byung-Seok Kim, Choong-Hyun
Masashi Takahara,* Manami Miyai,* Mai Tomiyama,* Masato Mutou,* Andrew J. Nicol, and Mie Nieda*,1
 Copulsing tumor antigen-pulsed dendritic cells with zoledronate efficiently enhance the expansion of tumor antigen-specific CD8 T cells via V 9 T cell activation Masashi Takahara,* Manami Miyai,* Mai Tomiyama,*
Low Avidity CMV + T Cells accumulate in Old Humans
 Supplementary Figure Legends Supplementary Figure 1. CD45RA expressing CMVpp65-specific T cell populations accumulate within HLA-A*0201 and HLA-B*0701 individuals Pooled data showing the size of the NLV/HLA-A*0201-specific
Categorical analysis of human T cell heterogeneity with One-SENSE
 1 2 3 4 Supplementary Information Categorical analysis of human T cell heterogeneity with One-SENSE 5 6 Running title: T cell Analysis by One-SENSE 7 8 9 1 11 12 13 14 15 16 17 18 19 2 21 22 23 24 25 26
W/T Itgam -/- F4/80 CD115. F4/80 hi CD115 + F4/80 + CD115 +
 F4/8 % in the peritoneal lavage 6 4 2 p=.15 n.s p=.76 CD115 F4/8 hi CD115 + F4/8 + CD115 + F4/8 hi CD115 + F4/8 + CD115 + MHCII MHCII Supplementary Figure S1. CD11b deficiency affects the cellular responses
Table S1. Viral load and CD4 count of HIV-infected patient population
 Table S1. Viral load and CD4 count of HIV-infected patient population Subject ID Viral load (No. of copies per ml of plasma) CD4 count (No. of cells/µl of blood) 28 7, 14 29 7, 23 21 361,99 94 217 7, 11
Supporting Information
 Supporting Information lpek et al. 1.173/pnas.1121217 SI Materials and Methods Mice. cell knockout, inos / (Taconic arms), Rag1 /, INγR /, and IL-12p4 / mice (The Jackson Laboratory) were maintained and/or
Supplemental Methods In vitro T cell assays Inhibition of perforin- and FasL-mediated cytotoxicity Flow Cytometry
 Supplemental Methods In vitro T cell assays Cell lines Jurkat (ATCC #TIB-152), CCRF-CEM (ATCC #CCL-119), MOLT-4 (ATCC #CRL- 1582), Hut 78 (ATCC #TIB-161), SupT1 (ATCC #CRL-1942), Raji (ATCC #CCL-86) and
Figure S1. Western blot analysis of clathrin RNA interference in human DCs Human immature DCs were transfected with 100 nm Clathrin SMARTpool or
 Figure S1. Western blot analysis of clathrin RNA interference in human DCs Human immature DCs were transfected with 100 nm Clathrin SMARTpool or control nontargeting sirnas. At 90 hr after transfection,
Fluorochrome Panel 1 Panel 2 Panel 3 Panel 4 Panel 5 CTLA-4 CTLA-4 CD15 CD3 FITC. Bio) PD-1 (MIH4, BD) ICOS (C398.4A, Biolegend) PD-L1 (MIH1, BD)
 PD-1 (MIH4, BD) ICOS (C398.4A, Biolegend) PD-L1 (MIH1, BD)") Additional file : Table S. Antibodies used for panel stain to identify peripheral immune cell subsets. Panel : PD- signaling; Panel : CD + T cells, CD + T cells, B cells; Panel : Tregs; Panel :, -T, cdc,
Additional file : Table S. Antibodies used for panel stain to identify peripheral immune cell subsets. Panel : PD- signaling; Panel : CD + T cells, CD + T cells, B cells; Panel : Tregs; Panel :, -T, cdc,
Supplementary Figure 1. mrna expression of chitinase and chitinase-like protein in splenic immune cells. Each splenic immune cell population was
 Supplementary Figure 1. mrna expression of chitinase and chitinase-like protein in splenic immune cells. Each splenic immune cell population was sorted by FACS. Surface markers for sorting were CD11c +
Supplementary Figure 1 Lymphocytes can be tracked for at least 4 weeks after
 Supplementary Figure 1 Lymphocytes can be tracked for at least 4 weeks after photoconversion by using H2B-Dendra2. 4-5 PPs of H2B-Dendra2 BM chimeras were photoconverted and analyzed 7 days (upper panel)
Supplementary Data 1. Alanine substitutions and position variants of APNCYGNIPL. Applied in
 Supplementary Data 1. Alanine substitutions and position variants of APNCYGNIPL. Applied in Supplementary Fig. 2 Substitution Sequence Position variant Sequence original APNCYGNIPL original APNCYGNIPL
Cytotoxicity assays. Rory D. de Vries, PhD 1. Viroscience lab, Erasmus MC, Rotterdam, the Netherlands
 Cytotoxicity assays Rory D. de Vries, PhD 1 1 Viroscience lab, Erasmus MC, Rotterdam, the Netherlands Anti-influenza immunity Humoral / CD4+ / CD8+ / NK? Function of CTL Elimination of virus-infected cells?
Supplementary Figure 1. Normal T lymphocyte populations in Dapk -/- mice. (a) Normal thymic development in Dapk -/- mice. Thymocytes from WT and Dapk
 Normal thymic development in Dapk -/- mice. Thymocytes from WT and Dapk") Supplementary Figure 1. Normal T lymphocyte populations in Dapk -/- mice. (a) Normal thymic development in Dapk -/- mice. Thymocytes from WT and Dapk -/- mice were stained for expression of CD4 and CD8.
Supplementary Figure 1. Normal T lymphocyte populations in Dapk -/- mice. (a) Normal thymic development in Dapk -/- mice. Thymocytes from WT and Dapk -/- mice were stained for expression of CD4 and CD8.
SUPPLEMENTARY INFORMATION. CXCR4 inhibitors could benefit to HER2 but not to Triple-Negative. breast cancer patients
 SUPPLEMENTARY INFORMATION CXCR4 inhibitors could benefit to HER2 but not to Triple-Negative breast cancer patients Lefort S. 1,2, Thuleau A. 3, Kieffer Y. 1,2, Sirven P. 1,2, Bieche I. 4, Marangoni E.
Naive, memory and regulatory T lymphocytes populations analysis
 Naive, memory and regulatory T lymphocytes populations analysis Jaen Olivier, PhD ojaen@beckmancoulter.com Cellular Analysis application specialist Beckman Coulter France Introduction Flow cytometric analysis
Proteomic profiling of small-molecule inhibitors reveals dispensability of MTH1 for cancer cell survival
 Supplementary Information for Proteomic profiling of small-molecule inhibitors reveals dispensability of MTH1 for cancer cell survival Tatsuro Kawamura 1, Makoto Kawatani 1, Makoto Muroi, Yasumitsu Kondoh,
Supplementary Figure 1 Protease allergens induce IgE and IgG1 production. (a-c)
") 1 Supplementary Figure 1 Protease allergens induce IgE and IgG1 production. (a-c) Serum IgG1 (a), IgM (b) and IgG2 (c) concentrations in response to papain immediately before primary immunization (day
1 Supplementary Figure 1 Protease allergens induce IgE and IgG1 production. (a-c) Serum IgG1 (a), IgM (b) and IgG2 (c) concentrations in response to papain immediately before primary immunization (day
Supplementary Materials
 Supplementary Materials 43 Figure S1. CD123 in acute lymphoblastic leukemia and leukemia-initiating cells. A. CD123 (histograms) is highly and homogenously expressed in B-ALL blasts (as defined by live,
Supplementalgfigureg1gSchematicgdiagramgofgtumor1modellingg
 SChinjectionh F:LuchLCLsh IVhinjectionh T:cellsh Monitorhforhtumorh growthhandhxeno: reactivehgvhd GVLgexperimentg kcbgvsgpbgt1cellse Xeno1reactiveg experimentg kcbgvsgpbgt1cellse IVhinjectionh 5xh,N^6
Supplemental Figure 1
 Supplemental Figure 1 1a 1c PD-1 MFI fold change 6 5 4 3 2 1 IL-1α IL-2 IL-4 IL-6 IL-1 IL-12 IL-13 IL-15 IL-17 IL-18 IL-21 IL-23 IFN-α Mut Human PD-1 promoter SBE-D 5 -GTCTG- -1.2kb SBE-P -CAGAC- -1.kb
Supplementary Fig. 1: Ex vivo tetramer enrichment with anti-c-myc beads
 Supplementary Fig. 1: Ex vivo tetramer enrichment with anti-c-myc beads Representative example of comparative ex vivo tetramer enrichment performed in three independent experiments with either conventional
Supplementary Materials for
 www.sciencemag.org/content/348/6241/aaa825/suppl/dc1 Supplementary Materials for A mucosal vaccine against Chlamydia trachomatis generates two waves of protective memory T cells Georg Stary,* Andrew Olive,
Supplemental Figure 1. Signature gene expression in in vitro differentiated Th0, Th1, Th2, Th17 and Treg cells. (A) Naïve CD4 + T cells were cultured
 Naïve CD4 + T cells were cultured") Supplemental Figure 1. Signature gene expression in in vitro differentiated Th0, Th1, Th2, Th17 and Treg cells. (A) Naïve CD4 + T cells were cultured under Th0, Th1, Th2, Th17, and Treg conditions. mrna
Supplemental Figure 1. Signature gene expression in in vitro differentiated Th0, Th1, Th2, Th17 and Treg cells. (A) Naïve CD4 + T cells were cultured under Th0, Th1, Th2, Th17, and Treg conditions. mrna
T H 1, T H 2 and T H 17 polarization of naïve CD4 + mouse T cells
 A complete workflow for cell preparation, isolation, polarization and analysis T H 1, T H 2 and T H 17 polarization of naïve CD4 + mouse T cells Introduction Workflow CD4 + T helper (T H) cells play a
MAIT cell function is modulated by PD-1 signaling in patients with active
 MAIT cell function is modulated by PD-1 signaling in patients with active tuberculosis Jing Jiang, M.D., Xinjing Wang, M.D., Hongjuan An, M.Sc., Bingfen Yang, Ph.D., Zhihong Cao, M.Sc., Yanhua Liu, Ph.D.,
RAISON D ETRE OF THE IMMUNE SYSTEM:
 RAISON D ETRE OF THE IMMUNE SYSTEM: To Distinguish Self from Non-Self Thereby Protecting Us From Our Hostile Environment. Innate Immunity Acquired Immunity Innate immunity: (Antigen nonspecific) defense
Primary Adult Naïve CD4+ CD45RA+ Cells. Prepared by: David Randolph at University of Alabama, Birmingham
 Primary Adult Naïve CD4+ CD45RA+ Cells Prepared by: David Randolph (drdrdr@uab.edu) at University of Alabama, Birmingham Goal: To obtain large numbers of highly pure primary CD4+ CD45RO- CD25- cells from
Supplementary information. Characterization of c-maf + Foxp3 - Regulatory T Cells Induced by. Repeated Stimulation of Antigen-Presenting B Cells
 Chien 1 Supplementary information Manuscript: SREP-16-42480A Characterization of c-maf + Foxp3 - Regulatory T Cells Induced by Repeated Stimulation of Antigen-Presenting B Cells Chien-Hui Chien 1, Hui-Chieh
Supporting Information
 Supporting Information Desnues et al. 10.1073/pnas.1314121111 SI Materials and Methods Mice. Toll-like receptor (TLR)8 / and TLR9 / mice were generated as described previously (1, 2). TLR9 / mice were
Therapeutic PD L1 and LAG 3 blockade rapidly clears established blood stage Plasmodium infection
 Supplementary Information Therapeutic PD L1 and LAG 3 blockade rapidly clears established blood stage Plasmodium infection Noah S. Butler, Jacqueline Moebius, Lecia L. Pewe, Boubacar Traore, Ogobara K.
Supporting Information
 Supporting Information Idoyaga et al. 10.1073/pnas.0812247106 SSC a) Single cell suspension 99 Aqua b) Live cells 96 -W c) Singlets 92 -A CD19+ER119 d) CD19 ER119 cells 97 CD3 e) CD3 cells 27 f) DX5 cells
Optimizing Intracellular Flow Cytometry:
 Optimizing Intracellular Flow Cytometry: Simultaneous Detection of Cytokines and Transcription Factors An encore presentation by Jurg Rohrer, PhD, BD Biosciences 10.26.10 Outline Introduction Cytokines
Supplementary Information. Tissue-wide immunity against Leishmania. through collective production of nitric oxide
 Supplementary Information Tissue-wide immunity against Leishmania through collective production of nitric oxide Romain Olekhnovitch, Bernhard Ryffel, Andreas J. Müller and Philippe Bousso Supplementary
Supplementary Table; Supplementary Figures and legends S1-S21; Supplementary Materials and Methods
 Silva et al. PTEN posttranslational inactivation and hyperactivation of the PI3K/Akt pathway sustain primary T cell leukemia viability Supplementary Table; Supplementary Figures and legends S1-S21; Supplementary
SUPPLEMENTARY INFORMATION
 doi:10.1038/nature10134 Supplementary Figure 1. Anti-inflammatory activity of sfc. a, Autoantibody immune complexes crosslink activating Fc receptors, promoting activation of macrophages, and WWW.NATURE.COM/NATURE
a Beckman Coulter Life Sciences: White Paper
 a Beckman Coulter Life Sciences: White Paper An 8-color DuraClone IM panel for detection of Human blood dendritic cells by flow cytometry Nathalie Dupas 1, Snehita Sattiraju 2, Neha Girish 2, Murthy Pendyala
In vitro human regulatory T cell suppression assay
 Human CD4 + CD25 + regulatory T cell isolation, in vitro suppression assay and analysis In vitro human regulatory T cell suppression assay Introduction Regulatory T (Treg) cells are a subpopulation of
Mouse DCs were cocultured with ID8-ova lysates, matured and analyzed for CD11c. SIINFEKL-pentamer staining and mouse Treg cell phenoytyping
 Supplementary Materials and Methods Detection of SIINFEKL-MHC Class I complex on mouse DCs Mouse DCs were cocultured with ID8-ova lysates, matured and analyzed for CD11c (clone N418, Armenian hamster IgG,
In vitro human regulatory T cell expansion
 - 1 - Human CD4 + CD25 + regulatory T cell isolation, Workflow in vitro expansion and analysis In vitro human regulatory T cell expansion Introduction Regulatory T (Treg) cells are a subpopulation of T
ImageStream cytometer analysis. Cells were cultured as described above in vented-cap
 ImageStream cytometer analysis. Cells were cultured as described above in vented-cap polypropylene tubes, stained with αcd66b-fitc, αm-dc8-pe and αcd56-pe-cy5.5 mabs, washed and fixed with 4 % (w/v) paraformaldehyde.
SUPPLEMENTARY INFORMATION
 doi:1.138/nature1554 a TNF-α + in CD4 + cells [%] 1 GF SPF 6 b IL-1 + in CD4 + cells [%] 5 4 3 2 1 Supplementary Figure 1. Effect of microbiota on cytokine profiles of T cells in GALT. Frequencies of TNF-α
Supplementary Fig. 1 p38 MAPK negatively regulates DC differentiation. (a) Western blot analysis of p38 isoform expression in BM cells, immature DCs
 Western blot analysis of p38 isoform expression in BM cells, immature DCs") Supplementary Fig. 1 p38 MAPK negatively regulates DC differentiation. (a) Western blot analysis of p38 isoform expression in BM cells, immature DCs (idcs) and mature DCs (mdcs). A myeloma cell line expressing
Supplementary Fig. 1 p38 MAPK negatively regulates DC differentiation. (a) Western blot analysis of p38 isoform expression in BM cells, immature DCs (idcs) and mature DCs (mdcs). A myeloma cell line expressing
Nature Immunology: doi: /ni Supplementary Figure 1. Gene expression profile of CD4 + T cells and CTL responses in Bcl6-deficient mice.
 Supplementary Figure 1 Gene expression profile of CD4 + T cells and CTL responses in Bcl6-deficient mice. (a) Gene expression profile in the resting CD4 + T cells were analyzed by an Affymetrix microarray
Supporting Information
 Supporting Information Valkenburg et al. 10.1073/pnas.1403684111 SI Materials and Methods ELISA and Microneutralization. Sera were treated with Receptor Destroying Enzyme II (RDE II, Accurate) before ELISA
In vitro human regulatory T cell expansion
 - 1 - Human CD4 + CD25 + CD127 dim/- regulatory T cell Workflow isolation, in vitro expansion and analysis In vitro human regulatory T cell expansion Introduction Regulatory T (Treg) cells are a subpopulation
Supplementary Figure 1.
 Supplementary Figure 1. Female Pro-ins2 -/- mice at 5-6 weeks of age were either inoculated i.p. with a single dose of CVB4 (1x10 5 PFU/mouse) or PBS and treated with αgalcer or control vehicle. On day
Trim29 gene-targeting strategy. (a) Genotyping of wildtype mice (+/+), Trim29 heterozygous mice (+/ ) and homozygous mice ( / ).
 Genotyping of wildtype mice (+/+), Trim29 heterozygous mice (+/ ) and homozygous mice ( / ).") Supplementary Figure 1 Trim29 gene-targeting strategy. (a) Genotyping of wildtype mice (+/+), Trim29 heterozygous mice (+/ ) and homozygous mice ( / ). (b) Immunoblot analysis of TRIM29 in lung primary
Supplementary Figure 1 Trim29 gene-targeting strategy. (a) Genotyping of wildtype mice (+/+), Trim29 heterozygous mice (+/ ) and homozygous mice ( / ). (b) Immunoblot analysis of TRIM29 in lung primary
and follicular helper T cells is Egr2-dependent. (a) Diagrammatic representation of the
 Diagrammatic representation of the") Supplementary Figure 1. LAG3 + Treg-mediated regulation of germinal center B cells and follicular helper T cells is Egr2-dependent. (a) Diagrammatic representation of the experimental protocol for the
Supplementary Figure 1. LAG3 + Treg-mediated regulation of germinal center B cells and follicular helper T cells is Egr2-dependent. (a) Diagrammatic representation of the experimental protocol for the
VEGFR2-Mediated Vascular Dilation as a Mechanism of VEGF-Induced Anemia and Bone Marrow Cell Mobilization
 Cell Reports, Volume 9 Supplemental Information VEGFR2-Mediated Vascular Dilation as a Mechanism of VEGF-Induced Anemia and Bone Marrow Cell Mobilization Sharon Lim, Yin Zhang, Danfang Zhang, Fang Chen,
CONTRACTING ORGANIZATION: Johns Hopkins University School of Medicine Baltimore, MD 21205
 AD Award Number: DAMD7---7 TITLE: Development of Artificial Antigen Presenting Cells for Prostate Cancer Immunotherapy PRINCIPAL INVESTIGATOR: Jonathan P. Schneck, M.D., Ph.D. Mathias Oelke, Ph.D. CONTRACTING
Application Information Bulletin: Human NK Cells Phenotypic characterizing of human Natural Killer (NK) cell populations in peripheral blood
 cell populations in peripheral blood") Application Information Bulletin: Human NK Cells Phenotypic characterizing of human Natural Killer (NK) cell populations in peripheral blood Christopher A Fraker, Ph.D., University of Miami - Miami, Florida
Application Information Bulletin: Human NK Cells Phenotypic characterizing of human Natural Killer (NK) cell populations in peripheral blood Christopher A Fraker, Ph.D., University of Miami - Miami, Florida
B6/COLODR/SPL/11C/83/LAP/#2.006 B6/COLODR/SPL/11C/86/LAP/#2.016 CD11C B6/COLODR/SPL/11C/80/LAP/#2.011 CD11C
 CD3-specific antibody-induced immune tolerance and suppression of autoimmune encephalomyelitis involves TGF-β production through phagocytes digesting apoptotic T cells Sylvain Perruche 1,3, Pin Zhang 1,
SUPPLEMENT Supplementary Figure 1: (A) (B)
 (B)") SUPPLEMENT Supplementary Figure 1: CD4 + naïve effector T cells (CD4 effector) were labeled with CFSE, stimulated with α-cd2/cd3/cd28 coated beads (at 2 beads/cell) and cultured alone or cocultured with
SUPPLEMENT Supplementary Figure 1: CD4 + naïve effector T cells (CD4 effector) were labeled with CFSE, stimulated with α-cd2/cd3/cd28 coated beads (at 2 beads/cell) and cultured alone or cocultured with
Supplementary Materials for
 www.sciencesignaling.org/cgi/content/full/8/381/ra59/dc1 Supplementary Materials for Analysis of single-cell cytokine secretion reveals a role for paracrine signaling in coordinating macrophage responses
Supplementary Information. A vital role for IL-2 trans-presentation in DC-mediated T cell activation in humans as revealed by daclizumab therapy
 Supplementary Information A vital role for IL-2 trans-presentation in DC-mediated T cell activation in humans as revealed by daclizumab therapy Simone C. Wuest 1, Jehad Edwan 1, Jayne F. Martin 1, Sungpil
Suppl Video: Tumor cells (green) and monocytes (white) are seeded on a confluent endothelial
 and monocytes (white) are seeded on a confluent endothelial") Supplementary Information Häuselmann et al. Monocyte induction of E-selectin-mediated endothelial activation releases VE-cadherin junctions to promote tumor cell extravasation in the metastasis cascade
Supplementary Information Häuselmann et al. Monocyte induction of E-selectin-mediated endothelial activation releases VE-cadherin junctions to promote tumor cell extravasation in the metastasis cascade
Supplemental Table I.
 Supplemental Table I Male / Mean ± SEM n Mean ± SEM n Body weight, g 29.2±0.4 17 29.7±0.5 17 Total cholesterol, mg/dl 534.0±30.8 17 561.6±26.1 17 HDL-cholesterol, mg/dl 9.6±0.8 17 10.1±0.7 17 Triglycerides,
SUPPLEMENTARY INFORMATION
 Supplemental Figure 1. Furin is efficiently deleted in CD4 + and CD8 + T cells. a, Western blot for furin and actin proteins in CD4cre-fur f/f and fur f/f Th1 cells. Wild-type and furin-deficient CD4 +
Comprehensive evaluation of human immune system reconstitution in NSG. and NSG -SGM3 mouse models toward the development of a novel ONCO-HU
 Comprehensive evaluation of human immune system reconstitution in NSG and NSG -SGM3 mouse models toward the development of a novel ONCO-HU xenograft model Aaron Middlebrook, 1 Eileen Snowden, 2 Warren
Supplemental Materials for. Effects of sphingosine-1-phosphate receptor 1 phosphorylation in response to. FTY720 during neuroinflammation
 Supplemental Materials for Effects of sphingosine-1-phosphate receptor 1 phosphorylation in response to FTY7 during neuroinflammation This file includes: Supplemental Table 1. EAE clinical parameters of
Supplementary Figures
 Inhibition of Pulmonary Anti Bacterial Defense by IFN γ During Recovery from Influenza Infection By Keer Sun and Dennis W. Metzger Supplementary Figures d a Ly6G Percentage survival f 1 75 5 1 25 1 5 1
Supplemental Figure 1. IL-3 blockade with Fab CSL362 depletes plasmacytoid dendritic cells (pdcs), but not basophils, at higher doses.
, but not basophils, at higher doses.") Supplemental Figure 1. IL-3 blockade with Fab CSL362 depletes plasmacytoid dendritic cells (pdcs), but not basophils, at higher doses. Percentage of viable (A) pdcs (Sytox Blue-, Lin1-, HLADR+, BDCA2++)
Supplemental Figure 1. IL-3 blockade with Fab CSL362 depletes plasmacytoid dendritic cells (pdcs), but not basophils, at higher doses. Percentage of viable (A) pdcs (Sytox Blue-, Lin1-, HLADR+, BDCA2++)
Interferon γ regulates idiopathic pneumonia syndrome, a. Th17 + CD4 + T-cell-mediated GvH disease
 Interferon γ regulates idiopathic pneumonia syndrome, a Th17 + CD4 + T-cell-mediated GvH disease Nora Mauermann, Julia Burian, Christophe von Garnier, Stefan Dirnhofer, Davide Germano, Christine Schuett,
TITLE: Development of Antigen Presenting Cells for adoptive immunotherapy in prostate cancer
 AD Award Number: W8-XWH-5-- TITLE: Development of Antigen Presenting Cells for adoptive immunotherapy in prostate cancer PRINCIPAL INVESTIGATOR: Mathias Oelke,. CONTRACTING ORGANIZATION: Johns Hopkins
Interleukin-2-Dependent Allergen-Specific Tissue-Resident Memory Cells Drive Asthma
 Immunity Supplemental Information Interleukin-2-Dependent Allergen-Specific Tissue-Resident Memory Cells Drive Asthma Brian D. Hondowicz, Dowon An, Jason M. Schenkel, Karen S. Kim, Holly R. Steach, Akshay
were isolated from the freshly drawn blood of healthy donors and ACS patients using the
 Supplemental Figure 1. Quality control of CD4 + T-cell purification. CD4 + T cells were isolated from the freshly drawn blood of healthy donors and ACS patients using the RosetteSep CD4 + T Cell Enrichment
Live cell imaging of trafficking of the chaperone complex vaccine to the ER. BMDCs were incubated with ER-Tracker Red (1 M) in staining solution for
 in staining solution for") Live cell imaging of trafficking of the chaperone complex vaccine to the ER. BMDCs were incubated with ER-Tracker Red (1 M) in staining solution for 15 min at 37 C and replaced with fresh complete medium.
Live cell imaging of trafficking of the chaperone complex vaccine to the ER. BMDCs were incubated with ER-Tracker Red (1 M) in staining solution for 15 min at 37 C and replaced with fresh complete medium.