UNAIDS 2014 REFERENCE UNITED REPUBLIC OF TANZANIA DEVELOPING SUBNATIONAL ESTIMATES OF HIV PREVALENCE AND THE NUMBER OF PEOPLE LIVING WITH HIV
|
|
|
- Dulcie Barrett
- 6 years ago
- Views:
Transcription
1 UNAIDS 2014 REFERENCE UNITED REPUBLIC OF TANZANIA DEVELOPING SUBNATIONAL ESTIMATES OF HIV PREVALENCE AND THE NUMBER OF PEOPLE LIVING WITH HIV
2 UNAIDS / JC2665E (English original, September 2014) Copyright Joint United Nations Programme on HIV/AIDS (UNAIDS). All rights reserved. Publications produced by UNAIDS can be obtained from the UNAIDS Information Production Unit. Reproduction of graphs, charts, maps and partial text is granted for educational, not-for-profit and commercial purposes as long as proper credit is granted to UNAIDS: UNAIDS + year. For photos, credit must appear as: UNAIDS/name of photographer + year. Reproduction permission or translation-related requests whether for sale or for non-commercial distribution should be addressed to the Information Production Unit by at: publicationpermissions@unaids.org. The designations employed and the presentation of the material in this publication do not imply the expression of any opinion whatsoever on the part of UNAIDS concerning the legal status of any country, territory, city or area or of its authorities, or concerning the delimitation of its frontiers or boundaries. UNAIDS does not warrant that the information published in this publication is complete and correct and shall not be liable for any damages incurred as a result of its use.
3 METHODOLOGY NOTE Developing subnational estimates of HIV prevalence and the number of people living with HIV from survey data Introduction Significant geographic variation in HIV incidence and prevalence, as well as programme implementation, has been observed between and within countries. Methods to generate subnational estimates of HIV prevalence and the number of people living with HIV are being explored in response to the urgent need for data at smaller administrative units, in order to inform programming that is aligned with local community needs. This guidance note describes existing methods to generate subnational estimates of HIV prevalence and the number of people living with HIV from survey data, with a particular focus on the development of maps of estimates at second administrative level through the prevr model (1) as a data visualization resource. Although HIV estimates at the first administrative level can be generated through various methods and sources for countries with available data, HIV estimates at the second administrative level are not currently available. Estimates at the second administrative level generated through prevr must be interpreted with caution; however, they provide an indication of the status of the epidemic subnationally within a country. A more complex method for estimating HIV prevalence and other variables at the second administrative level is being further developed, which will be integrated with existing Joint United Nations Programme on HIV/AIDS (UNAIDS) estimation processes. prevr Applying the prevr method to generate maps of estimates of the number of people living with HIV (aged and 15 and older) and of HIV prevalence (aged 15 49) at the second administrative level was recommended by participants at a technical consultation on methods for generating subnational estimates. This consultation, held in Nairobi, Kenya, March 2014, was convened by the HIV Modelling Consortium, the UNAIDS Reference Group on Estimates, Modelling and Projections and the UNAIDS Task Force on Hotspots. It served as a follow up to the July 2013 consultation on identifying populations at greatest risk of infection, which focused on geographic hotspots and key populations. The countries to which this method was applied were selected based on the availability of data from Demographic and Health Surveys (DHS) or AIDS Indicator Surveys (AIS), which included georeferenced and HIV testing data gathered since Beginning in 2009, the displacement of DHS cluster data 1 was restricted to the second administrative level (2). 1. In DHS surveys, clusters (groupings of households) are georeferenced, with a random displacement of latitude and longitude. Urban clusters are displaced by a maximum of 2 km and rural clusters by a maximum of 5 km, with 1% displaced 10km. Please see reference 2 for details. Displacement is restricted to within a country and to survey regions, and, since 2009, has also been restricted to the second administrative level, where possible. Developing subnational estimates of HIV prevalence and the number of people living with HIV 1
4 METHODOLOGY NOTE Method The survey data have been spatially distributed using a kernel density approach with adaptive bandwidths based on a minimum number of observations in order to generate estimates of HIV prevalence among people aged years. This method was described in detail elsewhere (1) and was implemented in the prevr package (in R language). The basic principle of the prevr method is to calculate an intensity surface of positive cases and an intensity surface of observations. The ratio of positive cases to observations results in the prevalence surface. The intensity surface of observations is expressed as the number of observations per surface area (per square degree or per square km, depending on the coordinate system). The volume below this surface is equal to the total number of observations in the dataset. This surface indicates how observations are distributed from a scatterplot on a continuous surface. For each administrative unit, the integral of the intensity surface is calculated (i.e. the corresponding volume below this surface) to obtain the number of distributed observations in that administrative unit. Results are merged per administrative unit and uncertainty bounds are calculated as 95% confidence intervals based on the distributed number of observations (through kernel density estimations) per unit. This confidence interval is wider in less surveyed areas and narrower in areas with several survey clusters. The spatial distribution of the population is based on LandScan, which is used to generate the spatial distribution of the population aged 15 to 49 and the population aged 50 and over, adjusted to estimates of the total population aged 15 to 49 and 15 and older from Spectrum. 2 The spatial distribution of HIV prevalence and people living with HIV was estimated using prevr and DHS data. Prevalence among the population 50 years and older was computed using a prevalence ratio derived from UNAIDS estimates produced using Spectrum software (3). Finally, estimates were adjusted to UNAIDS estimates of the number of people living with HIV aged and 15 and older (3). National estimates obtained by aggregating subnational estimates of the number of people living with HIV and HIV prevalence generated using this method will, therefore, match UNAIDS estimates. UNAIDS estimates are midyear estimates. For countries with a DHS conducted during a single year, the estimates are adjusted to the same year. For countries with DHS conducted over two years, estimates are adjusted to UNAIDS estimates for the second year of the survey. 2. Population estimates were obtained through the Spectrum module DemProj. These estimates are based on the United Nations Population Division s World Population Prospects Some differences may exist between the United Nations Population Division estimates and those obtained through Spectrum. United Nations Population Division estimates are input into Spectrum, and are then adjusted within Spectrum by removing the estimated population of people living with HIV, which is then added back through the estimation process. This process is limited to the 39 high-burden countries. 2 UNAIDS
5 METHODOLOGY NOTE The main hypotheses of this method are as follows: The age structure are uniform across the country. Population based survey data is used only to define the shape of the prevalence surface, while the level of prevalence is defined by UNAIDS estimates. The spatial distribution of HIV among people aged 50 and over is equal to the spatial distribution of HIV among people aged 15 to 49. Quality of the subnational estimates of HIV prevalence and number of people living with HIV generated through prevr Subnational estimates are accompanied by a quality of estimates indicator and 95% confidence intervals. The estimate quality is categorized based on the following scale: Good: estimates are based on observations from the same subnational area. Moderately good: estimates are primarily based on observations from the same subnational area. Uncertain: estimates are primarily based on observations from a neighbouring subnational area. Very uncertain: estimates are based only on observations from a neighbouring subnational area. The quality of HIV estimates at the subnational level depends on the survey sample size. DHS was designed to be representative at the national and first administrative levels, but, in most countries, not at the second administrative level beyond the DHS regions. The number of observations per subnational area varies significantly. If some subnational areas have been sufficiently surveyed, others may be underrepresented. In that case, HIV prevalence has been estimated using observations from neighbouring areas and is categorized as uncertain or very uncertain. Uncertainty estimates correspond to variations between first administrative level areas and may be inaccurate when local variations are not captured by the survey. Sources of administrative area boundaries used to determine if an observation crossed over a second-level administrative border may have errors, therefore observations near border areas need to be considered as uncertain as to their location. Areas with a higher relative HIV prevalence (expressed as a percentage) are not necessarily those with a higher absolute number of people living with HIV (represented on the people living with HIV density map) since the spatial distribution of the population is highly irregular. Confidence intervals complement the quality of estimates indicator. Confidence intervals only take into account that estimates of the prevalence and the number of people living with HIV aged are based on a limited number of observations. They do not consider the spatial dimension of the estimates. How are subnational estimates of HIV prevalence and number of people living with HIV produced using prevr related to the UNAIDS estimation process using Spectrum? UNAIDS estimates trends of HIV prevalence over time at the national level using multiple data sources including population based surveys. This report estimates spatial subnational variations of HIV prevalence and the number of people living with HIV for a given year based on a unique population based survey. Furthermore, the spatial distribution of observations is taken into account here. These two approaches should be considered complementary. Developing subnational estimates of HIV prevalence and the number of people living with HIV 3
6 METHODOLOGY NOTE Data sources The following data were used: DHS/AIS ( Burkina Faso, DHS, 2010, Burundi, DHS, 2010, Cameroon, DHS, 2011, Côte d Ivoire, DHS, , Ethiopia, DHS, 2011, Gabon, DHS, 2012, Guinea, DHS Multiple Indicator Cluster Survey (MICS), 2012, Haiti, DHS, 2012, Lesotho, DHS, 2009, Malawi, DHS, 2010, Mozambique, DHS, 2009, Rwanda, DHS, , Senegal, DHS MICS, , Sierra Leone, DHS, 2008, United Republic of Tanzania, Tanzania HIV/AIDS and Malaria Indicator Survey (THMIS), , Uganda, AIS, 2011 and Zimbabwe, DHS, ; Background layers: Google Maps API ( OpenStreetMap ( and UNAIDS 2013 HIV estimates. LandScan for the global population distribution ( landscan/); Administrative boundaries: Global Administration Areas (GADM) ( Rwanda, the National Statistics Institute of Rwanda ( gov.rw/geodata); Gabon and Uganda, Global Administrative Unit Layers (GAUL) ( en/metadata.show?id=12691) 4 UNAIDS
7 METHODOLOGY NOTE Other methods for generating subnational HIV estimates From DHS HIV testing has been conducted by DHS since 2001, on the basis of which nationally representative estimates of HIV prevalence are produced. Estimates of HIV prevalence at the first administrative level are also produced. DHS is typically designed to be representative at the national and first administrative levels, but not at the subnational level more specific than the first administrative level. Prevalence estimates from DHS for countries that have included HIV testing in their surveys are available from the DHS website ( dhsprogram.com/) through StatCompiler or through country reports or datasets. Spectrum/Estimation and Projection Package (EPP) Estimates for countries and first administrative level are generated using Spectrum/ Estimation and Projection Package (EPP) based on the data available. Data sources include surveys of pregnant women attending antenatal clinics, population based surveys, sentinel surveillance among key populations at higher risk, case reporting, programme data on antiretroviral therapy and prevention of mother to child transmission programmes and demographic data. The results from these models include a wide array of variables related to HIV including HIV prevalence and number of people living with HIV. Annually, UNAIDS and its partners support country level teams in producing national estimates using Spectrum. Every two years, UNAIDS and its partners conduct regional workshops to train national personnel on the tools and methodologies used to produce national estimates. Country level teams are then responsible for calculating HIV estimates and projections. Regional estimates are produced separately for each region based on data only from that province (4). In several countries where data are available, including India, South Africa, Nigeria, Mozambique and Kenya, estimates have been produced at the regional level using Spectrum. In Kenya for example, estimates were first produced at the provincial level 3 applying Spectrum/EPP by including province level inputs. In the next step, the provincial level estimates were disaggregated to the county level. Population projections for each province were based on the total fertility rates and mortality indicators from the Kenya DHS and adjusted to match the estimates from the national census. Population estimates for counties were taken from the National Bureau of Statistics. For each county, the prevalence was determined by examining surveillance and survey cluster data from 2003 to As stated in the report: The prevalence estimate for 2013 for each county was multiplied by the population aged in the county to estimate the number of [HIV positive] adults. The number of [HIV positive] adults in each county was adjusted so that the total across all counties in a province would equal the provincial total. Values for other indicators were first distributed by county according to the number of [HIV positive] adults and then adjusted to match the provincial totals (5). 3. Note that while the DHS/AIS were designed to inform at the level of the province, the provincial administrative level is no longer in existence in Kenya. Developing subnational estimates of HIV prevalence and the number of people living with HIV 5
8 METHODOLOGY NOTE Disclaimer The designation employed and the presentation of the material in this publication do not imply the expression of any opinion whatsoever on the part of UNAIDS concerning the legal status of any country, territory, city or area or of its authorities, or concerning the delimitation of its frontiers or boundaries. UNAIDS does not warrant that the information presented in this publication is complete and correct and shall not be liable for any damages incurred as a result of its use. References: 1. Larmarange J, Vallo R, Yaro S, Msellati P, Méda N. Methods for mapping regional trends of HIV prevalence from Demographic and Health Surveys (DHS). CyberGeo: European Journal of Geography. 2011;558. doi: / cybergeo Burgert, Clara R., Josh Colston, Thea Roy, and Blake Zachary Geographic displacement procedure and georeferenced data release policy for the Demographic and Health Surveys. DHS Spatial Analysis Reports No. 7. Calverton, Maryland, USA: ICF International. 3. Methodology understanding the HIV estimates. Geneva: Joint United Nations Programme on HIV/AIDS; 2013 ( pdf, accessed 7 July 2014). 4. Stover J, Brown T, Marston M. Updates to the Spectrum/Estimation and Projection Package (EPP) model to estimate HIV trends for adults and children. Sexually Transmitted Infections. 2012;88(Suppl 2):i11.i16. doi: / sextrans National HIV indicators for Kenya: National AIDS and STI Control Programme; UNAIDS

9 UNITED REPUBLIC OF TANZANIA HIV estimates at district level Developing subnational estimates of HIV prevalence and the number of people living with HIV 121

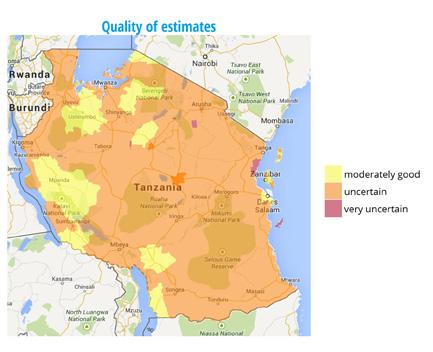
10 122 UNAIDS

11 Quality of estimates Good: estimates are based on observations from the same district. Moderately good: estimates are mainly based on observations from the same district. Uncertain: estimates are mainly based on observations from neighboring districts. Very uncertain: estimates are based only on observations from neighboring districts. Quality of HIV estimates at district level depends on the sampling size of the 2011/12 United Republic of Tanzania THMIS survey, where a total of individuals were tested successfully for HIV in 570 survey clusters with geolocation. Developing subnational estimates of HIV prevalence and the number of people living with HIV 123
12 Estimates per district Arusha Region / District HIV prevalence People living with HIV People living with HIV (15+ years old) Quality of estimates Arumeru 6,20% uncertain Arusha 6,30% uncertain Karatu 0,40% uncertain Monduli 3,40% uncertain Ngorongoro 0,30% uncertain Simanjiro 3,10% very uncertain Dar Es Salaam Dodoma Ilala 7,60% moderately good Kinondoni 6,80% moderately good Temeke 8,30% moderately good Dodoma Rural 4,00% uncertain Dodoma Urban 4,40% uncertain Iringa Kagera Kondoa 1,50% uncertain Kongwa 2,60% uncertain Mpwapwa 3,20% uncertain Iringa Rural 7,60% uncertain Iringa Urban 7,30% uncertain Kilolo 6,40% uncertain Ludewa 12,00% uncertain Makete 13,20% uncertain Mufindi 13,40% uncertain Njombe 13,30% moderately good Biharamulo 2,40% uncertain Bukoba Rural 6,80% uncertain Bukoba Urban 7,00% very uncertain Karagwe 5,90% uncertain Muleba 5,60% uncertain Ngara 2,50% uncertain Kaskazini Pemba Micheweni 0,50% uncertain Wete 0,50% moderately good Kaskazini Unguja 124 UNAIDS
13 Region / District HIV prevalence People living with HIV People living with HIV (15+ years old) Quality of estimates Kaskazini A 0,80% moderately good Kaskazini B 2,50% uncertain Kigoma Kasulu 4,90% uncertain Kibondo 1,90% uncertain Kigoma Rural 4,80% uncertain Kigoma Urban 5,50% uncertain Kilimanjaro Hai 5,60% uncertain Moshi Rural 3,50% uncertain Moshi Urban 3,60% uncertain Mwanga 4,20% uncertain Rombo 3,10% uncertain Kusini Pemba Lindi Same 2,60% uncertain Chakechake 0,70% uncertain Mkoani 0,50% moderately good Kilwa 3,40% uncertain Lindi Rural 3,50% uncertain Lindi Urban 3,10% uncertain Liwale 2,90% uncertain Nachingwea 5,20% uncertain Manyara Mara Ruangwa 4,90% uncertain Babati 0,50% uncertain Hanang 1,20% uncertain Karatu 0,20% 0 0 very uncertain Kiteto 1,40% uncertain Mbulu 0,60% uncertain Simanjiro 2,90% uncertain Bunda 5,10% uncertain Developing subnational estimates of HIV prevalence and the number of people living with HIV 125
14 Region / District HIV prevalence People living with HIV People living with HIV (15+ years old) Quality of estimates Musoma Rural 4,60% uncertain Musoma Urban 4,00% uncertain Mbeya Serengeti 2,70% uncertain Tarime 3,60% moderately good Chunya 8,20% uncertain Ileje 10,20% uncertain Kyela 12,80% uncertain Mbarali 12,00% uncertain Mbeya Rural 9,50% uncertain Mbeya Urban 9,40% uncertain Morogoro Mbozi 7,10% uncertain Rungwe 10,90% uncertain Kilombero 8,10% uncertain Kilosa 2,70% uncertain Morogoro Rural 3,60% uncertain Morogoro Urban 3,00% uncertain Mtwara Mvomero 2,70% uncertain Ulanga 6,80% uncertain Masasi 5,80% uncertain Mtwara Rural 2,30% uncertain Mtwara Urban 2,10% uncertain Newala 4,80% uncertain Tandahimba 3,50% uncertain Mwanza Pwani Geita 4,30% moderately good Ilemela 4,00% uncertain Kwimba 6,10% uncertain Magu 4,70% uncertain Misungwi 5,60% uncertain Nyamagana 3,90% uncertain Sengerema 4,10% uncertain Ukerewe 4,30% uncertain Bagamoyo 4,40% uncertain 126 UNAIDS
15 Rukwa Region / District HIV prevalence People living with HIV People living with HIV (15+ years old) Quality of estimates Kibaha 3,80% uncertain Kisarawe 4,90% uncertain Mafia 4,00% very uncertain Mkuranga 7,30% uncertain Rufiji 4,90% uncertain Mpanda 5,50% moderately good Nkasi 6,50% uncertain Sumbawanga Rural 5,80% moderately good Sumbawanga Urban Ruvuma 7,50% uncertain Mbinga 8,80% moderately good Namtumbo 9,00% uncertain Songea Rural 9,90% uncertain Songea Urban 10,00% uncertain Shinyanga Tunduru 3,20% uncertain Bariadi 3,30% moderately good Bukombe 3,80% moderately good Kahama 6,50% moderately good Kishapu 8,20% uncertain Maswa 5,60% moderately good Meatu 5,50% uncertain Shinyanga Rural 8,00% uncertain Shinyanga Urban 8,50% uncertain Singida Iramba 4,60% moderately good Manyoni 3,90% uncertain Singida Rural 2,60% uncertain Singida Urban 2,00% uncertain Tabora Igunga 7,60% uncertain Developing subnational estimates of HIV prevalence and the number of people living with HIV 127
16 Tanga Region / District HIV prevalence People living with HIV People living with HIV (15+ years old) Quality of estimates n.a. ( 1081) 6,40% very uncertain Nzega 6,70% uncertain Sikonge 7,00% uncertain Tabora Urban 4,40% uncertain Urambo 2,90% uncertain Uyui 5,40% uncertain Handeni 3,90% uncertain Kilindi 2,20% uncertain Korogwe 2,40% uncertain Lushoto 1,50% uncertain Muheza 2,70% uncertain Pangani 4,00% very uncertain Tanga 2,80% uncertain Zanzibar South and Central Kusini 0,90% uncertain Zansibar Central 1,50% moderately good Zanzibar West Magharibi 1,20% moderately good Mjini 0,70% moderately good ALL 5,10% UNAIDS
17 Uncertainty bounds Arusha Region / District HIV prevalence People living with HIV Low High Low High Quality of estimates Arumeru 3,20% 11,50% uncertain Arusha 0,00% 51,90% uncertain Karatu 0,00% 8,50% uncertain Monduli 1,50% 7,10% uncertain Ngorongoro 0,00% 7,70% uncertain Simanjiro 0,00% 39,60% very uncertain Dar Es Salaam Dodoma Ilala 5,10% 11,10% moderately good Kinondoni 4,60% 9,80% moderately good Temeke 5,40% 12,40% moderately good Dodoma Rural 1,70% 8,60% uncertain Dodoma Urban 0,50% 18,80% uncertain Iringa Kagera Kondoa 0,30% 5,60% uncertain Kongwa 0,20% 14,10% uncertain Mpwapwa 0,70% 10,20% uncertain Iringa Rural 4,40% 12,60% uncertain Iringa Urban 0,00% 77,00% uncertain Kilolo 3,20% 12,10% uncertain Ludewa 5,60% 22,80% uncertain Makete 7,40% 22,10% uncertain Mufindi 9,00% 19,50% uncertain Njombe 9,70% 17,90% moderately good Biharamulo 0,90% 5,80% uncertain Bukoba Rural 2,10% 17,90% uncertain Bukoba Urban 0,00% 95,00% very uncertain Karagwe 2,60% 12,40% uncertain Muleba 1,70% 14,80% uncertain Ngara 0,10% 17,50% uncertain Kaskazini Pemba Micheweni 0,00% 5,80% uncertain Wete 0,00% 3,20% moderately good Developing subnational estimates of HIV prevalence and the number of people living with HIV 129
18 Region / District Kaskazini Unguja HIV prevalence People living with HIV Low High Low High Quality of estimates Kaskazini A 0,00% 4,60% moderately good Kaskazini B 0,90% 6,00% uncertain Kigoma Kasulu 1,60% 12,70% uncertain Kibondo 0,40% 6,60% uncertain Kigoma Rural 1,60% 12,40% uncertain Kigoma Urban 0,00% 84,40% uncertain Kilimanjaro Hai 2,30% 12,20% uncertain Moshi Rural 0,80% 11,70% uncertain Moshi Urban 0,00% 65,20% uncertain Mwanga 0,60% 16,70% uncertain Rombo 0,30% 14,30% uncertain Kusini Pemba Lindi Same 0,30% 12,50% uncertain Chakechake 0,00% 4,50% uncertain Mkoani 0,00% 5,60% moderately good Kilwa 0,70% 12,40% uncertain Lindi Rural 1,50% 7,70% uncertain Lindi Urban 0,00% 47,20% uncertain Liwale 0,70% 9,50% uncertain Nachingwea 1,80% 13,00% uncertain Manyara Ruangwa 1,30% 14,20% uncertain Babati 0,00% 5,50% uncertain Hanang 0,20% 5,20% uncertain Karatu 0,00% 86,80% 0 50 very uncertain Kiteto 0,10% 7,60% uncertain Mbulu 0,00% 5,00% uncertain Simanjiro 1,20% 6,20% uncertain 130 UNAIDS
19 Mara Region / District HIV prevalence People living with HIV Low High Low High Quality of estimates Bunda 1,70% 13,40% uncertain Musoma Rural 1,90% 10,10% uncertain Musoma Urban 0,00% 72,80% uncertain Mbeya Serengeti 0,90% 7,30% uncertain Tarime 1,30% 8,80% moderately good Chunya 4,40% 14,60% uncertain Ileje 3,50% 24,10% uncertain Kyela 1,80% 43,00% uncertain Mbarali 7,20% 18,90% uncertain Mbeya Rural 4,60% 18,20% uncertain Mbeya Urban 0,30% 47,40% uncertain Morogoro Mbozi 3,50% 13,50% uncertain Rungwe 4,80% 22,00% uncertain Kilombero 4,20% 14,70% uncertain Kilosa 0,80% 7,70% uncertain Morogoro Rural 1,20% 9,20% uncertain Morogoro Urban 0,00% 48,40% uncertain Mtwara Mvomero 0,40% 10,90% uncertain Ulanga 2,90% 14,30% uncertain Masasi 2,70% 11,30% uncertain Mtwara Rural 0,30% 10,90% uncertain Mtwara Urban 0,00% 74,70% uncertain Newala 1,20% 14,30% uncertain Tandahimba 0,60% 13,60% uncertain Mwanza Geita 2,50% 7,10% moderately good Ilemela 0,10% 24,30% uncertain Kwimba 2,80% 12,20% uncertain Magu 1,60% 11,40% uncertain Misungwi 2,30% 12,20% uncertain Nyamagana 0,00% 79,20% uncertain Sengerema 1,60% 9,10% uncertain Ukerewe 0,00% 35,20% uncertain Developing subnational estimates of HIV prevalence and the number of people living with HIV 131
20 Pwani Rukwa Region / District HIV prevalence People living with HIV Low High Low High Quality of estimates Bagamoyo 1,60% 10,60% uncertain Kibaha 0,80% 13,00% uncertain Kisarawe 1,60% 12,80% uncertain Mafia 0,00% 95,00% very uncertain Mkuranga 2,80% 16,70% uncertain Rufiji 1,10% 16,10% uncertain Mpanda 3,60% 8,20% moderately good Nkasi 3,40% 11,80% uncertain Sumbawanga Rural 2,80% 11,30% moderately good Sumbawanga Urban Ruvuma 1,60% 23,90% uncertain Mbinga 4,20% 16,90% moderately good Namtumbo 4,90% 15,50% uncertain Songea Rural 5,90% 15,80% uncertain Songea Urban 0,00% 59,00% uncertain Shinyanga Tunduru 0,50% 12,70% uncertain Bariadi 1,60% 6,40% moderately good Bukombe 2,00% 7,10% moderately good Kahama 4,10% 10,10% moderately good Kishapu 4,30% 14,60% uncertain Maswa 2,80% 10,40% moderately good Meatu 2,80% 10,30% uncertain Shinyanga Rural 4,30% 13,90% uncertain Shinyanga Urban 1,30% 29,90% uncertain Singida Iramba 2,50% 8,20% moderately good Manyoni 1,40% 9,60% uncertain Singida Rural 1,10% 5,60% uncertain Singida Urban 0,00% 19,60% uncertain 132 UNAIDS
21 Tabora Tanga Region / District HIV prevalence People living with HIV Low High Low High Quality of estimates Igunga 4,00% 13,40% uncertain n.a. ( 1081) 0,00% 75,00% very uncertain Nzega 4,10% 10,70% uncertain Sikonge 3,00% 14,70% uncertain Tabora Urban 0,40% 19,80% uncertain Urambo 1,30% 6,20% uncertain Uyui 2,50% 10,90% uncertain Handeni 1,20% 10,70% uncertain Kilindi 0,10% 12,50% uncertain Korogwe 0,20% 11,50% uncertain Lushoto 0,10% 10,10% uncertain Muheza 0,50% 9,50% uncertain Pangani 0,20% 23,40% very uncertain Tanga 0,00% 28,10% uncertain Zanzibar South and Central Kusini 0,00% 11,90% uncertain Zansibar Central 0,50% 3,90% moderately good Zanzibar West Magharibi 0,50% 2,90% moderately good Mjini 0,00% 5,60% moderately good ALL 4,80% 5,50% Developing subnational estimates of HIV prevalence and the number of people living with HIV 133
22 Guidance Please refer to the methodology note on Developing subnational estimates of HIV prevalence and the number of people living with HIV available on Data sources THMIS Tanzania 2011/12 ( UNAIDS estimates computed with Spectrum/EPP ( spectrumepp2013/) LandScan 2012 for global population distribution ( GADM for administrative boundaries ( Google Maps API for background layers ( Disclaimer The designation employed and the presentation of the material in this publication do not imply the expression of any opinion whatsoever on the part of UNAIDS concerning the legal status of any country, territory, city or area or of its authorities, or concerning the delimitation of its frontiers or boundaries. UNAIDS does not warrant that the information published in this publication is complete and correct and shall not be liable for any damages incurred as a result of its use. This report has been written for UNAIDS by Joseph Larmarange (IRD / Ceped) in July UNAIDS
23 The Joint United Nations Programme on HIV/AIDS (UNAIDS) leads and inspires the world to achieve its shared vision of zero new HIV infections, zero discrimination and zero AIDS-related deaths. UNAIDS unites the efforts of 11 UN organizations UNHCR, UNICEF, WFP, UNDP, UNFPA, UNODC, UN Women, ILO, UNESCO, WHO and the World Bank and works closely with global and national partners to maximize results for the AIDS response. Learn more at unaids.org and connect with us on Facebook and Twitter. Printed on FSC-certified paper
24 UNAIDS Joint United Nations Programme on HIV/AIDS UNHCR UNICEF WFP UNDP UNFPA UNODC UN WOMEN ILO UNESCO WHO WORLD BANK 20 Avenue Appia 1211 Geneva 27 Switzerland unaids.org
UNAIDS 2014 REFERENCE BURUNDI DEVELOPING SUBNATIONAL ESTIMATES OF HIV PREVALENCE AND THE NUMBER OF PEOPLE LIVING WITH HIV
 UNAIDS 2014 REFERENCE BURUNDI DEVELOPING SUBNATIONAL ESTIMATES OF HIV PREVALENCE AND THE NUMBER OF PEOPLE LIVING WITH HIV UNAIDS / JC2665E (English original, September 2014) Copyright 2014. Joint United
Partnering to Reach an AIDS Free Generation in Tanzania. RMO/DMO Meeting September 2015
 Partnering to Reach an AIDS Free Generation in Tanzania RMO/DMO Meeting September 2015 Ending AIDS Scenario: New HIV Infections Total number of people living with HIV/AIDS (PLWHA) 35M PLWHA 52M PLWHA 79M
The second indicator proportion of malaria cases in OPD is measured by dividing the number of malaria cases out of all visits done in the OPD.
 Routine- health-facility generated data provides three useful indicators to monitor the burden of malaria in the country: a) the annual malaria incidence per 1,000 population, b) the proportion of malaria
THE UNITED REPUBLIC OF TANZANIA MINISTRY OF HEALTH. Tanzania Mainland
 THE UNITED REPUBLIC OF TANZANIA MINISTRY OF HEALTH Tanzania Mainland National AIDS Control Programme HIV/AIDS/STI Surveillance Report January - December 2002 Report Number 17 Table of Contents Contents
TANZANIA HIV IMPACT SURVEY (THIS)
") summary sheet: preliminary findings DECEMBER 2017 TANZANIA HIV IMPACT SURVEY (THIS) 2016-2017 The Tanzania HIV Impact Survey (THIS), a householdbased national survey, was conducted between October 2016
summary sheet: preliminary findings DECEMBER 2017 TANZANIA HIV IMPACT SURVEY (THIS) 2016-2017 The Tanzania HIV Impact Survey (THIS), a householdbased national survey, was conducted between October 2016
CURRENT MALARIA SITUATION IN TANZANIA
 CURRENT MALARIA SITUATION IN TANZANIA According to Tanzania HIV and Malaria indicator survey (THMIS) 2011, Malaria prevalence has declined in Tanzania from 18% in 2007 to 10% in 2011. In addition, Malaria
Training of Trainers for IMCI and Family Planning in ADDOs, Districts of Mbeya, Singida, Lindi, and Coast Regions, Tanzania, July August 2009
 Training of Trainers for IMCI and Family Planning in ADDOs, Districts of Mbeya, Singida, Lindi, and Coast Regions, Tanzania, July August 2009 Dr. Suleiman Kimatta (SPS/MSH) Grace Mtawali (SPS, LMS/MSH)
ANGAZA ZAIDI Shedding More Light
 ANGAZA ZAIDI Shedding More Light best practices for hiv voluntary testing and counselling in tanzania United Republic of Tanzania Table of Contents Acronyms 2 Executive Summary 3 Angaza Zaidi Project Background
Tanzania Socio-Economic Database. Elide S Mwanri National Bureau of Statistics TANZANIA
 Tanzania Socio-Economic Database Elide S Mwanri National Bureau of Statistics TANZANIA 1 Presentation About TSED How we can make use of Indicators Examples of some MKUKUTA/MDGs indicators Challenges and
ATTITUDES RELATING TO HIV/AIDS 5
 ATTITUDES RELATING TO HIV/AIDS 5 5.1 KEY FINDINGS Tanzanian adults generally have accepting attitudes towards those living with HIV/AIDS, with a majority expressing acceptance on each of the four main
HIV/ AIDS Care and treatment services in Tanzania
 United Republic of Tanzania Bonita Kilama, National AIDS Control Program HIV/ AIDS Care and treatment services in Tanzania Study Documentation January 13, 2015 Metadata Production Metadata Producer(s)
HIV/AIDS-RELATED KNOWLEDGE 4
 HIV/AIDS-RELATED KNOWLEDGE 4 4.1 KEY FINDINGS Over 99 percent Tanzanians age 15-49 have heard HIV/AIDS. Awareness the modes HIV transmission is high, with almost 90 percent adults knowing that having only
Copyright 2011 Joint United Nations Programme on HIV/AIDS (UNAIDS) All rights reserved ISBN
 All rights reserved ISBN") UNAIDS DATA TABLES 2011 Copyright 2011 Joint United Nations Programme on HIV/AIDS (UNAIDS) All rights reserved ISBN 978-92-9173-945-5 UNAIDS / JC2225E The designations employed and the presentation of
UNAIDS DATA TABLES 2011 Copyright 2011 Joint United Nations Programme on HIV/AIDS (UNAIDS) All rights reserved ISBN 978-92-9173-945-5 UNAIDS / JC2225E The designations employed and the presentation of
Tanzania. Tanzania HIV/AIDS. Indicator Survey. National Bureau of Statistics. Tanzania. Commission for AIDS
 Tanzania HIV/AIDS 2003 04 Indicator Survey Tanzania Commission for AIDS National Bureau of Statistics Tanzania Tanzania HIV/AIDS Indicator Survey 2003-04 Tanzania Commission for AIDS Dar es Salaam, Tanzania
Improving Efficiency in Health Washington, D.C. 3 February 2016
 HIV Resource Allocation using the Goals Model John Stover Adebiyi Adesina, Lori Bollinger, Rudolph Chandler, Eline Korenromp, Guy Mahiane, Carel Pretorius, Rachel Sanders, Peter Stegman, Michel Tcheunche,
The role of mass media in disease outbreak reporting in the United Republic of Tanzania
 Tanzania Health Research Bulletin (2004), Vol. 6, No. 2 73 The role of mass media in disease outbreak reporting in the United Republic of Tanzania L.E.G. MBOERA & S.F. RUMISHA National Institute for Medical
Biomedical, Behavioral, and Socio-Structural Risk Factors on HIV Infection and Regional Differences in Tanzania
 Biomedical, Behavioral, and Socio-Structural Risk Factors on HIV Infection and Regional Differences in Tanzania Suzumi Yasutake, PhD Johns Hopkins Bloomberg School of Public Health Deanna Kerrigan, PhD
Rapid Scale-Up of PMTCT Service Provision Using a District Approach
 Tanzania Ministry of Health and Social Welfare Rapid Scale-Up of PMTCT Service Provision Using a District Approach The Tanzania Experience National AIDS Control Program Tanzania U.S. Agency for International
Prepared by Tanzania Media Women s Association (TAMWA)
") Prepared by Tanzania Media Women s Association (TAMWA) P. O Box 8981, Sinza Mori, Dar es Salaam Tanzania Telephone: +255 22 2772681, E-mail: tamwa@tamwa.org, Website: www.tamwa.org 1 P a g e TABLE OF CONTENT
Prepared by Tanzania Media Women s Association (TAMWA) P. O Box 8981, Sinza Mori, Dar es Salaam Tanzania Telephone: +255 22 2772681, E-mail: tamwa@tamwa.org, Website: www.tamwa.org 1 P a g e TABLE OF CONTENT
Six things you need to know
 UNAIDS Report 2010 MDG 6 Six things you need to know about the AIDS response today UNAIDS Report 2010 MDG 6 Six things you need to know about the AIDS response today MDG6: Combat HIV/AIDS, Malaria and
Delivering an AIDS-free Generation
 PEPFAR Delivering an AIDS-free Generation Ambassador Deborah L. Birx, M.D. U.S. Global AIDS Coordinator Department of State June 23, 2014 Kaiser Family Foundation Town Hall Forum History of the Epidemic
In 2013, around 12.9 million people living with HIV had access to antiretroviral therapy.
 F A C T S H E E T 2014 GLOBAL STATISTICS People living with HIV In 2013, there were 35 [33.2 37.2 ] people living with HIV. - Since the start of the epidemic, around 78 [71 87 ] people have become infected
Tuberculosis-related deaths in people living with HIV have fallen by 36% since 2004.
 F A C T S H E E T 2014 GLOBAL STATISTICS People living with HIV In 2013, there were 35 [33.2 37.2 ] people living with HIV. - Since the start of the epidemic, around 78 [71 87 ] people have become infected
UNAIDS 2013 AIDS by the numbers
 UNAIDS 2013 AIDS by the numbers 33 % decrease in new HIV infections since 2001 29 % decrease in AIDS-related deaths (adults and children) since 2005 52 % decrease in new HIV infections in children since
GLOBAL STATISTICS FACT SHEET 2015
 FACT SHEET 2015 GLOBAL STATISTICS 15.8 people accessing antiretroviral therapy (June 2015) 36.9 [34.3 41.4 ] people globally were living with HIV (end 2014) 2 [1.9 2.2 ] people became newly infected with
Equatorial Guinea. Epidemiological Fact Sheet on HIV and AIDS Update. July 2008 / Version 0.1 beta. Core data on epidemiology and response
 Epidemiological Fact Sheet on HIV and AIDS Core data on epidemiology and response Equatorial Guinea 2008 Update July 2008 / Version 0.1 beta 29/07/08 1 (WHO/Second Generation Surveillance on HIV/AIDS,
2004 Update. Luxembourg
 2004 Update Luxembourg 2 Luxembourg HIV/AIDS estimates In 2003 and during the first quarter of 2004, UNAIDS and WHO worked closely with national governments and research institutions to recalculate current
Annual report for 2016
 The United Republic of Tanzania Ministry Of Health Community Development, Gender, Elderly and Children The National Tuberculosis and leprosy Programme National TB and Leprosy Programme (NTLP) Department
Q&A on HIV/AIDS estimates
 Q&A on HIV/AIDS estimates 07 Last updated: November 2007 Understanding the latest estimates of the 2007 AIDS Epidemic Update Part one: The data 1. What data do UNAIDS and WHO base their HIV prevalence
THE GAP REPORT 2014 PRisOnERs
 THE GAP REPORT 2014 Prisoners Every year, 30 million people spend time in prisons or closed settings (1) and 10 million are incarcerated at any given point in time (2). Virtually all will return to their
NATIONAL HIV AND AIDS RESPONSE REPORT 2010 FOR TANZANIA MAINLAND
 THE UNITED REPUBLIC OF TANZANIA PRIME MINISTER S OFFICE Tanzania Commission for AIDS (TACAIDS) NATIONAL HIV AND AIDS RESPONSE REPORT 2010 FOR TANZANIA MAINLAND AUGUST 2011 1 2 THE UNITED REPUBLIC OF TANZANIA
2013 progress report on the Global Plan
 2013 progress report on the Global Plan towards the elimination of new HIV infections among children by 2015 and keeping their mothers alive 210 000 the number of new HIV infections among children in (21
The United Republic of Tanzania
 The United Republic of Tanzania Ministry Of Health Community Development, Gender, Elderly and Children National Tuberculosis and leprosy Programme, Annual report for 2014 National TB and Leprosy Programme
Spectrum. Quick Start Tutorial
 Spectrum Quick Start Tutorial March 2005 Table of Contents Introduction... 2 What you will learn... 4 Basic Steps in Using Spectrum... 4 Step 1. Installing Spectrum... 4 Step 2. Changing the language in
Epidemiological Fact Sheet on HIV and AIDS. Core data on epidemiology and response. Costa Rica Update. July 2008 / Version 0.
 Epidemiological Fact Sheet on HIV and AIDS Core data on epidemiology and response Costa Rica 2008 Update July 2008 / Version 0.1 beta 29/07/08 1 (WHO/Second Generation Surveillance on HIV/AIDS, Contract
World Food Programme (WFP)
") UNAIDS 2016 REPORT World Food Programme (WFP) Unified Budget Results and Accountability Framework (UBRAF) 2016-2021 2 Contents Achievements 2 Introduction 2 Innovative testing strategies 2 Access to treatment
UNAIDS 2016 REPORT World Food Programme (WFP) Unified Budget Results and Accountability Framework (UBRAF) 2016-2021 2 Contents Achievements 2 Introduction 2 Innovative testing strategies 2 Access to treatment
HIV AND AIDS RELATED STIGMA & DISCRIMINATION (S&D)
") HIV AND AIDS RELATED STIGMA & DISCRIMINATION (S&D) A critical Challenge for HIV & AIDS Programming in Tanzania By Dr. Subilaga K. Kaganda, TACAIDS UDSM 24 September, 2014 Outline: Global Commitments &
HIV AND AIDS RELATED STIGMA & DISCRIMINATION (S&D) A critical Challenge for HIV & AIDS Programming in Tanzania By Dr. Subilaga K. Kaganda, TACAIDS UDSM 24 September, 2014 Outline: Global Commitments &
HIV Prevalence Estimates from the Demographic and Health Surveys. Updated July 2012
 HIV Prevalence Estimates from the Demographic and Health Surveys Updated July 2012 This report summarizes the HIV prevalence estimates provided by the MEASURE Demographic and Health Surveys (DHS) project.
Primary and Secondary Infertility in Tanzania
 Abstract Primary and Secondary Infertility in Tanzania Ulla Larsen The trend and predictors of infertility are not well known in sub-saharan Africa. A nationally representative Demographic and Health Survey
2004 Update. Seychelles
 2004 Update Seychelles 2 Seychelles HIV/AIDS estimates In 2003 and during the first quarter of 2004, UNAIDS and WHO worked closely with national governments and research institutions to recalculate current
511,000 (57% new cases) ~50,000 ~30,000
 ~50,000 ~30,000") Latest global TB estimates - 2007 (Updated Mar 2009) All forms of TB Greatest number of cases in Asia; greatest rates per capita in Africa Multidrug-resistant TB (MDR-TB) Estimated number of cases 9.27
Latest global TB estimates - 2007 (Updated Mar 2009) All forms of TB Greatest number of cases in Asia; greatest rates per capita in Africa Multidrug-resistant TB (MDR-TB) Estimated number of cases 9.27
Adult rate (%) 0.1 Low estimate. 0.0 High estimate 0.2
 0.1 Low estimate. 0.0 High estimate 0.2") 2004 Update Fiji 2 Fiji HIV/AIDS estimates In 2003 and during the first quarter of 2004, UNAIDS and WHO worked closely with national governments and research institutions to recalculate current estimates
2004 Update Fiji 2 Fiji HIV/AIDS estimates In 2003 and during the first quarter of 2004, UNAIDS and WHO worked closely with national governments and research institutions to recalculate current estimates
PROGRESS REPORT ON THE ROAD MAP FOR ACCELERATING THE ATTAINMENT OF THE MILLENNIUM DEVELOPMENT GOALS RELATED TO MATERNAL AND NEWBORN HEALTH IN AFRICA
 5 July 2011 REGIONAL COMMITTEE FOR AFRICA ORIGINAL: ENGLISH Sixty-first session Yamoussoukro, Côte d Ivoire, 29 August 2 September 2011 Provisional agenda item 17.1 PROGRESS REPORT ON THE ROAD MAP FOR
2004 Update. Serbia and Montenegro
 2004 Update Serbia and Montenegro 2 Serbia and Montenegro HIV/AIDS estimates In 2003 and during the first quarter of 2004, UNAIDS and WHO worked closely with national governments and research institutions
2004 Update. Mauritius
 24 Update Mauritius 2 Mauritius HIV/AIDS estimates In 23 and during the first quarter of 24, UNAIDS and WHO worked closely with national governments and research institutions to recalculate current estimates
HIV Prevalence Estimates
 HIV Prevalence Estimates from the Demographic and Health Surveys Updated June 2010 This reports summarizes the HIV prevalence estimates provided in MEASURE Demographic and Health Surveys. The MEASURE DHS
Gender inequality and genderbased
 UNAIDS 2016 REPORT Gender inequality and genderbased violence UBRAF 2016-2021 Strategy Result Area 5 2 Contents Achievements 2 Women and girls 2 Gender-based violence 6 Challenges 7 Key future actions
HIV/AIDS estimates. UNAIDS/WHO Working Group on Global HIV/AIDS and STI Surveillance. UNAIDS/WHO Epidemiological Fact Sheet Update.
 24 Update Bhutan 2 Bhutan HIV/AIDS estimates In 23 and during the first quarter of 24, UNAIDS and WHO worked closely with national governments and research institutions to recalculate current estimates
Supplemental Digital Content
 Supplemental Digital Content 1 Methodology for estimating the contribution of identifiable HIV incidence among stable HIV-1 sero-discordant couples to total HIV population-level incidence We based our
2004 Update. Georgia
 24 Update Georgia 2 Georgia HIV/AIDS estimates In 23 and during the first quarter of 24, UNAIDS and WHO worked closely with national governments and research institutions to recalculate current estimates
THE UNITED REPUBLIC OF TANZANIA September 2017
 THE UNITED REPUBLIC OF TANZANIA HEALTH DATA COLLABORATIVE (THDC) LAUNCH MEETING Update of M&E Strengthening Initiatives (M&E SI) A Tanzanian Platform for Health Information and Accountability 11-12 September
Women & Men intanzania
 Women & Men intanzania FACTS AND FIGURES 2017 Women & Men in Tanzania FACTS AND FIGURES 2017 Contents Page ABBREVIATION... iv PREFACE... v ACKNOWLEDGEMENT... vi CHAPTER ONE... 1 Introduction... 1 1.1 Situational
Adult rate (%) 0.1 Low estimate. 0.0 High estimate 0.2
 0.1 Low estimate. 0.0 High estimate 0.2") 2004 Update Sweden 2 Sweden HIV/AIDS estimates In 2003 and during the first quarter of 2004, UNAIDS and WHO worked closely with national governments and research institutions to recalculate current estimates
2004 Update Sweden 2 Sweden HIV/AIDS estimates In 2003 and during the first quarter of 2004, UNAIDS and WHO worked closely with national governments and research institutions to recalculate current estimates
2004 Update. Hungary
 24 Update Hungary 2 Hungary HIV/AIDS estimates In 23 and during the first quarter of 24, UNAIDS and WHO worked closely with national governments and research institutions to recalculate current estimates
2004 Update. Suriname
 2004 Update Suriname 2 Suriname HIV/AIDS estimates In 2003 and during the first quarter of 2004, UNAIDS and WHO worked closely with national governments and research institutions to recalculate current
Trends in HIV/AIDS epidemic in Asia, and its challenge. Taro Yamamoto Institute of Tropical Medicine Nagasaki University
 Trends in HIV/AIDS epidemic in Asia, and its challenge Taro Yamamoto Institute of Tropical Medicine Nagasaki University Millennium Development Goals Goal 1. Eradicate extreme poverty and hunger Goal 2.
Bayesian melding for estimating uncertainty in national HIV prevalence estimates
 Bayesian melding for estimating uncertainty in national HIV prevalence estimates Leontine Alkema, Adrian E. Raftery and Tim Brown 1 Working Paper no. 82 Center for Statistics and the Social Sciences University
THE UNITED REPUBLIC OF TANZANIA MINISTRY OF HEALTH AND SOCIAL WELFARE NATIONAL TUBERCULOSIS AND LEPROSY PROGRAMME ANNUAL REPORT 2010
 THE UNITED REPUBLIC OF TANZANIA MINISTRY OF HEALTH AND SOCIAL WELFARE NATIONAL TUBERCULOSIS AND LEPROSY PROGRAMME ANNUAL REPORT 2010 National TB and Leprosy Programme Ministry of Health and Social Welfare
In 1993 and 1996, 1 percent of IV drug users tested were positive. In 2000, 193 injecting drug users were screened and none tested positive.
 24 Update Kuwait 2 Kuwait HIV/AIDS estimates In 23 and during the first quarter of 24, UNAIDS and WHO worked closely with national governments and research institutions to recalculate current estimates
2004 Update. Maldives
 2004 Update Maldives 2 Maldives HIV/AIDS estimates In 2003 and during the first quarter of 2004, UNAIDS and WHO worked closely with national governments and research institutions to recalculate current
2004 Update. Eritrea
 2004 Update Eritrea 2 Eritrea HIV/AIDS estimates In 2003 and during the first quarter of 2004, UNAIDS and WHO worked closely with national governments and research institutions to recalculate current estimates
Regional Consultation on Nutrition and HIV/AIDS in French Speaking Countries in Africa Region
 Regional Consultation on Nutrition and HIV/AIDS in French Speaking Countries in Africa Region Evidence, lessons and recommendations for action Ouagadougou, Burkina Faso 17-20 November 2008 CONCEPT PAPER
2004 Update. Bahrain
 24 Update Bahrain 2 Bahrain HIV/AIDS estimates In 23 and during the first quarter of 24, UNAIDS and WHO worked closely with national governments and research institutions to recalculate current estimates
2004 Update. Lebanon
 24 Update Lebanon 2 Lebanon HIV/AIDS estimates In 23 and during the first quarter of 24, UNAIDS and WHO worked closely with national governments and research institutions to recalculate current estimates
Serving Communities, Improving Lives
 Serving Communities, Improving Lives T-MARC TANZANIA ANNUAL REPORT - 2012 About T-MARC Tanzania T-MARC Tanzania is an independent, Tanzanian, not for profit, non-governmental organization (NGO) working
MONITORING HEALTH INEQUALITY
 MONITORING HEALTH INEQUALITY An essential step for achieving health equity ILLUSTRATIONS OF FUNDAMENTAL CONCEPTS The examples in this publication draw from the topic of reproductive, maternal and child
2004 Update. Syrian Arab Republic
 24 Update Syrian Arab Republic 2 Syrian Arab Republic HIV/AIDS estimates In 23 and during the first quarter of 24, UNAIDS and WHO worked closely with national governments and research institutions to recalculate
Ending the AIDS Epidemic in Adolescents
 Ending the AIDS Epidemic in Adolescents Eastern and Southern Africa Regional Update on the ALL IN Overview 13 October 2015 AIDS-related deaths has declined for all age groups Except adolescents! Eastern
HIV Prevalence Estimates. from the Demographic and Health Surveys
 HIV Prevalence Estimates from the Demographic and Health Surveys This reports summarizes the HIV prevalence estimates provided in MEASURE Demographic and Health Surveys. The MEASURE DHS project is implemented
"The content of this publication is the sole responsibility of the National Bureau of Statistics Service, Dar es Salaam, Tanzania and can in no way
 "The content of this publication is the sole responsibility of the National Bureau of Statistics Service, Dar es Salaam, Tanzania and can in no way be taken to reflect the views of the European Union".
2004 Update. Armenia
 24 Update Armenia 2 Armenia HIV/AIDS estimates In 23 and during the first quarter of 24, UNAIDS and WHO worked closely with national governments and research institutions to recalculate current estimates
2004 Update. Barbados
 2004 Update Barbados 2 Barbados HIV/AIDS estimates In 2003 and during the first quarter of 2004, UNAIDS and WHO worked closely with national governments and research institutions to recalculate current
Health situation analysis in the African Region. Basic indicators 2006
 Health situation analysis in the African Region Basic indicators 2006 Health situation analysis in the African Region Basic indicators 2006 World Health Organization. Regional Office for Africa, 2006
2006 Update. Brunei Darussalam
 2006 Update Brunei Darussalam December 2006 HIV/AIDS estimates The estimates and data provided in the following tables relate to 2005 unless stated otherwise. These estimates have been produced and compiled
Working Papers du CEPED
 juin 2009 03 Working Papers du CEPED Estimating effect of non response on HIV prevalence estimates from Demographic and Health Surveys Joseph Larmarange, Roselyne Vallo, Seydou Yaro, Philippe Msellati,
The United Republic of Tanzania NATIONAL AIDS CONTROL PROGRAMME (NACP) CONSENSUS ESTIMATES ON KEY POPULATION SIZE AND HIV PREVALENCE IN TANZANIA
 CONSENSUS ESTIMATES ON KEY POPULATION SIZE AND HIV PREVALENCE IN TANZANIA") The United Republic of Tanzania NATIONAL AIDS CONTROL PROGRAMME (NACP) CONSENSUS ESTIMATES ON KEY POPULATION SIZE AND HIV PREVALENCE IN TANZANIA July 2014 Published in 2014 Ministry of Health and Social
The United Republic of Tanzania NATIONAL AIDS CONTROL PROGRAMME (NACP) CONSENSUS ESTIMATES ON KEY POPULATION SIZE AND HIV PREVALENCE IN TANZANIA July 2014 Published in 2014 Ministry of Health and Social
Demographic and Health Survey Key Findings
 Tanzania 2004-05 Demographic and Health Survey Key Findings This report summarizes the findings of the 2004-05 Tanzania Demographic and Health Survey (2004-05 TDHS), carried out by the Tanzania National
Expert Group Meeting on Strategies for Creating Urban Youth Employment: Solutions for Urban Youth in Africa
 Expert Group Meeting on Strategies for Creating Urban Youth Employment: Solutions for Urban Youth in Africa Measurement/indicators of youth employment Gora Mboup Global Urban Observatory (GUO) UN-HABITAT
HIV/AIDS estimates. UNAIDS/WHO Working Group on Global HIV/AIDS and STI Surveillance. UNAIDS/WHO Epidemiological Fact Sheet Update.
 2004 Update Yemen 2 Yemen HIV/AIDS estimates In 2003 and during the first quarter of 2004, UNAIDS and WHO worked closely with national governments and research institutions to recalculate current estimates
Ouagadougou Declaration
 Ouagadougou Declaration on Primary Health Care and Health Systems in Africa: Achieving Better Health for Africa in the New Millennium A declaration by the Members States of the WHO African Region 30 April
TANZANIA. Assessment of the Epidemiological Situation and Demographics
 Estimated percentage of adults living with HIV/AIDS, end of 2001 These estimates include all people with HIV infection, whether or not they have developed symptoms of AIDS, alive at the end of 2001: 7.8%
MONITORING THE IMPACT OF THE HIV EPIDEMIC USING POPULATION-BASED SURVEYS
 UNAIDS/WHO WORKING GROUP ON GLOBAL HIV/AIDS AND STI SURVEILLANCE 2015 REFERENCE MONITORING THE IMPACT OF THE HIV EPIDEMIC USING POPULATION-BASED SURVEYS Copyright 2015 Joint United Nations Programme on
HPP GeoHealth MAPPING
 August 2015 HPP GeoHealth MAPPING Using Geospatial Analysis to Understand the Local HIV Epidemic in KwaZuluNatal Province and ethekwini Municipality in South Africa This publication was prepared by Ian
UPDATE UNAIDS 2016 DATE 2016
 GLOBAL AIDS UP GLOBAL AIDS UPDATE UNAIDS 2016 DATE 2016 ENORMOUS GAINS, PERSISTENT CHALLENGES The world has committed to ending the AIDS epidemic by 2030. How to reach this bold target within the Sustainable
2004 Update. Belarus
 24 Update Belarus 2 Belarus HIV/AIDS estimates In 23 and during the first quarter of 24, UNAIDS and WHO worked closely with national governments and research institutions to recalculate current estimates
UNAIDS Technical Support Division of Labour. Summary & Rationale
 UNAIDS Technical Support Division of Labour Summary & Rationale UNAIDS (English original, August 2005) Joint United Nations Programme on HIV/AIDS (UNAIDS) 2005. All rights reserved. Publications produced
HIV PREVENTION, DIAGNOSIS, TREATMENT AND CARE FOR KEY POPULATIONS
 POLICY BRIEF HIV PREVENTION, DIAGNOSIS, TREATMENT AND CARE FOR KEY POPULATIONS CONSOLIDATED GUIDELINES JULY 2014 Policy brief: Consolidated guidelines on HIV prevention, diagnosis, treatment and care for
2. Treatment coverage: 3. Quality of care: 1. Access to diagnostic services:
 The theme for World TB Day 2014 is Reach the missed 3 million. Every year 3 million people who fall ill with TB are missed by health systems and do not always get the TB services that they need and deserve.
Strengthening HIV Programmes for Adolescents. Early Lessons from Adolescent Assessments to Guide Fast Tracking of Adolescent Responses through
 Strengthening HIV Programmes for Adolescents Early Lessons from Adolescent Assessments to Guide Fast Tracking of Adolescent Responses through Partners to Acknowledge UNAIDS UNDP UNFPA UNESCO UN Women ILO
Main global and regional trends
 I N T R O D U C T I O N Main global and regional trends Promising developments have been seen in recent years in global efforts to address the AS epidemic, including increased access to effective treatment
We can prevent mothers from dying and babies from becoming infected with HIV
 We can prevent mothers from dying and babies from becoming infected with HIV Joint Action for Results UNAIDS Outcome Framework: Business Case 2009 2011 Cover photo: UNAIDS / P. Virot UNAIDS / JC1965E (English
2004 Update. Croatia
 2004 Update Croatia 2 Croatia HIV/AIDS estimates In 2003 and during the first quarter of 2004, UNAIDS and WHO worked closely with national governments and research institutions to recalculate current estimates
PROGRESS REPORT ON CHILD SURVIVAL: A STRATEGY FOR THE AFRICAN REGION. Information Document CONTENTS
 29 June 2009 REGIONAL COMMITTEE FOR AFRICA ORIGINAL: ENGLISH Fifty-ninth session Kigali, Republic of Rwanda, 31 August 4 September 2009 Provisional agenda item 9.2 PROGRESS REPORT ON CHILD SURVIVAL: A
HIV/AIDS estimates. UNAIDS/WHO Working Group on Global HIV/AIDS and STI Surveillance. UNAIDS/WHO Epidemiological Fact Sheet Update.
 24 Update Iraq 2 Iraq HIV/AIDS estimates In 23 and during the first quarter of 24, UNAIDS and WHO worked closely with national governments and research institutions to recalculate current estimates on
SGCEP SCIE 1121 Environmental Science Spring 2012 Section Steve Thompson:
 SGCEP SCIE 1121 Environmental Science Spring 2012 Section 20531 Steve Thompson: steventhompson@sgc.edu http://www.bioinfo4u.net/ 1 First, a brief diversion... Into... how to do better on the next exam,
UNFPA SDG indicator custodianship
 UNFPA SDG indicator custodianship Presentation to the Expert meeting of the IAEG-SDG Working Group on Geospatial Information Session 5 7 December 2017 Alfredo L. Fort, MD PhD Senior M&E Advisor Population
EPIDEMIOLOGY AND RISK FACTORS OF HIV INFECTION AMONG URBAN WOMEN IN TANZANIA: EVIDENCES FROM TANZANIA HIV/AIDS
 7 th African Population Conference EPIDEMIOLOGY AND RISK FACTORS OF HIV INFECTION AMONG URBAN WOMEN IN TANZANIA: EVIDENCES FROM TANZANIA HIV/AIDS 2011-12 Rakesh Kumar Singh 1 ABSTRACT The present study
Tanzania Country Report FY14
 USAID ASSIST Project Tanzania Country Report FY14 Cooperative Agreement Number: AID-OAA-A-12-00101 Performance Period: October 1, 2013 September 30, 2014 DECEMBER 2014 This annual country report was prepared
THE GAP REPORT 2014 DisPlAcED PERsOns
 THE GAP REPORT 2014 Displaced Persons The forcible displacement of people through conflict or disaster is associated with increased food insecurity, the destruction of livelihoods and resulting poverty.
THE FUTURE OF ADULT MORTALITY UNDER THE AIDS THREAT: ESTIMATING AND PROJECTING INCIDENCE; PROJECTING MORTALITY WITH HIV/AIDS *
 UN/POP/MORT/2003/11 2 September 2003 ENGLISH ONLY WORKSHOP ON HIV/AIDS AND ADULT MORTALITY IN DEVELOPING COUNTRIES Population Division Department of Economic and Social Affairs United Nations Secretariat