Nature Neuroscience: doi: /nn Supplementary Figure 1. MADM labeling of thalamic clones.
|
|
|
- Sarah Stevenson
- 5 years ago
- Views:
Transcription
 Confocal images of an E12 Nestin-CreERT2;Ai9-tdTomato brain treated with TM at E10 and")
1 Supplementary Figure 1 MADM labeling of thalamic clones. (a) Confocal images of an E12 Nestin-CreERT2;Ai9-tdTomato brain treated with TM at E10 and stained for BLBP (green), a radial glial
2 progenitor-specific marker, tdtomato (red), and OLIG3 (white), and with DAPI (blue). A schematic of brain structures is shown at the top. Note that BLBP-expressing radial glial progenitors in the developing thalamus marked by OLIG3 expression are labeled by tdtomato upon TM treatment, indicating that CreER T2 is expressed in thalamic radial glial progenitors in the Nestin-CreER T2 mouse line. Scale bar: 100 m. (b) Schematic of MADM labeling. (c) Experimental paradigm of MADM-based clonal analysis. (d) Confocal images of an E12 brain treated with TM at E10 and stained for EGFP (green) and tdtomato (red), and with DAPI (blue). High magnification image of a G 2-Z yellow clone in the thalamus (boxed area) is shown to the right. Arrows indicate bipolar radial glial progenitors, arrowheads indicate the progeny, open arrowheads indicate the radial glial fibers, and the asterisk indicates the ventricular endfoot. Scale bars: 100 m and 20 m.

3 Supplementary Figure 2 Cre recombinase dependent retroviral labeling of thalamic clones. (a) Confocal image of a P21 Olig3-Cre;Ai9-tdTomato brain stained for tdtomato (red) and with DAPI (blue). Note the specific expression of tdtomato in the thalamus and thalamocortical projections. Scale bar: 500 m. (b) Confocal image of an E15 Olig3-Cre brain injected with low titer Cre recombinase-dependent retrovirus expressing EGFP at E11 and stained for EGFP (green) and with DAPI (blue). Note two radial clonal clusters in the developing thalamus (broken line). High magnification image of a clone (boxed area) is shown at the bottom. The arrow indicates the bipolar radial glial progenitor and arrowheads indicate the progeny that are radially arrayed along the radial glial fiber (open arrowheads). Another labeled clonal cluster is located ventrally. Scale bars: 200 m and 50 m. TC, thalamocortical.
4
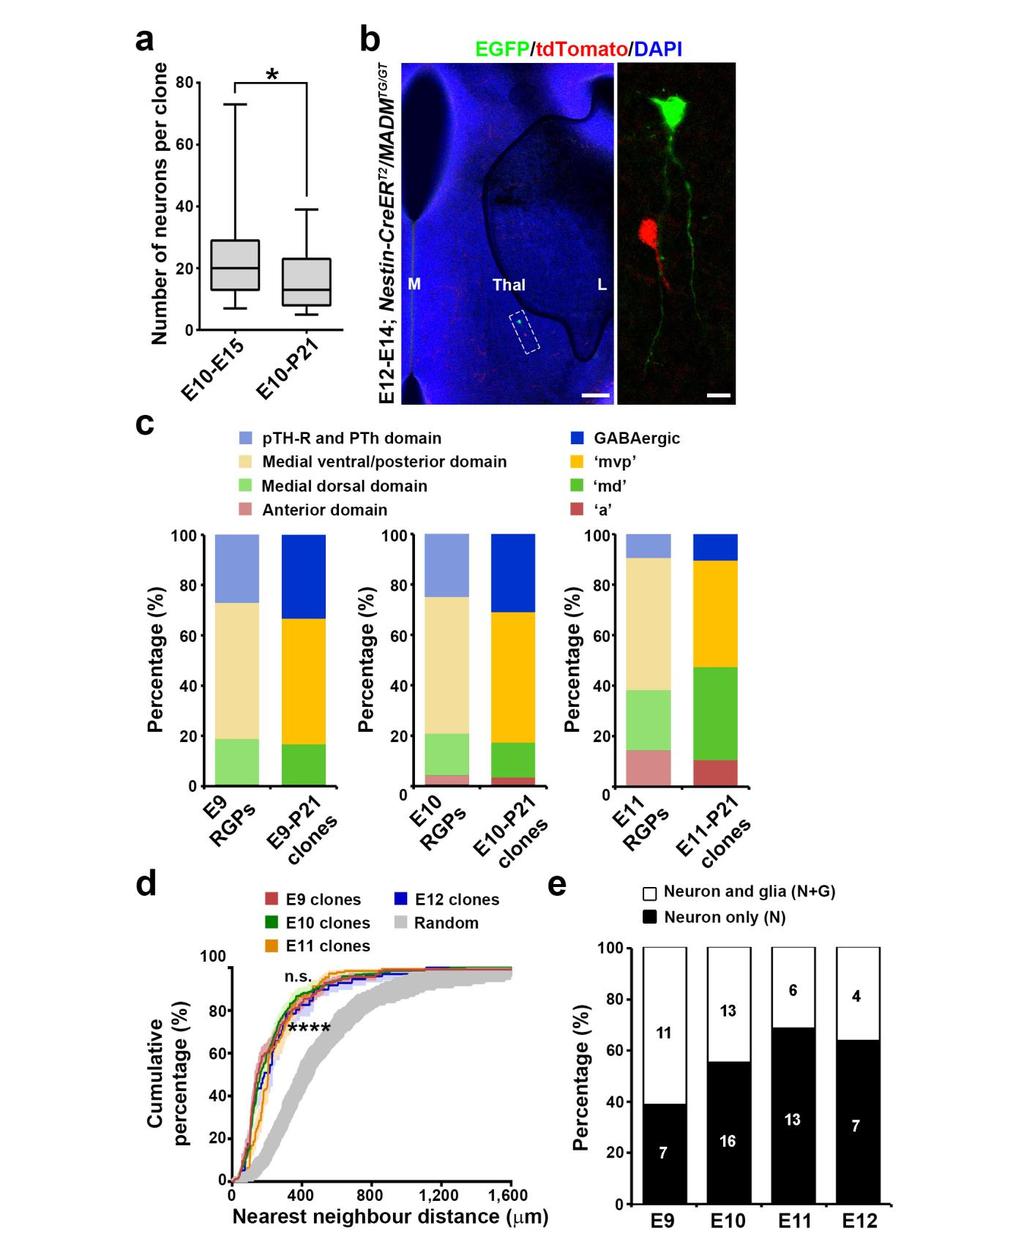
5 Supplementary Figure 3 Correlated localization of MADM-labeled RGPs at the embryonic stage and clones at the more mature stage. (a) Quantification of the average number of neurons in clones labeled at E10 and examined at E15 or P21 (E10-15, n=23; E10-P21, n=23). Data are presented as median with interquartile range and whiskers are the minimum and maximum. *, p=0.03 (Mann- Whitney test). (b) Confocal images of an E14 MADM-labeled thalamus treated with TM at E12 and stained for EGFP (green) and tdtomato (red), and with DAPI (blue). A two-cell local cluster without any radial glial progenitors (boxed area) is labeled in the developing thalamus. High magnification image is shown to the right. M, medial; L, lateral. Scale bars: 100 m and 10 m. (c) Quantification of the localizations of MADM-labeled RGPs at the embryonic stage and clones at the more mature stage. Note a clear correlation between the localizations of labeled progenitor cells and labeled clones at different embryonic stages. pth-r: rostral progenitor domain of the thalamus; PTh: prethalamus. (d) NND analysis of clones labeled at different embryonic stages. Note that the cumulative frequency of NND of clones labeled at E9 (red, n=18), E10 (green, n=28), E11 (orange, n=19), and E12 (blue, n=11) is similar and significantly leftshifted than that of random simulated dataset (gray). Data are presented as mean±s.e.m. n.s., not significant; ****, p=1x10 15 (unpaired t test with Welch's correction). (e) Quantification of the fraction of clones containing neurons only (N) or neurons and glia (N+G) at different embryonic stages.
6
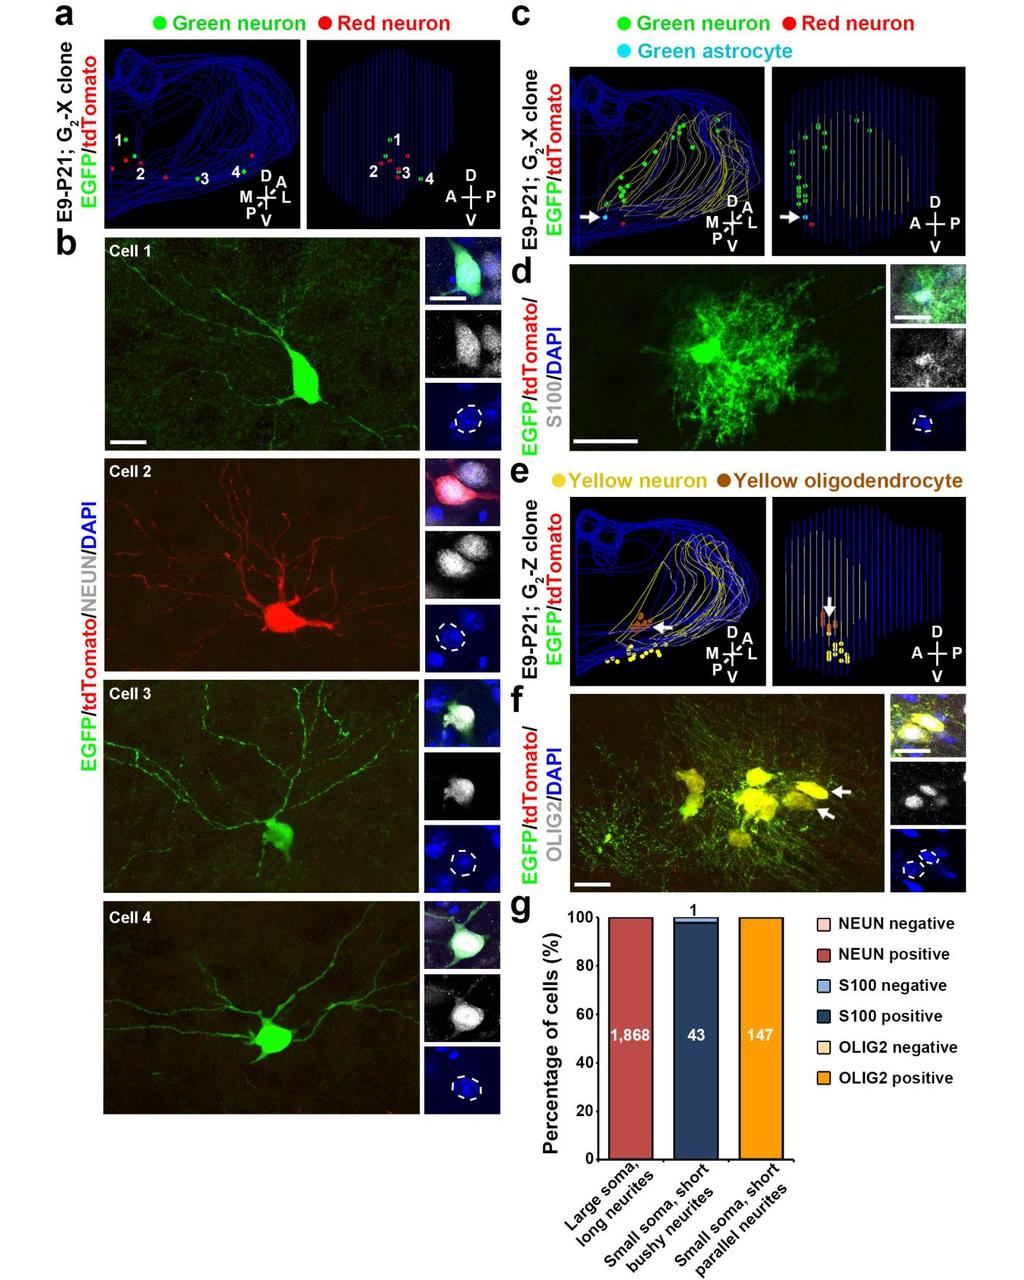
7 Supplementary Figure 4 Distinct morphological features of excitatory neurons, astrocytes, and oligodendrocytes in the thalamus. (a, b) Representative 3D projection (a) and confocal (b) images of a G 2-X clone (green and red) in the thalamus labeled at E9, and immunostained for neuronal marker NEUN (white) and counterstained with DAPI (blue) at P21. High magnification images of the somas of four cells are shown to the right in b. Broken line circles indicate the nuclei. Scale bars: 20 m and 20 m. (c, d) Representative 3D projection (c) and confocal (d) images of a G 2-X thalamic clone (green and red) occupying TRN (contoured in yellow lines) and ZI labeled at E9, and immunostained for astrocyte marker S100 (white), and counterstained with DAPI (blue) at P21. High magnification images of the soma of the astrocyte are shown to the right in d. The broken line circle indicates the nucleus. Scale bars: 20 m and 20 m. (e, f) Representative 3D projection (e) and confocal (f) images of a G 2-Z thalamic clone (yellow) occupying TRN (contoured in yellow lines) and ZI labeled at E9, and immunostained for oligodendrocyte marker OLIG2 (white), and counterstained with DAPI (blue) at P21. High magnification images of the somas of two oligodendrocytes (arrows) are shown to the right in e. Broken line circles indicate the nuclei. Note the labeled oligodendrocytes possess characteristic short parallel neurites. Scale bars: 20 m and 20 m. (g) Quantification of the fraction of labeled cells with a large soma/nucleus and long neurites or a small soma/nucleus and short bushy or parallel neurites that are positive for NEUN, S100, or OLIG2, respectively.
 Aligned single coronal sections from 34 experimental brains (gray outlines) in the position corresponding to ABA section 69. Red lines indicate 6 line profiles used to calculate thalamus edge (i.")
8 Supplementary Figure 5 Alignment of the experimental thalamus with the ABA reference thalamus. (a) Aligned single coronal sections from 34 experimental brains (gray outlines) in the position corresponding to ABA section 69. Red lines indicate 6 line profiles used to calculate thalamus edge (i.e. border) variability. D, dorsal; V, ventral. (b) Thalamus border variability for the section in a (n=45). (c) Average border variability for 5 sections along the anterior to posterior axis (n=45). (d) Aligned 3D reference ABA thalamus after normalization (red) with the average experimental thalamus (blue). (e) Percentage of volume overlap between reference ABA thalamus and individual experimental thalami (n=45). Data in b, c and r are presented as median with interquartile range, and whiskers are the minimum and maximum.
 3D reconstructed images of a G 2-X clone containing 7 labeled neurons in the TRN contoured by")
9 Supplementary Figure 6 Inhibitory interneuron clones in TRN. (a) 3D reconstructed images of a G 2-X clone containing 7 labeled neurons in the TRN contoured by yellow lines. (b) High magnification
10 cross-section confocal images of the 7 labeled neurons stained for parvalbumin (PV, white), a GABAergic interneuron-specific marker. Note that all 7 neurons are positive for PV, indicating their interneuron identity. Scale bar: 10 m. (c) Quantification of the average number of neurons in the four clonal clusters ('mvp', n=33; 'a', n=9; 'md', n=18; 'GABAergic', n=17). Data are presented as median with interquartile range, and whiskers are the minimum and maximum. **, p=0.005 ( mvp versus a, MannWhitney test); **, p=0.001 ( mvp versus GABAergic, Mann-Whitney test). (d) Quantification of the average number of nuclei that the four clonal clusters occupy. Data are presented as median with interquartile range, and whiskers are the minimum and maximum. n.s., not significant; ****, p< (Mann Whitney test. Details are available in the Supplementary Methods Checklist).
11 Supplementary Figure 7 Validation of the number of excitatory neuron clonal subclusters based on nuclear occupation in the thalamus. Quantification of the Silhouette coefficients with regard to the number of clusters. The red arrow indicates the highest Silhouette coefficient at three clusters.
 Representative 3D projection images of tdtomato-expressing excitatory neuron progeny (red filled circles) generated by OLIG2- positive progenitors in the thalamus.")
12 Supplementary Figure 8 Overlap between the nuclei occupied by the mvp clonal cluster and the nuclei harboring excitatory neuron progeny of OLIG2-positive progenitors in the developing thalamus. (a) Representative 3D projection images of tdtomato-expressing excitatory neuron progeny (red filled circles) generated by OLIG2- positive progenitors in the thalamus. Note that the inhibitory interneurons located in the vlg and TRN, likely derived from OLIG2- positive progenitors in the prethalamus, were not traced. Scale bar: 500 m. (b) Representative confocal images of tdtomatoexpressing excitatory neuron (left), astrocyte (middle), and oligodendrocyte (right) progeny generated by OLIG2-positive thalamic progenitors. High magnification images of the somas (arrows) are shown at the bottom. Broken line circles indicate the nuclei. Scale bars: 10 m and 10 m. (c) Representative nuclear occupation of tdtomato-expressing excitatory neuron progeny (red filled circles) generated by OLIG2-positive progenitors.
 Percentage of labeled neurons in the a (left) and mvp (right) clonal clusters that are located in the anterior or posterior half of VM, RE and RH.")
13 Supplementary Figure 9 Distinct localization and functionality of labeled neurons in VM, RE, and RH between the a and mvp clonal clusters. (a) Percentage of labeled neurons in the a (left) and mvp (right) clonal clusters that are located in the anterior or posterior half of VM, RE and RH. Note that labeled neurons in the a clonal cluster are predominantly located in the anterior part, whereas those in the mvp cluster are mostly located in the posterior part. (b) Distinct functionality of labeled neurons in the a (top) and mvp (bottom) clonal clusters located in VM, RE, and RH. Representative a and mvp cluster clones with corresponding ABA sections with nuclear boundaries are shown to the left. Asterisks indicate labeled neurons located in VM (black area), RE (dark gray area) and RH (light gray area). Gray lines indicate the contours of the thalamic sections where the labeled clones are located and black lines indicate the sections where labeled VM/RE/RH neurons are located. The corresponding cortical projection-based voxel maps of the same regions are shown to the right. Note that the anterior part of VM, RE, and RH predominantly contribute to higher order cognitive functions, whereas the posterior part of VM, RE, and RH mostly contribute to sensory/motor-related activities. TC, thalamocortical.
 and tdtomato (red), and counterstained with DAPI (blue) at E14.")
14 Supplementary Figure 10 Expression of SmoM2-EYFP in MADM-labeled thalamic clones. Representative confocal images of a G 2-X clone labeled at E10, and immunostained for EYFP (green) and tdtomato (red), and counterstained with DAPI (blue) at E14. High magnification images of a tdtomato-expressing RGP in the VZ (broken lines) are shown to the right. Note the membrane expression of SmoM2-EYFP in the tdtomato-expressing RGP (arrows) with an apical endfoot (asterisks), suggesting the successful recombination of both SmoM2-EYFP and MADM11 alleles in the clone. Arrowheads indicate the expression of SmoM2-EYFP in a nearby non-madm-labeled cell, indicating a higher frequency of intra-chromosomal (i.e. SmoM2- EYFP allele) recombination than that of inter-chromosomal (i.e. MADM11 allele) recombination. Broken line circles indicate the somas. Scale bars: 20 m and 10 m.

15 Supplementary Figure 11 Shh signaling does not affect the spatial distribution of thalamic clones in the medial ventral posterior region.
16 (a) Representative 3D reconstructed images of the thalamic hemispheres containing a MADM-labeled clone in the medial ventral/posterior region of the wild type control (top) and SmoM2 (bottom) mice. Note that the clone in the SmoM2 mouse is similarly dispersed radially to that in the control mouse. Scale bar: 500 m. (b) Quantification of the average number of neurons in green/red G 2- X clones labeled at E10 (control, n=23; SmoM2, n=11), E11 (control, n=13; SmoM2, n=10), and E12 (control, n=9; SmoM2, n=3) between the control and SmoM2 mice. Data are presented as median with interquartile range, and whiskers are the minimum and maximum. n.s., not significant. (c) Quantification of the average number of neurons in clones located in the anterior (control, n=9; SmoM2, n=5), medial dorsal (control, n=18; SmoM2, n=6), and medial ventral/posterior (control, n=33; SmoM2, n=21) regions of the P4 control and SmoM2 mice. Data are presented as median with interquartile range, and whiskers are the minimum and maximum. n.s., not significant. (d) Representative in situ hybridization images of the anterior (top) and medial (bottom) section of the control (left) and SmoM2 (right) thalami for ROR. Note the expansion of ROR expression to the anterior region, as well as dorsally, in the SmoM2 thalamus compared to the control. Scale bar: 200 m. (e) NND analysis of MADM-labeled neuronal clones in the SmoM2 thalamus. Note that compared to random datasets simulated 100 times (gray), the cumulative frequency of NND of thalamic neuronal clones (red, n=31) is significantly left-shifted towards shorter distances, indicating a spatial clustering. Data are presented as mean±s.e.m. ****, p p=10 15 (unpaired t test with Welch s correction).

17 Supplementary Figure 12 Shh signaling affects gliogenesis in the thalamus.
18 (a) Quantification of the average number of glial cells in individual clones in the control (left) and SmoM2 (right) thalami (control, n=34; SmoM2, n=24). Data are presented as median with interquartile range, and whiskers are the minimum and maximum. n.s., not significant (Mann Whitney test). (b) Quantification of the number of clones containing neurons only (N) or neurons and glia (N+G) in the wild type control (left) and SmoM2 (right) thalami. Note the increase in the fraction of clones containing glial cells in the SmoM2 thalamus compared to the control. **, p=0.003 ( 2 test). (c) NND analysis of MADM-labeled glial clones in the SmoM2 thalamus. Note that compared to random datasets simulated 100 times (gray), the cumulative frequency of NND of thalamic glial clones (blue, n=14) is significantly left-shifted towards shorter distances, indicating a spatial clustering. Data are presented as mean±s.e.m. ****, p=1x10 15 (unpaired t test with Welch s correction). (d) Schematic representation of lineage-related nuclear formation and functional organization in the thalamus.
Nature Neuroscience doi: /nn Supplementary Figure 1. Characterization of viral injections.
 Supplementary Figure 1 Characterization of viral injections. (a) Dorsal view of a mouse brain (dashed white outline) after receiving a large, unilateral thalamic injection (~100 nl); demonstrating that
File name: Supplementary Information Description: Supplementary Figures, Supplementary Table and Supplementary References
 File name: Supplementary Information Description: Supplementary Figures, Supplementary Table and Supplementary References File name: Supplementary Data 1 Description: Summary datasheets showing the spatial
SUPPLEMENTARY INFORMATION
 SUPPLEMENTARY INFORMATION doi:10.1038/nature11306 Supplementary Figures Supplementary Figure 1. Basic characterization of GFP+ RGLs in the dentate gyrus of adult nestin-gfp mice. a, Sample confocal images
Supplementary Figure 1
 Supplementary Figure 1 Kif1a RNAi effect on basal progenitor differentiation Related to Figure 2. Representative confocal images of the VZ and SVZ of rat cortices transfected at E16 with scrambled or Kif1a
Supplementary Information
 Supplementary Information Title Degeneration and impaired regeneration of gray matter oligodendrocytes in amyotrophic lateral sclerosis Authors Shin H. Kang, Ying Li, Masahiro Fukaya, Ileana Lorenzini,
Supplementary Figure 1. Nature Neuroscience: doi: /nn.4547
 Supplementary Figure 1 Characterization of the Microfetti mouse model. (a) Gating strategy for 8-color flow analysis of peripheral Ly-6C + monocytes from Microfetti mice 5-7 days after TAM treatment. Living
Nature Neuroscience: doi: /nn Supplementary Figure 1. Distribution of starter cells for RV-mediated retrograde tracing.
 Supplementary Figure 1 Distribution of starter cells for RV-mediated retrograde tracing. Parcellation of cortical areas is based on Allen Mouse Brain Atlas and drawn to scale. Thick white curves, outlines
Nature Neuroscience: doi: /nn Supplementary Figure 1
 Supplementary Figure 1 Atlas representations of the midcingulate (MCC) region targeted in this study compared against the anterior cingulate (ACC) region commonly reported. Coronal sections are shown on
Prss56, a novel marker of adult neurogenesis in the mouse brain. - Supplemental Figures 1 to 5- Brain Structure and Function
 Prss56, a novel marker of adult neurogenesis in the mouse brain - Supplemental Figures 1 to 5- Brain Structure and Function Alexandre Jourdon 1,2, Aurélie Gresset 1, Nathalie Spassky 1, Patrick Charnay
Supplementary Figure S1: Tanycytes are restricted to the central/posterior hypothalamus
 Supplementary Figure S1: Tanycytes are restricted to the central/posterior hypothalamus a: Expression of Vimentin, GFAP, Sox2 and Nestin in anterior, central and posterior hypothalamus. In the anterior
Supplementary Figure 1: Signaling centers contain few proliferating cells, express p21, and
 Supplementary Figure 1: Signaling centers contain few proliferating cells, express p21, and exclude YAP from the nucleus. (a) Schematic diagram of an E10.5 mouse embryo. (b,c) Sections at B and C in (a)
Supplementary Figure 1 Information on transgenic mouse models and their recording and optogenetic equipment. (a) 108 (b-c) (d) (e) (f) (g)
 108 (b-c) (d) (e) (f) (g)") Supplementary Figure 1 Information on transgenic mouse models and their recording and optogenetic equipment. (a) In four mice, cre-dependent expression of the hyperpolarizing opsin Arch in pyramidal cells
Supplementary Figure 1 Information on transgenic mouse models and their recording and optogenetic equipment. (a) In four mice, cre-dependent expression of the hyperpolarizing opsin Arch in pyramidal cells
Supplemental Figure 1. Intracranial transduction of a modified ptomo lentiviral vector in the mouse
 Supplemental figure legends Supplemental Figure 1. Intracranial transduction of a modified ptomo lentiviral vector in the mouse hippocampus targets GFAP-positive but not NeuN-positive cells. (A) Stereotaxic
Supplementary figure 1: LII/III GIN-cells show morphological characteristics of MC
 1 2 1 3 Supplementary figure 1: LII/III GIN-cells show morphological characteristics of MC 4 5 6 7 (a) Reconstructions of LII/III GIN-cells with somato-dendritic compartments in orange and axonal arborizations
Nature Neuroscience: doi: /nn Supplementary Figure 1. Diverse anorexigenic signals induce c-fos expression in CEl PKC-δ + neurons
 Supplementary Figure 1 Diverse anorexigenic signals induce c-fos expression in CEl PKC-δ + neurons a-c. Quantification of CEl c-fos expression in mice intraperitoneal injected with anorexigenic drugs (a),
SUPPLEMENTARY FIG. S2. Representative counting fields used in quantification of the in vitro neural differentiation of pattern of dnscs.
 Supplementary Data SUPPLEMENTARY FIG. S1. Representative counting fields used in quantification of the in vitro neural differentiation of pattern of anpcs. A panel of lineage-specific markers were used
A new subtype of progenitor cell in the mouse embryonic neocortex. Xiaoqun Wang, Jin-Wu Tsai, Bridget LaMonica & Arnold R.
 A new subtype of progenitor cell in the mouse embryonic neocortex Xiaoqun Wang, Jin-Wu Tsai, Bridget LaMonica & Arnold R. Kriegstein Supplementary Figures 1-6: Supplementary Movies 1-9: Supplementary
Tuning properties of individual circuit components and stimulus-specificity of experience-driven changes.
 Supplementary Figure 1 Tuning properties of individual circuit components and stimulus-specificity of experience-driven changes. (a) Left, circuit schematic with the imaged component (L2/3 excitatory neurons)
Neurodevelopment II Structure Formation. Reading: BCP Chapter 23
 Neurodevelopment II Structure Formation Reading: BCP Chapter 23 Phases of Development Ovum + Sperm = Zygote Cell division (multiplication) Neurogenesis Induction of the neural plate Neural proliferation
Supplementary Figure 1: Expression of Gli1-lacZ in E17.5 ovary and mesonephros. a,
 Supplementary Figure 1: Expression of Gli1-lacZ in E17.5 ovary and mesonephros. a, Transverse sections of E17.5 ovary and mesonephros from Gli1-LacZ reporter embryos (n=3) after LacZ staining (blue). The
Ophthalmology, Radiation Oncology,
 Supporting Online Material Journal: Nature Neuroscience Article Title: Corresponding Author: All Authors: Affiliations: Tanycytes of the Hypothalamic Median Eminence Form a Diet- Responsive Neurogenic
Supplementary Figure 1. ACE robotic platform. A. Overview of the rig setup showing major hardware components of ACE (Automatic single Cell
 2 Supplementary Figure 1. ACE robotic platform. A. Overview of the rig setup showing major hardware components of ACE (Automatic single Cell Experimenter) including the MultiClamp 700B, Digidata 1440A,
In vivo reprogramming reactive glia into ipscs to produce new neurons in the
 In vivo reprogramming reactive glia into ipscs to produce new neurons in the cortex following traumatic brain injury Xiang Gao 1, Xiaoting Wang 1, Wenhui Xiong 1, Jinhui Chen 1, * 1 Spinal Cord and Brain
Nature Neuroscience: doi: /nn Supplementary Figure 1. Large-scale calcium imaging in vivo.
 Supplementary Figure 1 Large-scale calcium imaging in vivo. (a) Schematic illustration of the in vivo camera imaging set-up for large-scale calcium imaging. (b) High-magnification two-photon image from
Nature Neuroscience: doi: /nn Supplementary Figure 1. Behavioral training.
 Supplementary Figure 1 Behavioral training. a, Mazes used for behavioral training. Asterisks indicate reward location. Only some example mazes are shown (for example, right choice and not left choice maze
Hormonal gain control of a medial preoptic area social reward circuit
 CORRECTION NOTICE Nat. Neurosci. 20, 449 458 (2017) Hormonal gain control of a medial preoptic area social reward circuit Jenna A McHenry, James M Otis, Mark A Rossi, J Elliott Robinson, Oksana Kosyk,
Supplemental Information. A Visual-Cue-Dependent Memory Circuit. for Place Navigation
 Neuron, Volume 99 Supplemental Information A Visual-Cue-Dependent Memory Circuit for Place Navigation Han Qin, Ling Fu, Bo Hu, Xiang Liao, Jian Lu, Wenjing He, Shanshan Liang, Kuan Zhang, Ruijie Li, Jiwei
Supplemental Information. Myocardial Polyploidization Creates a Barrier. to Heart Regeneration in Zebrafish
 Developmental Cell, Volume 44 Supplemental Information Myocardial Polyploidization Creates a Barrier to Heart Regeneration in Zebrafish Juan Manuel González-Rosa, Michka Sharpe, Dorothy Field, Mark H.
Nature Neuroscience: doi: /nn Supplementary Figure 1. Splenic atrophy and leucopenia caused by T3 SCI.
 Supplementary Figure 1 Splenic atrophy and leucopenia caused by T3 SCI. (a) Gross anatomy of representative spleens from control and T3 SCI mice at 28 days post-injury. (b and c) Hematoxylin and eosin
Supplementary Figure 1. Chimeric analysis of inner ears. (A-H) Chimeric inner ears with fluorescent ES cells and (I,J) Rainbow inner ears.
 Chimeric inner ears with fluorescent ES cells and (I,J) Rainbow inner ears.") Supplementary Figure 1. himeric analysis of inner ears. (A-H) himeric inner ears with fluorescent ES cells and (I,J) Rainbow inner ears. (A,B) omposite images showing three colors in different vestibular
Supplementary Figure 1. himeric analysis of inner ears. (A-H) himeric inner ears with fluorescent ES cells and (I,J) Rainbow inner ears. (A,B) omposite images showing three colors in different vestibular
Nature Neuroscience: doi: /nn Supplementary Figure 1. Trial structure for go/no-go behavior
 Supplementary Figure 1 Trial structure for go/no-go behavior a, Overall timeline of experiments. Day 1: A1 mapping, injection of AAV1-SYN-GCAMP6s, cranial window and headpost implantation. Water restriction
Supplementary Figures
 Supplementary Figures Supplementary Figure 1. nrg1 bns101/bns101 embryos develop a functional heart and survive to adulthood (a-b) Cartoon of Talen-induced nrg1 mutation with a 14-base-pair deletion in
Nature Neuroscience: doi: /nn.4642
 Supplementary Figure 1 Recording sites and example waveform clustering, as well as electrophysiological recordings of auditory CS and shock processing following overtraining. (a) Recording sites in LC
Supplementary Materials for
 www.sciencetranslationalmedicine.org/cgi/content/full/4/117/117ra8/dc1 Supplementary Materials for Notch4 Normalization Reduces Blood Vessel Size in Arteriovenous Malformations Patrick A. Murphy, Tyson
Supplemental Information. Otic Mesenchyme Cells Regulate. Spiral Ganglion Axon Fasciculation. through a Pou3f4/EphA4 Signaling Pathway
 Neuron, Volume 73 Supplemental Information Otic Mesenchyme Cells Regulate Spiral Ganglion Axon Fasciculation through a Pou3f4/EphA4 Signaling Pathway Thomas M. Coate, Steven Raft, Xiumei Zhao, Aimee K.
mm Distance (mm)
") b a Magnet Illumination Coverslips MPs Objective 2575 µm 1875 µm 1575 µm 1075 µm 875 µm 545 µm 20µm 2 3 0.5 0.3mm 1 1000 100 10 1 0.1 1000 100 10 1 0.1 Field Induction (Gauss) 1.5 0 5 10 15 20 Distance
b a Magnet Illumination Coverslips MPs Objective 2575 µm 1875 µm 1575 µm 1075 µm 875 µm 545 µm 20µm 2 3 0.5 0.3mm 1 1000 100 10 1 0.1 1000 100 10 1 0.1 Field Induction (Gauss) 1.5 0 5 10 15 20 Distance
mir-7a regulation of Pax6 in neural stem cells controls the spatial origin of forebrain dopaminergic neurons
 Supplemental Material mir-7a regulation of Pax6 in neural stem cells controls the spatial origin of forebrain dopaminergic neurons Antoine de Chevigny, Nathalie Coré, Philipp Follert, Marion Gaudin, Pascal
SUPPLEMENTARY INFORMATION
 doi:1.138/nature1139 a d Whisker angle (deg) Whisking repeatability Control Muscimol.4.3.2.1 -.1 8 4-4 1 2 3 4 Performance (d') Pole 8 4-4 1 2 3 4 5 Time (s) b Mean protraction angle (deg) e Hit rate (p
Nature Neuroscience: doi: /nn Supplementary Figure 1. Lick response during the delayed Go versus No-Go task.
 Supplementary Figure 1 Lick response during the delayed Go versus No-Go task. Trial-averaged lick rate was averaged across all mice used for pyramidal cell imaging (n = 9). Different colors denote different
Shh signaling guides spatial pathfinding of raphespinal tract axons by multidirectional repulsion
 ORIGINAL ARTICLE Cell Research (2012) 22:697-716. 2012 IBCB, SIBS, CAS All rights reserved 1001-0602/12 $ 32.00 www.nature.com/cr npg Shh signaling guides spatial pathfinding of raphespinal tract axons
Diabetic pdx1-mutant zebrafish show conserved responses to nutrient overload and anti-glycemic treatment
 Supplementary Information Diabetic pdx1-mutant zebrafish show conserved responses to nutrient overload and anti-glycemic treatment Robin A. Kimmel, Stefan Dobler, Nicole Schmitner, Tanja Walsen, Julia
Nature Neuroscience: doi: /nn Supplementary Figure 1. Iliopsoas and quadratus lumborum motor neurons in the L2 spinal segment.
 Supplementary Figure 1 Iliopsoas and quadratus lumborum motor neurons in the L2 spinal segment. (A) IL and QL motor neurons were labeled after CTb-488 (green) muscle injections at birth. At P4, the L2
NG2 + CNS Glial Progenitors Remain Committed to the Oligodendrocyte Lineage in Postnatal Life and following Neurodegeneration
 Article NG2 + CNS Glial Progenitors Remain Committed to the Oligodendrocyte Lineage in Postnatal Life and following Neurodegeneration Shin H. Kang, 1 Masahiro Fukaya, 2,4 Jason K. Yang, 1 Jeffrey D. Rothstein,
Broad Integration of Expression Maps and Co-Expression Networks Compassing Novel Gene Functions in the Brain
 Supplementary Information Broad Integration of Expression Maps and Co-Expression Networks Compassing Novel Gene Functions in the Brain Yuko Okamura-Oho a, b, *, Kazuro Shimokawa c, Masaomi Nishimura b,
Supplementary Figure 1
 8w Pia II/III IV V VI PV EYFP EYFP PV EYFP PV d PV EYFP Supplementary Figure a Spike probability x - PV-Cre d Spike probability x - RS RS b e Spike probability Spike probability.6......8..... FS FS c f
Nature Neuroscience: doi: /nn Supplementary Figure 1
 Supplementary Figure 1 Reward rate affects the decision to begin work. (a) Latency distributions are bimodal, and depend on reward rate. Very short latencies (early peak) preferentially occur when a greater
Supplementary Figure 1. Genotyping strategies for Mcm3 +/+, Mcm3 +/Lox and Mcm3 +/- mice and luciferase activity in Mcm3 +/Lox mice. A.
 Supplementary Figure 1. Genotyping strategies for Mcm3 +/+, Mcm3 +/Lox and Mcm3 +/- mice and luciferase activity in Mcm3 +/Lox mice. A. Upper part, three-primer PCR strategy at the Mcm3 locus yielding
Supplementary information. Nkx2.1 regulates the generation of telencephalic astrocytes during embryonic
 Supplementary information Nkx2.1 regulates the generation of telencephalic astrocytes during embryonic development Shilpi Minocha 1*, Delphine Valloton 1*, Yvan Arsenijevic 2, Jean-René Cardinaux 3, Raffaella
OSVZ progenitors of human and ferret neocortex are epithelial-like and
 OSVZ progenitors of human and ferret neocortex are epithelial-like and expand by integrin signaling Simone A Fietz, Iva Kelava, Johannes Vogt, Michaela Wilsch-Bräuninger, Denise Stenzel, Jennifer L Fish,
SUPPLEMENTARY FIGURES
 SUPPLEMENTARY FIGURES 1 Supplementary Figure 1, Adult hippocampal QNPs and TAPs uniformly express REST a-b) Confocal images of adult hippocampal mouse sections showing GFAP (green), Sox2 (red), and REST
Supplementary Information
 Supplementary Information Astrocytes regulate adult hippocampal neurogenesis through ephrin-b signaling Randolph S. Ashton, Anthony Conway, Chinmay Pangarkar, Jamie Bergen, Kwang-Il Lim, Priya Shah, Mina
Nature Methods: doi: /nmeth Supplementary Figure 1. Activity in turtle dorsal cortex is sparse.
 Supplementary Figure 1 Activity in turtle dorsal cortex is sparse. a. Probability distribution of firing rates across the population (notice log scale) in our data. The range of firing rates is wide but
Supplementary Table I Blood pressure and heart rate measurements pre- and post-stroke
 SUPPLEMENTARY INFORMATION doi:10.1038/nature09511 Supplementary Table I Blood pressure and heart rate measurements pre- and post-stroke Pre Post 7-days Systolic Diastolic BPM Systolic Diastolic BPM Systolic
a 0,8 Figure S1 8 h 12 h y = 0,036x + 0,2115 y = 0,0366x + 0,206 Labeling index Labeling index ctrl shrna Time (h) Time (h) ctrl shrna S G2 M G1
 Time (h) ctrl shrna S G2 M G1") (GFP+ BrdU+)/GFP+ Labeling index Labeling index Figure S a, b, y =,x +, y =,x +,,,,,,,, Time (h) - - Time (h) c d S G M G h M G S G M G S G h Time of BrdU injection after electroporation (h) M G S G M
(GFP+ BrdU+)/GFP+ Labeling index Labeling index Figure S a, b, y =,x +, y =,x +,,,,,,,, Time (h) - - Time (h) c d S G M G h M G S G M G S G h Time of BrdU injection after electroporation (h) M G S G M
SUPPLEMENTARY INFORMATION
 b 350 300 250 200 150 100 50 0 E0 E10 E50 E0 E10 E50 E0 E10 E50 E0 E10 E50 Number of organoids per well 350 300 250 200 150 100 50 0 R0 R50 R100 R500 1st 2nd 3rd Noggin 100 ng/ml Noggin 10 ng/ml Noggin
ROCK/Cdc42-mediated microglial motility and gliapse formation lead to phagocytosis of degenerating dopaminergic neurons in vivo
 Supplementary Information ROCK/Cdc42-mediated microglial motility and gliapse formation lead to phagocytosis of degenerating dopaminergic neurons in vivo Carlos Barcia* 1,2, Carmen M Ros 1,2, Valentina
Supplementary Figure 1. SDS-FRL localization of CB 1 in the distal CA3 area of the rat hippocampus. (a-d) Axon terminals (t) in stratum pyramidale
 Axon terminals (t) in stratum pyramidale") Supplementary Figure 1. SDS-FRL localization of CB 1 in the distal CA3 area of the rat hippocampus. (a-d) Axon terminals (t) in stratum pyramidale (b) show stronger immunolabeling for CB 1 than those in
Supplementary Figure 1. SDS-FRL localization of CB 1 in the distal CA3 area of the rat hippocampus. (a-d) Axon terminals (t) in stratum pyramidale (b) show stronger immunolabeling for CB 1 than those in
Supplementary Information
 1 Supplementary Information A role for primary cilia in glutamatergic synaptic integration of adult-orn neurons Natsuko Kumamoto 1,4,5, Yan Gu 1,4, Jia Wang 1,4, Stephen Janoschka 1,2, Ken-Ichi Takemaru
Suppl. Information Supplementary Figure 1. Strategy/latency analysis of individual mice during maze learning. a,
 Goal-oriented searching mediated by ventral hippocampus early in trial-and-error learning Ruediger, S, Spirig, D., Donato, F., Caroni, P. Suppl. Information Supplementary Figure 1. Strategy/latency analysis
SUPPLEMENTAL INFORMATION FOR. PAX7 expression defines germline stem cells in the adult testis
 SUPPLEMENTAL INFORMATION FOR PAX7 expression defines germline stem cells in the adult testis Gina M. Aloisio, Yuji Nakada, Hatice D. Saatcioglu, Christopher G. Peña, Michael D. Baker, Edward D. Tarnawa,
Primary Mouse Cerebral Cortex Neurons V: 80% TE: 70%
 Primary Mouse Cerebral Cortex Neurons V: 80% TE: 70% Pictures: 9 days after electroporation Red: MAP2 Blue: GFAP Green: GFP The cells were from Embryonic Day 14 Mouse Cerebral Cortex Primary Mouse Hippocampal
Brain anatomy and artificial intelligence. L. Andrew Coward Australian National University, Canberra, ACT 0200, Australia
 Brain anatomy and artificial intelligence L. Andrew Coward Australian National University, Canberra, ACT 0200, Australia The Fourth Conference on Artificial General Intelligence August 2011 Architectures
Supplementary Figure 1
 Supplementary Figure 1 Global TeNT expression effectively impairs synaptic transmission. Injection of 100 pg tent mrna leads to a reduction of vesicle mediated synaptic transmission in the spinal cord
A Cxcl12-Cxcr4 Chemokine Signaling Pathway Defines
 Supplemental Data A Cxcl12-Cxcr4 Chemokine Signaling Pathway Defines the Initial Trajectory of Mammalian Motor Axons Ivo Lieberam, Dritan Agalliu, Takashi Nagasawa, Johan Ericson, and Thomas M. Jessell
Structural basis for the role of inhibition in facilitating adult brain plasticity
 Structural basis for the role of inhibition in facilitating adult brain plasticity Jerry L. Chen, Walter C. Lin, Jae Won Cha, Peter T. So, Yoshiyuki Kubota & Elly Nedivi SUPPLEMENTARY FIGURES 1-6 a b M
Conserved properties of dentate gyrus neurogenesis across postnatal development revealed by single-cell RNA sequencing
 SUPPLEMENTARY INFORMATION Resource https://doi.org/10.1038/s41593-017-0056-2 In the format provided by the authors and unedited. Conserved properties of dentate gyrus neurogenesis across postnatal development
a) Primary cultures derived from the pancreas of an 11-week-old Pdx1-Cre; K-MADM-p53
 Primary cultures derived from the pancreas of an 11-week-old Pdx1-Cre; K-MADM-p53") 1 2 3 4 5 6 7 8 9 10 Supplementary Figure 1. Induction of p53 LOH by MADM. a) Primary cultures derived from the pancreas of an 11-week-old Pdx1-Cre; K-MADM-p53 mouse revealed increased p53 KO/KO (green,
1 2 3 4 5 6 7 8 9 10 Supplementary Figure 1. Induction of p53 LOH by MADM. a) Primary cultures derived from the pancreas of an 11-week-old Pdx1-Cre; K-MADM-p53 mouse revealed increased p53 KO/KO (green,
Nature Neuroscience: doi: /nn Supplementary Figure 1
 Supplementary Figure 1 Distribution of GlyT2::eGFP fibers in the mouse thalamus at three different coronal levels. Note the innervation centered in the rostral (CL, PC) and caudal (PF) nuclear groups of
Zhu et al, page 1. Supplementary Figures
 Zhu et al, page 1 Supplementary Figures Supplementary Figure 1: Visual behavior and avoidance behavioral response in EPM trials. (a) Measures of visual behavior that performed the light avoidance behavior
Supplemental Figure 1. Quantification of proliferation in thyroid of WT, Ctns -/- and grafted
 Supplemental Figure 1. Quantification of proliferation in thyroid of WT, Ctns -/- and grafted Ctns -/- mice. Cells immunolabeled for the proliferation marker (Ki-67) were counted in sections (n=3 WT, n=4
SUPPLEMENTARY INFORMATION
 Suppl. Fig. 1 in vivo expression of ISL1 in the human fetal heart. a, Hematoxylin eosin staining showing structures of left atrium and left atrium appendage (*) of a human fetal heart at 11 weeks of gestation.
Neocortex Zbtb20 / NFIA / Sox9
 Neocortex / NFIA / Sox9 Supplementary Figure 1. Expression of, NFIA, and Sox9 in the mouse neocortex at. The lower panels are higher magnification views of the oxed area. Arrowheads indicate triple-positive
Cellular components of CNS
 Cellular components of CNS Cellular components of CNS Neurons Glial cells: Astrocytes (including radial glia), oligodendrocytes, microglia, ependymal cells Epithelial cells of choroid plexus Endothelial
SUPPLEMENTARY INFORMATION
 doi: 10.1038/nature06310 SUPPLEMENTARY INFORMATION www.nature.com/nature 1 www.nature.com/nature 2 www.nature.com/nature 3 Supplementary Figure S1 Spontaneous duration of wake, SWS and REM sleep (expressed
Neocortex. Cortical Structures in the Brain. Neocortex Facts. Laminar Organization. Bark-like (cortical) structures: Shepherd (2004) Chapter 12
 structures: Shepherd (2004) Chapter 12") Neocortex Shepherd (2004) Chapter 12 Rodney Douglas, Henry Markram, and Kevan Martin Instructor: Yoonsuck Choe; CPSC 644 Cortical Networks Cortical Structures in the Brain Bark-like (cortical) structures:
Neocortex Shepherd (2004) Chapter 12 Rodney Douglas, Henry Markram, and Kevan Martin Instructor: Yoonsuck Choe; CPSC 644 Cortical Networks Cortical Structures in the Brain Bark-like (cortical) structures:
SUPPLEMENTARY INFORMATION
 SUPPLEMENTARY INFORMATION Human cerebral cortex development from pluripotent stem cells to functional excitatory synapses Yichen Shi 1,2, Peter Kirwan 1,2, James Smith 1,2, Hugh P.C. Robinson 3 and Frederick
Supplementary Figure 1
 Supplementary Figure 1 Genetic labeling of microglia Male and female 2-3 month-old CreERT2;R26-tdTomato mice or CreERT2;R26-tdTomato;Iba1-eGFP transgenic mice were treated with 1x, 2x (48 h apart), or
ErbB4 migrazione II parte
 ErbB4 migrazione II parte Control SVZ cells prefer to migrate on the NRG1 type III substrate the substrate preference of the neuroblasts migrating out of the SVZ explant was evaluated SVZ cells had a strong
Supplementary Figure 1.TRIM33 binds β-catenin in the nucleus. a & b, Co-IP of endogenous TRIM33 with β-catenin in HT-29 cells (a) and HEK 293T cells
 and HEK 293T cells") Supplementary Figure 1.TRIM33 binds β-catenin in the nucleus. a & b, Co-IP of endogenous TRIM33 with β-catenin in HT-29 cells (a) and HEK 293T cells (b). TRIM33 was immunoprecipitated, and the amount of
Supplementary Figure 1.TRIM33 binds β-catenin in the nucleus. a & b, Co-IP of endogenous TRIM33 with β-catenin in HT-29 cells (a) and HEK 293T cells (b). TRIM33 was immunoprecipitated, and the amount of
SUPPLEMENTARY INFORMATION
 doi:10.1038/nature10188 Supplementary Figure 1. Embryonic epicardial genes are down-regulated from midgestation stages and barely detectable post-natally. Real time qrt-pcr revealed a significant down-regulation
Supplementary Figure 1
 Supplementary Figure 1 The average sigmoid parametric curves of capillary dilation time courses and average time to 50% peak capillary diameter dilation computed from individual capillary responses averaged
glial cells missing and gcm2 Cell-autonomously Regulate Both Glial and Neuronal
 glial cells missing and gcm2 Cell-autonomously Regulate Both Glial and Neuronal Development in the Visual System of Drosophila Carole Chotard, Wendy Leung and Iris Salecker Supplemental Data Supplemental
Postn MCM Smad2 fl/fl Postn MCM Smad3 fl/fl Postn MCM Smad2/3 fl/fl. Postn MCM. Tgfbr1/2 fl/fl TAC
 A Smad2 fl/fl Smad3 fl/fl Smad2/3 fl/fl Tgfbr1/2 fl/fl 1. mm B Tcf21 MCM Tcf21 MCM Smad3 fl/fl Tcf21 MCM Smad2/3 fl/fl Tcf21 MCM Tgfbr1/2 fl/fl αmhc MCM C 1. mm 1. mm D Smad2 fl/fl Smad3 fl/fl Smad2/3
Nature Neuroscience: doi: /nn Supplementary Figure 1
 Supplementary Figure 1 Quantification of myelin fragments in the aging brain (a) Electron microscopy on corpus callosum is shown for a 18-month-old wild type mice. Myelin fragments (arrows) were detected
Cell Birth and Death. Chapter Three
 Cell Birth and Death Chapter Three Neurogenesis All neurons and glial cells begin in the neural tube Differentiated into neurons rather than ectoderm based on factors we have already discussed If these
Genesis of cerebellar interneurons and the prevention of neural DNA damage require XRCC1.
 Genesis of cerebellar interneurons and the prevention of neural DNA damage require XRCC1. Youngsoo Lee, Sachin Katyal, Yang Li, Sherif F. El-Khamisy, Helen R. Russell, Keith W. Caldecott and Peter J. McKinnon.
Supplementary Figure 1 Expression of Crb3 in mouse sciatic nerve: biochemical analysis (a) Schematic of Crb3 isoforms, ERLI and CLPI, indicating the
 Schematic of Crb3 isoforms, ERLI and CLPI, indicating the") Supplementary Figure 1 Expression of Crb3 in mouse sciatic nerve: biochemical analysis (a) Schematic of Crb3 isoforms, ERLI and CLPI, indicating the location of the transmembrane (TM), FRM binding (FB)
Supplementary Figure 1 Expression of Crb3 in mouse sciatic nerve: biochemical analysis (a) Schematic of Crb3 isoforms, ERLI and CLPI, indicating the location of the transmembrane (TM), FRM binding (FB)
Nature Neuroscience: doi: /nn Supplementary Figure 1
 Supplementary Figure 1 Subcellular segregation of VGluT2-IR and TH-IR within the same VGluT2-TH axon (wild type rats). (a-e) Serial sections of a dual VGluT2-TH labeled axon. This axon (blue outline) has
Quantification of early stage lesions for loss of p53 should be shown in the main figures.
 Reviewer #1 (Remarks to the Author): Expert in prostate cancer The manuscript "Clonal dynamics following p53 loss of heterozygosity in Kras-driven cancers" uses a number of novel genetically engineered
Tangential migration of neurons in the developing cerebral cortex
 Development 121, 2165-2176 (1995) Printed in Great Britain The Company of Biologists Limited 1995 2165 Tangential migration of neurons in the developing cerebral cortex Nancy A. O Rourke*, Daniel P. Sullivan,
GFP/Iba1/GFAP. Brain. Liver. Kidney. Lung. Hoechst/Iba1/TLR9!
 Supplementary information a +KA Relative expression d! Tlr9 5!! 5! NSC Neuron Astrocyte Microglia! 5! Tlr7!!!! NSC Neuron Astrocyte! GFP/Sβ/! Iba/Hoechst Microglia e Hoechst/Iba/TLR9! GFP/Iba/GFAP f Brain
T H E J O U R N A L O F C E L L B I O L O G Y
 Supplemental material Brooks and Wallingford, http://www.jcb.org/cgi/content/full/jcb.201204072/dc1 T H E J O U R N A L O F C E L L B I O L O G Y Figure S1. Quantification of ciliary compartments in control
Nature Neuroscience: doi: /nn Supplementary Figure 1
 Supplementary Figure 1 Drd1a-Cre driven ChR2 expression in the SCN. (a) Low-magnification image of a representative Drd1a-ChR2 coronal brain section (n = 2) showing endogenous tdtomato fluorescence (magenta).
Santulli G. et al. A microrna-based strategy to suppress restenosis while preserving endothelial function
 ONLINE DATA SUPPLEMENTS Santulli G. et al. A microrna-based strategy to suppress restenosis while preserving endothelial function Supplementary Figures Figure S1 Effect of Ad-p27-126TS on the expression
Nature Immunology: doi: /ni Supplementary Figure 1. DNA-methylation machinery is essential for silencing of Cd4 in cytotoxic T cells.
 Supplementary Figure 1 DNA-methylation machinery is essential for silencing of Cd4 in cytotoxic T cells. (a) Scheme for the retroviral shrna screen. (b) Histogram showing CD4 expression (MFI) in WT cytotoxic
Supplementary Materials
 Supplementary Materials Fig. S1. Weights of full-dose treatment groups comparing 1 st, 2 nd, and 3 rd generation gene replacement therapy. Mice were treated at p1 with 4x10 11 GC of the three different
Supplementary Information
 Supplementary Information D-Serine regulates cerebellar LTD and motor coordination through the 2 glutamate receptor Wataru Kakegawa, Yurika Miyoshi, Kenji Hamase, Shinji Matsuda, Keiko Matsuda, Kazuhisa
Unique functional properties of somatostatin-expressing GABAergic neurons in mouse barrel cortex
 Supplementary Information Unique functional properties of somatostatin-expressing GABAergic neurons in mouse barrel cortex Luc Gentet, Yves Kremer, Hiroki Taniguchi, Josh Huang, Jochen Staiger and Carl
Supplemental Information. Dorsal Raphe Dual Serotonin-Glutamate Neurons. Drive Reward by Establishing Excitatory Synapses
 Cell Reports, Volume 26 Supplemental Information Dorsal Raphe Dual Serotonin-Glutamate Neurons Drive Reward by Establishing Excitatory Synapses on VTA Mesoaccumbens Dopamine Neurons Hui-Ling Wang, Shiliang
SUPPLEMENTARY INFORMATION. Otx2 controls neuron subtype identity in ventral tegmental area and antagonizes
 Di Salvio et al. 1 SUPPLEMENTARY INFORMATION Otx2 controls neuron subtype identity in ventral tegmental area and antagonizes vulnerability to MPTP Michela Di Salvio, Luca Giovanni Di Giovannantonio, Dario